Study on the ground fraction of air tankers
Yin Gu A , Rui Zhou
  A * , Hui Xie B and Lei Shi B
A Institute of Public Safety Research, Department of Engineering Physics, Tsinghua University, Beijing, 100084, China.
B AVIC General Huanan Aircraft Industry Co., Ltd., Zhuhai, 519040, China.
International Journal of Wildland Fire 32(4) 576-592 https://doi.org/10.1071/WF22055
Submitted: 5 November 2021 Accepted: 11 December 2022 Published: 19 January 2023
© 2023 The Author(s) (or their employer(s)). Published by CSIRO Publishing on behalf of IAWF. This is an open access article distributed under the Creative Commons Attribution-NonCommercial-NoDerivatives 4.0 International License (CC BY-NC-ND)
Abstract
Background: The ground fraction refers to the ratio of the liquid collected on the ground to the dropped liquid, which is the key index used to assess the drop ground pattern of air tankers when combating wildfires. However, there is no quantitative mechanism model to estimate ground fraction.
Aims and methods: The current work aims to create a simple model of the ground fraction by directly using full-scale drop test data with different firefighting agents for fitting.
Key results and conclusions: The result shows that the ground fraction can be estimated by simple quantitative relationships despite significant differences between the conditions of the drop tests. These relationships include factors that can be manipulated during aircraft and release system design as well as during aerial firefighting operations.
Implications: Based on the presented model, an equation for the maximum coverage level of the mean liquid distribution is solved, and the induced effects of drop velocity, drop height, liquid viscosity and other factors on the ground pattern are revealed, which can provide direct predictions of ground drop distributions.
Keywords: aerial firefighting, air tanker, coverage level, data fitting, dimensional analysis, fire retardant, full-scale drop test, ground fraction, ground pattern.
Introduction
Recently, climate change has exacerbated the overall impact of wildfires, and the average scale of wildfires in many regions of the world is increasing (Artés et al. 2019; Paudel 2021). This has caused widespread concerns due to their socioeconomic and environmental effects, such as extremely severe casualties, economic losses and environmental damage (Moritz et al. 2014; Santín and Doerr 2016). Aircraft can provide valuable assistance in the containment and extinguishment of wildfires (McCarthy et al. 2012; Stonesifer et al. 2016). According to previous studies (Plucinski et al. 2012, 2017; Plucinski and Pastor 2013), forest firefighting aircraft generally accomplish wildfire suppression work by dropping water or chemical retardants directly on flames or to coat fuels around the fire edge to reduce flame dimensions or slow their spread rate.
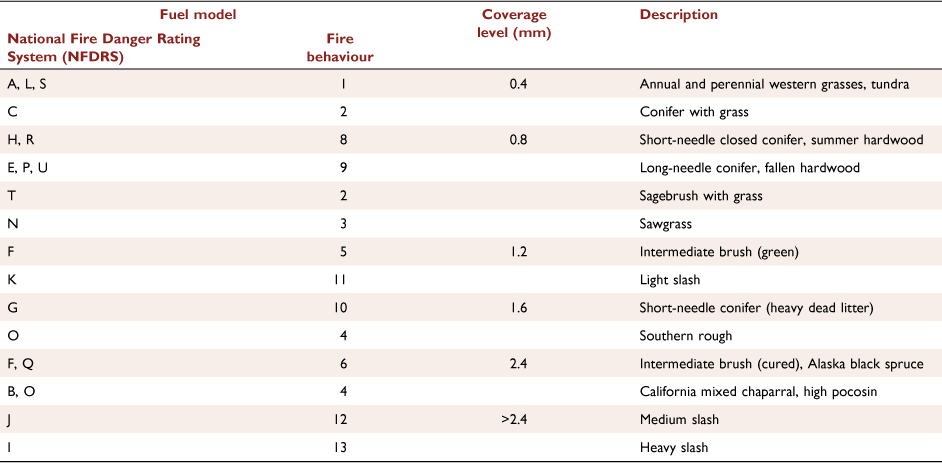
Aerial suppression is widely reported to be expensive (Plucinski and Pastor 2013; Thompson et al. 2013). The evaluation of the effectiveness of aerial firefighting drops can be used to appraise operational tactics to help determine cost effectiveness (Plucinski and Pastor 2013). Drop ground patterns are indispensable information for evaluating the effectiveness of drops (Plucinski and Pastor 2013). Therefore, many developed countries use the cup-and-grid method proposed by Suter (2000, 2002) to compare drop ground patterns from different aircraft, delivery systems and flight conditions in areas cleared of vegetation and free of fire. This determines the coverage level that can be achieved with different forest firefighting aircraft. In combination with the Operational Retardant Effectiveness (ORE) project’s development of guidelines for safe and effective retardant application (George and Johnson 1990) and recommended retardant coverage levels for different vegetation types (George 1985), as shown in Table 1, the corresponding relationship between coverage level and fire behaviour can be determined.
|
Ground patterns (including length, width and coverage distribution) were proved by Legendre et al. (2014) to be related to the delivery system, flight velocity, wind speed, wind direction and other factors. Based on previous experimental results, they proposed a simple model for ground patterns and pointed out that the ground fraction, defined as the ‘fraction of the drop liquid that effectively contributes to the ground pattern’, is the key parameter required when calculating ground pattern (Legendre et al. 2014). Additionally, they also noted that a ground fraction model will be an important development in the future (Legendre et al. 2014). However, the modelling of ground fraction requires information about the coupling between various mechanisms at the droplet scale: the dispersion, evaporation, atomisation processes of droplets and the final droplet distribution (Rimbert and Séro-Guillaume 2004). To date, a ground fraction model has not been published.
In this paper, we strive to establish the relationship between the ground fraction and related factors based on the work of Legendre et al. (2014). First, full-scale drop test data for different firefighting agents were collected, and the ground fractions of all tests were estimated using the proposed method. Then, by combining the theoretical analysis and dimensional analysis method, a simple model relating the ground fraction to factors such as the drop height, drop velocity, average flow rate, dropped volume, liquid density, and liquid viscosity, was established. Finally, the simple model was used to solve an equation for the maximum coverage level of the mean liquid distribution under conditions of constant flow rate, and the induced effects of drop velocity, drop height, liquid viscosity and other factors on the ground pattern are revealed.
Data
In this section, 51 groups of full-scale drop tests for different firefighting agents are considered. Among these, 45 groups of drop test data were obtained from published technical reports, and the other six groups were obtained from our full-scale water drop tests.
Drop test data of aircraft based on literature research
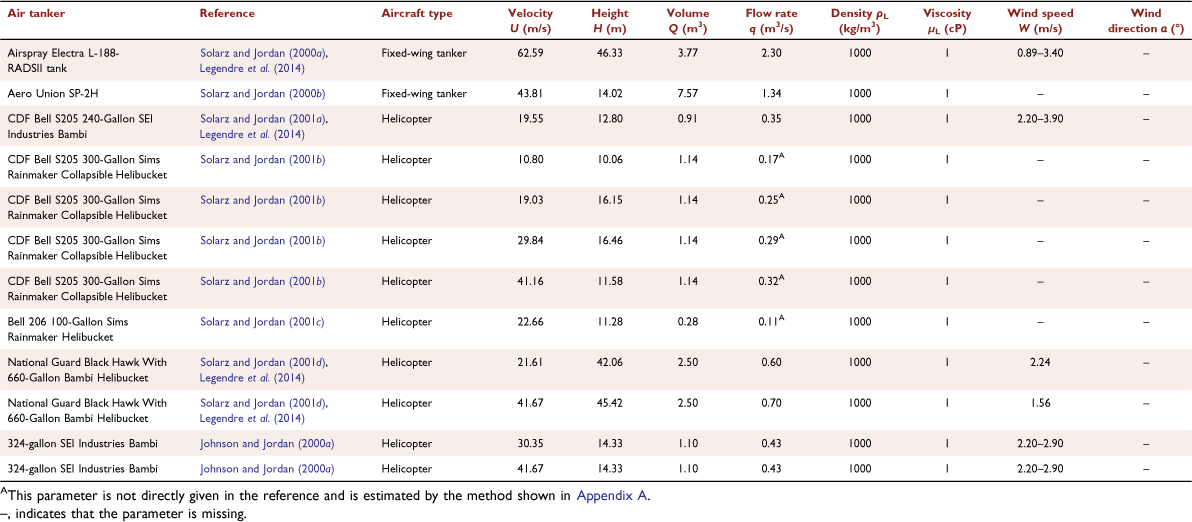
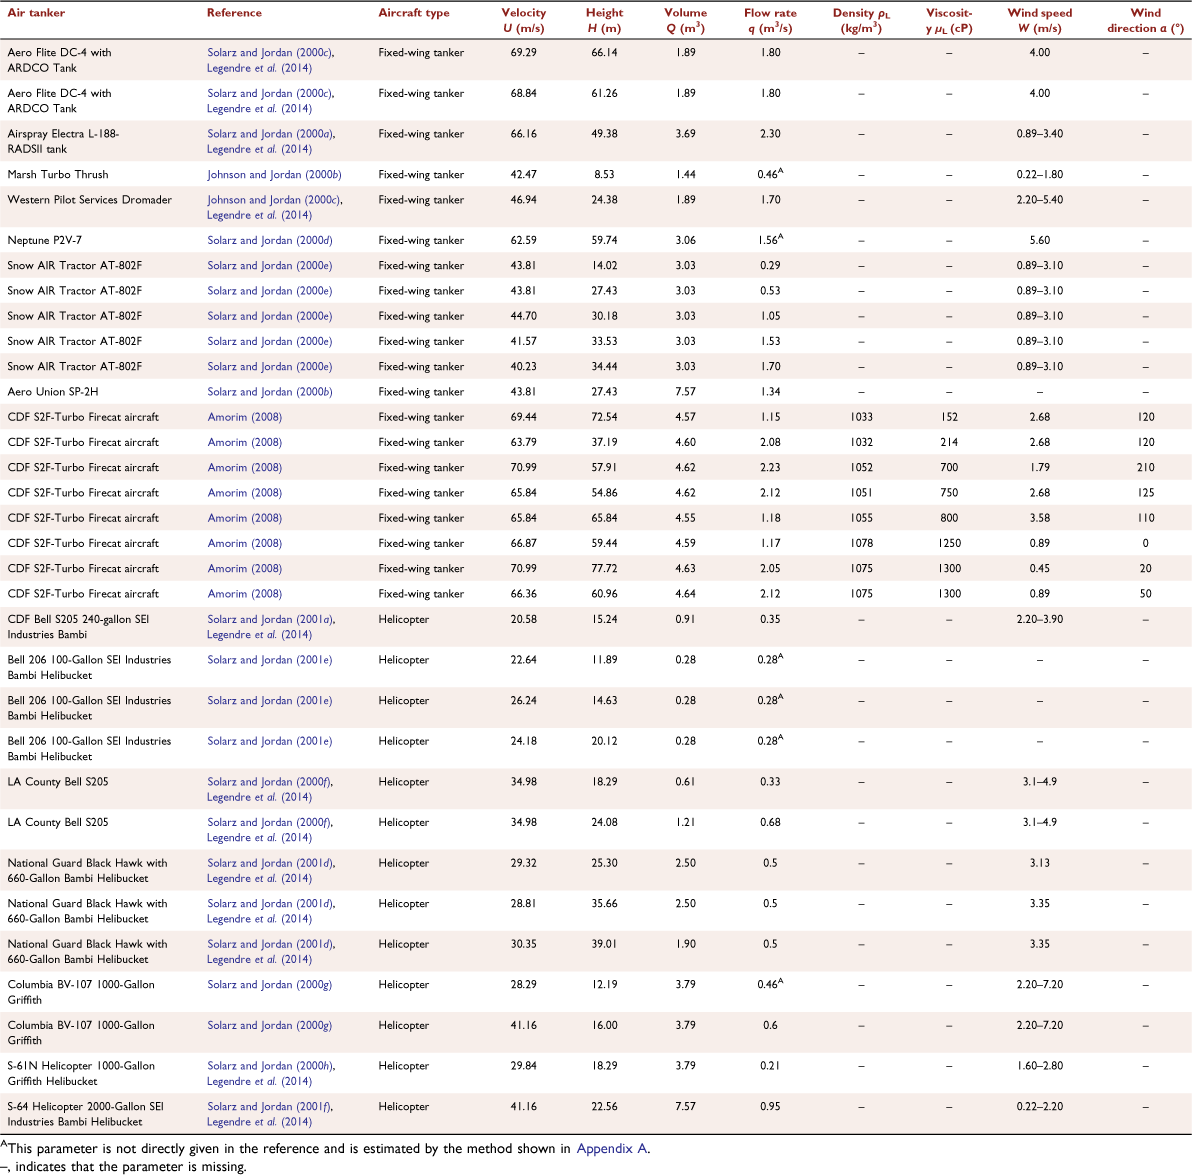
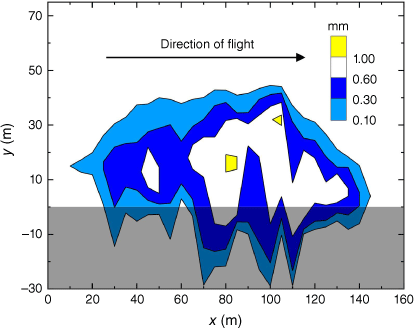
We consider full-scale drop tests for different firefighting agents reported by the USDA Forest Service and Amorim (2008, 2011). Each group of drop tests adopts the data collection method described by Suter (2000, 2002). A grid of cups is laid out on the ground along the flight direction, and the air tanker drops the liquid over the grid. The experimental data are collected by weighing the cups, and the data are used to draw a contour distribution similar to that in Fig. 1. Different firefighting agents are considered: water (Table 2) and retardants (Table 3). The references for all the data used in the present study are given in the tables where the main parameters controlling the ground fraction are also indicated. The following parameters are noted:
U = Ug − Wcosα, relative velocity between the plane and the air, where Ug is the relative velocity between the plane and the ground, W is wind speed, α is the wind direction relative to the direction of flight;
H, mean height during the drop;
Q, dropped volume;
q, average flow rate;
ρL, liquid density;
μL, liquid viscosity.
In total, we consider 45 drops corresponding to drop velocity U = 10.80–70.99 m/s, drop height H = 8.53–77.72 m, dropped volume Q = 0.28–7.57 m3, average flow rate q = 0.10–2.30 m3/s, liquid density ρL = 1000–1078 kg/m3, and liquid viscosity μL = 1–1300 cP.
However, only two drop tests of water from fixed-wing aircraft among the 45 drops are considered (Table 2). This is not enough data to support the construction of a relationship between the ground fraction φ and related parameters.

|
|
|
Full-scale drop test data for a large fixed-wing forest firefighting aircraft
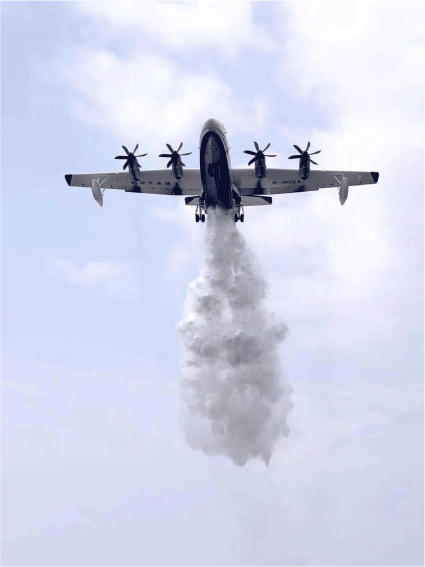
In this study, a full-scale water drop test was carried out, corresponding to drop velocity U = 61.39–67.78 m/s, drop height H = 50–69 m, average flow rate q = 2.84 m3/s, and dropped volume Q = 6 m3. This expands the research scope of relevant parameters in the fixed-wing aircraft drop test to a certain extent. The drop test from an AG600 amphibious firefighting aircraft was conducted in Jingmen, Hubei Province, on 12 April 2022. The AG600 amphibious firefighting aircraft delivery system is a gravity system. The maximum volume of the tank is 6 m3. It is structurally divided into two subtanks with partitions, one of which has a maximum volume of 3.3 m3 and the other a maximum volume of 2.7 m3. Each subtank has two identical doors, each of which has an area of 0.75 m2 and weighs 25 kg. The tank doors are mechanically linked. They open from the centre and operate in unison. Before the drop tests, we conducted several full-scale tank drop experiments in advance, and the average flow rate was recorded in each group of experiments. The average flow rate used in this study was obtained by averaging the average flow rate measured from each group experiment again.
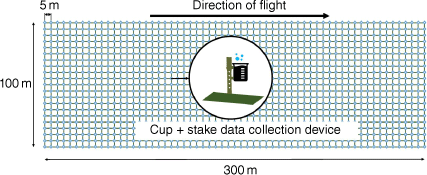
The experiment was carried out on a grassy area measuring 300 × 100 m (length × width). According to the data collection method proposed by Suter (2000, 2002) and actual conditions, ‘cup + stake’ data collection devices were set at intervals of 5 m in both the flight direction and perpendicular to the flight direction (shown in Fig. 2). A total of six groups of effective non-uniform two-dimensional discrete global data were obtained in the test (shown in Fig. 3); for example, the measured ground pattern obtained from the second group of drop tests is shown in Fig. 4. Owing to the limits of the size of the experimental site, a small amount of liquid dropped outside the test site. We used linear interpolation to complete this part of data (see grey part of Fig. 4). The linear interpolation method is an estimation of the values of the variables on one side of two known values under the condition that assumes uniform change on one side of the two known values. The main condition parameters and measured ground fraction for each group are given in Tables 4 and 5.
|
|
|

|

|
Selection of the calculation method for the ground fraction of all the data used in this study
Based on the original data obtained by the cup and grid method, researchers frequently employ the linear interpolation method to estimate unknown values (Suter 2000), such as the quantity of liquid contributing to the drop pattern. However, in previous technical reports, only the processed ground contours were given, which were relatively sparse, as shown in Fig. 1. At this point, the accuracy of the linear interpolation method may not be sufficient. Therefore, a new method proposed in next section is used for determining the ground fraction of all data used in this study.
Development and validation of ground fraction calculation method
Method development
This section proposes a new method that directly uses the sparse contour distributions under conditions of a variable flow rate to perform a fitting to calculate the ground fraction φ.
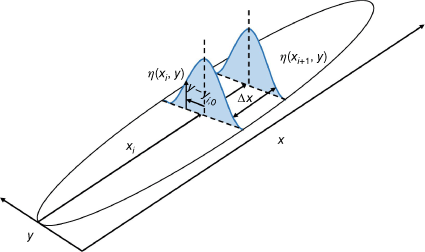
When considering the drop process of a liquid from a constant drop height and velocity, the ground pattern is usually similar to the contour distribution shown in Fig. 1. By averaging changes in flow rate and other random factors along the flight direction, the ground pattern can be simplified as shown in Fig. 5, that is, a uniform distribution along the flight direction (x-axis) and a one-dimensional distribution perpendicular to the flight direction (y-axis). The latter is represented by the mean liquid distribution  . Legendre et al. (2014) proved that this distribution follows a Gaussian distribution of the form:

where  is the maximum coverage level of the mean liquid distribution
  and σ is the standard deviation, which is a constant here.

|
The current work retains the changes in flow rate and other random factors to directly construct the coverage distribution and calculate the ground fraction φ. The specific steps are as follows:
First, the two-dimensional global non-uniform continuous distribution on the ground is discretised along one direction. According to the spatial scale of the drop process and the actual conditions of experimental data collection, the appropriate length of the segment Δx is selected, and the ground liquid distribution is divided into N segments along the flight direction. Each segment  has an approximately uniform distribution along the x direction and a Gaussian distribution along the y direction. In addition, considering the displacement of the segment perpendicular to the flight direction, the coordinates of the centre point of segment yi,0 are introduced. Therefore, the ground liquid distribution in segment
  is expressed as:

where the maximum coverage level η(xi, y)max of the liquid distribution η(xi, y), the coordinate of the centre point of segment  yi,0, and the standard deviation σi are all parameters related to i (Fig. 6).
|
Considering the distribution characteristics of the original experimental data along the y direction of each segment, the appropriate method is selected to solve for the undetermined parameters (η(xi, y)max, yi,0, σi), and the liquid distribution on the ground, reflecting the flow rate change and the influence of other random factors, is obtained. The selection principle of the undetermined parameter solution method is as follows: when there are only three original experimental data points at x = xi, solve directly for η(xi, y)max, yi,0, σi. In other cases, fit to solve for η(xi, y)max, yi,0, σi, where R2 > 0.8 is specified to ensure the goodness of fit.
Second, we take y as the integration variable to integrate the liquid distribution on the ground η(xi, y) within each segment  . Considering that the liquid distribution on the ground perpendicular to the flight direction cannot extend infinitely, combined with the collection of experimental data, we can choose 6σi as the actual width. The actual range along the y direction at position xi is expressed as
  , and the integral of the ground liquid distribution η(xi, y) on
  is:
is:

where S(xi) is the area enclosed by the liquid distribution η(xi, y) and the ground in segment  .
.
Furthermore, the non-uniform two-dimensional continuous global distribution is summed along the x direction. Considering that the non-uniform two-dimensional continuous global distribution is composed of N segments and that each segment  is approximately uniformly distributed along the x direction, the sum is:

where V is the actual volume of drop liquid.
Finally, combined with the calculation formula (Eqn 4), the ground fraction φ can be expressed as:

Method validation
In this section, the ground fraction calculation method was validated by comparing the ground fraction obtained with this method with the values measured in actual drop tests. The measured ground fraction obtained from drop tests, the ground fraction calculated by the post-processing method, and the bias and relative bias between them are shown in Table 5. It can be seen that the calculated values from the post-processing method are in good agreement with the experimental values, with a relative bias of 9.50%, and maximum bias of 4.01%. In terms of the statistical analysis of the modelling results, although there is no universally accepted standard defined to evaluate the performance of drop model performance, the USDA Forest Service has adopted a value of 10% of the modulus of the percentage error as a quality requirement for this type of application (Amorim 2011). Obviously, the method proposed in this paper meets the requirements, which indicates that the method can calculate the ground fraction with good accuracy in areas cleared of vegetation and free of fire.
Results
In this section, we aim to construct the relationship between the ground fraction φ and related parameters (drop velocity U, drop height H, dropped volume Q, average flow rate q, liquid density ρL and liquid viscosity μL). Considering that the firefighting agent is water, we construct a simple model of the ground fraction φ in terms of the main influencing parameters (U, H, Q, q) by combining the theoretical analysis and data fitting method. Furthermore, we analyse the influence of liquid density ρL and liquid viscosity μL on the ground fraction φ and aim to determine the quantitative relationship between them.
Ground fraction model for dropping water
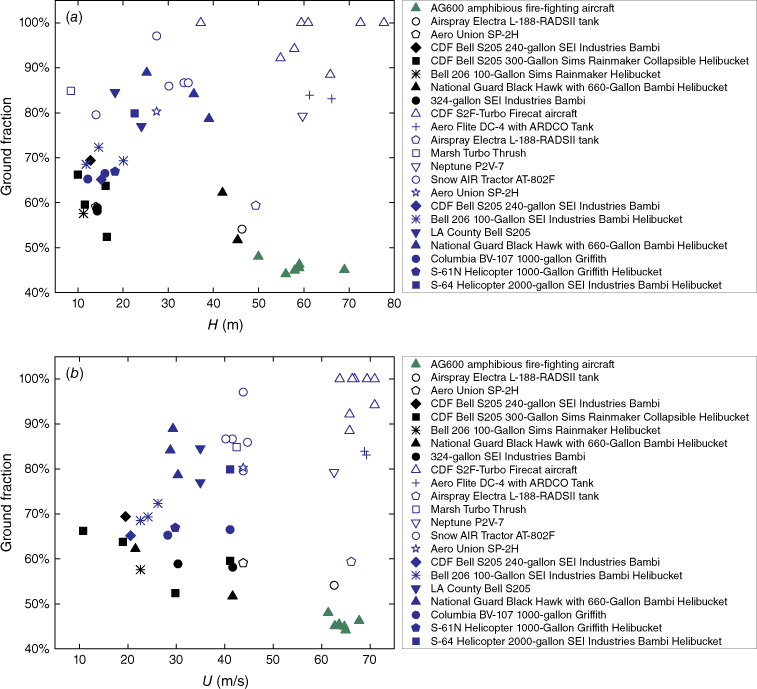
The relationship of the ground fraction φ with the drop velocity U and drop height H is given in Fig. 7. The ground fraction φ varies from 48.88 to 100%. It is not difficult to see that this parameter is very dispersed owing to the significant differences between the various test conditions. Similar conclusions are obtained when plotting the results as a function of the other parameters: the dropped volume Q, the average flow rate q, the liquid density ρL, and the liquid viscosity μL. It is impossible to determine the quantitative relationship between the ground fraction φ and the relevant parameters (U, H, Q, q).
|
Therefore, in the case of water as a firefighting agent, we aim to determine the function for the relationship between the ground fraction φ and relevant parameters (U, H, Q, q) directly through theoretical derivation and then use the original data from the drop test for fitting to obtain the quantitative relationship between the ground fraction and relevant parameters. Combined with the study of Legendre et al. (2014), the ground fraction φ can be expressed as:

where Q is the dropped volume; Ug is the relative velocity between the plane and the ground; T is the duration of the drop, T = Q/q;  is the maximum coverage level of
  ; and σ is the standard deviation. Here,
  and σ are unknown.
The standard deviation (σ) is related to the width (D) (defined for η = 0.2 mm) by (Legendre et al. 2014):

Here, f1 = 27 and f1 = 58 are used for the conventional gravity and the jet pressurised systems respectively; S is the area of the tank door; ρw is the density of water; ρair is the density of air; ρw/ρair is a constant; U1 is the mean liquid velocity at the tank exit, which equals q/S, where q is the averaged flow rate; and U is the relative velocity between the plane and the air.
Finally, we obtain:

where,  is a function of
  . The non-dimensional analysis of the results permit us to determine m−0.8 for the dimension of
  . According to the study of Legendre et al. (2014),
  may be related to the relative velocity between the plane and the ground Ug, the averaged flow rate q, the tank door area S, etc.
Therefore, we may assume the following expression for the general form of the ground fraction φ:

Here,  , where k1 is a correction factor, and A is an unknown dimensional quantity. The non-dimensional analysis of the results also permit us to determine m0.8 for the dimension of A. Qualitatively, it is not difficult to understand that when increasing the drop height H, the time for droplet dispersion and evaporation is increased to greatly reduce the ground fraction φ. In addition, according to Eqn 5, the dropped volume Q is a variable that is directly related to the ground fraction.
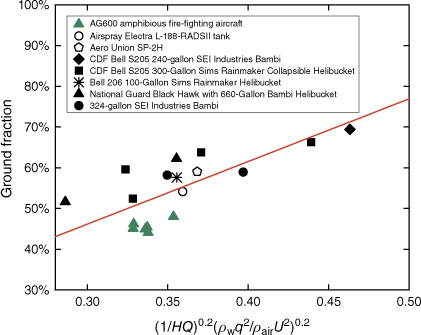
Hence, we introduce the drop height H and the dropped volume Q to represent the unknown dimensional quantity A. The fit is carried out by combining the original data of the drop tests listed in Tables 2 and 4. As shown in Fig. 8, the appropriate dimensional quantity A that makes possible a unique description of the results is (HQ)0.2. Finally, using a linear fit, the ground fraction φ can be simply expressed as:

Here, the range of values of dimensionless quantities is 0.286 <  < 0.463.
|
It is not difficult to see that the ground fraction φ (44.1% < φ ≤ 69.4%) is mainly controlled by the drop velocity U, the drop height H, the average flow rate q and the dropped volume Q, and is directly proportional to q0.4 and inversely proportional to U0.4, H0.2 and Q0.2. Compared with previous studies (Wu et al. 1998; Legendre et al. 2014), the result reveals the induced effects of drop height H on the ground pattern.
These parameters are determined by the design of the aircraft and delivery system or the selection of the test conditions. The model presented could be used to design an aircraft and delivery system to meet the requirements for ground fraction φ.
However, the above linear relationship between ground fraction and the dimensionless quantity (shown in Eqn 10) may not be applicable when the dimensionless quantity is less than 0.286 or greater than 0.463. For example, it is almost impossible for the ground fraction to reach 100% owing to plane wake capture, wind dispersion or evaporation.
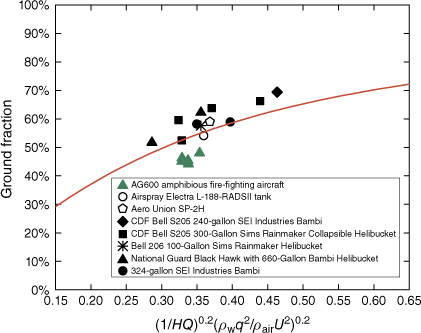
Therefore, we propose the following hypothesis: (1) when conditions (e.g. ambient temperature, humidity not considered in this paper) are certain, the dimensionless quantity becomes larger, the ground fraction becomes higher and gradually closer to 100%; (2) when the dimensionless quantity is equal to 0, the ground fraction is equal to 0. Mathematically, the ground fraction conforms to a functional form that may have the following characteristics: (1) it passes through the (0, 0) point; (2) it has a horizontal asymptote of φ = 100%. Therefore, we speculate that the ground distribution may obey the distribution of the inverse tangent function; the expression of the ground fraction obtained by fitting is (shown in Fig. 9)

Here, the correction factor k1 = 3.29, and  is the normalisation factor. It is easy to understand that the equation can be simplified to different linear distributions for fast estimation needs in engineering. For example, when 0.286 <
  < 0.463, Eqn 11 can be approximated by Eqn 10.
|
Now, we consider that the average flow rate q can be expressed by the product of the tank door area S and the mean liquid velocity at the tank exit Ul. Ultimately, we obtain:

The tank door area S and the mean liquid velocity at the tank exit Ul determined in the design of the delivery system are also main factors in the ground fraction φ.
From the momentum ratio p =  , we simplify the ground fraction to:

We find that the ground fraction φ is proportional to p0.2, which is consistent with the conclusion drawn by Legendre et al. (2014). This conclusion can be explained by the results of a large number of experimental studies devoted to jet atomisation in crossflows (Oda et al. 1994; Inamura and Nagai 1997; Wu et al. 1998). With increasing momentum ratio, the dispersion effect of droplets perpendicular to the flight direction is weakened, and the time for droplet dispersion and evaporation is decreased, thus significantly increasing the ground fraction. Therefore, we infer that, compared with gravity delivery systems, pressurised jet delivery systems can greatly increase the ground fraction by increasing the mean liquid velocity at the tank exit Ul.
In addition, we observe the same trend for helicopters and airplanes (see Fig. 9), showing that the downwash induced by a rotor does not have a dominant effect on liquid atomisation and evaporation. This is consistent with the conclusion drawn by Legendre et al. (2014) when studying the mean liquid distribution model.
Effect of liquid density and liquid viscosity on the ground fraction
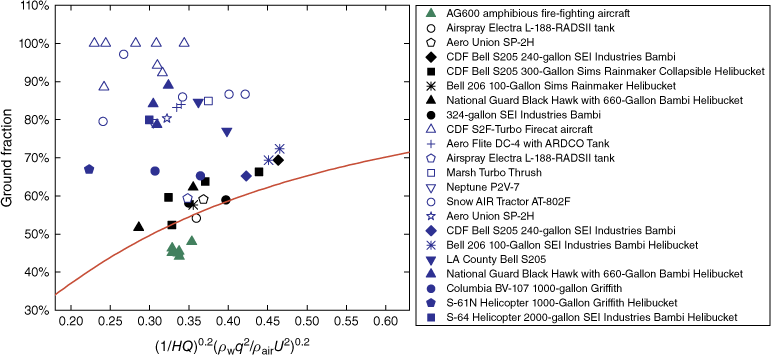
Assuming that the firefighting agent in all drop tests is water, the evolution of the ground fraction φ with the non-dimensional quantity  is shown in Fig. 10. The results show that the actual ground fraction is significantly higher when using retardants than the predicted value of the developed model, which can be explained by the research of Andersen et al. (1974) and Andersen and Wong (1978). By adding a fraction of gum to water, the basic physical parameters of the product are significantly changed, especially density and viscosity. When the liquid density and liquid viscosity are increased, the proportion of smaller droplets is decreased, and the proportion of droplets subjected to evaporation, dispersion and capture in the wake is decreased; thus, the ground fraction is greatly increased.
|
|
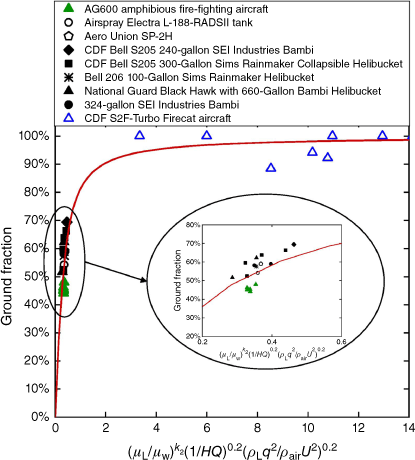
However, drop testing using retardants has rarely been performed. This may be due to the cost of the experiment being very high. Therefore, we select eight groups of drop tests from the CDF S2F-Turbo Firecat aircraft with a known liquid density ρL and liquid viscosity μL (see Table 3) to study the quantitative relationship between the ground fraction φ and liquid density ρL and liquid viscosity μL. Owing to the use of retardants, the momentum ratio is p =  . Inserting this expression into Eqn 11, we obtain the following expression for the ground fraction φ, which indicates the influence of liquid density ρL:

However, the known measurement range of liquid density ρL in the drop retardant test is quite small (ρL = 1000–1078 kg/m3); that is,  ≈ 1, which is not sufficient to reflect the influence of liquid density ρL.
Furthermore, we consider the influence of liquid viscosity μL on the ground fraction. By introducing the viscosity ratio  and correction factor k2, the non-dimensional quantity becomes
  . As shown in Fig. 11, we obtained k2 = 0.53 by fitting an inverse tangent function. The ground fraction can be expressed as:

Here, the correction factor k1 = 3.29 and k2 = 0.53.
We find that the ground fraction φ is mainly controlled by the drop velocity U, drop height H, average flow rate q, dropped volume Q, liquid density ρL and liquid viscosity μL, which further expands the main influencing factors of the ground fraction. Meanwhile, the results show that the liquid viscosity has a more significant effect on the ground fraction than the other factors. Compared with previous studies (Wu et al. 1998; Legendre et al. 2014), the result reveals the induced effects of drop height H and liquid viscosity μL on the ground pattern. These factors are determined by the fraction of gum added to water. The presented model can be used to determine the optimal fraction of added gum to obtain a desirable ground fraction.
In addition, when water is used as the firefighting agent (μL = μw, ρL = ρw), Eqn 15 can be simplified into Eqn 11; that is, the ground fractions of different firefighting agents conform to the same trend.
Discussion
The previous sections show the simple relationship between the ground fraction and the conditions of the drop tests, such as the drop velocity, drop height, average flow rate, dropped volume, liquid density and liquid viscosity. However, the effects of the error caused by ground fraction calculation methods (shown in the Methods section) and real wildfire conditions (e.g. high winds, dryness, high temperatures, vegetation) on ground fraction have not been discussed. In addition, the application and applicability of the ground fraction model have not been introduced.
In this section, we first analyse the effects of the error caused by the post-processing method and real wildfire conditions on the ground fraction. Then, we apply the ground fraction model to solve for the maximum coverage level  of the mean liquid distribution
  under constant flow rate conditions. Finally, we briefly discuss the applicable scope of the ground fraction model.
Effects of the error caused by the post-processing method and real wildfire conditions on the ground fraction
The ground fraction calculation method can calculate the ground fraction with good accuracy in areas cleared of vegetation and free of fire. However, as shown in Table 5, the ground fraction calculated by this method is always slightly higher than the experimentally measured ground fraction. This may be caused by the fact that the contour distribution used for the global optimisation fit is too sparse and does not fully reflect the actual experimental data characteristics. In addition, the measured ground patterns obey a skewed distribution rather than a normal distribution under the effect of lateral winds, which may be another reason for the overestimation. This overestimation may account for the 100% ground fraction of some of the drop experiments in Results section.
In addition, real fire conditions (e.g. high winds, dryness, high temperatures, vegetation) may also be a key factor affecting the ground fraction. For example, it is conceivable that evaporation due to high temperatures and dryness may cause a significant part of fluid loss, thereby reducing the ground fraction. However, the above speculations have not been confirmed, owing to the difficulty of accessing and observing drop effects on wildfires (George 1990). In the future, drop experiments under real wildfire conditions are needed to provide basic data support for modifying the ground fraction model.
Solution of the maximum coverage level of the mean liquid distribution based on the ground fraction model
As mentioned in Data section, Legendre et al. (2014) showed that the ground pattern can be simplified as shown in Fig. 5, that is, a uniform distribution along the flight direction (x) and the mean liquid distribution  perpendicular to the flight direction (y). In this work, the maximum coverage level
  of the mean liquid distribution
  needs to be estimated according to the actual coverage distribution of a full-scale drop test. In this section, we directly solve an equation for the maximum coverage level
  by using the proposed model of the ground fraction φ to construct a theoretical model of the mean liquid distribution
  .
.

Substituting Eqn 15 into Eqn 16 yields

where  ; f1 = 27 and f1 = 58 are used for the conventional gravity and the jet pressurised systems respectively; k1 = 3.29; k2 = 0.53; Q is the dropped volume; q is the average flow rate; Ug is the relative velocity between the plane and the ground; U is the drop velocity; H is the drop height; S is the area of the tank door; μL is the liquid viscosity; and ρL is the liquid density.
It is not difficult to see that the maximum coverage level  is controlled by the average flow rate q, relative velocity between the plane and the ground Ug, area of the tank door S, drop height H, dropped volume Q, and liquid viscosity μL. This reveals the induced effects of drop height, liquid viscosity, flow rate and other factors on the maximum coverage level
  of ground pattern.
In addition, by substituting Eqn 17 into Eqn 1, a simple model of the mean liquid distribution  based on relevant parameters can be directly established. This model may be used to inform the design of new aircraft and delivery systems or the optimisation of an existing delivery system. Meanwhile, a simple model for ground pattern has the characteristics of fast calculation and low cost, and can predict ground distribution under different aircraft, delivery systems and flight conditions. Combined with information such as impact on fire behaviour, this enables evaluation of the effectiveness of aerial firefighting drops, the results of which can help determine cost effectiveness and enable operational procedures to be more comprehensively evaluated (Plucinski and Pastor 2013).
Scope of application of the ground fraction model
The experimental conditions of all drop tests collected in this study satisfy

Drop experiments satisfying the dimensionless quantity less than 0.22 have not been reported. This may be because the ground fraction is greatly reduced in such conditions owing to effects of plane wake capture, wind dispersion or evaporation, which may be unacceptable in actual wildfire management. In the future, we will conduct experiments or numerical simulations under such conditions to verify the applicability of the ground fraction model.
In addition, the effect of real fire conditions (e.g. high winds, dryness, high temperatures, vegetation) have not been considered. However, drop testing under real wildfire conditions has rarely been performed. This may be owing to the difficulty of accessing and observing the drop effects on wildfires (George 1990). In the future, drop experiments under real wildfire conditions are needed to provide basic data support for extending the applicability of ground fraction models.
Conclusions
In this paper, we proposed a simple model for the ground fraction by directly using full-scale drop test data for different firefighting agents for fitting. Furthermore, the induced effects of drop velocity, drop height, liquid viscosity and other factors on the ground pattern were revealed.
The main conclusions are listed below:
Based on a theoretical analysis and the data fitting method, a simple model of the relationship between the ground fraction and relevant parameters is proposed. The result shows that the ground fraction is controlled mainly by the drop velocity, drop height, average flow rate, dropped volume, liquid density and liquid viscosity, and the liquid viscosity has a more significant effect on the ground fraction than the other factors.
The proposed model of the ground fraction was used to solve for the maximum coverage level of the mean liquid distribution. The result reveals the induced effects of the relevant parameters on the maximum coverage level, which may be used to inform the design of new aircraft and delivery systems or the optimisation of an existing delivery system. Combined with information such as impact on fire behaviour, this enables evaluation of the effectiveness of aerial firefighting drops, the results of which can help determine cost effectiveness and enable operational procedures to be more comprehensively evaluated.
Future development could include (1) carrying out more drop tests to verify the applicability of the ground fraction model proposed in this paper; (2) developing a tank flow model to replace the average flow rate q in this model and predict the actual ground pattern; and (3) including environmental factors, such as ambient temperature and humidity, which are known to influence the ground fraction but are not recorded during drop testing, making it necessary to explore the influence of more factors on the ground fraction through experimental research.
Data availability
The data that support this study will be shared on reasonable request to the corresponding author.
Conflicts of interest
The authors declare no conflicts of interest with respect to the publication of this article.
Declaration of funding
This research did not receive any specific funding.
References
Amorim JH (2008) Numerical modelling of the aerial drop of products for forest firefighting. PhD thesis, University of Aveiro, Portugal.Amorim JH (2011) Numerical modelling of the aerial drop of firefighting agents by fixed-wing aircraft. Part II: model validation. International Journal of Wildland Fire 20, 394–406.
| Numerical modelling of the aerial drop of firefighting agents by fixed-wing aircraft. Part II: model validation.Crossref | GoogleScholarGoogle Scholar |
Andersen WH, Wong JY (1978) Dynamic interaction of fire retardant droplets with fuel, and correlation with the rheological properties of the retardant. Final Report 7660–02. (USDA Forest Service, Northern Forest Fire Laboratory: Ogden, UT)
Andersen WH, Brown RE, Kato KG, Louie NA (1974) Investigation of rheological properties of aerial-delivered fire retardant. Final report 8990–05. (USDA Forest Service, Northern Forest Fire Laboratory: Ogden, UT)
Artés T, Oom D, de Rigo D, Durrant TH, Maianti P, Libertà G, San-Miguel-Ayanz J (2019) A global wildfire dataset for the analysis of fire regimes and fire behaviour. Scientific Data 6, 296
| A global wildfire dataset for the analysis of fire regimes and fire behaviour.Crossref | GoogleScholarGoogle Scholar |
George CW (1985) An operational retardant effectiveness study. Fire Management Notes 46, 18–23.
George CW (1990) An update on the Operational Retardant Effectiveness(ORE) program. In ‘The Art and Science of Fire Management. Proceedings of the First Interior West Fire Council Annual Meeting and Workshop’, 24–27 October 1988, Kananaskis, AB, Canada. (Eds ME Alexander, GF Bisgrove) Information Report NOR-X-309. pp. 114–122. (Forestry Canada, Northwest Region, Northern Forestry Centre: Edmonton, AB)
George CW, Johnson GM (1990) Developing air tanker performance guides. General Technical Report INT-268. (USDA Forest Service, Intermountain Research Station: Ogden, UT)
Inamura T, Nagai N (1997) Spray characteristics of liquid jet traversing subsonic airstreams. Journal of Propulsion and Power 13, 250–256.
| Spray characteristics of liquid jet traversing subsonic airstreams.Crossref | GoogleScholarGoogle Scholar |
Johnson G, Jordan C (2000a) Ground pattern performance of the SEI industries Bambi 324-gallon helibucket. Technical Report 0057–2802-MTDC. (USDA Forest Service, Missoula Technology and Development Center: Missoula, MT)
Johnson G, Jordan C (2000b) Ground pattern performance of the Marsh Turbo Thrush. Technical Report 0057–2835-MTDC. (USDA Forest Service, Missoula Technology and Development Center: Missoula, MT)
Johnson G, Jordan C (2000c) Ground pattern performance of the Western Pilot Services Dromader. Technical Report 0057–2834-MTDC. (USDA Forest Service, Missoula Technology and Development Center: Missoula, MT)
Legendre D, Becker R, Alméras E, Chassagne A (2014) Air tanker drop patterns. International Journal of Wildland Fire 23, 272–280.
| Air tanker drop patterns.Crossref | GoogleScholarGoogle Scholar |
McCarthy GJ, Plucinski MP, Gould JS (2012) Analysis of the resourcing and containment of multiple remote fires: the Great Divide Complex of fires, Victoria, December 2006. Australian Forestry 75, 54–63.
| Analysis of the resourcing and containment of multiple remote fires: the Great Divide Complex of fires, Victoria, December 2006.Crossref | GoogleScholarGoogle Scholar |
Moritz MA, Batllori E, Bradstock RA, Gill AM, Handmer J, Hessburg PF, Leonard J, McCaffrey S, Odion DC, Schoennagel T, Syphard AD (2014) Learning to coexist with wildfire. Nature 515, 58–66.
| Learning to coexist with wildfire.Crossref | GoogleScholarGoogle Scholar |
Oda T, Hiroyasu H, Arai M, Nishida K (1994) Characterization of liquid jet atomization across a high-speed airstream. JSME International Journal Series B Fluids and Thermal Engineering 37, 937–944.
| Characterization of liquid jet atomization across a high-speed airstream.Crossref | GoogleScholarGoogle Scholar |
Paudel J (2021) Beyond the blaze: the impact of forest fires on energy poverty. Energy Economics 101, 105388
| Beyond the blaze: the impact of forest fires on energy poverty.Crossref | GoogleScholarGoogle Scholar |
Plucinski MP, Pastor E (2013) Criteria and methodology for evaluating aerial wildfire suppression. International Journal of Wildland Fire 22, 1144–1154.
| Criteria and methodology for evaluating aerial wildfire suppression.Crossref | GoogleScholarGoogle Scholar |
Plucinski MP, McCarthy GJ, Hollis JJ, Gould JS (2012) The effect of aerial suppression on the containment time of Australian wildfires estimated by fire management personnel. International Journal of Wildland Fire 21, 219–229.
| The effect of aerial suppression on the containment time of Australian wildfires estimated by fire management personnel.Crossref | GoogleScholarGoogle Scholar |
Plucinski MP, Sullivan AL, Hurley RJ (2017) A methodology for comparing the relative effectiveness of suppressant enhancers designed for the direct attack of wildfires. Fire Safety Journal 87, 71–79.
| A methodology for comparing the relative effectiveness of suppressant enhancers designed for the direct attack of wildfires.Crossref | GoogleScholarGoogle Scholar |
Rimbert N, Séro-Guillaume O (2004) Log-stable laws as asymptotic solutions to a fragmentation equation: application to the distribution of droplets in a high Weber-number spray. Physical Review E 69, 056316
| Log-stable laws as asymptotic solutions to a fragmentation equation: application to the distribution of droplets in a high Weber-number spray.Crossref | GoogleScholarGoogle Scholar |
Santín C, Doerr SH (2016) Fire effects on soils: the human dimension. Philosophical Transactions of the Royal Society B: Biological Sciences 371, 20150171
| Fire effects on soils: the human dimension.Crossref | GoogleScholarGoogle Scholar |
Solarz P, Jordan C (2000a) Ground pattern performance of the Airspray Electra L-188 with Aero Union constant flow tank. Technical Report 0057–2851-MTDC. (USDA Forest Service, Missoula Technology and Development Center: Missoula, MT)
Solarz P, Jordan C (2000b) Ground Pattern Performance of the Aero Union SP-2H. Technical Report 0057–2849-MTDC. (USDA Forest Service, Missoula Technology and Development Center: Missoula, MT)
Solarz P, Jordan C (2000c) Ground pattern performance of the Aero Flite DC4 airtanker with modified Ardco conventional tank. Technical Report 0057–2867-MTDC. (USDA Forest Service, Missoula Technology and Development Center: Missoula, MT)
Solarz P, Jordan C (2000d) Ground pattern performance of the Neptune P2V–7 airtanker. Technical Report 0057–2848-MTDC. (USDA Forest Service, Missoula Technology and Development Center: Missoula, MT)
Solarz P, Jordan C (2000e) Ground pattern performance of the Snow Air Tractor with constant flow tank. Technical Report 0057–2852- MTDC. (USDA Forest Service, Missoula Technology and Development Center: Missoula, MT)
Solarz P, Jordan C (2000f) Ground pattern performance of the LA County Bell S205 helicopter with Sheetcraft fixed tank. Technical Report 0057–2863-MTDC. (USDA Forest Service, Missoula Technology and Development Center: Missoula, MT)
Solarz P, Jordan C (2000g) Ground pattern performance of the Columbia BV-107 helicopter using the 1000-gallon Griffith Big Dipper helibucket. Technical Report 0057–2865-MTDC. (USDA Forest Service, Missoula Technology and Development Center: Missoula, MT)
Solarz P, Jordan C (2000h) Ground pattern performance of the Siller Brothers S-61N helicopter using the 1000-gallon Griffith big dipperbhelibucket. Technical Report 0057–2864-MTDC. (USDA Forest Service, Missoula Technology and Development Center: Missoula, MT)
Solarz P, Jordan C (2001a) Ground pattern performance of the California Department of Forestry Bell S205 and National Guard UH-1 helicopters with the 240-gallon SEI Industries Bambi helibucket. Technical Report 0157–2807- MTDC. (USDA Forest Service, Missoula Technology and Development Center: Missoula, MT)
Solarz P, Jordan C (2001b) Ground Pattern Performance of the California Department of Forestry Bell S205 Helicopter With the 300-Gallon Sims Rainmaker Collapsible Helibucket. Technical Report 0157–2803-MTDC. (USDA Forest Service, Missoula Technology and Development Center: Missoula, MT)
Solarz P, Jordan C (2001c) Ground Pattern Performance of the Forest Service Bell 206 Helicopter With the 100-Gallon Sims Rainmaker Helibucket. Technical Report 0157–2805-MTDC. (USDA Forest Service, Missoula Technology and Development Center: Missoula, MT)
Solarz P, Jordan C (2001d) Ground Pattern Performance of the National Guard Black Hawk Helicopter With the 660-Gallon SEI Industries Bambi Helibucket. Technical Report 0157–2804-MTDC. (USDA Forest Service, Missoula Technology and Development Center: Missoula, MT)
Solarz P, Jordan C (2001e) Ground Pattern Performance of the Forest Service Bell 206 Helicopter With the 100-Gallon SEI Industries Bambi Helibucket. Technical Report 0157–2808-MTDC. (USDA Forest Service, Missoula Technology and Development Center: Missoula, MT)
Solarz P, Jordan C (2001f) Ground Pattern Performance of the Siller Brothers S-64 Helicopter With the 2,000-Gallon SEI Industries Bambi Helibucket. Technical Report 0157–2806-MTDC. (USDA Forest Service, Missoula Technology and Development Center: Missoula, MT)
Stonesifer CS, Calkin DE, Thompson MP, Stockmann KD (2016) Fighting fire in the heat of the day: an analysis of operational and environmental conditions of use for large airtankers in United States fire suppression. International Journal of Wildland Fire 25, 520–533.
| Fighting fire in the heat of the day: an analysis of operational and environmental conditions of use for large airtankers in United States fire suppression.Crossref | GoogleScholarGoogle Scholar |
Suter A (2000) Drop testing airtankers: a discussion of the cup-and-grid method. Technical Report 0057–2868-MTDC. (USDA Forest Service, Missoula Technology and Development Center: Missoula, MT)
Suter A (2002) Estimating methods, variability, and sampling for drop-test data. Technical Report 0257–2826-MTDC. (USDA Forest Service, Missoula Technology and Development Center: Missoula, MT)
Thompson MP, Calkin DE, Herynk J, McHugh CW, Short KC (2013) Airtankers and wildfire management in the US Forest Service: examining data availability and exploring usage and cost trends. International Journal of Wildland Fire 22, 223–233.
| Airtankers and wildfire management in the US Forest Service: examining data availability and exploring usage and cost trends.Crossref | GoogleScholarGoogle Scholar |
Wu P-K, Kirkendall KA, Fuller RP, Nejad AS (1998) Spray structures of liquid jets atomized in subsonic crossflows. Journal of Propulsion and Power 14, 173–182.
| Spray structures of liquid jets atomized in subsonic crossflows.Crossref | GoogleScholarGoogle Scholar |
Appendix A. Calculation method of the average flow rate
The flow rate is linked to the duration t of the drop and the volume released Q by

After averaging changes in flow rate and other random factors along the flight direction, the ground pattern can be simplified as shown in Fig. 5, that is, the uniform distribution along the flight direction (x). As the volume released Q > 0.28 m3, the duration t of the drop can be expressed by Legendre et al. (2014):

If Q ≤ 0.28 m3, then the duration t of the drop is approximated by:

where Ug is the relative velocity between the plane and the ground, and, considering that the wind speed is small relative to the drop velocity U in the drop test, this velocity may be approximated by Ug = U. L is the length of the coverage distribution along the flight direction and D is the width of the coverage distribution perpendicular to the flight direction, all of which can be obtained directly from the contour distribution. Ultimately, the average flow rate q can be calculated by:


 using a linear fit. Only water drop tests are considered. Drop test parameters are given in
  fitting with an inverse tangent function. Only water drop tests are considered. Drop test parameters are given in
  . Both water and retardant drop tests are considered. Drop test parameters are given in
  fitting with an inverse tangent function. Only water and retardant drop tests with known liquid density ρL and liquid viscosity μL were taken into account. Drop test parameters are given in