Near-term fire weather forecasting in the Pacific Northwest using 500-hPa map types
Reed Humphrey A * , John Saltenberger B , John T. Abatzoglou
  C and Alison Cullen
  A
A
A
B
C
Abstract
Near-term forecasts of fire danger based on predicted surface weather and fuel dryness are widely used to support the decisions of wildfire managers. The incorporation of synoptic-scale upper-air patterns into predictive models may provide additional value in operational forecasting.
In this study, we assess the impact of synoptic-scale upper-air patterns on the occurrence of large wildfires and widespread fire outbreaks in the US Pacific Northwest. Additionally, we examine how discrete upper-air map types can augment subregional models of wildfire risk.
We assess the statistical relationship between synoptic map types, surface weather and wildfire occurrence. Additionally, we compare subregional fire danger models to identify the predictive value contributed by upper-air map types.
We find that these map types explain variation in wildfire occurrence not captured by fire danger indices based on surface weather alone, with specific map types associated with significantly higher expected daily ignition counts in half of the subregions.
We observe that incorporating upper-air map types enhances the explanatory power of subregional fire danger models.
Our approach provides value to operational wildfire management and provides a template for how these methods may be implemented in other regions.
Keywords: fire danger, fire management, forecasting, Pacific Northwest, policy, subregional, predictive services, synoptic, weather.
Introduction
Wildland fire is a pervasive and growing concern in much of the western United States, with considerable resources expended annually on wildfire suppression. In Pacific US forests, the mean fire weather season lengthened by 43% from 1979 to 2019, and annual burned area increased by nearly 50% from 2001 to 2019 (Jones et al. 2022). Wildfire occurrence in western US forests is projected to continue increasing into future decades, with annual burned area potentially doubling between 2020 and 2050 (Abatzoglou et al. 2021). As a result of increasing season length and intensity, fire managers are having to contend with more simultaneous wildfires, creating additional strains on wildfire suppression resources (Podschwit and Cullen 2020). Climate projections suggest increases in both the number of simultaneous wildfires and the length of the high-simultaneity season across the western US over the coming decades, further taxing suppression resources (McGinnis et al. 2023).
The National Predictive Services Program, which employs fire meteorologists at the National Interagency Coordination Center (NICC) and 10 regional Geographic Area Coordination Centers (GACCs), provides fire weather forecasting services that support the short-term to seasonal decision making of fire managers (Wordell and Ochoa 2006). Since the program’s inception in 2001, meteorologists at Predictive Services have become a trusted source of information and are central actors in the interagency network of fire management professionals (Owen et al. 2012). Although Predictive Services products such as the 7-Day Significant Fire Potential Outlook have been found to have significant skill predicting both ignitions and operationally significant fires (Preisler et al. 2016), additional improvements to forecasting methods may reduce expenditures and increase the efficacy of suppression resources (Preisler et al. 2011).
Fire weather predictions rely on forecasts of both surface weather and upper-air conditions. Surface weather attributes including temperature, moisture and wind are often combined using fuel models to calculate fire danger indices (Fosberg 1978; Cohen and Deeming 1985; Srock et al. 2018). Upper-air characteristics, such as 500-hPa geopotential heights, are useful for understanding the synoptic-scale features – such as the configuration and strength of ridges and troughs – that drive surface weather as well as cloud-to-ground lightning. Previous studies have linked variability in upper-air geopotential heights to critical fire weather (Schroeder et al. 1964; Newark 1975; Crimmins 2006) and lightning occurrence (van Wagtendonk and Cayan 2008; Kalashnikov et al. 2022), including in the Northwestern US (Rorig and Ferguson 1999; Gedalof et al. 2005; Zhong et al. 2020). Synoptic patterns, particularly upper-air ridges, have also been linked directly to increased wildfire activity (Henry 1978; Skinner et al. 2002; Nauslar et al. 2019; Sharma et al. 2022).
In this study, we explore the predictive value of a set of 13 map types used operationally by meteorologists at the Northwest Interagency Coordination Center (NWCC) to characterise synoptic-scale variation in 500-hPa geopotential heights over the region. This set of archetypal synoptic patterns was developed at the NWCC by fire weather meteorologist Terry Marsha in the late 1980s and early 1990s. Although the methodology for identifying this particular set of map types is not well documented, there are a number of techniques commonly used to condense gridded 500-hPa geopotential height data into a set of discrete map types, including empirical orthogonal function analysis, k-means clustering and self-organising maps (Grotjahn et al. 2016; Harries and O’Kane 2020). Rather than employing these methods to generate a new set of map types, the present work examines the relationship between a set of 13 operational map types and wildfire occurrence to provide value in NWCC wildfire forecasting operations.
This scientific co-production grew out of stakeholder engagement conducted as part of a larger National Science Foundation (NSF) convergence research effort focused on projecting future wildland fire occurrence and impacts in the western US (Cullen et al. 2023). We build on the deep qualitative understanding of synoptic map types leveraged by fire weather forecasters at the NWCC by assessing the quantitative relationships between 500-hPa map types, surface-based fire danger indices and wildfire occurrence. We investigate three main research questions: (1) which 500-hPa map types are associated with large fires and widespread fire outbreaks? (2) How do 500-hPa map types correlate to regional fire danger indices? (3) How can 500-hPa map types augment subregional models of wildfire risk?
Materials and methods
Study area
Our study area is composed of the 12 predictive service areas (PSAs) in the Northwest geographic area, which encompasses the states of Washington and Oregon in the northwestern United States. PSAs represent the spatial unit at which the NWCC and other regional coordination centres produce both seasonal and subseasonal fire weather forecasts. In the NWCC, PSA boundaries were drawn to encompass Remote Automatic Weather Stations (RAWSs) with highly correlated measurements of daily minimum relative humidity (Marsha 2014). The study period spans the 20 fire seasons from 2001 to 2020, with earlier years excluded owing to inconsistencies in the RAWS data. We define the fire season to include the months of June through September, which account for 84% of all fires and 91% of the burned area in the region over the study period.
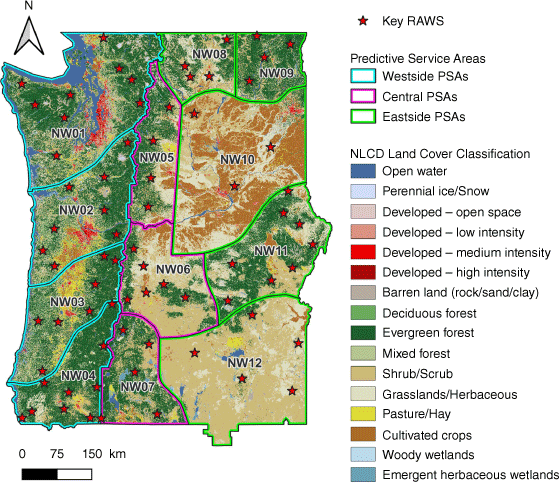
The 12 PSAs in the Northwest are grouped into three broad regions: westside, central and eastside (see Fig. 1). The four westside PSAs (NW01–NW04) include the most densely populated areas in the region as well as the moist coniferous forests of the Olympic Peninsula and the western slopes of the Cascades. NW04, located in southwest Oregon, is more mountainous than the other westside PSAs owing to its inclusion of the northern Klamath Mountains. The three central PSAs (NW05–NW07) lie in the rain shadow of the Cascades and are dominated by dry coniferous forests. The five eastside PSAs (NW08–NW12) are more varied: NW08, NW09 and NW11 are mountainous, whereas NW10 and NW12 include significant areas of shrubland, grassland and cultivated crops.
Predictive Service Areas (PSAs) of the Northwest geographic area and land cover classifications from the 2011 National Land Cover Database (NLCD), with key RAWSs used to calculate daily fire danger in each PSA indicated.
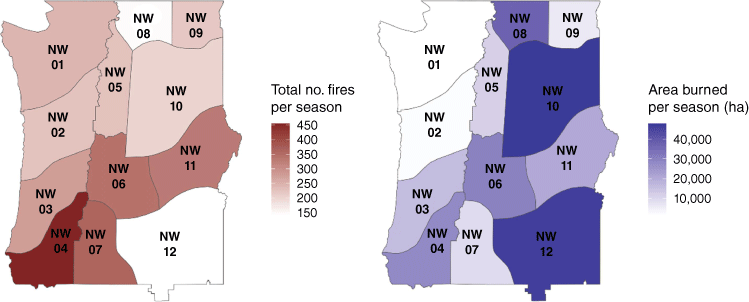
The PSAs vary greatly both in terms of number of annual fires and area burned (Fig. 2). The heavily populated westside PSAs of NW01 and NW02 have the smallest annual burn areas despite their moderate ignition counts, indicating that fires that ignite in these areas do not grow beyond a fairly small size. In contrast, average fire sizes are much larger in the eastside PSAs of NW10 and NW12, which experience the largest annual burn areas resulting from relatively few annual fires. These differences in average fire size are likely due to variation in both landcover and wildfire suppression priorities.
Data
In this study, we construct and analyse a longitudinal dataset combining daily wildfire occurrence data with 500-hPa map types and fire danger indices. Data on the occurrence of wildfires are drawn from the Fire Program Analysis fire-occurrence database (Short 2022). Each fire in the dataset includes a point of origin, discovery date and final burned area. Wildfires are spatially matched to PSAs using their point of origin. We further classify fires as ‘large’ based on whether their final size exceeds the operational threshold for significant fires, which is defined as fires that are likely to require the mobilisation of outside resources (Marsha 2014). In the Northwest, significant fires are identified as those exceeding PSA-specific size thresholds (Table 1), which approximately correspond to historical 95th percentile fire sizes within each PSA. Focusing on fires that are relatively large within a given region, in addition to considering total ignition counts, is of operational significance because these large fires require the largest amount of suppression resources (Nagy et al. 2018).
| Predictive service area | Significant fire size (hectares) | |
|---|---|---|
| NW01 | 40.47 | |
| NW02 | 40.47 | |
| NW03 | 40.47 | |
| NW04 | 40.47 | |
| NW05 | 323.75 | |
| NW06 | 809.37 | |
| NW07 | 40.47 | |
| NW08 | 890.31 | |
| NW09 | 40.47 | |
| NW10 | 1011.71 | |
| NW11 | 202.34 | |
| NW12 | 4046.86 |
Following the protocol used operationally by the NWCC, the 500-hPa maps assessed in this study are centred over the Northwest geographic area, with a geographical extent of 110°–135°W longitude and 35°–55°N latitude. Geopotential heights are sampled at 30 points across this area at five-degree increments from Global Forecast System (GFS) initialisations at 00Z, which corresponds to 5:00 pm local time (i.e. Pacific Daylight Time) during the fire season. This 30-point grid, which is relatively coarse compared with currently available weather products, was adopted by the NWCC in the late 1980s owing to data availability and computational limitations. This spatiotemporal sampling methodology has been used operationally by the NWCC since the early 1990s and captures much of the synoptic-scale variation in the region.
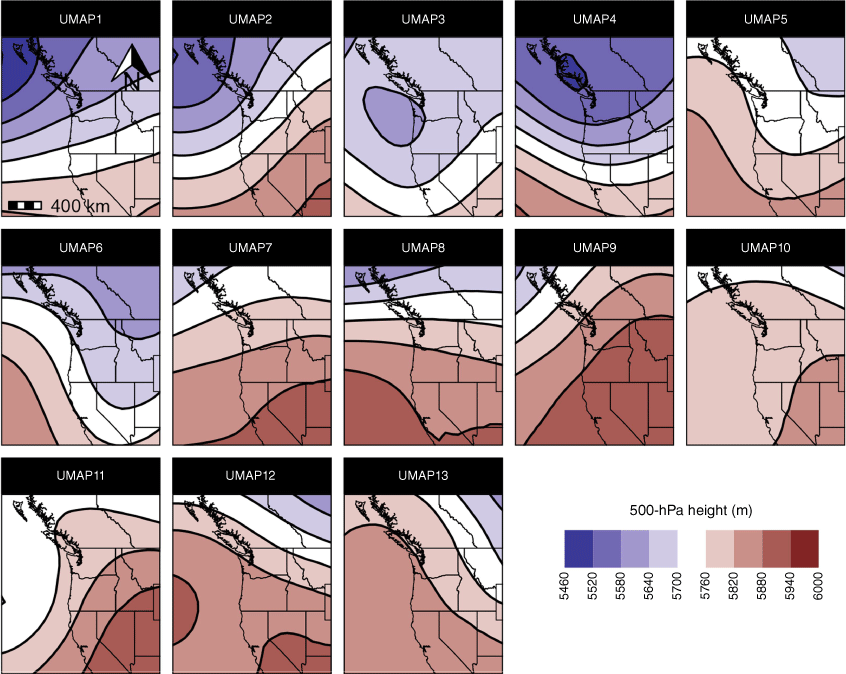
The 500-hPa geopotential heights for a given day are correlated against a set of 13 operational map type templates (Fig. 3), and the map type that is most highly correlated with a given day’s geopotential heights is selected to represent that day. This set of 13 map types was developed by fire meteorologists at the NWCC to characterise the region’s major synoptic-scale patterns. The map types (UMAPs) can be subdivided into several groups based on their dominant synoptic patterns. UMAP 1 and UMAP 2 both feature offshore upper-level troughs that drive southwesterly winds and precipitation. UMAP 3 through UMAP 6 are characterised by troughs over the Pacific Northwest and cooler temperatures. UMAP 7 and UMAP 8 indicate zonal and split flow, respectively, and suggest onshore winds and mild temperatures. Finally, UMAP 9 through UMAP 13 are ridging patterns, associated with higher temperatures and dry conditions.
Thirteen 500-hPa map types used operationally by the NWCC for fire weather forecasting. The 30-point geopotential height data used for matching have been smoothed by taking a composite of 1-degree ERA5 geopotential heights from days that match to each map type over the study period.
Our analyses test 10 standard fire danger indices for both correlation with the 500-hPa map types and their utility in forecasting wildfire occurrence. Four of these, Energy Release Component (ERC), Spread Component (SC), Burning Index (BI) and Ignition Component (IC), are composite fire danger indices that are part of the National Fire Danger Rating System (National Wildfire Coordinating Group 2002). Four are fuel moisture indices, which include 100-hour fuel moisture content (F100) for small-diameter dead fuels, 1000-hour fuel moisture content (F1000) for larger-diameter dead fuels, herbaceous fuel moisture (FMH) for live herbaceous vegetation and woody fuel moisture (FMW) for live woody vegetation. Additionally, we consider daily maximum vapour pressure deficit (VPDM) and the Keetch–Byram Drought Index (KBDI).
Each of the 10 fire danger indices is calculated daily for each PSA. Weather metrics including daily maximum temperature, minimum relative humidity, precipitation duration and VPDM are measured at key RAWSs within each PSA, shown in Fig. 1. There are 72 key RAWSs in the Northwest, with each PSA represented by between three and nine RAWS. The RAWS density is fairly high in most of the Northwest, and the selection of the key RAWSs for each PSA in the Northwest was optimised by NWCC fire weather meteorologists in 2001 (Brown et al. 2011). The RAWS observations serve as inputs to the FireFamilyPlus software (Bradshaw and McCormick 2000), which generates daily fire danger indices for each PSA using equations from the 2016 version of the National Fire Danger Rating System (NFDRS).
To quantify the value added by incorporating map types into predictive models of large wildfire, we establish a baseline using historical 7-Day Significant Fire Potential Outlooks (SFPOs) issued for the Northwest geographic area from 2006 to 2020. Although these outlooks have shifted from a nine-level qualitative scale to a five-level qualitative scale over the history of the SFPO, both coding schemes include a critical threshold at which the expected probability of significant wildfire exceeds 20% on a given day. In our assessment of the value added to fire weather forecasting by incorporating 500-hPa map types, we therefore flatten the qualitative SFPOs to a binary value for each day that indicates whether the forecast probability of a large fire was below or above this 20% threshold.
Statistical approach
To address our first research question, which compares the regional incidence of large fires and widespread fire outbreaks among 500-hPa map types, we consider two outcomes: (i) the probability that a large wildfire will ignite on a given day, and (ii) the probability that a high number of ignitions will occur on a given day. Our analysis of the probability of large wildfire is conducted using PSA-specific size thresholds. That is, if a fire that ultimately exceeds the size threshold for the PSA in which the fire ignites on a given day, that day is designated as a ‘large fire’ day. For the second measure of risk, we define ‘high ignition’ days as those with ignition counts at or above the 80th percentile, which corresponds to days with 33 or more ignitions across the entire GACC. The statistical significance of variation between map types in the frequency of high-ignition days and days with large fires is assessed using a chi-square test.
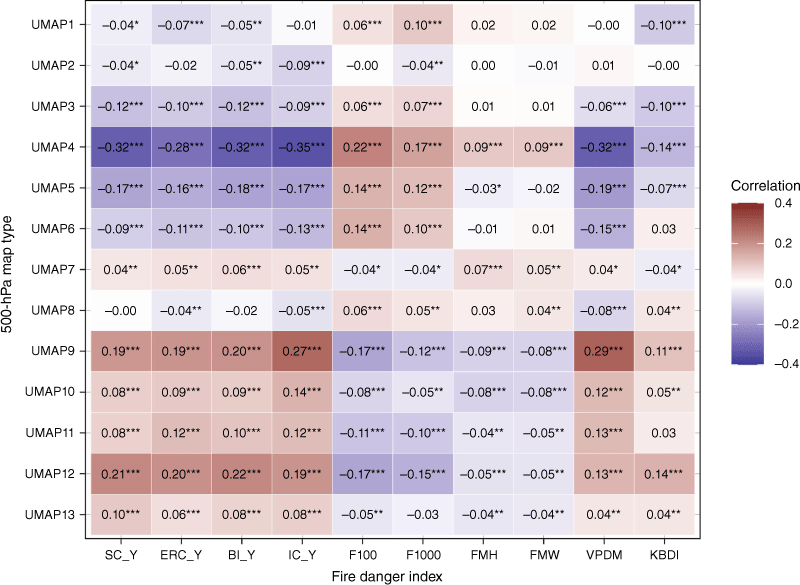
Our second research question examines the relationship between the 500-hPa map types and fire danger indices. This analysis is conducted at the GACC level by calculating aggregate fire danger for the entire geographic area using the area-weighted mean of daily PSA-level indices. We then estimate Pearson correlation coefficients between a set of dichotomous map type indicators and each fire danger index. These correlations allow us to determine whether there is a statistically significant difference (P < 0.05) in fire danger between days associated with a given map type and days when a different map type is observed.
Our third research question assesses the value of the 500-hPa map types in augmenting subregional models of wildfire risk. In this analysis, we compare the performance of statistical models for two different PSA-level outcomes: (i) the total number of ignitions on each day, and (ii) the probability of a large fire igniting on each day. The models of total daily ignitions are estimated using negative binomial regression, which is appropriate for overdispersed count data and performs well in this empirical context (Arienti et al. 2009). The models of the probability of a large fire igniting on a given day are estimated using logistic regression, which is commonly used to model binary outcomes (Andrews et al. 2003).
For each outcome and PSA, we test a set of 10 fire-danger-only models and a set of 10 with-map-type models. In the fire-danger-only models, the outcome of interest is modelled using each of the 10 fire danger indices, in turn, as a predictor. The 10 with-map-type models build on the fire-danger-only models by pairing each of the 10 fire danger indices with a set of daily map type indicators. After fitting each set of candidate models, we identify the most predictive model by comparing Akaike weights between the models. Akaike weights compare the Akaike information criterion (AIC) of each candidate model against the model with the lowest AIC, estimating the probability that each model provides the best fit within the set of candidate models (Wagenmakers and Farrell 2004).
Finally, we assess the predictive value added by the map types by evaluating how our logistic models of large fire improve on the accuracy of historical SFPOs. We evaluate the forecasts using two metrics: the false alarm rate and the miss rate. The false alarm rate is calculated by dividing the number of false positives (days when large fires were predicted but did not occur) by the total number of days when large fires were predicted. The miss rate is calculated by dividing the number of false negatives (days when large fires were not predicted but did occur) by the total number of days when large fires occurred. We calculate both metrics first for the historical SFPOs and then for forecasts that augment the SFPOs with the output of our logistic models of large fire. The difference between these two sets of metrics represents the operational value added by incorporating map types into forecasts of large wildfire.
Results
Regional association between 500-hPa map types and wildfire risk
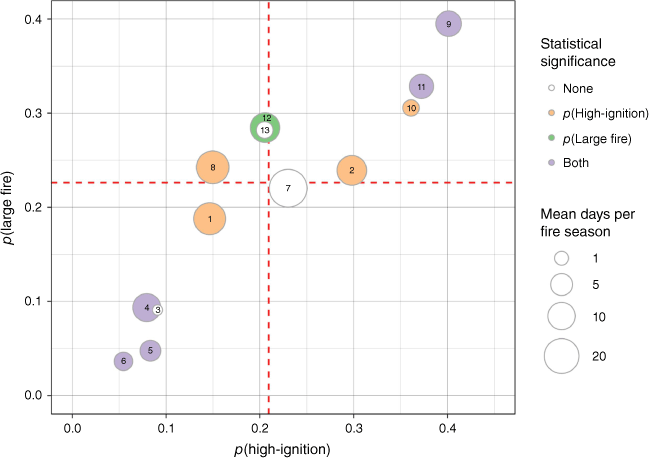
At the regional level, there is notable variation between map types in both the probability of observing a high-ignition day and the probability of a large fire igniting, as shown in Fig. 4. The three map types in the top-right quadrant of the graph (UMAPs 9–11) are all ridging patterns associated with elevated probabilities of both high ignition counts and large fires. Statistically significant (P < 0.05) increases in high-ignition days are observed for UMAP 2 and UMAPs 9–11, whereas UMAPs 9, 11 and 12 have significantly more days with large fires. In contrast, the patterns corresponding to upper-level troughs (UMAPs 3–6) have the lowest probability of high ignition counts and large fire. UMAPs 1, 4–6 and 8 have significantly fewer high-ignition days, and UMAPs 4–6 have significantly fewer days with large fires.
GACC-level wildfire risk for days when each map type is observed. Vertical axis shows the daily probability of a large wildfire, as defined using operational thresholds, starting when each map type is observed. Horizontal axis shows the probability of a high-ignition day, defined as days with ignition counts at or above the 80th percentile. Numbers within circles indicate daily map type. Size of circles indicates the average number of days that each map type was observed each fire season. The colour of each circle indicates whether the difference between each map type and all other map types is statistically significant (P < 0.05) using a chi-square test. Dashed lines show the probability of large fire and 80th percentile ignition counts on all days.
The map types are also associated with significant variability in regional fire danger indices. Fig. 5 shows the correlations between GACC-level fire danger indices and daily assigned 500-hPa map types. The trough patterns (UMAPs 3–6) are observed to have strongly significant negative associations with the NFDRS fire danger indices (SC, ERC, BI and IC) and generally positive associations with the fuel moisture indices (F100, F1000, FMH and FMW). The ridge patterns (UMAPs 9–13) illustrate the inverse pattern of correlation: these map types are associated with high fire danger and low fuel moisture. The offshore troughs (UMAPs 1–2), zonal flow (UMAP 7) and split flow (UMAP 8) patterns deviate less significantly from average levels of fire danger and fuel moisture.
Augmenting subregional models with 500-hPa map types
Our model selection procedure indicates that the inclusion of map type effects offers a significant improvement in the performance of daily PSA-level ignition count models. The top panel of Table 2 shows the Akaike weights for the fire-danger-only models (rows 1–10) and the with-map-type models (rows 11–20). The best-performing model among the fire-danger-only and the with-map-type models is highlighted in grey for each PSA. For the ignition count models, the preferred fire danger index does not change between the fire-danger-only and the with-map-type models. ERC and VPDM are the preferred fire danger indices for the majority of PSAs, whereas F1000 is most predictive in the NW04 and NW11 PSAs. Finally, the bottom panel of Table 2 shows the Akaike weight comparison between the best fire-danger-only and the best with-map-type model for each PSA. For all PSAs, the models that include map type indicators outperform those that rely on fire danger indices alone.
| Model specification | NW01 | NW02 | NW03 | NW04 | NW05 | NW06 | NW07 | NW08 | NW09 | NW10 | NW11 | NW12 | |
|---|---|---|---|---|---|---|---|---|---|---|---|---|---|
| Ignitions = f(SC_Y) | 0.00 | 0.00 | 0.00 | 0.00 | 0.00 | 0.00 | 0.00 | 0.00 | 0.00 | 0.00 | 0.00 | 0.00 | |
| Ignitions = f(ERC_Y) | 1.00 | 1.00 | 1.00 | 0.00 | 0.00 | 0.00 | 0.00 | 0.00 | 0.00 | 0.00 | 0.00 | 0.00 | |
| ignitions = f(BI_Y) | 0.00 | 0.00 | 0.00 | 0.00 | 0.00 | 0.00 | 0.00 | 0.00 | 0.00 | 0.00 | 0.00 | 0.00 | |
| Ignitions = f(IC_Y) | 0.00 | 0.00 | 0.00 | 0.00 | 0.00 | 0.00 | 0.00 | 0.00 | 0.00 | 0.00 | 0.00 | 0.00 | |
| Ignitions = f(F100) | 0.00 | 0.00 | 0.00 | 0.00 | 0.00 | 0.00 | 0.00 | 0.00 | 0.00 | 0.00 | 0.00 | 0.00 | |
| Ignitions = f(F1000) | 0.00 | 0.00 | 0.00 | 1.00 | 0.00 | 0.00 | 0.00 | 0.00 | 0.00 | 0.00 | 1.00 | 0.00 | |
| Ignitions = f(FMH) | 0.00 | 0.00 | 0.00 | 0.00 | 0.00 | 0.00 | 0.00 | 0.00 | 0.00 | 0.00 | 0.00 | 0.00 | |
| Ignitions = f(FMW) | 0.00 | 0.00 | 0.00 | 0.00 | 0.00 | 0.00 | 0.00 | 0.00 | 0.00 | 0.00 | 0.00 | 0.00 | |
| Ignitions = f(VPDM) | 0.00 | 0.00 | 0.00 | 0.00 | 1.00 | 1.00 | 1.00 | 1.00 | 1.00 | 1.00 | 0.00 | 1.00 | |
| Ignitions = f(KBDI) | 0.00 | 0.00 | 0.00 | 0.00 | 0.00 | 0.00 | 0.00 | 0.00 | 0.00 | 0.00 | 0.00 | 0.00 | |
| Ignitions = f(UMAP, SC_Y) | 0.00 | 0.00 | 0.00 | 0.00 | 0.00 | 0.00 | 0.00 | 0.00 | 0.00 | 0.00 | 0.00 | 0.00 | |
| Ignitions = f(UMAP, ERC_Y) | 1.00 | 1.00 | 1.00 | 0.00 | 0.00 | 0.00 | 0.00 | 0.00 | 0.00 | 0.00 | 0.00 | 0.00 | |
| Ignitions = f(UMAP, BI_Y) | 0.00 | 0.00 | 0.00 | 0.00 | 0.00 | 0.00 | 0.00 | 0.00 | 0.00 | 0.00 | 0.00 | 0.00 | |
| Ignitions = f(UMAP, IC_Y) | 0.00 | 0.00 | 0.00 | 0.00 | 0.00 | 0.00 | 0.00 | 0.00 | 0.00 | 0.00 | 0.00 | 0.00 | |
| Ignitions = f(UMAP, F100) | 0.00 | 0.00 | 0.00 | 0.00 | 0.00 | 0.00 | 0.00 | 0.00 | 0.00 | 0.00 | 0.00 | 0.00 | |
| Ignitions = f(UMAP, F1000) | 0.00 | 0.00 | 0.00 | 1.00 | 0.00 | 0.00 | 0.00 | 0.00 | 0.00 | 0.00 | 1.00 | 0.00 | |
| Ignitions = f(UMAP, FMH) | 0.00 | 0.00 | 0.00 | 0.00 | 0.00 | 0.00 | 0.00 | 0.00 | 0.00 | 0.00 | 0.00 | 0.00 | |
| Ignitions = f(UMAP, FMW) | 0.00 | 0.00 | 0.00 | 0.00 | 0.00 | 0.00 | 0.00 | 0.00 | 0.00 | 0.00 | 0.00 | 0.00 | |
| Ignitions = f(UMAP, VPDM) | 0.00 | 0.00 | 0.00 | 0.00 | 1.00 | 1.00 | 1.00 | 1.00 | 1.00 | 1.00 | 0.00 | 1.00 | |
| Ignitions = f(UMAP, KBDI) | 0.00 | 0.00 | 0.00 | 0.00 | 0.00 | 0.00 | 0.00 | 0.00 | 0.00 | 0.00 | 0.00 | 0.00 | |
| Ignitions = f(BestFD) | 0.00 | 0.00 | 0.00 | 0.00 | 0.00 | 0.00 | 0.00 | 0.00 | 0.00 | 0.00 | 0.00 | 0.00 | |
| Ignitions = f(UMAP, BestFD) | 1.00 | 1.00 | 1.00 | 1.00 | 1.00 | 1.00 | 1.00 | 1.00 | 1.00 | 1.00 | 1.00 | 1.00 |
Cells indicate the Akaike weights for negative binomial models of ignition counts, with the best-fitting model for each Predictive Service Area (NW01–NW12) in each set highlighted. The first 10 rows correspond to models fitted using each fire danger index, in turn. The second set of 10 models pairs each fire danger index with the set of map type indicators. The final two rows compare the best-fitting fire-danger-only model against the best fitting with-map-type model for each PSA.
The model selection results for the probability of large fire are analogously shown in Table 3. VPDM is the most predictive fire danger index for most PSAs in both the fire-danger-only and with-map-type models. As shown in the lower panel of the table, the inclusion of map type improves the prediction of large fire in 4 of the 12 PSAs. In eight of the PSAs, the additional explanatory power of the map type indicators does not outweigh the model complexity penalty imposed by the AIC estimator. In none of the PSAs were statistically significant map type effects observed in models of the probability of large fire.
| Model specification | NW01 | NW02 | NW03 | NW04 | NW05 | NW06 | NW07 | NW08 | NW09 | NW10 | NW11 | NW12 | |
|---|---|---|---|---|---|---|---|---|---|---|---|---|---|
| Large = f(SC_Y) | 0.03 | 0.09 | 0.48 | 0.00 | 0.00 | 0.00 | 0.00 | 0.00 | 0.12 | 0.00 | 0.00 | 0.00 | |
| Large = f(ERC_Y) | 0.10 | 0.03 | 0.02 | 0.14 | 0.00 | 0.00 | 0.00 | 0.00 | 0.00 | 0.00 | 0.00 | 0.00 | |
| Large = f(BI_Y) | 0.86 | 0.87 | 0.49 | 0.00 | 0.00 | 0.00 | 0.00 | 0.00 | 0.10 | 0.03 | 0.00 | 0.00 | |
| Large = f(IC_Y) | 0.00 | 0.00 | 0.00 | 0.00 | 0.00 | 0.00 | 0.00 | 0.00 | 0.08 | 0.00 | 0.00 | 0.00 | |
| Large = f(F100) | 0.00 | 0.00 | 0.00 | 0.00 | 0.00 | 0.00 | 0.00 | 0.00 | 0.00 | 0.00 | 0.00 | 0.00 | |
| Large = f(F1000) | 0.00 | 0.00 | 0.00 | 0.00 | 0.00 | 0.00 | 0.00 | 0.00 | 0.00 | 0.00 | 0.00 | 0.00 | |
| Large = f(FMH) | 0.00 | 0.00 | 0.00 | 0.00 | 0.00 | 0.00 | 0.00 | 0.00 | 0.00 | 0.00 | 0.00 | 0.00 | |
| Large = f(FMW) | 0.00 | 0.00 | 0.00 | 0.00 | 0.00 | 0.00 | 0.00 | 0.00 | 0.00 | 0.00 | 0.00 | 0.00 | |
| Large = f(VPDM) | 0.00 | 0.00 | 0.01 | 0.85 | 1.00 | 1.00 | 1.00 | 1.00 | 0.70 | 0.97 | 1.00 | 1.00 | |
| Large = f(KBDI) | 0.01 | 0.00 | 0.00 | 0.00 | 0.00 | 0.00 | 0.00 | 0.00 | 0.00 | 0.00 | 0.00 | 0.00 | |
| Large = f(UMAP, SC_Y) | 0.02 | 0.01 | 0.21 | 0.00 | 0.00 | 0.00 | 0.00 | 0.00 | 0.14 | 0.00 | 0.00 | 0.00 | |
| Large = f(UMAP, ERC_Y) | 0.09 | 0.15 | 0.07 | 0.54 | 0.00 | 0.00 | 0.00 | 0.00 | 0.00 | 0.00 | 0.05 | 0.00 | |
| Large = f(UMAP, BI_Y) | 0.48 | 0.83 | 0.57 | 0.02 | 0.00 | 0.00 | 0.00 | 0.00 | 0.12 | 0.02 | 0.00 | 0.00 | |
| Large = f(UMAP, IC_Y) | 0.00 | 0.00 | 0.00 | 0.00 | 0.00 | 0.00 | 0.00 | 0.00 | 0.47 | 0.00 | 0.00 | 0.00 | |
| Large = f(UMAP, F100) | 0.00 | 0.00 | 0.00 | 0.00 | 0.00 | 0.00 | 0.00 | 0.00 | 0.00 | 0.00 | 0.00 | 0.00 | |
| Large = f(UMAP, F1000) | 0.00 | 0.00 | 0.00 | 0.08 | 0.00 | 0.00 | 0.00 | 0.00 | 0.00 | 0.00 | 0.00 | 0.00 | |
| Large = f(UMAP, FMH) | 0.00 | 0.00 | 0.00 | 0.00 | 0.00 | 0.00 | 0.00 | 0.00 | 0.00 | 0.00 | 0.00 | 0.00 | |
| Large = f(UMAP, FMW) | 0.00 | 0.00 | 0.00 | 0.00 | 0.00 | 0.00 | 0.00 | 0.00 | 0.00 | 0.00 | 0.00 | 0.00 | |
| Large = f(UMAP, VPDM) | 0.00 | 0.00 | 0.02 | 0.37 | 1.00 | 1.00 | 1.00 | 0.99 | 0.27 | 0.98 | 0.95 | 1.00 | |
| Large = f(UMAP, KBDI) | 0.40 | 0.00 | 0.12 | 0.00 | 0.00 | 0.00 | 0.00 | 0.00 | 0.00 | 0.00 | 0.00 | 0.00 | |
| Large = f(BestFD) | 1.00 | 0.96 | 1.00 | 0.99 | 0.00 | 0.01 | 0.87 | 0.75 | 0.87 | 0.03 | 0.00 | 0.85 | |
| Large = f(UMAP, BestFD) | 0.00 | 0.04 | 0.00 | 0.01 | 1.00 | 0.99 | 0.13 | 0.25 | 0.13 | 0.97 | 1.00 | 0.15 |
Cells indicate the Akaike weights for logistic models of large wildfire, with the best-fitting model for each Predictive Service Area (NW01–NW12) in each set highlighted. The first 10 rows correspond to models fitted using each fire danger index, in turn. The second set of 10 models pairs each fire danger index with the set of map type indicators. The final two rows compare the best-fitting fire-danger-only model against the best fitting with-map-type model for each PSA.
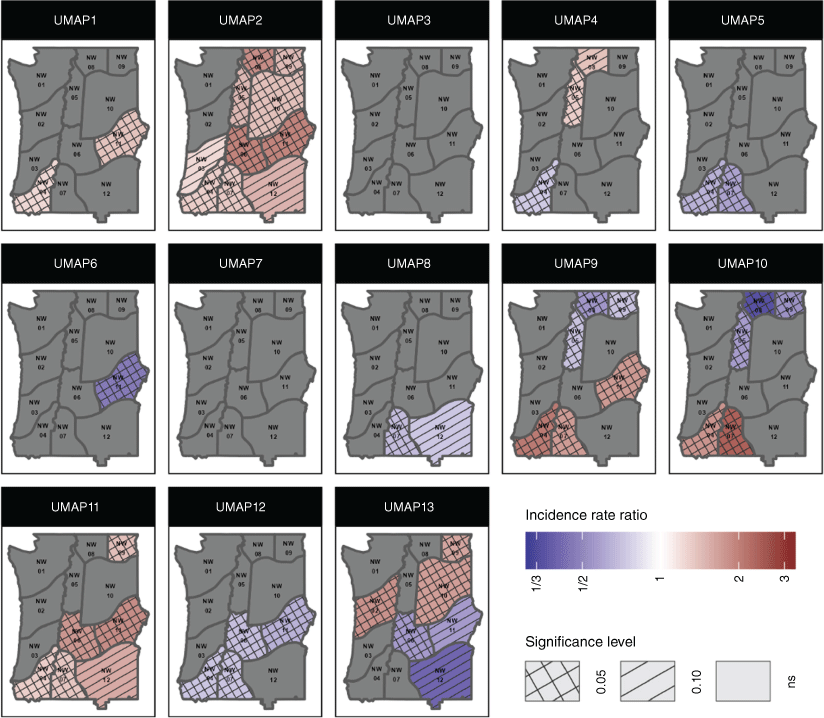
Map-type effects for the best-performing models of total daily ignitions are estimated as incidence rate ratios and displayed for each PSA in Fig. 6. These incidence rate ratios indicate how many times more (or fewer) ignitions occurred when each map type was observed relative to what would be expected when a different map type occurred on a day with the same level of fire danger. Notably, the PSAs in eastern Washington and all of Oregon have significantly higher expected daily ignitions on days when UMAP 2, the offshore trough, was observed, experiencing between 1.23 and 1.98 times higher ignition counts than expected given the fire danger. The ridging patterns (UMAPs 9–13) were notably heterogeneous in their effects, particularly in southwestern Oregon. Whereas UMAPs 9–11 were associated with an increase in conditional ignitions in the NW04 and NW07 PSAs, UMAP 12 was associated with fewer ignitions than expected in these PSAs.
PSA-level incidence rate ratios for the map types, controlling for daily fire danger index, year and day of week. These effects indicate the factor by which observing each map type shifts expected daily ignition counts in each PSA based on fire danger indices alone. The statistical significance of these effects is indicated by hatching (ns, not significant).
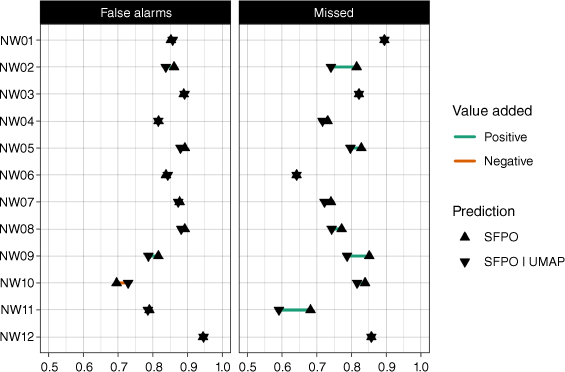
Our assessment of the value added by incorporating map types into the forecasting of large fires indicates that our logistic models reduce the miss rate in 8 of the 12 PSAs, while increasing the false alarm rate in only five PSAs. Fig. 7 shows the false alarm and miss rates for both the historical SFPOs and a forecast constructed by taking the union of the SFPO and with-map-type logistic models of large wildfire. That is, a large fire is forecast if either the SFPO or our logistic models incorporating map types indicate a 20% or greater predicted probability of large fire. The horizontal lines in Fig. 7 show the direction of change in the false alarm and miss rates from the historical SFPOs to the forecasts constructed by combining the SFPOs with the output of our logistic models. Reductions in the false alarm and miss rates are plotted in green and represent positive values added by the logistic models, whereas increases in the false alarm and miss rates are shown in purple. The greatest reduction in the miss rate is achieved in NW11, where the logistic models correctly identify six large wildfires that the SFPOs missed out of the 66 total.
Comparison of false alarm and miss rates for large fires between historical Significant Fire Potential Outlooks (SFPOs) and predictions that also incorporate the results of the with-map-type logistic models presented here, for each of the 12 predictive service areas in the Northwest (NW01–NW12). Reductions in the false alarm and miss rates represent positive value added by the logistic models and are indicated by green lines. Increases in the false alarm and miss rates due to the incorporation of the logistic models are shown in purple.
Discussion and conclusions
This research demonstrates that the set of 500-hPa map types currently utilised by Predictive Services at the NWCC has predictive value that can supplement the use of fire danger indices in near-term wildfire forecasting. These map types resolve subtypes within broad synoptic patterns (e.g. upper-air ridges and troughs) that have spatially heterogeneous effects on daily ignition counts. The map type effects estimated in our analysis shift expectations of ignition counts conditioned on surface-based fire danger indices alone. Additionally, forecasts of significant wildfire that incorporate our logistic models improve on the accuracy of historical SFPOs.
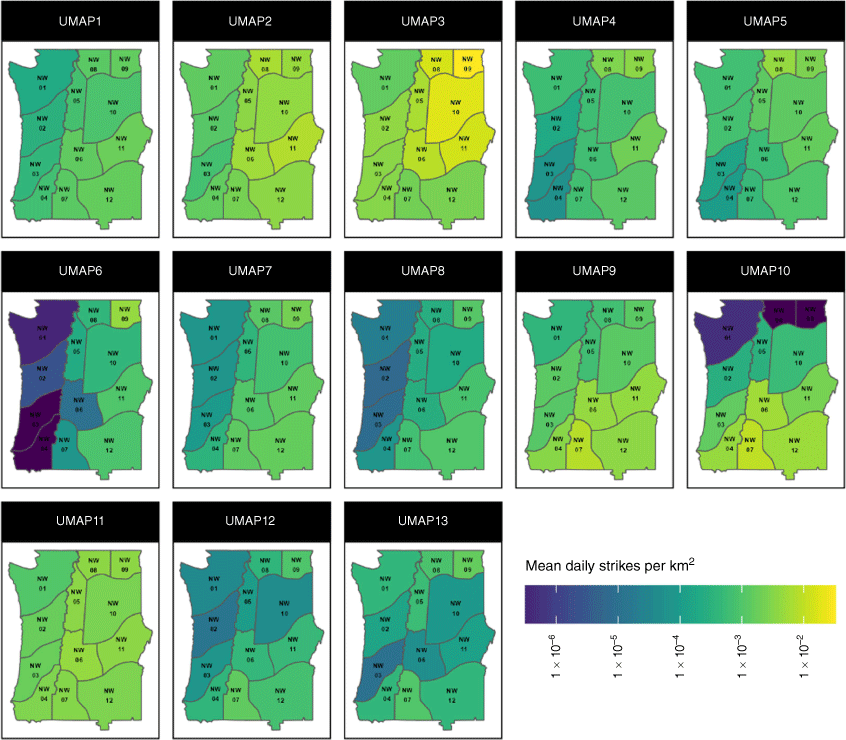
This study extends prior research by isolating the predictive value added by incorporating synoptic map typing into short-term spatially explicit wildfire forecasting in the northwestern US. Our subregional models demonstrate that synoptic patterns explain variation in ignition counts that is not captured by fire danger indices alone. Similarly to earlier studies linking daily synoptic patterns to surface-based fire danger indices (Newark 1975; Crimmins 2006), we find that severe fire weather is associated with ridging patterns. Also consistent with prior research (Skinner et al. 2002; Gedalof et al. 2005; Sharma et al. 2022), our analysis finds that positive anomalies in the 500-hPa geopotential heights are associated with increased wildfire activity. Although the impact of positive height anomalies on wildfire occurrence is reflected in fire danger indices, we find that offshore troughs, exemplified by UMAP 2, are associated with both heightened wildfire risk and lower values of surface-based fire danger indices. These results may be explained by increased lightning activity associated with these patterns, which is observed during our study period when UMAP 2 occurs (see Fig. A1). Rorig and Ferguson (1999) identify a similar synoptic pattern as being associated with dry lightning events.
Although this set of map types is useful in forecasting ignition counts, they are less informative for predicting the occurrence of large fires. This is likely because the growth of fires to reach operational thresholds and become large often occurs over multiple days (Podschwit et al. 2018). Specifically, whether a fire grows is contingent on a number of factors, including the weather on days subsequent to ignition (Potter and McEvoy 2021) as well as fuel dryness and continuity (Barbero et al. 2014). Despite the lack of statistical significance in the logistic models of large fire, we find that using these models improves on the performance of historical SFPOs. This formal modelling complements and reinforces the qualitative understanding that fire weather meteorologists have of the impact of these map types on wildfire occurrence. Incorporating this set of discrete synoptic patterns into ignition count models improves the specificity of fire weather forecasts over models built using fire danger indices alone.
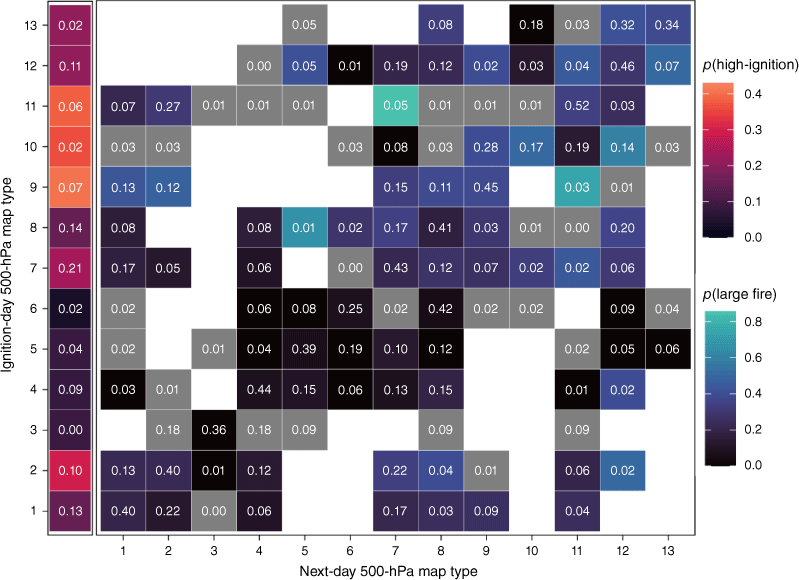
The effects of synoptic patterns that evolve over multiple days can be explored by considering transitions between map types. We conducted analyses to assess how the impact of a given map type was moderated by the next-day map type (see Fig. A2). Visual inspection of these transitions suggests that considering 2-day sequences may uncover moderating effects. However, one statistical challenge posed by this approach is the large number of possible transitions between map types and the small number of observations of each, which reduces statistical power to detect significant effects. Additionally, considering 2-day sequences may exacerbate the measurement error in both identifying when transitions occurred and when fires ignited.
Future work in this area may focus on trade-offs between the simplicity and interpretability of a set of synoptic map types and their explanatory power. Specifically, several of the map types in this set of 13 appear to exert similar effects on wildfire and may be combined. Alternatively, other dimensionality reduction methods may be employed to identify synoptic states that operate on larger or different geographic areas. Our approach has generated interest from Predictive Service units in other regions, demonstrating the potential of our co-production approach to be applied in other geographic areas to identify the unique and complex influence of synoptic patterns in those domains.
Data availability
The data that support this study will be shared upon reasonable request to the corresponding author.
Declaration of funding
This research was funded by the US National Science Foundation Growing Convergence Research program, grant no. 2019762.
References
Abatzoglou JT, Battisti DS, Williams AP, Hansen WD, Harvey BJ, Kolden CA (2021) Projected increases in western US forest fire despite growing fuel constraints. Communications Earth & Environment 2(1), 227.
| Crossref | Google Scholar |
Andrews PL, Loftsgaarden DO, Bradshaw LS (2003) Evaluation of fire danger rating indexes using logistic regression and percentile analysis. International Journal of Wildland Fire 12, 213-226.
| Crossref | Google Scholar |
Arienti MC, Cumming SG, Krawchuk MA, Boutin S (2009) Road network density correlated with increased lightning fire incidence in the Canadian western boreal forest. International Journal of Wildland Fire 18, 970-982.
| Crossref | Google Scholar |
Barbero R, Abatzoglou JT, Steel EA, K Larkin N (2014) Modeling very large-fire occurrences over the continental United States from weather and climate forcing. Environmental Research Letters 9, 124009.
| Crossref | Google Scholar |
Cohen JD, Deeming JE (1985) The national fire-danger rating system: basic equations. PSW-GTR-82. (USDA Forest Service, Pacific Southwest Forest and Range Experiment Station: Berkeley, CA) 10.2737/PSW-GTR-82
Crimmins MA (2006) Synoptic climatology of extreme fire-weather conditions across the southwest United States. International Journal of Climatology 26, 1001-1016.
| Crossref | Google Scholar |
Cullen AC, Prichard SJ, Abatzoglou JT, Dolk A, Kessenich L, Bloem S, Bukovsky MS, Humphrey R, McGinnis S, Skinner H, Mearns LO (2023) Growing convergence research: coproducing climate projections to inform proactive decisions for managing simultaneous wildfire risk. Risk Analysis 43, 2262-2279.
| Crossref | Google Scholar | PubMed |
Gedalof Z, Peterson DL, Mantua NJ (2005) Atmospheric, climatic, and ecological controls on extreme wildfire years in the Northwestern United States. Ecological Applications 15, 154-174.
| Crossref | Google Scholar |
Grotjahn R, Black R, Leung R, Wehner MF, Barlow M, Bosilovich M, Gershunov A, Gutowski WJ, Gyakum JR, Katz RW, Lee Y-Y, Lim Y-K, Prabhat (2016) North American extreme temperature events and related large scale meteorological patterns: a review of statistical methods, dynamics, modeling, and trends. Climate Dynamics 46, 1151-1184.
| Crossref | Google Scholar |
Harries D, O’Kane TJ (2020) Applications of matrix factorization methods to climate data. Nonlinear Processes in Geophysics 27, 453-471.
| Crossref | Google Scholar |
Jones MW, Abatzoglou JT, Veraverbeke S, Andela N, Lasslop G, Forkel M, Smith AJP, et al. (2022) Global and regional trends and drivers of fire under climate change. Reviews of Geophysics 60(3), e2020RG000726.
| Crossref | Google Scholar |
Kalashnikov DA, Abatzoglou JT, Nauslar NJ, Swain DL, Touma D, Singh D (2022) Meteorological and geographical factors associated with dry lightning in central and northern California. Environmental Research: Climate 1, 025001.
| Crossref | Google Scholar |
Marsha T (2014) ‘Fire Danger Rating Operations Plan 2014.’ (Northwest Interagency Coordination Center). Available at https://gacc.nifc.gov/nwcc/content/products/fwx/fdrop/FDROP.pdf
McGinnis S, Kessenich L, Mearns L, Cullen A, Podschwit H, Bukovsky M (2023) Future regional increases in simultaneous large Western USA wildfires. International Journal of Wildland Fire 32(9), 1304-1314.
| Crossref | Google Scholar |
Nagy RC, Fusco E, Bradley B, Abatzoglou JT, Balch J (2018) Human-Related Ignitions Increase the Number of Large Wildfires across US Ecoregions. Fire 1, 4.
| Crossref | Google Scholar |
Nauslar NJ, Hatchett BJ, Brown TJ, Kaplan ML, Mejia JF (2019) Impact of the North American monsoon on wildfire activity in the southwest United States. International Journal of Climatology 39, 1539-1554.
| Crossref | Google Scholar |
Newark MJ (1975) The relationship between forest fire occurrence and 500 mb longwave ridging. Atmosphere 13, 26-33.
| Crossref | Google Scholar |
Owen G, McLeod JD, Kolden CA, Ferguson DB, Brown TJ (2012) Wildfire Management and Forecasting Fire Potential: The Roles of Climate Information and Social Networks in the Southwest United States. Weather, Climate, and Society 4, 90-102.
| Crossref | Google Scholar |
Podschwit H, Cullen A (2020) Patterns and trends in simultaneous wildfire activity in the United States from 1984 to 2015. International Journal of Wildland Fire 29, 1057-1071.
| Crossref | Google Scholar |
Podschwit HR, Larkin NK, Steel EA, Cullen A, Alvarado E (2018) Multi-model forecasts of very-large fire occurences during the end of the 21st century. Climate 6, 100.
| Crossref | Google Scholar |
Potter BE, McEvoy D (2021) Weather factors associated with extremely large fires and fire growth days. Earth Interactions 25, 160-176.
| Crossref | Google Scholar |
Preisler HK, Westerling AL, Gebert KM, Munoz-Arriola F, Holmes TP (2011) Spatially explicit forecasts of large wildland fire probability and suppression costs for California. International Journal of Wildland Fire 20, 508-517.
| Crossref | Google Scholar |
Preisler HK, Riley KL, Stonesifer CS, Calkin DE, Jolly WM (2016) Near-term probabilistic forecast of significant wildfire events for the Western United States. International Journal of Wildland Fire 25, 1169-1180.
| Crossref | Google Scholar |
Rorig ML, Ferguson SA (1999) Characteristics of lightning and wildland fire ignition in the Pacific Northwest. Journal of Applied Meteorology 38, 1565-1575.
| Crossref | Google Scholar |
Sharma AR, Jain P, Abatzoglou JT, Flannigan M (2022) Persistent positive anomalies in geopotential heights promote wildfires in Western North America. Journal of Climate 35, 6469-6486.
| Crossref | Google Scholar |
Short KC (2022) Spatial wildfire occurrence data for the United States, 1992-2020 [FPA_FOD_20221014]. Available at https://www.fs.usda.gov/rds/archive/catalog/RDS-2013-0009.6
Skinner WR, Flannigan MD, Stocks BJ, Martell DL, Wotton BM, Todd JB, Mason JA, Logan KA, Bosch EM (2002) A 500-hPa synoptic wildland fire climatology for large Canadian forest fires, 1959-1996. Theoretical and Applied Climatology 71, 157-169.
| Crossref | Google Scholar |
Srock A, Charney J, Potter B, Goodrick S (2018) The Hot-Dry-Windy Index: a new fire weather index. Atmosphere 9, 279.
| Crossref | Google Scholar |
van Wagtendonk JW, Cayan DR (2008) Temporal and spatial distribution of lightning strikes in California in relation to large-scale weather patterns. Fire Ecology 4, 34-56.
| Crossref | Google Scholar |
Wagenmakers E-J, Farrell S (2004) AIC model selection using Akaike weights. Psychonomic Bulletin & Review 11, 192-196.
| Crossref | Google Scholar | PubMed |
Wordell T, Ochoa R (2006) Improved decision support for proactive wildland fire management. Fire Management Today 66, 25-28.
| Google Scholar |
Zhong S, Yu L, Heilman WE, Bian X, Fromm H (2020) Synoptic weather patterns for large wildfires in the northwestern United States – a climatological analysis using three classification methods. Theoretical and Applied Climatology 141, 1057-1073.
| Crossref | Google Scholar |
Appendix
PSA-level lightning strike density by map type. Darker shading indicates fewer daily strikes per square kilometre, while lighter shading indicates higher strike density.
GACC-level wildfire risk by map type transition. The shading of cells in the leftmost column indicates the probability of observing a high-ignition day for each map type, and each cell in this column is labelled with the probability of that map type occurring. The shading of cells in the rightmost 13 columns indicates the probability of a large fire starting given the ignition-day and next-day map types. These cells are labelled with the probability that each next-day map type will occur, conditional on ignition-day map type.
