New Zealanders with low back pain seeking health care: a retrospective descriptive analysis of Accident Compensation Corporation-funded low back pain healthcare service usage
Julia Hill 1 * , Dylan Kay 2 , Jacob Gordon 2 , Imran Khan Niazi 3 4 5 , Nicola Saywell 6
1 Department of Physiotherapy, School of Clinical Sciences, Active Living and Rehabilitation: Aotearoa New Zealand, Auckland University of Technology, New Zealand.
2 Clinical Practice, Auckland, New Zealand.
3 Department of Health Science and Technology, Aalborg University, Aalborg, Denmark.
4 Centre for Chiropractic Research, New Zealand College of Chiropractic, Auckland, New Zealand.
5 Research Innovation Centre, Auckland University of Technology, New Zealand.
6 Department of Physiotherapy, School of Clinical Sciences, Research Innovation Centre, Auckland University of Technology, New Zealand.
Journal of Primary Health Care 15(3) 206-214 https://doi.org/10.1071/HC23010
Published: 29 May 2023
Abstract
Most New Zealanders experience low back pain (LBP) at least once throughout their lifetime and many seek help from the large range of health providers in primary care. Accident Compensation Corporation (ACC) funds a significant proportion of those claims, but which services are they funding and what are the costs?
This was a retrospective audit and descriptive analysis of ACC-funded, non-public hospital healthcare service use by people with LBP in New Zealand (NZ). Outcome measures were the healthcare services accessed by people with ACC-funded LBP,the claims (all occurrences for a service that has generated a payment/year), single contact (with a service), and costs (NZ$) for services between 2009 and 2020.
The number of claims for services were 129 000 for physiotherapy, 105 000 for general practitioner and 59 000 for radiology services. Per single contact, elective surgery and radiology services were the most expensive. During 2009–2020, there were 3.3 million ACC claims for LBP with a total cost of NZ$4 billion. Over this time, there was an increase in claims, costs and single contacts. Costs decreased slightly during 2010 due to changes in healthcare funding and in 2020 due to the COVID-19 pandemic.
Consumers have considerable choice in where they access health care for ACC-funded LBP services. This study shows the services they use most frequently and the cost to NZ for those services. These data can inform service planning for ACC-funded LBP health care in NZ.
Keywords: ACC, claims, costs, disability, general practitioner, healthcare services, low back pain, physiotherapy.
| WHAT GAP THIS FILLS |
| What is already known: Over 50% of people with LBP seek care.15 There is a global rise in LBP disability, often with inappropriate and unnecessary use of healthcare resources.16 |
| What this study adds: In NZ, there are many services available for people with LBP and this study reports on the most used services and the associated costs for ACC-funded LBP health care. |
Introduction
Low back pain (LBP) is considered a global health concern;1 it is the leading cause of disability worldwide and affects more than 560 million people annually.2 In New Zealand (NZ), LBP is the largest cause of disability, affecting most New Zealanders in their lifetime.3 Most acute episodes of LBP will recover quickly;4 however, recurrence is common4–6 and the condition can become chronic, contributing to the large cost of LBP health care.7,8 The estimated overall cost of LBP in NZ in 2015 was almost NZ$3 billion,7 with healthcare services accounting for NZ$325 million. The remaining amount comprised indirect costs such as disability payments and decreased work productivity.7,9 More recent figures (2021–2022)10 indicate the health care portion has increased to over NZ$500 million. The direct health care costs in NZ are funded by several sources (Fig. 1).
Simplified representation of the New Zealand health system until 2022. Note: NZ, New Zealand; ACC, Accident Compensation Corporation; MoH, Ministry of Health; DHBs, District Health Boards. Arrows represent the flow of money/management (for example, the NZ public pays taxes to the NZ Government, which funds and oversees the MoH). Adapted from Gauld.53 *Te Whatu Ora weaves the functions of the 20 former DHBs into regional divisions and district offices allowing national planning to improve continuity of healthcare delivery.
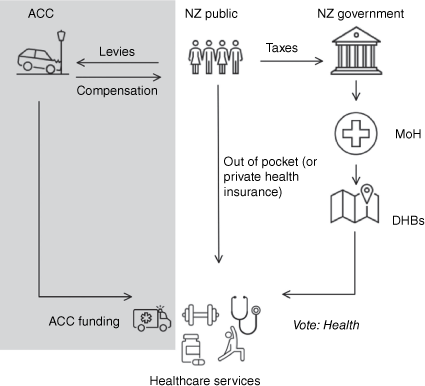
This study will focus on the ACC-funded direct healthcare costs of LBP in NZ (see Fig. 1, shaded area). ACC is a no-fault accidental injury compensation scheme unique to NZ. If an injury occurs due to an accident, ACC may provide compensation for time off work and healthcare service usage (direct healthcare) costs. These equated to an estimated NZ$110 million for LBP in 2015.7,11 In NZ, the first healthcare contact for a person with LBP is a primary healthcare provider. This could be a general practitioner (GP), a physiotherapist or any healthcare professional registered to accept a direct referral.12,13 This means in NZ the GP is frequently not involved in the management of LBP.14 This is in contrast to most developed countries, where the most used healthcare provider for LBP is the GP.17 This study adds to a recent publication of GP service costs from July 2013 to the end of 2020 for people with LBP in NZ.18 The unique healthcare funding model and range of primary healthcare providers means NZ’s pattern of healthcare usage may differ from other countries.
The research questions are:
to determine the most frequently used ACC-funded healthcare services by people with LBP in NZ
to explore trends over time and the associated costs. Data from 2009 to 2020 were included; this is a similar period to those used in other LBP studies which have been able to identify trends over time.19–22
Methods
This was a retrospective audit and descriptive analysis of ACC-funded, non-public hospital healthcare service use by people with LBP in NZ. ACC retains data from individual claims including the type of injury, the individual healthcare service used and associated costs.23 The data are de-identified,24 so neither ethical approval nor informed consent from participants was required for this study. Data were requested directly from ACC in accordance with the Official Information Act (1982), which allows individuals or body corporates to request information held by NZ government agencies.25 The team agreed on data to capture musculo-skeletal LBP and selected READ codes to reflect this. Conditions omitted were those primarily involving bony injury (traumatic fractures), neurological damage (spinal cord injury) and dermatological injury (bites and burns). See Supplementary Table S1 for the list of included READ codes. Information requested included healthcare services used (by single contact, claim and cost) from 2009 to 2021. Data from 2021 were incomplete and therefore omitted from the analysis. We have used the terms ‘claims’ and ‘single contacts’ to measure healthcare service use; the difference between them is outlined in Table 1.
| Term | Definition | |
|---|---|---|
| Claims | An ACC claim for injury can cover multiple years. A claim which lasts longer than 1 year is counted as ‘active’ once for each year covered. For example, a claim which lasted from 2017 to 2020 would be counted a total of four times, once for each year. | |
| Single contactsA | The number of occurrences for each service type. A client may receive multiple service types, such as radiology or physiotherapy and receive multiple sessions of one service type. Therefore, five physiotherapy sessions = five single contacts or one claim. | |
| CostsA | These are exclusive of GST and based on payment date. Payment date may be different to the date of service. All costs in this study refer to New Zealand dollars (NZ$) and have been inflation-adjusted to 2020. | |
| Low back pain (LBP) | When the injury site on the ACC45 form is equal to lower back/spine as defined in READ codes. |
AIn-text, rounded to the nearest hundred thousand.
After initial data exploration, the decision was made to analyse the five most used individual healthcare services, the two services which are most costly per single contact, and the two services which focus on improving quality of life and return to work. The five most used services were physiotherapy, acupuncture, osteopathy, GP and chiropractic. Radiology and surgery had the highest cost per single contact.26,27 Pain management and return to work services were chosen as they have been shown to have a large impact on the quality of life for people with LBP.28,29 Data for the selected healthcare services were extracted from the overall data and similar services were combined. For example, 'physiotherapist,' ‘physiotherapy services’ and ‘endorsed physio’ were originally reported as distinct services in the data but were combined as ‘Physiotherapy’ for the analysis. See Table S2 for a complete list of combined terms for healthcare service descriptions.
Descriptive analysis of the healthcare services was undertaken. Trends were considered from 2009 to 2020 and an analysis of the most recent full year of data (2020) was completed. Graphs were plotted in R (The R Foundation for Statistical Computing, v4.1.0) using package ggplot2 (version 3.3.3). Inflation from each year to the subsequent year was calculated using the Reserve Bank of New Zealand inflation calculator.
Ethics approval and consent to participate were not applicable to this study.
Results
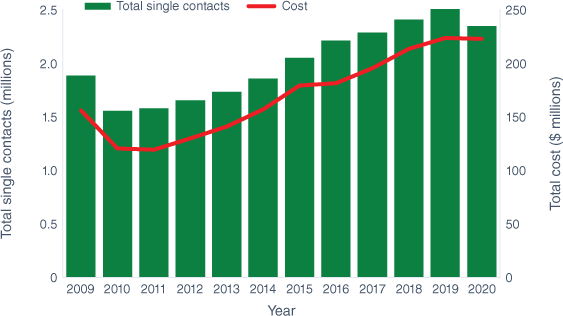
From January 2009 to the end of December 2020, there were 3.3 million ACC-funded LBP claims (this number included claims spanning multiple years; eg an active claim from 2013 to 2017 would be classed as five claims, one for each year; see Table 1) with an approximate cost of NZ$4 billion. Fig. 2 shows the total single contacts and costs for ACC-funded LBP health care during that period. In the most recent year of collected data (2020), there were 304 000 claims, 2.35 million single contacts and a cost of NZ$223 million for ACC-funded LBP healthcare services. When weekly compensation is included, annual costs are NZ$467 million.
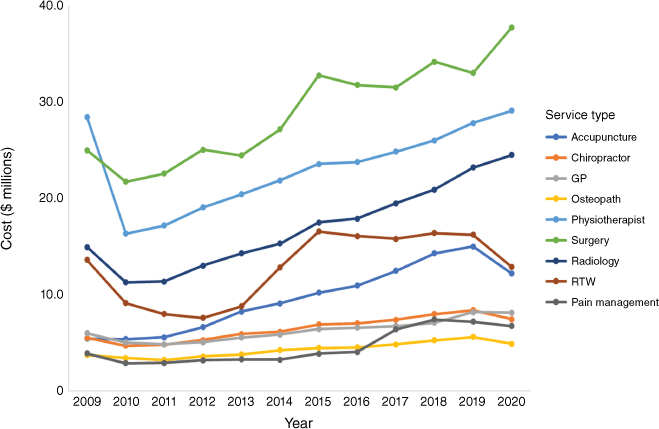
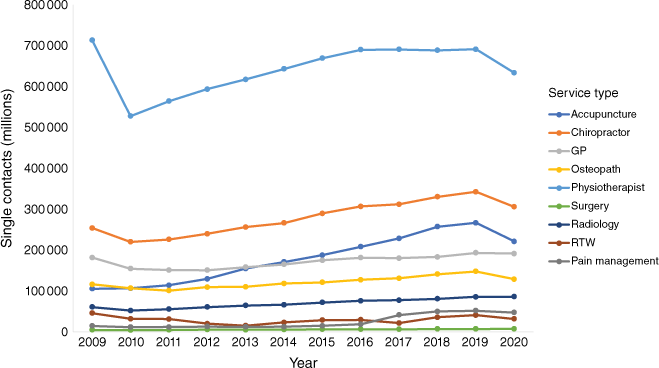
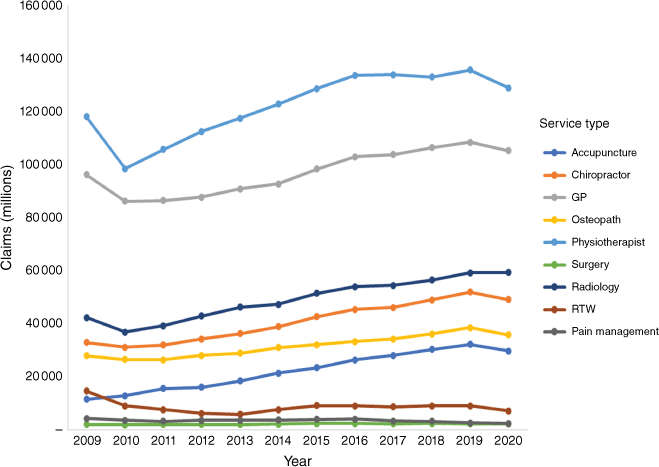
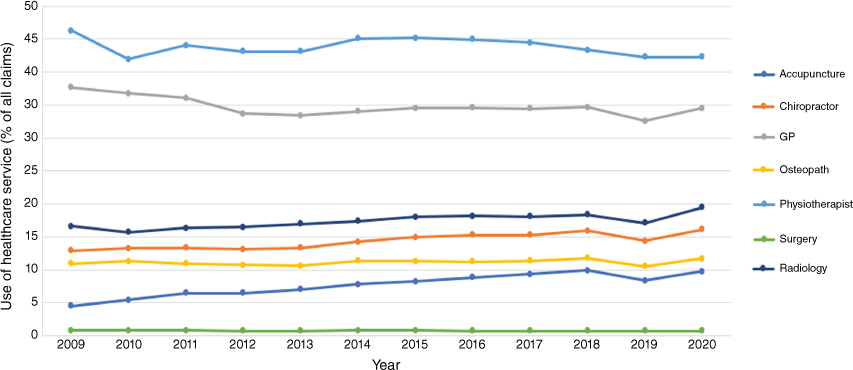
Figs 3, 4 and 5 show the trends in costs, single contacts and claims from 2009 to 2020 for the healthcare services of interest. Between 2009 and 2020, there was an increase in single contacts and total claims (Figs 4 and 5). For the single contacts data, the three most frequently used services in 2020 were physiotherapy (633 000), chiropractic (306 000) and acupuncture services (222 000) (Fig. 4). In 2020, the top three services by claims were physiotherapy (129 000), GP (105 000) and radiology services (59 000) (Fig. 5). Fig. 6 shows the proportion of healthcare service with respect to all claims. The costliest services in annual total cost were elective surgery (NZ$38.2 million), physiotherapy (NZ$29 million) and radiology (NZ$24.5 million) (Fig. 3). Per claim, elective surgery, acupuncture and radiology services were the most expensive (Table 2), and per single contact, elective surgery and radiology were the most expensive. Each healthcare service claim can be made up of several parts. However, these cannot be extracted from the ACC data (detailed data in Tables S3–S6).
| Service | Cost per claim (NZ$) | Cost per single contact (NZ$) | |
|---|---|---|---|
| Elective surgery | 13 465 | 4472 | |
| Acupuncture | 431 | 53 | |
| Radiology | 340 | 238 | |
| Physiotherapy | 188 | 36 | |
| Chiropractice | 158 | 23 | |
| Osteopathy | 135 | 35 | |
| GP | 64 | 36 |
As shown by the trends in Figs 3, 4 and 5, most services had increased costs, single contacts and claims from 2009 to 2020. The largest growth over this period was seen in acupuncture (claims and costs increased by 157 and 98%, respectively). Pain management had a large increase in costs (claims decreased by 46% but costs increased by 79%).
Claims and costs decreased in 2010 for included healthcare services; total claims reduced by 12% and costs decreased by 19%. Physiotherapy experienced the largest changes (claims decreased by 17% and costs decreased by 42%). Notably, acupuncture did not experience a decrease in 2010 (claims and costs increased by 11 and 0.3%, respectively).
In 2020 (during COVID-19 pandemic), there was a large decrease in both claims and costs for most healthcare services. The largest decreases were for return to work (claims decreased by 22% and costs decreased by 21%) and acupuncture (claims decreased by 8% and costs decreased by 19%). In contrast, surgery had fewer claims but an increase in costs (claims decreased by 2% but costs increased by 15%) and radiology had a small increase in claims (<1%) and costs increased by 6%.
Discussion
There were 3.3 million ACC claims for LBP between 2009 and 2020 at a total cost of NZ$4 billion. Claims, costs and single contacts increased during this time. The choice of services selected for analysis in this study reflects the need to reduce these costs. In this study we looked at highly used services, high-cost services and services that affect quality of life, which is an important factor affecting recovery from LBP. Elective surgery and radiology services were the most expensive per single contact. Physiotherapy, general practice and radiology were the services with the highest number of claims. This has some similarity to findings from an international systematic review and meta-analysis,14 which indicated that GPs were the most frequently used service internationally. Higher physiotherapy than GP claims can be explained by the direct access agreement unique to NZ, which means patients do not require a GP referral to access physiotherapy.12–14,30 Physiotherapy, general practice and radiology have the highest claims (Fig. 5), whereas physiotherapy, chiropractic services and acupuncture have the highest single contacts (Fig. 4), which can be explained by the ongoing nature of their services. It would be useful in future research to request data that include new claims lodged by healthcare service, to track the trends over time of the choice of first point of care.
In the period from 2009 to 2020, there was a 23% increase in the total number of ACC-funded LBP claims and a 52% increase in costs. From 2009 to 2010, there was a decrease in costs, then from 2010 to 2020 there was a 70% increase in costs. In the most recent year of data (2020), the ACC-funded healthcare service costs of LBP were approximately NZ$223 million. When weekly compensation is included, costs were almost NZ$466 million. Many other studies have considered the costs of LBP for ACC.3,7,18,31–34 Our study is the only one to consider LBP over this timeframe and to include a range of healthcare providers. However, the heterogeneity in LBP diagnosis, definitions and types of costs makes it difficult to compare the results to this study.7,35 The most recent and comprehensive research, published in 2015 by the National Health Committee, estimated that LBP direct healthcare costs ACC NZ$110 million annually.7 The economic effect related to LBP is comparable to other prevalent high-cost conditions, such as cardiovascular disease and cancer.1 The current study, using data directly from ACC, found ACC-funded LBP healthcare service costs were NZ$223 million annually. Even in 2015, actual costs derived from raw data were NZ$179 million, much higher than the National Health Committee’s estimation of $110 million.
Two of the key findings from the current study were the high use and associated cost of radiology, and the high cost of surgery. The consensus from recent clinical practice guidelines and literature is that radiology should be used prudently and is recommended only in the case of suspected serious pathology.27,36 However, significant gaps exist between guideline recommendations and implementation to practice.26,37 Several systematic reviews and meta-analyses have concluded that radiology is used frequently26,37 and often inappropriately,38 resulting in higher medical costs.39,40 In the current study, radiology made up a large proportion of total costs (17%) and was the third most frequently used service in terms of claims. This raises the question of whether NZ is following international trends. In a systematic review by Downie et al.38 approximately 25% of patients with LBP received imaging. However, this review included LBP from accidental and non-accidental causes. A review by Foster et al.36 showed significantly higher rates of between 40 and 50%, which also included LBP of accidental and non-accidental origin. Our data showed that around 20% of patients with ACC-funded LBP received imaging, but as this is related only to LBP from accidental causes it is hard to draw firm comparisons. The international consensus, however, is that there is inappropriate overuse of radiology for LBP. Similarly, it is widely regarded that surgical management of LBP is expensive41–43 and should only be considered in select cases and following failed conservative management.27 The current study found that surgery was the costliest service overall (NZ$38.2 million in 2020) and in cost per claim (NZ$13 378), whereas all other services cost markedly less per claim (≤NZ$500). The high cost of surgery per claim is not surprising given the resources required for such procedures. The actual number of surgical claims is low (see Table S5 for the number of claims by healthcare service and Table S3 for cost by healthcare service). This demonstrates a large contribution to total costs. These findings fit with the expectation of judicious consideration by health practitioners for surgical intervention.
In 2009, ACC experienced large increases in total costs (57% increase from 2006) and an annual deficit of NZ$4.8 billion.44,45 In response, the government directed ACC to contain costs through altering levies and introducing cost-saving initiatives such as new client co-payments for physiotherapy services.46,47 These changes seemed to be successful, as the data indicate that medical treatment costs were 11% less in 2010–11 than 2009–10 and NZ$95 million (16%) less than budgeted.44 These changes seem to have influenced LBP-specific claims and costs as shown in the trend from 2009 to 2010 in Figs 3, 4 and 5. From 2009 to 2010, overall LBP claims and costs decreased by 12 and 19%, respectively. This reduction was largest for physiotherapy (LBP claims decreased by 17%, single contacts decreased by 26% and costs decreased by 42%). These results reflect the costs to ACC. The decrease in claims and single contacts could be explained by the introduction of co-payments and could help explain the 19% reduction in costs. However, there was a significant reduction in the use of ACC-funded physiotherapy by people with LBP. The data collected in this study do not enable us to capture those who sought privately funded treatment.
In 2020, there was a decrease in the use of most healthcare services for LBP. The trends observed in Fig. 2 for LBP are similar to trends in ACC claims for all injuries, which reduced by 8%.48 This is due to the extraordinary impact of the COVID-19 pandemic, which first reached NZ on 28 February 2020 and resulted in multiple restrictions to activities outside the home. Healthcare provision was greatly affected, non-essential procedures were reprioritised, and many services were unable to occur in person and were cancelled or completed via telehealth.48,49 During the period of highest restrictions, ACC claims reduced by ~50%.48 Telehealth was an effective substitute for traditional healthcare50,51 and may have prevented the number of ACC claims from decreasing even further.48 Overall, our findings are similar to trends observed internationally.52–54 A study from the USA found that the use of conservative treatments for chronic LBP such as acupuncture, exercise and massage therapy reduced due to COVID-19.54
Despite decreases in claims for LBP and other injuries over the period of the pandemic, ACC costs for both experienced a minor increase.48 This finding may be explained by ACC clients accessing fewer low-cost primary care services (physiotherapy and osteopathy) due to COVID-19 restrictions.48,55 Changes in operational approaches and the costs of goods and services48 may have contributed to increased costs for essential services such as surgery (reflected by a 15% increase in LBP surgical costs during 2020).
A key strength of this study was that the data were obtained directly from ACC, so they were comprehensive, recent and accurate. Limitations include difficulties with the datasets, as shown in Table S7; obtaining data from ACC was an iterative process, as not all the information of interest was included in the initial dataset. Another limitation was the data itself; within the ACC datasets, there was ‘undefined’ healthcare service usage (>17 000 claims and >NZ$240 million), which was omitted from all our analyses. We also did not request information on new claims by year, which would have added additional useful information. The healthcare services are unknown for these claims and could have been included if they had been correctly reported. A further limitation is that acute public hospital services, for example ACC-funded surgery, are bulk funded by ACC and therefore not included in these data.
The results of this study do not represent LBP in NZ overall, as only ACC-funded LBP healthcare service costs and usage were included. However, the costs covered by ACC are estimated to constitute approximately one-third of overall direct LBP healthcare costs, so they represent a significant proportion of the funding7 (Fig. 1). The next step in our research plan is to investigate government and privately funded healthcare usage and costs for LBP. We are also unable to capture the many indirect costs, including the personal and societal burden of LBP. These non-healthcare-related costs are also important to consider and account for an estimated NZ$2.6 billion in NZ LBP expenditure annually.7
The de-identified data used do not allow us to distinguish those who have multiple claims and for whom LBP is a recurrent disabling condition. They also do not allow us to identify who refers patients for radiology or the reasons why. The relatively low number of single contacts and claims for pain and return to work services seem to be at odds with the growing level of chronic disability from LBP as reported in the Global Burden of Disease Study.56 The prevalence of LBP continues to climb but services which have been shown to improve quality of life appear to be under-utilised.
The cost of ACC-funded LBP healthcare services in NZ continues to increase despite ongoing attempts to reduce prevalence and the cost of managing symptoms. The large number of services available gives consumers a wide choice, and this study defines where people seek ACC-funded health care for LBP and the cost to the country of this care. This research shows that not all healthcare services are delivering services consistent with evidence-based practice guidelines. For example, the high number of radiology referrals does not appear to conform to best practice guidelines. The reasons services are used in direct contradiction to best practice guidelines warrants closer scrutiny.
Data availability
The data that support this study were obtained from ACC by permission/licence. Data will be shared upon reasonable request to the corresponding author with permission from ACC.
Declaration of funding
Faculty of Health and Environmental Studies, Auckland University of Technology, New Zealand.
Author contributions
Dr Julia Hill: Conceptualisation, Writing – Review & Editing, Project administration, supervision, Methodology. Dylan Kay: Writing – Original Draft, Formal analysis. Jacob Gordon: Writing – Original Draft, Formal analysis. Dr Imran Khan Niazi: Methodology, Software, Formal analysis. Dr Nicola Saywell: Writing – Review & Editing, Project administration, supervision, Methodology.
References
1 Hartvigsen J, Hancock MJ, Kongsted A, et al. What low back pain is and why we need to pay attention. Lancet 2018; 391(10137): 2356-2367.
| Crossref | Google Scholar |
2 Vos T, Lim SS, Abbafati C, et al. Global burden of 369 diseases and injuries in 204 countries and territories, 1990–2019: a systematic analysis for the Global Burden of Disease Study 2019. Lancet 2020; 396(10258): 1204-1222.
| Crossref | Google Scholar |
3 Darlow B, Perry M, Stanley J, et al. Cross-sectional survey of attitudes and beliefs about back pain in New Zealand. BMJ Open 2014; 4(5): e004725.
| Crossref | Google Scholar |
4 Pengel LHM. Acute low back pain: systematic review of its prognosis. BMJ 2003; 327(7410): 323.
| Crossref | Google Scholar |
5 da Silva T, Mills K, Brown BT, et al. Recurrence of low back pain is common: a prospective inception cohort study. J Physiother 2019; 65(3): 159-165.
| Crossref | Google Scholar |
6 Stevans JM, Delitto A, Khoja SS, et al. Risk factors associated with transition from acute to chronic low back pain in US patients seeking primary care. JAMA Netw Open 2021; 4(2): e2037371.
| Crossref | Google Scholar |
7 National Health Committee. Low back pain: A pathway to prioritisation. 2015. Available at https://www.health.govt.nz/system/files/documents/publications/nhc-lbp-pathway-to-prioritisation.pdf
8 Becker A, Held H, Redaelli M, et al. Low back pain in primary care: costs of care and prediction of future health care utilization. Spine 2010; 35(18): 1714-1720.
| Crossref | Google Scholar |
9 Jo C. Cost-of-illness studies: concepts, scopes, and methods. Clin Mol Hepatol 2014; 20(4): 327-337.
| Crossref | Google Scholar |
10 ACC. Low back pain data. 2023. Available at https://catalogue.data.govt.nz/dataset/low-back-pain-data/resource/f8fdddf8-2d35-4690-b969-f1e3a0020fd2 [accessed 24 April 2023].
11 Accident Compensation Corporation. Treatment we can help pay for. 2023. Available at https://www.acc.co.nz/im-injured/what-we-cover/treatment-we-pay-for/
12 Baxter GD, Chapple C, Ellis R, et al. Six things you need to know about low back pain. J Prim Health Care 2020; 12(3): 195-198.
| Crossref | Google Scholar |
13 Physiotherapy Board of New Zealand. Physiotherapy standards framework. 2018. Available at https://www.physioboard.org.nz/wp-content/uploads/2018/03/Physiotherapy-Board-Code-Standards-Thresholds.pdf
14 Moffatt F, Goodwin R, Hendrick P. Physiotherapy as first point of contact service for patients with musculoskeletal complaints: understanding the challenges of implementation. Prim Health Care Res Dev 2018; 19(2): 121-130.
| Crossref | Google Scholar |
15 Beyera GK, O’Brien J, Campbell S. Health-care utilisation for low back pain: a systematic review and meta-analysis of population-based observational studies. Rheumatol Int 2019; 39(10): 1663-1679.
| Crossref | Google Scholar |
16 Buchbinder R, Underwood M, Hartvigsen J, et al. The Lancet Series call to action to reduce low value care for low back pain: an update. Pain 2020; 161(Suppl 1): S57-S64.
| Crossref | Google Scholar |
18 Wilson R, Pryymachenko Y, Abbott JH, et al. A guideline-implementation intervention to improve the management of low back pain in primary care: a difference-in-difference-in-differences analysis. Appl Health Econ Health Policy 2023; 21(2): 253-262.
| Crossref | Google Scholar |
19 Feuerstein M, Marcus SC, Huang GD. National trends in nonoperative care for nonspecific back pain. Spine J 2004; 4(1): 56-63.
| Crossref | Google Scholar |
20 Hashemi L, Webster BS, Clancy EA. Trends in disability duration and cost of workers’ compensation low back pain claims (1988-1996). J Occup Environ Med 1998; 40: 1110-1119.
| Crossref | Google Scholar |
21 Mafi JN, McCarthy EP, Davis RB, et al. Worsening trends in the management and treatment of back pain. JAMA Intern Med 2013; 173(17): 1573-1581.
| Crossref | Google Scholar |
22 Mattila VM, Sillanpää P, Visuri T, et al. Incidence and trends of low back pain hospitalisation during military service – An analysis of 387,070 Finnish young males. BMC Musculoskelet Disord 2009; 10(1): 10.
| Crossref | Google Scholar |
23 Accident Compensation Corporation. Lodging a claim for a patient. 2023. Available at https://www.acc.co.nz/for-providers/lodging-claims/lodging-a-claim-for-a-patient/
24 Accident Compensation Corporation. Privacy Impact Assessment: Statistical models used to improve the claim registration and approval process. Vol. 1. 2018. pp. 1–25. (ACC) Available at https://www.acc.co.nz/assets/im-injured/2a239c130c/claims-approval-privacy-impact-assessment.pdf
25 Ministry of Justice. Official Information Act 1982. 1982. Available at https://www.legislation.govt.nz/act/public/1982/0156/latest/DLM64785.html
26 Kamper SJ, Logan G, Copsey B, et al. What is usual care for low back pain? A systematic review of health care provided to patients with low back pain in family practice and emergency departments. Pain 2020; 161(4): 694-702.
| Crossref | Google Scholar |
27 Oliveira CB, Maher CG, Pinto RZ, et al. Clinical practice guidelines for the management of non-specific low back pain in primary care: an updated overview. Eur Spine J 2018; 27(11): 2791-2803.
| Crossref | Google Scholar |
28 Accident Compensation Corporation. Pain management service: guidelines for providers. 2020. Available at https://www.acc.co.nz/assets/contracts/pain-management-og.pdf
29 Accident Compensation Corporation. Getting back to work after an injury. 2023. Available at https://www.acc.co.nz/im-injured/financial-support/return-to-work/
30 Goodwin RW, Hendrick PA. Physiotherapy as a first point of contact in general practice: a solution to a growing problem? Prim Health Care Res Dev 2016; 17(5): 489-502.
| Crossref | Google Scholar |
31 Cornwall J, Melloh M. Do New Zealand nurses claim more lumbar spine injuries than the general population? A retrospective study (1995–2009). N Z Med J 2012; 125(1348): 112-115.
| Google Scholar |
32 Grimmer-Somers K, Prior M, Robertson J. Yellow flag scores in a compensable New Zealand cohort suffering acute low back pain. J Pain Res 2008; 1: 15-25.
| Crossref | Google Scholar |
33 King D, Hume PA, Hardaker N, et al. Sports-related injuries in New Zealand: National Insurance (Accident Compensation Corporation) claims for five sporting codes from 2012 to 2016. Br J Sports Med 2019; 53(16): 1026-1033.
| Crossref | Google Scholar |
34 McBride D, Begg D, Herbison P, et al. Low back pain in young New Zealanders. N Z Med J 2004; 117(1203): U1099.
| Google Scholar |
35 Dionne CE, Dunn KM, Croft PR, et al. A consensus approach toward the standardization of back pain definitions for use in prevalence studies. Spine 2008; 33: 95-103.
| Crossref | Google Scholar |
36 Foster NE, Anema JR, Cherkin D, et al. Prevention and treatment of low back pain: evidence, challenges, and promising directions. Lancet 2018; 391(10137): 2368-2383.
| Crossref | Google Scholar |
37 Jenkins HJ, Downie AS, Maher CG, et al. Imaging for low back pain: is clinical use consistent with guidelines? A systematic review and meta-analysis. Spine J 2018; 18(12): 2266-2277.
| Crossref | Google Scholar |
38 Downie A, Hancock M, Jenkins H, et al. How common is imaging for low back pain in primary and emergency care? Systematic review and meta-analysis of over 4 million imaging requests across 21 years. Br J Sports Med 2020; 54(11): 642-651.
| Crossref | Google Scholar |
39 Ivanova JI, Birnbaum HG, Schiller M, et al. Real-world practice patterns, health-care utilization, and costs in patients with low back pain: The long road to guideline-concordant care. Spine J 2011; 11(7): 622-632.
| Crossref | Google Scholar |
40 Lemmers GPG, van Lankveld W, Westert GP, et al. Imaging versus no imaging for low back pain: a systematic review, measuring costs, healthcare utilization and absence from work. Eur Spine J 2019; 28(5): 937-950.
| Crossref | Google Scholar |
41 Kim LH, Vail D, Azad TD, et al. Expenditures and health care utilization among adults with newly diagnosed low back and lower extremity pain. JAMA Netw Open 2019; 2(5): e193676.
| Crossref | Google Scholar |
42 Weeks WB, Pike J, Donath J, et al. Conservative spine care pathway implementation is associated with reduced health care expenditures in a controlled, before-after observational study. J Gen Intern Med 2019; 34(8): 1381-1382.
| Crossref | Google Scholar |
43 Spears CA, Hodges SE, Kiyani M, et al. Health care resource utilization and management of chronic, refractory low back pain in the United States. Spine 2020; 45(20): E1333-E1341.
| Crossref | Google Scholar |
44 Accident Compensation Corporation. Annual Report 2010. 2010. Available at https://www.parliament.nz/resource/mi-NZ/49DBHOH_PAP20617_1/d9dfd1815091dc696870637725bd2aadefe9a269
45 Smith N. Government announces 2010/11 ACC levy rates. 2009. Available at https://www.beehive.govt.nz/release/government-announces-201011-acc-levy-rates
46 Accident Compensation Amendment Act. 2010. (New Zealand Government, Parliamentary Counsel Office) Available at https://www.legislation.govt.nz/act/public/2010/0001/latest/DLM2417504.html
47 Accident Compensation Corporation. Annual Report 2011. 2011. Available at https://www.parliament.nz/resource/en-NZ/49DBHOH_PAP22223_1/204e5e3941bbed62ab94ba35be9d404d1312dd02
48 Accident Compensation Corporation. Annual Report 2020. 2020. Available at https://www.acc.co.nz/assets/corporate-documents/annual-report-2020-acc8234.pdf
49 Baker MG, Wilson N, Anglemyer A. Successful elimination of COVID-19 transmission in New Zealand. N Engl J Med 2020; 383(8): e56.
| Crossref | Google Scholar |
50 Haldeman S, Nordin M, Tavares P, et al. Distance management of spinal disorders during the COVID-19 pandemic and beyond: evidence-based patient and clinician guides from the global spine care initiative. JMIR Public Health Surveill 2021; 7(2): e25484.
| Crossref | Google Scholar |
51 Imlach F, McKinlay E, Middleton L, et al. Telehealth consultations in general practice during a pandemic lockdown: survey and interviews on patient experiences and preferences. BMC Fam Pract 2020; 21(1): 269.
| Crossref | Google Scholar |
52 Ohm E, Hauge LJ, Madsen C, et al. Impact of the COVID-19 pandemic on the treatment of injuries during lockdown in Norway. Scand J Public Health 2021; 49: 689-696.
| Crossref | Google Scholar |
53 Schäfer I, Hansen H, Menzel A, et al. The effect of COVID-19 pandemic and lockdown on consultation numbers, consultation reasons and performed services in primary care: results of a longitudinal observational study. BMC Fam Pract 2021; 22(1): 125.
| Crossref | Google Scholar |
54 Licciardone JC. Demographic characteristics associated with utilization of noninvasive treatments for chronic low back pain and related clinical outcomes during the COVID-19 pandemic in the United States. J Am Board Fam Med 2021; 34: S77-S84.
| Crossref | Google Scholar |
55 Accident Compensation Corporation. First quarterly report 2020/21. 2021. Available at https://www.acc.co.nz/assets/corporate-documents/first-quarterly-report-2020-2021.pdf
56 GBD 2017 Disease and Injury Incidence and Prevalence Collaborators. . Global, regional, and national incidence, prevalence, and years lived with disability for 354 diseases and injuries for 195 countries and territories, 1990–2017: a systematic analysis for the Global Burden of Disease Study 2017. Lancet 2018; 392(10159): 1789-1858.
| Crossref | Google Scholar |


