Utilisation of WRF-HYSPLIT modelling approach and GEMS to identify PM2.5 sources in Central Kalimantan – study case: 2023 forest fire
Amalia Nurlatifah A * , Prawira Yudha Kombara
  A , Alvin Pratama B , Rizky Faristyawan C , Aulia Arip Rakhman D and Nindia Noviastuti A
A
B
C
D
Abstract
Biomass burning is a significant particulate matter (PM) source, substantially contributing to elevated PM2.5 levels. Exposure to PM2.5 has been associated with various severe chronic illnesses. Therefore, it is crucial to address biomass burning occurrences, mitigate their impacts, and manage their consequences effectively. A key strategy for managing biomass burning haze involves identifying its sources, which facilitates the implementation of fire prevention and suppression measures. This study explores the sources and impacts of PM2.5 emissions from forest fires in Central Kalimantan in October 2023 using an integrated approach. We employed the WRF-HYSPLIT (Weather Research and Forecasting model coupled with the Hybrid Single Particle Lagrangian Integrated Trajectory model) and satellite instruments, including the GEMS (Geostationary Environment Monitoring Spectrometer), MODIS (Moderate Resolution Imaging Spectroradiometer) and VIIRS (Visible Infrared Imaging Radiometer Suite), to identify PM2.5 sources and analyse their spatial distribution. Palangka Raya experienced substantial impacts from multiple hotspot occurrences on 4 October 2023, particularly from the south-eastern and eastern regions of Central Kalimantan and South Kalimantan. Conversely, Pangkalan Bun showed relatively lower PM2.5 concentrations on 2 October 2024 owing to prevailing sea winds. Most PM2.5 in Palangka Raya originated from the south-east. Geopotential height and topography analyses with wind plots suggested stable atmospheric conditions in Palangka Raya, whereas GEMS satellite data revealed high aerosol optical depth values, indicating elevated PM2.5 concentrations. These findings underscore the importance of understanding local meteorological conditions and hotspot distributions for effective management and mitigation of forest fire impacts on air quality in Central Kalimantan.
Keywords: air pollution, biomass burning, Central Kalimantan, forest fire, GEMS, haze, hotspot, MODIS, PM2.5, satellite remote sensing, VIIRS, WRF-HYSPLIT.
1Introduction
Biomass burning refers to the combustion of living or dead vegetation including grassland, forest, agricultural waste and biomass used as fuel (Yadav and Devi 2019). It is a significant source of air pollution (Crutzen et al. 1979; Seiler and Crutzen 1980; Levine 2000) that affects global, regional and local air quality as well as public health. Biomass burning emits large quantities of gaseous pollutants, greenhouse gases and aerosol particles into the atmosphere, contributing to climate change (Zhao 2022). Additionally, it produces thick haze that reduces visibility and limits economic activity.
The haze resulting from biomass burning contains high concentrations of fine particles and nitrogen oxides (NOx) (Reid et al. 2005; van der Werf et al. 2017; Ballesteros-González et al. 2020). As a major source of particulate matter (PM) (Cheng et al. 2014; Tao and Harley 2014; Zhang et al. 2017; Zong et al. 2016), biomass burning significantly contributes to accumulation of particulate matter smaller than 2.5 μm (PM2.5) (Pimonsree and Vongruang 2018; Mehmood et al. 2020; Rahman et al. 2021; Rojano et al. 2021).
PM2.5 is not a single pollutant, but a complex mixture of various chemical species, including small droplets of liquid, dry solid fragments and solid cores with liquid coatings (Morakinyo et al. 2016). Exposure to PM2.5 is associated with numerous adverse health effects. Short-term exposure (up to 24 h) has been linked to premature mortality and cardiovascular and respiratory disease, including acute and chronic bronchitis, asthma attacks and other respiratory issues (Basith et al. 2022; Thangavel et al. 2022). These health impacts are particularly severe among infants, children and older adults with pre-existing health conditions (Manisalidis et al. 2020). Among common air pollutants, PM2.5 is associated with the highest proportion of adverse health effects related to air pollution.
In Indonesia, landscape fires are particularly intense during the dry season (Engling et al. 2014). Weather anomalies, such as the Australian monsoon and El Niño, have been identified as major contributors to forest fire incidents in Indonesia (Nurdiati et al. 2022). In Central Kalimantan, the dry season extends from June to October, leading to a significant increase in biomass burning incidents during this period (Putra 2011).
Given their impact, frequency and potential for damage, effective mitigation and management of forest fires are essential to address biomass burning, reduce its impacts promptly and minimise losses. Identifying the precise sources of haze is a key strategy for improving fire prevention and suppression efforts.
The Hybrid Single-Particle Lagrangian Integrated Trajectory (HYSPLIT) transport model is a comprehensive tool for calculating and estimating air parcel trajectories, including transport, dispersion, chemical transformation and deposition simulations. HYSPLIT commonly uses back trajectory analysis to estimate air mass sources based on receptor and meteorological conditions (Stein et al. 2015). However, its default input data, which consist of a global dataset with a coarse resolution of up to 1°, often result in inaccuracies in local-scale analyses. To address this, mesoscale meteorological models such as WRF-ARW (Weather Research and Forecasting Advanced Research WRF) provide more spatially detailed input data (Physick and Abbs 1991; Kotroni et al. 1999; Wang and Ostoja-Starzewski 2004). Previous research demonstrates that dispersion calculations using the vertical coordinate system of WRF-ARW produce a more accurate depiction of atmospheric conditions and dispersion simulations when coupled with HYSPLIT (Ngan et al. 2015). Locally configured WRF models can also offer improved input for HYSPLIT, enhancing predictions for specific mesoscale environments (Dreher 2009). The integration of the WRF-HYSPLIT inline model thus enables more accurate identification of PM2.5 sources from forest fires in local areas.
Central Kalimantan frequently experiences forest fires, largely owing to its flammable peat soils, especially during the dry season (Cattau et al. 2016). Effective management of forest fire impacts is crucial for this region, which is home to nearly 2.9 million people and serves as a habitat for rare species such as the orangutan and proboscis monkey.
This study aims to identify and describe the sources of PM2.5 from forest fires in Central Kalimantan using the WRF-HYSPLIT inline model. We also employ satellite instruments, namely GEMS (Geostationary Environment Monitoring Spectrometer), SNPP (Suomi National Polar-orbiting Partnership), MODIS (Moderate Resolution Imaging Spectroradiometer) and VIIRS (Visible Infrared Imaging Radiometer Suite), to provide a comprehensive description of PM2.5 sources. GEMS offers insights into aerosol optical depth (AOD), indicating smoke haze, whereas SNPP MODIS, and VIIRS are used to show hotspot conditions.
2Data and method
2.1 Research focus
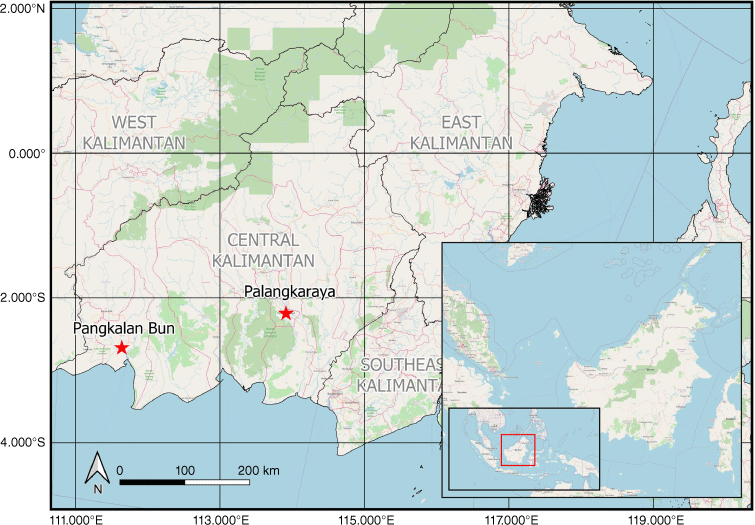
The research domain is located in Central Kalimantan, within the coordinate boundaries of 3.55°S–0.76°N and 110.85–115.83°E. The BMKG (Badan Meteorologi, Klimatologi, dan Geofisika/Meteorological, Climatology and Geophysics Agency) PM2.5 observation stations are positioned in Palangka Raya and Pangkalan Bun, in the southern part of the research domain. Fig. 1 illustrates the map of the research site locations. In this study, we focus on the period from 1 to 6 October 2023. These dates were selected owing to a significant pollution episode observed in the region, characterised by elevated levels of PM2.5 from biomass burning.
2.2 Data
PM2.5 and meteorological data obtained through direct measurements in Central Kalimantan were obtained from the BMKG. The data used are direct observation data from two observation stations, namely Palangka Raya Station (113.94°E, 2.23°S) and Pangkalan Bun Station (111.67°E, 2.71°S). These data are available with an hourly temporal resolution for the year 2023. The meteorological data obtained were subsequently utilised for the purpose of validating the meteorological data output generated by the WRF-ARW model. PM2.5 observation data were obtained by direct measurement using a Met One Particulate Sampler instrument.
We note that PM2.5 data from Palangka Raya during the dry season are incomplete. Although the exact cause is unclear, potential factors could include equipment failure or technical difficulties in data transmission during this period. Despite this limitation, the available data were carefully analysed, and appropriate measures were taken to ensure the robustness of the results, including adjusting for any potential gaps in the data.
The GEMS is a pivotal instrument mounted on the GEO-KOMPSAT-2B satellite, designed to monitor air quality over the Asia–Pacific region. GEMS provides several products for monitoring air quality and meteorological conditions, long-distance transport of air pollutants, distribution of emission sources and chemical processes (Kim J et al. 2020). With geostationary orbit, one of the main advantages of the GEMS satellite is its ability to monitor air quality continuously, namely every hour with an observation period from morning to evening. GEMS operates by capturing high-resolution spectral data, primarily targeting air pollutants such as ozone (O3), nitrogen dioxide (NO2), sulfur dioxide (SO2), carbon monoxide (CO), formaldehyde (HCHO) and aerosols. This spectrometer scans the atmosphere in ultraviolet and visible (UV-Vis) spectral bands, effectively capturing data at 500-m spatial resolution. Since the launch of GEO-KOMPSAT-2B in February 2020, GEMS has offered a continuous data stream that is critical for environmental researchers and policymakers. Pertinent studies utilising GEMS data have been documented in several key articles (Park et al. 2020; Nurlatifah et al. 2023) that explore the application of GEMS data in tracking transboundary pollution events. For researchers interested in accessing GEMS data, the information is available for download at the Korea Aerospace Research Institute (KARI) website (see https://doi.org/10.22761/DJ2022.4.4.005). This accessibility enables a broad spectrum of scientific investigations, enhancing our understanding of regional air quality dynamics and supporting the development of strategies for atmospheric management.
This study employs GEMS satellite data with a spatial resolution of 13 km and hourly temporal resolution. We focus specifically on the Central Kalimantan region. The GEMS satellite product used in this research is AOD. To analyse the AOD conditions for each day, we utilise the maximum AOD value recorded within that 24-h period.
The AOD is the integral of the atmospheric extinction coefficient (scattering and absorbing aerosol) from the surface to the top of the atmosphere and an important parameter for visibility degradation (due to atmospheric pollution), solar radiation extinction, climate effects and tropospheric corrections in remote sensing (Kaskaoutis et al. 2007). Under normal air conditions, the AOD value ranges between 0.1 and 0.15 (unitless).
Hotspot data of the 1–6 October 2023 haze event are derived from imagery provided by Sipongi KLHK (see https://sipongi.menlhk.go.id/). The monitoring of hotspots is conducted through three satellite observations: MODIS (Terra-Aqua satellites) and VIIRS (SNPP and NOAA20 satellites). Only hotspots with a confidence level of 90% or more are considered in this study.
The Differenced Normalised Burn Ratio (dNBR) is a vital metric utilised in assessing wildfire impacts through remote sensing, leveraging Sentinel-2 imagery. This analysis employs Sentinel-2’s high spatial resolution, with Band 8 (near-infrared, NIR) at 10-m resolution and Band 12 (short-wave infrared, SWIR) at 20-m resolution. Sentinel-2 provides a temporal resolution characterised by a revisit cycle of 5 days, facilitated by the operation of the two satellites, Sentinel-2A and Sentinel-2B. The dNBR is calculated using the Normalised Burn Ratio (NBR), which is determined from the formula as follows:
The dNBR is calculated using the NBR, determined from the formula:
This method effectively highlights the severity and extent of fire-affected areas by analysing changes in vegetation and soil conditions before and after a fire event. The data for Sentinel-2 can be accessed through various platforms, including the Copernicus Open Access Hub (see https://scihub.copernicus.eu), United States Geological Survey (USGS) EarthExplorer (see https://earthexplorer.usgs.gov) and Google Earth Engine (see https://earthengine.google.com).
2.3 Methods
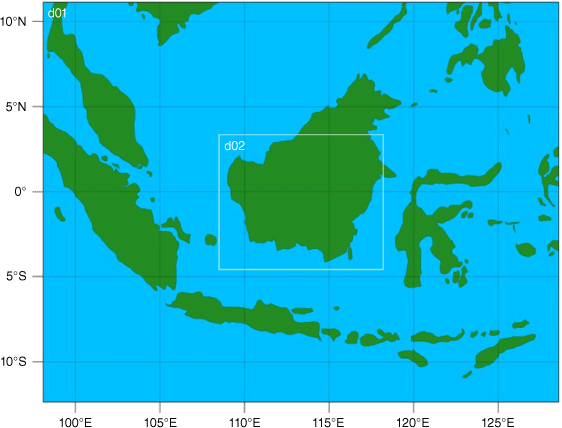
To generate input for the HYSPLIT model, this study employed the WRF ARW model version 4.2.2, utilising the Global Forecast System (GFS) as the initial meteorological conditions. The GFS data, which have a spatial resolution of ~27 × 27 km, were accessed at rda.ucar.edu. The simulation was conducted over a 6-day period from 1 to 6 October 2023, with hourly output intervals, using a single initial condition. The WRF simulation incorporated two nested domains: the first with a resolution of 15 × 15 km, and the second with a resolution of 5 × 5 km. Consequently, the output grid size for the second domain was 217 × 178 and included 34 vertical layers. The domain configuration is illustrated in Fig. 2.
For running the WRF model, the parameterisation schemes used are detailed in Table 1.
| Parameterisation schemes | One domain (15 km) and two domains (5 km) | Key reference | |
|---|---|---|---|
| Microphysics | Purdue Lin | Chen and Sun (2002) | |
| Cumulus | Grell 3-D | Grell (1993); Grell and Dévényi (2002) | |
| Longwave radiation | RRTM | Mlawer et al. (1997) | |
| Shortwave radiation | Dudhia | Dudhia et al. (1987) | |
| Boundary layer | YSU | Hong et al. (2006) |
RRTM, Rapid Radiative Transfer Model; YSU, Yonsei University.
In this study, backward air mass trajectories were calculated using the HYSPLIT model developed by NOAA’s Air Resources Laboratory (Stein et al. 2015). HYSPLIT was employed to trace the movement of air parcels arriving at monitoring stations in Palangka Raya and Pangkalan Bun, Central Kalimantan. The objective of these backward trajectories is to identify potential source regions of particulate matter (PM2.5) during the forest fire event in 2023.
To capture the variability of air mass movements, we computed 120-h backward trajectories at 1-h intervals, ending at a height of 10 m above ground level (AGL) for the study period (1–6 October 2023). Additionally, 30-h backward trajectories at 1-h intervals, ending at the same height of 10 m AGL, were computed for the period of 4 and 2 October 2023 for Palangka Raya and Pangkalan Bun, respectively. The meteorological data used for trajectory calculations were obtained from the WRF model output, which provides the necessary wind, temperature and pressure fields at high spatial and temporal resolution.
Given the large number of trajectories generated throughout the study period (because the model interval is 1 h), clustering analysis was performed to reduce complexity and identify dominant transport pathways. Cluster analysis is a statistical method that groups similar trajectories into clusters, allowing the identification of common air mass origins and transport patterns. In this study, we applied the K-means clustering algorithm as implemented in the HYSPLIT model (Stein et al. 2015).
Evaluating the WRF model performance is crucial to ensure its reliability and accuracy. This evaluation typically involves several statistical metrics, including Pearson correlation, root mean square error (RMSE) and mean bias (MB). Each of these metrics provides unique insights into different aspects of the model’s performance. The Pearson correlation assesses the linear relationship and indicates how well the model captures the variability of the observations. RMSE evaluates the average magnitude of errors, highlighting the overall accuracy of the model.
MB refers to the average difference between the values predicted by the model and the actual observed values. It provides information on whether the model is consistently overestimating or underestimating (Jamil and Akhtar 2017). MB can be determined as follows:
where Oi is the observed value and Mi is the model value. A positive MB indicates that the model overestimates, whereas a negative MB means it underestimates. A zero MB signifies that the model is unbiased, accurately predicting the average values.
RMSE is a widely used metric for evaluating the difference between values predicted by a model and the actual observed values (Willmott and Matsuura 2005). It informs how far off the model’s predictions are from reality.
A lower RMSE indicates a better fit between the model’s predictions and the observed data. It means the model is capturing the trend and variability more accurately. A higher RMSE indicates a poorer fit. The model’s predictions are deviating more from the observed values.
The Pearson correlation coefficient is a measure that assesses the linear relationship between two variables (observation and model) values (Rodgers and Nicewander 1988). It is denoted by r and calculated as follows:
where O̅ is the mean of observed value, M̅ is the mean of model values and n is the number of observations.
A positive correlation means both variables increase or decrease together, with a higher positive value indicating a stronger relationship. A negative correlation means one variable increases as the other decreases, with a more negative value indicating a stronger inverse relationship. A zero correlation indicates no relationship.
3Results and discussion
Based on direct monitoring at the two stations in Central Kalimantan (Palangka Raya and Pangkalan Bun), the annual average PM2.5 concentrations in 2023 were observed to be quite moderate, with values of 28.18 and 12.86 µg m–3 respectively, and medians of ~9.2 and 10.5 µg m–3 (Table 2). These concentrations reflect generally good air quality in these regions under normal conditions, attributable to limited transportation and industrial activities. By contrast, Palangka Raya, as the provincial capital with a population of 281,096, exhibits higher average and median PM2.5 levels due to increased human activity and transportation compared with Pangkalan Bun.
| PM2.5 concentration Palangka Raya (μg m–3) | PM2.5 concentration Pangkalan Bun (μg m–3) | ||
|---|---|---|---|
| Mean | 28.18 | 12.86 | |
| Median | 9.2 | 10.5 | |
| Maximum | 278.1 | 82.9 | |
| Minimum | 1.6 | 1.4 |
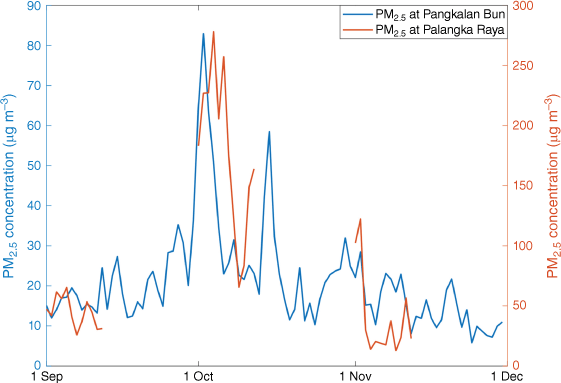
Both stations recorded high maximum annual PM2.5 concentrations, with values reaching 278.1 µg m–3 in Palangka Raya and 82.9 µg m–3 in Pangkalan Bun (Table 2). The annual peaks were notably observed during episodes of elevated PM2.5 concentrations, particularly from 1 to 5 October 2023 (Fig. 3). This period was therefore selected as the focus for our model simulation. Palangka Raya experienced its peak PM2.5 concentration on 4 October 2023, whereas Pangkalan Bun’s maximum was recorded on 2 October 2023 (Fig. 3). The significant increase in PM2.5 during these periods suggested that haze episodes in both locations might be linked to elevated particulate concentrations.
Time series of PM2.5 concentration (μg m–3) in the September–November 2023 season in Palangka Raya and Pangkalan Bun.
To identify the sources of the haze in Pangkalan Bun and Palangka Raya, trajectory analysis of PM2.5 was conducted using the WRF-HYSPLIT model. The WRF model was run with meteorological data from 1 to 6 October 2023, to provide input for HYSPLIT trajectory tracing. Prior to utilising WRF model outputs for HYSPLIT, validation against direct observation data from BMKG was performed. This validation assessed the accuracy of the WRF model in replicating the meteorological conditions observed in Palangka Raya and Pangkalan Bun. If the validation confirmed the model’s reliability, WRF outputs were used directly for HYSPLIT input; otherwise, bias correction procedures were applied to align the model results with observed data.
The WRF model demonstrated reliability in describing the meteorological conditions in Pangkalan Bun and Palangka Raya, as evidenced by high correlation values between WRF and BMKG meteorological data across all parameters in both locations (Table 3). The correlations consistently exceeded 0.7, indicating that the WRF data accurately captured the observed linear trends. Specifically, temperature parameters in both Palangka Raya and Pangkalan Bun showed correlations exceeding 0.94. The very high correlation observed for temperature is primarily a reflection of the diurnal cycle, as temperature typically follows a regular daily pattern. Additionally, the linear trends were clear, and the discrepancies between WRF data and observations were minimal, with most parameters showing favourable MB and RMSE values (Table 3). However, the pressure parameter exhibited substantial errors, with MB and RMSE values reaching 3. Despite these errors, the maximum deviations from the observed pressure remained relatively small, representing only 0.3–0.5% of the mean observation pressure data, which exceeded 1000 hPa. This indicates that the WRF model demonstrated good performance in simulating the pressure parameter as well.
| Temperature (°C) | Relative humidity (%) | Pressure (hPa) | Wind speed (m s–1) | Wind direction (°) | |||
|---|---|---|---|---|---|---|---|
| Observation mean | Palangka Raya | 28.30 | 80.41 | 1010.69 | 3.29 | 91.88 | |
| Pangkalan Bun | 26.04 | 82.28 | 1011.56 | 3.17 | 173.57 | ||
| Mean bias (MB) | Palangka Raya | −2.06 | 2.14 | −3.01 | −1.47 | −7.74 | |
| Pangkalan Bun | 0.11 | −0.28 | −3.00 | −0.34 | 3.96 | ||
| Root mean square error (RMSE) | Palangka Raya | 2.41 | 7.37 | 3.14 | 2.24 | 7.99 | |
| Pangkalan Bun | 1.53 | 7.37 | 3.14 | 9.59 | 9.58 | ||
| Correlation coefficient (r) | Palangka Raya | 0.95 | 0.91 | 0.81 | 0.80 | 0.88 | |
| Pangkalan Bun | 0.92 | 0.90 | 0.84 | 0.70 | 0.66 | ||
The analysis highlighted that the temperature, relative humidity (RH), pressure and wind parameters exhibited optimal performance, characterised by low MB and RMSE values, along with high correlation (Table 3). The wind direction parameter displayed relatively high error, with MB ~±7, likely owing to the inherent variability in this parameter. Despite this, the maximum value of ~180 suggests that the error remains relatively modest, or just 3–4% of the maximum value. Overall, the strong correlation and low error metrics support the reliability of the WRF data as suitable input for trajectory tracking with HYSPLIT.
For wind direction, both Palangka Raya and Pangkalan Bun have MB and RMSE values showing minimal discrepancies (Table 3). Notably, the MB and RMSE for Palangka Raya were nearly identical, indicating a consistent directional bias in the model. This uniformity suggests that the model’s wind direction estimates, although reliable in capturing the prevailing wind flow, may consistently misrepresent wind direction by a small margin. This is likely due to the model’s inability to fully account for local geographical features and the slight mismatch between model topography and actual conditions.
Both sites are characterised by fairly flat terrain, which minimises topographical control over wind patterns. In Pangkalan Bun, located near the coast, the influence of land–sea breeze circulation is evident, whereas Palangka Raya, being inland, experiences more localised, land-driven wind flows. The flat topography at both stations results in less variability in wind direction, leading to reduced model error.
Although the model successfully captured the dominant wind directions, the nearly constant error, particularly in Palangka Raya, suggests that the model’s resolution may slightly underestimate the complexity of local circulation patterns. Despite this, the small error margin reflects the model’s robustness in replicating the primary meteorological conditions needed for trajectory analysis, with the general trends aligning well with observed data.
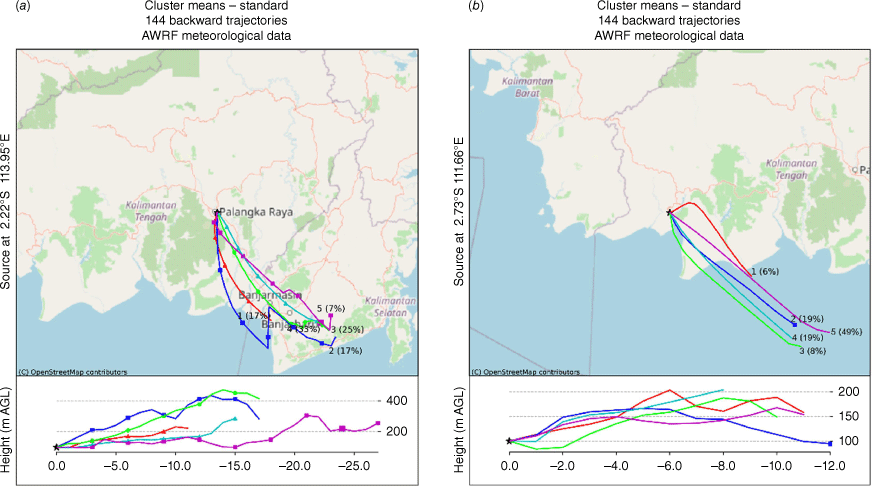
The WRF model data were utilised as input for the HYSPLIT backward trajectory model to analyse the origin and arrival direction of haze contributing to high PM2.5 concentrations in Palangka Raya and Pangkalan Bun from 1 to 6 October 2023. The HYSPLIT cluster plot for Palangka Raya during this period indicated that the majority of smoke originated from the south-eastern region, with sources primarily within 0–400 m AGL (Fig. 4a). This finding was corroborated by the windrose plot, which showed prevailing winds from the south-east (Fig. 5a). However, the windrose plot also illustrated significant influence from the north, suggesting that local circulation patterns may contribute to elevated PM2.5 concentrations in Palangka Raya.
Trajectory cluster based on WRF-HYSPLIT Backward Trajectory Model at 1-h intervals for the 120-h period, ending 23:00 hours local time on 6 October 2023 in (a) Palangka Raya and (b) Pangkalan Bun. Different colours represent different trajectory clusters. The term ‘AWRF meteorological data’ refers to meteorological data obtained from the WRF model.
Wind rose plots based on WRF model output at the surface level for (a) Palangka Raya and (b) Pangkalan Bun during the period 1–6 October 2023.
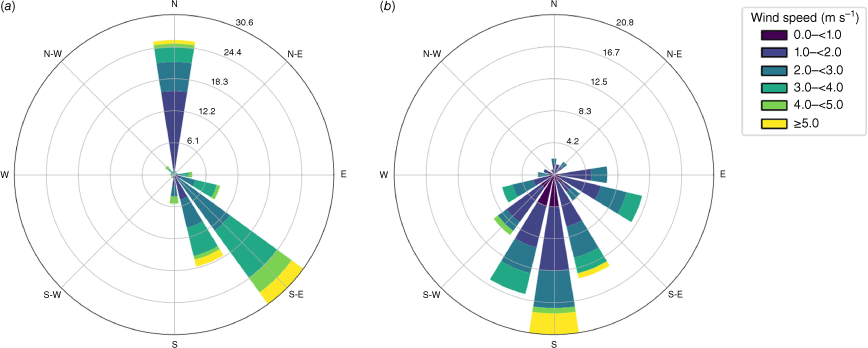
Similarly, the trajectory analysis for Pangkalan Bun revealed that the predominant direction and altitude of haze transport are consistent with those observed in Palangka Raya, with most trajectories originating from the south-east (Fig. 4b). However, trajectories in Pangkalan Bun were generally longer and from a more southerly direction compared with those in Palangka Raya. This observation is supported by the windrose plot, which indicates that the majority of winds in Pangkalan Bun during this period came from the south (Fig. 5b). The proximity of Pangkalan Bun to the Southern Sea likely influences this pattern, with land–sea circulation playing a significant role in shaping local wind patterns and PM2.5 distribution.
By contrast, the trajectories in Palangka Raya were shorter, suggesting slower particle movement compared with Pangkalan Bun. This discrepancy is likely due to differences in wind dynamics, as the wind speed heading towards Palangka Raya is relatively lower than that towards Pangkalan Bun, as indicated by the windrose plots for both areas (Fig. 5a, b). Meteorological data from the Indonesian Meteorology, Climatology and Geophysics Agency (BMKG) show that the average wind speed in Palangka Raya during this period was 3.29 m s–1, compared with 3.91 m s–1 in Pangkalan Bun. This difference in wind speed is attributed to the topographical variations between the two regions: Palangka Raya predominantly experiences winds from land masses, whereas Pangkalan Bun’s winds pass over oceanic regions before reaching the area.
Central Kalimantan frequently experiences recurrent forest fires, largely owing to the prevalence of highly flammable peat soil (Yulianti and Hayasaka 2013). Research indicates that a significant increase in forest fires often occurs within 1 month of the onset of the dry season (Usup and Hayasaka 2023). The dry conditions lead to the desiccation of peat soil, increasing its susceptibility to ignition. Therefore, to accurately determine the origin of the haze in Central Kalimantan from 1 to 6 October 2023, a thorough assessment of hotspot activities is crucial to ascertain whether the haze is primarily caused by forest fires or other sources.
From hotspot monitoring conducted between 1 and 6 October 2023, a total of 1132 hotspots were identified across Central, West and South Kalimantan. These regions are in close proximity to the observation points Palangka Raya and Pangkalan Bun. The substantial number of hotspots suggests the presence of forest fires in these areas, which likely contributed to the elevated PM2.5 concentrations observed in both Palangka Raya and Pangkalan Bun.
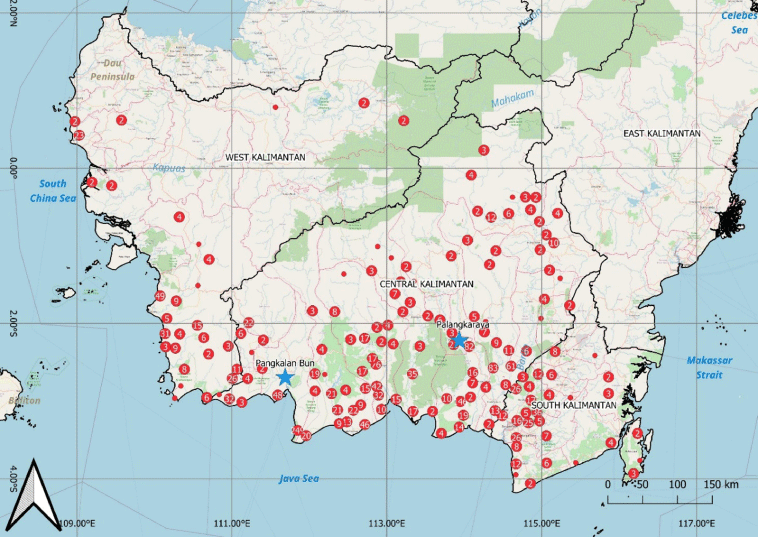
The hotspot analysis indicates that during the specified period, Palangka Raya was significantly affected by multiple hotspot occurrences along the trajectory of pollutants predicted by the WRF-HYSPLIT model (Fig. 4a). This suggests a high prevalence of forest fires during this timeframe, leading to increased PM2.5 levels in the Palangka Raya region. The area affected includes South Kalimantan and the south-eastern part of Central Kalimantan, as shown by the PM2.5 backward trajectory plot (Fig. 4a), highlighting their contribution to the elevated PM2.5 levels in Palangka Raya. Additionally, a hotspot in the south-eastern part of Pangkalan Bun was identified, which likely contributed to the rise in PM2.5 concentrations in that region (Fig. 6). The northern region of Palangka Raya was also noted as a significant contributor to the elevated PM2.5 levels during this period, with hotspots detected in the northern part (Fig. 6). There were ~82 hotspots detected around Palangkaraya and 48 hotspots in the south-eastern region of Pangkalan Bun. These hotspots are believed to have contributed to the increased PM2.5 concentrations observed on 2 October 2023 in Palangkaraya and 4 October 2023 in Pangkalan Bun (Fig. 6). Despite this, the number of hotspots in Pangkalan Bun was lower compared with the south-eastern Palangka Raya area, resulting in comparatively lower PM2.5 concentrations in Pangkalan Bun.
Hotspot distribution in Kalimantan from 1 to 6 October 2023. Red circles indicate the locations and number of hotspots.
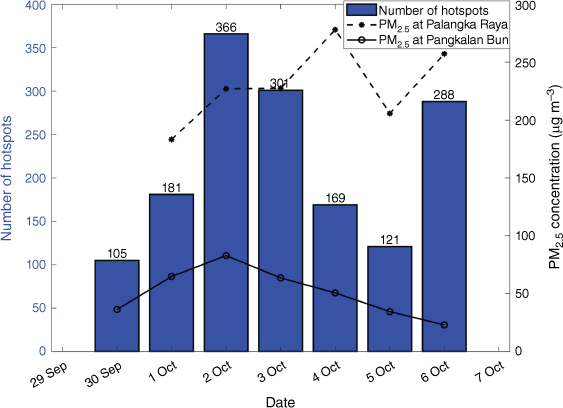
An investigation into the impact of hotspots on PM2.5 concentrations in Palangka Raya and Pangkalan Bun from 1 to 6 October 2023 revealed a notable correlation between the number of hotspots in Central Kalimantan and PM2.5 levels in Pangkalan Bun, with a correlation coefficient of 0.52 (Fig. 7). This suggests that the increase in hotspots in Central Kalimantan, particularly in the south-eastern area, significantly influenced the rise in PM2.5 concentrations in Pangkalan Bun. By contrast, the increase in PM2.5 concentrations in Palangka Raya did not directly correspond to an increase in hotspots in Central Kalimantan. This disparity may be due to two factors: (1) PM2.5 levels in Palangka Raya are also influenced by hotspots in South Kalimantan (Fig. 4a and 5a), and (2) there is a 1-day delay between the increase in hotspots in Central Kalimantan and the rise in PM2.5 concentrations in Palangka Raya, as indicated by a cross-correlation value of 0.42 with a 1-day lag, compared with a direct Pearson correlation of 0.19.
Number of hotspots in Central Kalimantan and PM2.5 concentrations in Palangka Raya and Pangkalan Bun, based on BMKG Data.
Based on the analysis above, the presence of hotspots is a critical factor in the analysis of PM2.5 concentration spikes in Central Kalimantan during forest fire episodes. Hotspots, indicative of active fires, provide insight into potential sources of PM2.5 emissions. Between 1 and 6 October 2023, the monitoring data revealed 1132 hotspots in Central, West and South Kalimantan, regions that are geographically close to observation stations in Palangka Raya and Pangkalan Bun. These hotspots, detected using remote sensing data, are typically associated with peatland fires, which produce substantial amounts of fine particulate matter (PM2.5). The elevated PM2.5 levels recorded at Palangka Raya and Pangkalan Bun coincide with the spatial distribution of these hotspots, suggesting a strong link between fire activity and local air quality. The WRF-HYSPLIT analysis showed that air masses over Palangka Raya and Pangkalan Bun during this period passed through regions with high hotspot densities, reinforcing the conclusion that forest fires significantly contributed to the observed PM2.5 concentrations.
To determine burned area agreement with hotspot data, Sentinel-2 imagery was used to map the extent of burned regions from July to October 2023. Taravat and Los (2021) developed a Sentinel-2-based service using the dNBR to map burned areas following wildfires in Portugal during the summer of 2017. Their study demonstrated the effectiveness of the dNBR index for rapid and accurate post-fire mapping, highlighting its importance for fire management and environmental assessment. Similarly, Arisanty et al. (2022) utilised Sentinel-2 data to map burned areas in the wetlands of Banjarbaru, South Kalimantan, Indonesia. Their findings showed that both dNBR and the Relativised Burn Ratio (RBR) were highly accurate in identifying burned areas, with dNBR achieving an accuracy of 91.5%, establishing these indices as valuable tools for post-fire analysis in wetland ecosystems.
In this study, the NBR was applied to pre- and post-wildfire imagery to classify burn severity and spatial extent. By calculating the difference between these two sets of imagery (dNBR), the fires’ impact was effectively mapped. The analysis used Sentinel-2 satellite data, focusing on pre-fire conditions from July to August 2023 and post-fire analysis from September to October 2023. The resulting maps highlight burned zones in red, identified through the normalised differences between Bands 8 and 12 of the Sentinel-2 data, showing changes in vegetation and surface properties due to the fire (Fig. 8).
Burn severity map of Kalimantan using the Differenced Normalised Burn Ratio (dNBR). The red areas indicate burned zones.
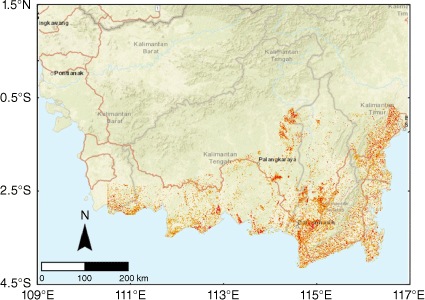
The mapping results from Sentinel-2 data reveal that the burned areas correspond with the distribution of hotspots in the region (Fig. 6). A significant portion of the burned area is located in the south-eastern part of Palangka Raya, around South Kalimantan, as well as in the south-eastern region of Pangkalan Bun. This observation further supports the analysis indicating an increase in PM2.5 concentrations from 1 to 6 October 2023 was caused by forest and land fires.
An analysis was conducted to examine the impact of increasing hotspots on PM2.5 levels in Palangka Raya and Pangkalan Bun. The study focused on daily mean cluster plots corresponding to peak PM2.5 concentrations in both locations: Palangka Raya reached its highest concentration on 4 October 2023, whereas Pangkalan Bun recorded its peak concentration on 2 October 2023.
The backward trajectory WRF-HYSPLIT plot for Palangka Raya, covering a 30-h period on 4 October 2023, revealed that the majority of PM2.5 in Palangka Raya originated from the south-east, with a smaller contribution from the east (Fig. 9a). Wind field and topography plots indicated that the prevailing wind direction on that day was predominantly from the south-east, underscoring significant local influences (Fig. 9b). The topography plot shows relatively flat terrain in the Palangka Raya area, with winds originating from the south-east and moving from South Kalimantan towards Palangka Raya owing to high geopotential heights in eastern South Kalimantan.
(a) Backward trajectory plot from WRF-HYSPLIT for Palangka Raya at 1-h intervals over a 30-h period, ending at 23:00 hours local time (UTC + 7) on 4 October 2023; (b) wind vectors and topography in Kalimantan on 4 October 2023 at 09:00 hours local time; (c) hotspot mapping in Kalimantan on 4 October 2023; and (d) aerosol optical depth (AOD) values in Kalimantan on 4 October 2023 at 08:45 hours local time.
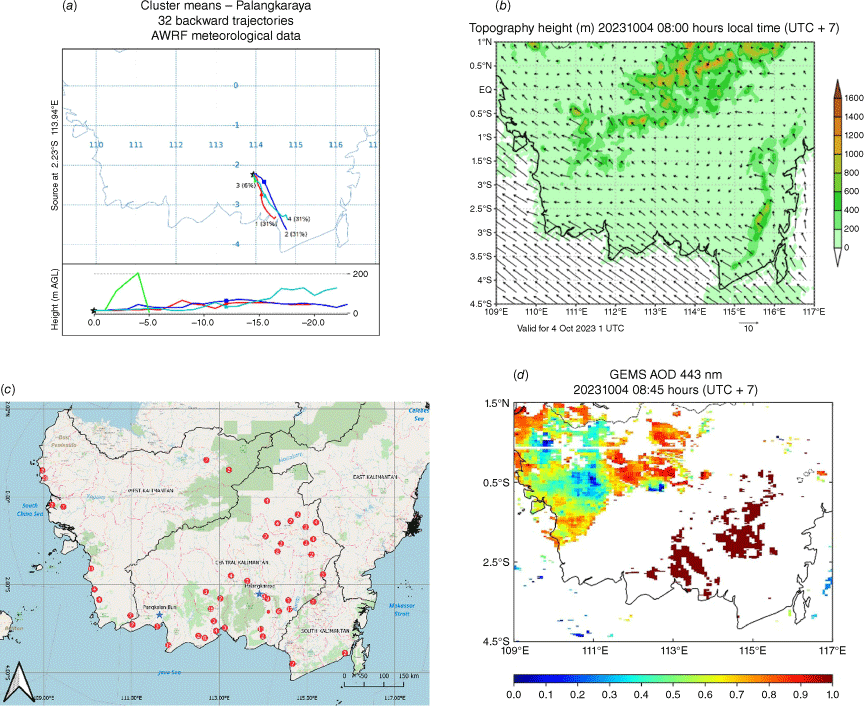
Hotspot analysis showed 53 hotspots along this trajectory (Fig. 9c). Additionally, GEMS satellite data indicated an AOD value exceeding 1 in the Palangka Raya area, signifying a high concentration of PM2.5 particles (Fig. 9d). The AOD increase observed in GEMS data aligns with the HYSPLIT trajectory, suggesting that the elevated PM2.5 levels in Palangka Raya are linked to forest fires in the south-eastern and eastern regions, including South Kalimantan. This conclusion is supported by the alignment of HYSPLIT trajectories, hotspot patterns and GEMS monitoring data. The topography plot further confirms that the smoke affecting Palangka Raya likely originates from the western region of South Kalimantan, attributed to its relatively flat topography.
However, certain areas show a lack of AOD values. This is primarily due to specific atmospheric conditions that hinder accurate measurements. Analysis reveals that these gaps often align with areas of cloud cover, which prevent satellite sensors from accurately detecting aerosols, leading to missing AOD data. Cloud contamination also plays a role; during the data processing phase, areas contaminated by clouds are identified and the affected pixels are excluded to improve the accuracy of AOD measurements (Cho et al. 2024). Moreover, sun-glint, which occurs when sunlight reflects off water surfaces, can reduce the sensitivity of aerosol detection, resulting in invalid data over these regions. These sun-glint-affected pixels are similarly filtered out during processing (Kim B-R et al. 2024). As a result, the absence of AOD values in certain locations may not necessarily reflect a lack of aerosols but rather the influence of atmospheric conditions, such as cloudiness and sun-glint, on the retrieval process.
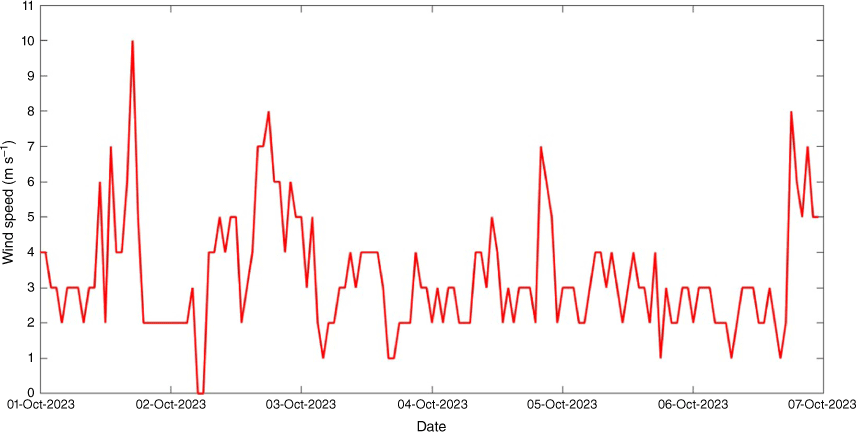
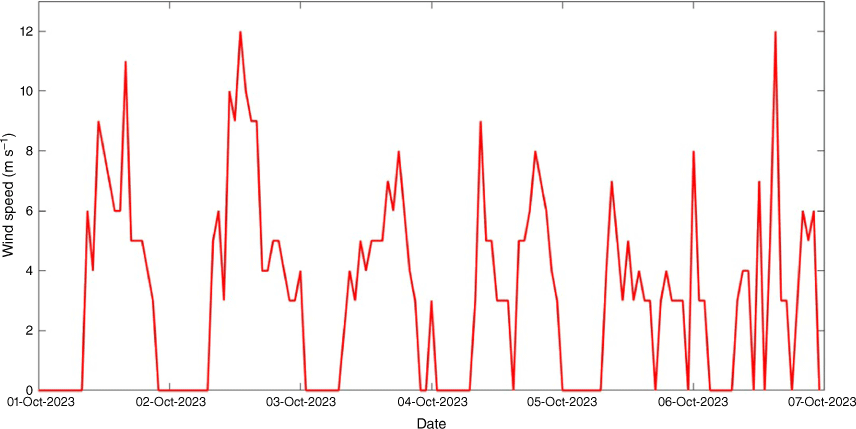
Meteorological parameters play a crucial role in determining atmospheric stability and pollutant dispersion. Wind speed and rainfall, in particular, influence how far pollutants can travel. Analysis of wind speeds in Palangka Raya from 1 to 6 October 2023 showed a range of 2–10 m s–1 (Fig. 10). In comparison, Pangkalan Bun experienced wind speeds ranging from 2 to 12 m s–1, indicating that winds in Palangka Raya tend to be slower (Fig. 11). In the absence of rainfall, the slower wind speeds in Palangka Raya result in a shorter dispersion trajectory for PM2.5, contributing to the higher concentrations observed in the region (Fig. 9a). This reduced wind velocity fosters a more stagnant atmospheric environment, hindering the effective dispersion of PM2.5 particles. The absence of rainfall exacerbates this stagnation by inhibiting the natural removal processes that typically reduce airborne PM. Rainfall acts as a critical cleansing mechanism, facilitating the washout of aerosols from the atmosphere. Consequently, during periods without rainfall, PM2.5 can remain suspended for extended durations, leading to elevated concentrations in localised areas.
Wind speed in Palangka Raya from 1 to 6 October 2023. All measurements taken at 00:00 hours.
Wind speed in Pangkalan Bun from 1 to 6 October 2023. All measurements taken at 00:00 hours.
The backward trajectory WRF-HYSPLIT plot for Pangkalan Bun, analysed at 1-h intervals over a 30-h period on 1 October 2023, reveals that the primary source of PM2.5 in Pangkalan Bun originates from the south-east (Fig. 12a). The wind field and topography plot show that most wind flow into Pangkalan Bun on that day was from the south-east, highlighting the significant influence of the land–sea breeze event. This phenomenon is evident from the wind vectors predominantly originating from the sea near Pangkalan Bun (Fig. 12b). The topography plot indicates a relatively flat topography around Pangkalan Bun, which facilitates the occurrence of land–sea breeze events.
(a) Backward trajectory plot from WRF-HYSPLIT for Pangkalan Bun at 1-h intervals over a 30-h period, ending at 23:00 hours local time (UTC + 7) on 2 October 2023; (b) wind vectors and topography in Kalimantan on 2 October 2023 at 14:00 hours local time; (c) hotspot mapping in Kalimantan on 2 October 2023; and (d) aerosol optical depth (AOD) values in Kalimantan on 2 October 2023 at 13:45 hours local time.
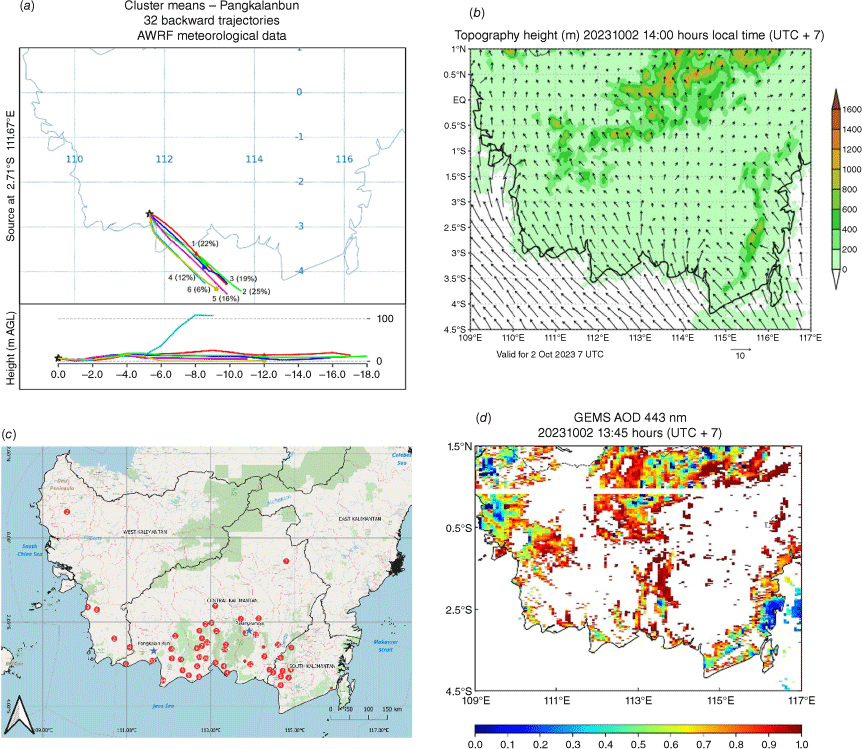
The hotspot plot reveals 97 hotspots along the trajectory path (Fig. 12c). This suggests that PM2.5 in Pangkalan Bun may originate from both nearby hotspots and sea salt aerosols. To validate this hypothesis, a detailed analysis of the properties and composition of PM2.5 in the region is recommended. The GEMS satellite imagery corroborates this observation, showing an AOD value exceeding 1 in Pangkalan Bun, indicating a high density of PM2.5 (Fig. 12d). Similarly to Palangka Raya, the elevated PM2.5 levels in Pangkalan Bun are associated with hotspots in the south-eastern region. The HYSPLIT plot, hotspot visualisation and GEMS data all support this conclusion. However, owing to Pangkalan Bun’s proximity to the sea, the number of hotspots affecting the area is lower, and the predominant sea breeze results in reduced PM2.5 concentrations compared with Palangka Raya. The faster wind speeds in Pangkalan Bun contribute to a longer trajectory for PM2.5 transport. This can be attributed to the coastal location of Pangkalan Bun, where reduced friction between sea and wind allows higher wind speeds and extended pollutant trajectories (Fig. 12a).
This study investigated the plume rise phenomenon resulting from biomass burning in Central Kalimantan using the WRF-HYSPLIT model to analyse PM2.5 dispersion. The plume rise mechanism is critical for understanding pollutant transport, as pollutants reaching the free troposphere can be dispersed more rapidly owing to greater wind speeds, especially outside the equatorial tropics. However, the findings indicate that in Central Kalimantan, average wind speeds are relatively low, and pollutant trajectories are primarily confined to altitudes of ~0–400 m AGL, which limits the vertical extent of the plume rise. This suggests that the dispersion of pollutants in the region is mainly governed by local wind patterns within the planetary boundary layer (PBL), where removal processes are quite effective. Additionally, it is possible that during the study period, the forest fires in Kalimantan were not severe enough to cause a significant plume rise. Another consideration is that running the WRF-HYSPLIT model at multiple altitudes, while incorporating hotspots and plume rise processes into the simulations, could enhance the identification and understanding of the plume rise phenomenon.
The findings of this study hold significant potential for enhancing air quality management and forest fire monitoring in Central Kalimantan, particularly during high-risk periods such as the dry season. The results can assist local authorities in implementing preventive measures, including the development of early warning systems based on hotspot and PM2.5 monitoring to reduce public exposure to haze events. Moreover, the application of the WRF-HYSPLIT model to identify pollutant sources can support targeted firefighting strategies and provide insights into the influence of regional meteorological conditions on pollutant dispersion. Furthermore, the study’s insights can inform policy development for sustainable land management practices, particularly in peatland regions, thereby reducing the frequency of fires and associated air pollution.
4Conclusion
Through the utilisation of the WRF-HYSPLIT inline model and satellite instruments, including GEMS, MODIS and VIIRS, this research successfully identified and characterised the sources of PM2.5 resulting from forest fires in Central Kalimantan, focusing on Palangka Raya and Pangkalan Bun. The analysis integrated GEMS data, which provide a comprehensive overview of aerosol optical depth (AOD), along with observations from MODIS and VIIRS, to depict the sources of PM2.5 and assess the impact of forest fires in the region. The research found that PM2.5 originating from the south-east was the primary source of pollution in both Palangka Raya and Pangkalan Bun during the period from 1 to 6 October 2023. The geographical characteristics of the two areas significantly influenced the observed PM2.5 concentration levels. Despite a higher number of hotspots detected along the trajectory, Pangkalan Bun, owing to its proximity to the sea, exhibited lower PM2.5 levels compared with Palangka Raya. The relatively uniform topography in both locations suggests that regional morphology does not significantly impede wind flow, thus contributing to the observed PM2.5 distribution patterns. This research provides valuable insights into managing air quality and environmental issues related to forest fires. Implementing targeted policies and actions, such as establishing early warning systems based on WRF-HYSPLIT and GEMS data, could substantially reduce the impact of forest fires in Central Kalimantan on communities.
Data availability
All data that used in this paper can be accessed through: GEMS data (see https://nesc.nier.go.kr/en/html/datasvc/index.do). The data for Sentinel-2 can be accessed through various platforms, including the Copernicus Open Access Hub (see https://scihub.copernicus.eu), USGS EarthExplorer (see https://earthexplorer.usgs.gov) and Google Earth Engine (see https://earthengine.google.com).
Declaration of funding
This research did not receive any specific funding. A. Nurlatifah received material support from Organisasi Riset Kebumian dan Maritim, Badan Riset dan Inovasi Nasional (ORKM-BRIN) including access to facilities and other essential tools for this research.
Acknowledgements
The authors thank ORKM-BRIN for moral and material support that enabled the completion of this research.
References
Arisanty D, Feindhi Ramadhan M, Angriani P, Muhaimin M, Nur Saputra A, Puji Hastuti K, Rosadi D (2022) Utilizing Sentinel-2 data for mapping burned areas in Banjarbaru wetlands, South Kalimantan province. International Journal of Forestry Research 2022, 1-12.
| Crossref | Google Scholar |
Ballesteros-González K, Sullivan AP, Morales-Betancourt R (2020) Estimating the air quality and health impacts of biomass burning in northern South America using a chemical transport model. The Science of The Total Environment 739, 139755.
| Crossref | Google Scholar | PubMed |
Basith S, Manavalan B, Shin TH, Park CB, Lee WS, Kim J, Lee G (2022) The impact of fine particulate matter 2.5 on the cardiovascular system: a review of the invisible killer. Nanomaterials 12(15), 2656.
| Crossref | Google Scholar | PubMed |
Cattau ME, Harrison ME, Shinyo I, Tungau S, Uriarte M, DeFries R (2016) Sources of anthropogenic fire ignitions on the peat-swamp landscape in Kalimantan, Indonesia. Global Environmental Change 39, 205-219.
| Crossref | Google Scholar |
Chen S-H, Sun W-Y (2002) A one-dimensional time dependent cloud model. Journal of the Meteorological Society of Japan – Series II 80(1), 99-118.
| Crossref | Google Scholar |
Cheng Z, Wang S, Fu X, Watson JG, Jiang J, Fu Q, et al. (2014) Impact of biomass burning on haze pollution in the Yangtze River delta, China: a case study in summer 2011. Atmospheric Chemistry and Physics 14(9), 4573-4585.
| Crossref | Google Scholar |
Cho Y, Kim J, Go S, Kim M, Lee S, Kim M, et al. (2024) First atmospheric aerosol-monitoring results from the Geostationary Environment Monitoring Spectrometer (GEMS) over Asia. Atmospheric Measurement Techniques 17(14), 4369-4390.
| Crossref | Google Scholar |
Crutzen PJ, Heidt LE, Krasnec JP, Pollock WH, Seiler W (1979) Biomass burning as a source of atmospheric gases CO, H2, N2O, NO, CH3Cl and COS. Nature 282(5736), 253-256.
| Crossref | Google Scholar |
Dreher JG (2009) Configuring the HYSPLIT model for National Weather Service Forecast Office and Spaceflight Meteorology Group applications. NASA Contractor Report NASA/CR-2009-214764. (NASA Center for AeroSpace Information: Hanover, MD, USA) Available at https://ntrs.nasa.gov/api/citations/20090023414/downloads/20090023414.pdf
Dudhia J, Moncrieff MW, So DWK (1987) The two‐dimensional dynamics of West African squall lines. Quarterly Journal of the Royal Meteorological Society 113(475), 121-146.
| Crossref | Google Scholar |
Engling G, He J, Betha R, Balasubramanian R (2014) Assessing the regional impact of Indonesian biomass burning emissions based on organic molecular tracers and chemical mass balance modeling. Atmospheric Chemistry and Physics 14(15), 8043-8054.
| Crossref | Google Scholar |
Grell GA (1993) Prognostic evaluation of assumptions used by cumulus parameterizations. Monthly Weather Review 121(3), 764-787.
| Crossref | Google Scholar |
Grell GA, Dévényi D (2002) A generalized approach to parameterizing convection combining ensemble and data assimilation techniques. Geophysical Research Letters 29(14), 38-1-38-4.
| Crossref | Google Scholar |
Hong S-Y, Noh Y, Dudhia J (2006) A new vertical diffusion package with an explicit treatment of entrainment processes. Monthly Weather Review 134(9), 2318-2341.
| Crossref | Google Scholar |
Jamil B, Akhtar N (2017) Comparative analysis of diffuse solar radiation models based on sky-clearness index and sunshine period for humid-subtropical climatic region of India: a case study. Renewable and Sustainable Energy Reviews 78, 329-355.
| Crossref | Google Scholar |
Kaskaoutis DG, Kambezidis HD, Hatzianastassiou N, Kosmopoulos PG, Badarinath KVS (2007) Aerosol climatology: on the discrimination of aerosol types over four AERONET sites. Atmospheric Chemistry and Physics 7, 6357-6411.
| Crossref | Google Scholar |
Kim B-R, Kim G, Cho M, Choi Y-S, Kim J (2024) The first results of cloud retrieval from geostationary environmental monitoring spectrometer. Atmospheric Measurement Techniques 17, 453-470.
| Crossref | Google Scholar |
Kim J, Jeong U, Ahn M, Kim JH, Park RJ, Lee H, Song CH, Choi Y, Lee K, Yoo J, Jeong M, Park SK, Lee K, Song C, Kim S, Kim YJ, Kim S, Kim M, Go S, Liu X, Chance K, Chan Miller C, Al-Saadi J, Veihelmann B, Bhartia PK, Torres O, Abad GG, Haffner DP, Ko DH, Lee SH, Woo J, Chong H, Park SS, Nicks D, Choi WJ, Moon K, Cho A, Yoon J, Kim S, Hong H, Lee K, Lee H, Lee S, Choi M, Veefkind P, Levelt PF, Edwards DP, Kang M, Eo M, Bak J, Baek K, Kwon H, Yang J, Park J, Han KM, Kim B, Shin H, Choi H, Lee E, Chong J, Cha Y, Koo J, Irie H, Hayashida S, Kasai Y, Kanaya Y, Liu C, Lin J, Crawford JH, Carmichael GR, Newchurch MJ, Lefer BL, Herman JR, Swap RJ, Lau AKH, Kurosu TP, Jaross G, Ahlers B, Dobber M, McElroy CT, Choi Y (2020) New era of air quality monitoring from space: Geostationary Environment Monitoring Spectrometer (GEMS). Bulletin of the American Meteorological Society 101(1), E1-E22.
| Crossref | Google Scholar |
Kotroni V, Kallos G, Lagouvardos K, Varinou M, Walko R (1999) Numerical simulations of the meteorological and dispersion conditions during an air pollution episode over Athens, Greece. Journal of Applied Meteorology and Climatology 38, 432-447.
| Crossref | Google Scholar |
Levine JS (2000) Global biomass burning: a case study of the gaseous and particulate emissions released to the atmosphere during the 1997 Fires in Kalimantan and Sumatra, Indonesia. In ‘Biomass Burning and Its Inter-Relationships with the Climate System. Advances in Global Change Research. Vol. 3’. (Eds JL Innes, M Beniston, MM Verstraete) pp. 15–31. (Springer: Dordrecht, Netherlands) 10.1007/0-306-47959-1_2
Manisalidis I, Stavropoulou E, Stavropoulos A, Bezirtzoglou E (2020) Environmental and health impacts of air pollution: a review. Frontiers in Public Health 8, 14.
| Crossref | Google Scholar | PubMed |
Mehmood T, Zhu T, Ahmad I, Li X (2020) Ambient PM2.5 and PM10 bound PAHs in Islamabad, Pakistan: concentration, source and health risk assessment. Chemosphere 257, 127187.
| Crossref | Google Scholar | PubMed |
Mlawer EJ, Taubman SJ, Brown PD, Iacono MJ, Clough SA (1997) Radiative transfer for inhomogeneous atmospheres: RRTM, a validated correlated‐k model for the longwave. Journal of Geophysical Research: Atmospheres 102(D14), 16663-16682.
| Crossref | Google Scholar |
Morakinyo OM, Mokgobu MI, Mukhola MS, Hunter RP (2016) Health outcomes of exposure to biological and chemical components of inhalable and respirable particulate matter. International Journal of Environmental Research and Public Health 13(6), 592.
| Crossref | Google Scholar | PubMed |
Ngan F, Cohen M, Luke W, Ren X, Draxler R (2015) Meteorological modeling using the WRF-ARW Model for Grand Bay intensive studies of atmospheric mercury. Atmosphere 6(3), 209-233.
| Crossref | Google Scholar |
Nurdiati S, Bukhari F, Julianto MT, Sopaheluwakan A, Aprilia M, Fajar I, et al. (2022) The impact of El Niño–Southern Oscillation and Indian Ocean Dipole on the burned area in Indonesia. Terrestrial, Atmospheric and Oceanic Sciences 33(1), 16.
| Crossref | Google Scholar |
Nurlatifah A, Adetya E, Indrawati A, Risyanto, Sumaryati, Komala N, et al. (2023) GEMS satellite identification on volcanic ash distribution of Mount Dukono Eruption in April 2022. In ‘Proceedings of the International Conference on Radioscience, Equatorial Atmospheric Science and Environment and Humanosphere Science’, 22–23 November 2022, held virtually. (Eds A Basit, E Yulihastin, SY Cahyarini, H Santoso, WS Pranowo, L Slamet S, HA Belgaman) Springer Proceedings in Physics, vol. 290, pp. 173–184. (Springer) 10.1007/978-981-19-9768-6_17
Park SS, Kim S-W, Song C-K, Park J-U, Bae K-H (2020) Spatio-temporal variability of aerosol optical depth, total ozone and NO2 over East Asia: strategy for the validation to the GEMS scientific products. Remote Sensing 12(14), 2256.
| Crossref | Google Scholar |
Physick WL, Abbs DJ (1991) Modelling summertime dispersion in the coastal terrain of southeastern Australia. Monthly Weather Review 119, 1014-1030.
| Google Scholar |
Pimonsree S, Vongruang P (2018) Impact of biomass burning and its control on particulate matter over a city in mainland southeast Asia during a smog episode. Atmospheric Environment 195, 196-209.
| Crossref | Google Scholar |
Putra EI (2011) The effect of the precipitation pattern of the dry season on peat fire occurrence in the Mega Rice Project area, Central Kalimantan, Indonesia. Tropics 19, 145-156.
| Crossref | Google Scholar |
Rahman MS, Azad MAK, Hasanuzzaman M, Salam R, Islam ARMT, Rahman MM, Hoque MMM (2021) How air quality and COVID-19 transmission change under different lockdown scenarios? A case from Dhaka city, Bangladesh. The Science of The Total Environment 762, 143161.
| Crossref | Google Scholar | PubMed |
Reid JS, Koppmann R, Eck TF, Eleuterio DP (2005) A review of biomass burning emissions. Part II: intensive physical properties of biomass burning particles. Atmospheric Chemistry and Physics 5(3), 799-825.
| Crossref | Google Scholar |
Rodgers WC, Nicewander WA (1988) Pearson’s product-moment correlation coefficient. Statistical Science 3(3), 290-301.
| Google Scholar |
Rojano R, Arregocés H, Gámez Frías E (2021) Changes in ambient particulate matter during the COVID-19 and associations with biomass burning and Sahara dust in northern Colombia. Heliyon 7(12), e08595.
| Crossref | Google Scholar | PubMed |
Seiler W, Crutzen PJ (1980) Estimates of gross and net fluxes of carbon between the biosphere and the atmosphere from biomass burning. Climatic Change 2, 207-247.
| Crossref | Google Scholar |
Stein AF, Draxler RR, Rolph GD, Stunder BJB, Cohen MD, Ngan F (2015) NOAA’s HYSPLIT atmospheric transport and dispersion modeling system. Bulletin of the American Meteorological Society 96(12), 2059-2077.
| Crossref | Google Scholar |
Tao L, Harley RA (2014) Changes in fine particulate matter measurement methods and ambient concentrations in California. Atmospheric Environment 98, 676-684.
| Crossref | Google Scholar |
Taravat A, Los H (2021) Sentinel-2 based service for identify and map wildfire events. In ‘2021 IEEE International Geoscience and Remote Sensing Symposium IGARSS’, 11–16 July 2021, Brussels, Belgium. pp. 6728–6730. (IEEE) 10.1109/igarss47720.2021.9555057
Thangavel P, Park D, Lee YC (2022) Recent insights into particulate matter (PM2.5)-mediated toxicity in humans: an overview. International Journal of Environmental Research and Public Health 19(12), 7511.
| Crossref | Google Scholar | PubMed |
Usup A, Hayasaka H (2023) Peatland fire weather conditions in Central Kalimantan, Indonesia. Fire 6(5), 182.
| Crossref | Google Scholar |
van der Werf GR, Randerson JT, Giglio L, van Leeuwen TT, Chen Y, Rogers BM, et al. (2017) Global fire emissions estimates during 1997–2016. Earth System Science Data 9(2), 697-720.
| Crossref | Google Scholar |
Wang G, Ostoja-Starzewski M (2004) Influence of topography on the Phoenix CO2 dome: a computational study. Atmospheric Science Letters 5, 103-107.
| Crossref | Google Scholar |
Willmott CJ, Matsuura K (2005) Advantages of the mean absolute error (MAE) over the root mean square error (RMSE) in assessing average model performance. Climate Research 30(1)), 81-89.
| Crossref | Google Scholar |
Yadav IC, Devi NL (2019) Biomass burning, regional air quality, and climate change. In ‘Encyclopedia of Environmental Health’, 2nd edn. (Ed. J Nriagu) pp. 386–391. (Elsevier) 10.1016/B978-0-12-409548-9.11022-X
Yulianti N, Hayasaka H (2013) Recent active fires under El Niño conditions in Kalimantan, Indonesia. American Journal of Plant Sciences 4(3), 685-696.
| Crossref | Google Scholar |
Zhang R, Liu C, Zhou G, Sun J, Liu N, Hsu P-C, et al. (2017) Morphology and property investigation of primary particulate matter particles from different sources. Nano Research 11, 3182-3192.
| Crossref | Google Scholar |
Zhao H (2022) Chapter 18 - Biomass burning emission and impacts on air pollution in China. In ‘Asian Atmospheric Pollution’. (Ed. RP Singh) pp. 335–347. (Elsevier) 10.1016/B978-0-12-816693-2.00024-X
Zong Z, Wang X, Tian C, Chen Y, Qu L, Ji L, et al. (2016) Source apportionment of PM2.5 at a regional background site in North China using PMF linked with radiocarbon analysis: insight into the contribution of biomass burning. Atmospheric Chemistry and Physics 16(17), 11249-11265.
| Crossref | Google Scholar |

