Visibility-informed mapping of potential firefighter lookout locations using maximum entropy modelling
Katherine A. Mistick A * , Michael J. Campbell
  A and Philip E. Dennison
  A
A
A
Abstract
Situational awareness is an essential component of wildland firefighter safety. In the US, crew lookouts provide situational awareness by proxy from ground-level locations with visibility of both fire and crew members.
To use machine learning to predict potential lookout locations based on incident data, mapped visibility, topography, vegetation, and roads.
Lidar-derived topographic and fuel structural variables were used to generate maps of visibility across 30 study areas that possessed lookout location data. Visibility at multiple viewing distances, distance to roads, topographic position index, canopy height, and canopy cover served as predictors in presence-only maximum entropy modelling to predict lookout suitability based on 66 known lookout locations from recent fires.
The model yielded a receiver-operating characteristic area under the curve of 0.929 with 67% of lookouts correctly identified by the model using a 0.5 probability threshold. Spatially explicit model prediction resulted in a map of the probability a location would be suitable for a lookout; when combined with a map of dominant view direction these tools could provide meaningful support to fire crews.
This approach could be applied to produce maps summarising potential lookout suitability and dominant view direction across wildland environments for use in pre-fire planning.
Keywords: firefighter safety, lidar, lookout, machine learning, maxent, situational awareness, spatial modelling, visibility.
Introduction
To ensure safety while actively suppressing and managing wildland fires, US firefighters rely on extensive training and standardised directives such as the National Wildfire Coordinating Group’s (NWCG) Incident Response Pocket Guide (IRPG), 10 Standard Firefighting Orders, 18 Watch Out Situations, and Lookouts, Communications, Escape Routes, and Safety Zones (LCES) (Gleason 1991; National Wildfire Coordinating Group 2022). These resources emphasise the importance of situational awareness to avoid dangerous situations and maintain safety in the presence of hazardous conditions. One of the dangerous situations delineated in the 18 Watch Out Situations is, ‘#12. Cannot see main fire; not in contact with someone who can’. This situation is mitigated by ensuring Standard Firefighting Order #5 (‘post lookouts when there is possible danger’) is followed. Further, LCES emphasises that lookouts must maintain a position that provides a view of both the fire and firefighters in their crew so that as fire behaviour and suppression tactics change, this information can be quickly relayed, and adjustments can be made if necessary to maintain crew safety (Gleason 1991). Additionally, NWCG training stipulates that LCES must be, ‘established and known to all firefighters before it is needed’ (National Wildfire Coordinating Group), suggesting lookouts should be assigned for every crew working an incident.
Lookouts can be any experienced crew member with knowledge of crew locations, escape routes, and safety zones. Additionally, they must understand current fire conditions and maintain a position with a view of both the fire and their associated crew (National Wildfire Coordinating Group 2022). A lookout’s location may be dynamic, changing as conditions require. While previous studies have focused on siting of fixed lookout locations, such as towers or buildings (Kucuk et al. 2017; Cosgun et al. 2023), little research has been dedicated to roving crew lookouts and the importance of quantifying visibility across entire wildland landscapes (Mistick et al. 2022). This research has been limited in part because most locations used by lookouts are not preserved in official geospatial incident data, although some actual or potential lookout locations from past incidents are publicly available through the National Interagency Fire Center (NIFC). This research is only concerned with crew members who have been assigned as lookouts; any mention of lookouts hereafter refers to a mobile, ground-based individual tasked with executing the duties of a wildland firefighter lookout. We do not examine static tower locations, which may also use the term ‘lookout’. The landscape conditions that promote suitability for lookout towers and roving crew lookouts are similar, with both benefitting from a high degree of visibility; however, unlike static tower locations, mobile crew lookouts can move throughout the landscape to dynamically adjust their view of the fire or their fellow crew members.
Given the importance of lookouts for ensuring safety in the presence of hazardous conditions, and the availability of lookout locations from official incident data, there is an opportunity to use recent lookout locations to predict and map potential lookout locations – and to understand the drivers of lookout location suitability – across wildland environments for use in future fire management decisions and planning. Due to the limited number of lookout locations available, the vast size of landscapes on which they could be placed, and no true representation of areas that were decidedly avoided for lookout placement, a modelling framework that is suited to presence-only prediction is appropriate for this task. Commonly used for species distribution modelling, maximum entropy (maxent) models only require known locations of occurrence, along with a set of variables that may characterise that occurrence, such as climactic or topographic conditions (Phillips et al. 2006; Moreno et al. 2011; Nazeri et al. 2012; Yan et al. 2020). Maxent models are not limited by a small sample size, and do not require absence data; instead, the models use presence data to find the probability distribution of predictor variables that maximises entropy, and therefore identify the most diverse but probable habitat in which a species may exist (Phillips et al. 2006). Since wildfires do not always occur when climate conditions are favourable, maxent presence-only modelling has also been useful for predicting wildfire danger from a wide range of risk variables (Arnold et al. 2014; Chen et al. 2015; De Angelis et al. 2015; Martín et al. 2019).
Considering lookouts are required to maintain active and direct of lines of sight to various components of the fire environment, maps of landscape-scale visibility could potentially drive a maxent model to determine the likelihood that a location might be suitable for a lookout. Maps of landscape-scale visibility are technologically challenging to achieve due to the computational intensity of line-of-sight calculations at broad spatial scales. Most visibility research relies on aggregate line-of-sight calculations, or ‘viewsheds’, using digital elevation models to determine visible areas of landscapes from a limited set of points (Llobera 2003; Inglis et al. 2022). While advancements have been made in improving the speed of this type of calculation through graphic processing units (GPUs) (Chao et al. 2011; Stojanovic and Stojanovic 2013) and new algorithms (Tabik et al. 2013; Sahraoui et al. 2018; Sanchez-Fernandez et al. 2021), spatially exhaustive (i.e. ‘wall-to-wall’) raster viewshed mapping is still limited by computational intensity. Previous research has found that machine learning can efficiently and accurately predict visibility, in terms of visibility index (VI; the proportion of visible area to total area), at landscape scales using a suite of lidar-derived topographic and vegetation variables (Mistick et al. 2023). This research has found that raster visibility maps predicted using machine learning are fast to generate, even across large areas at high spatial resolution, and are accurate across diverse landscapes in the US. Consequently, this approach may be suitable for use in modelling lookout locations.
The objective of this study is to determine whether machine learning-based maps of visibility and variables capturing distance to roads, topography, and vegetation can reliably predict lookout locations, and to understand which predictor variables contribute most to lookout likelihood. Lookout locations drawn from official incident data in the US served as the presence data for maxent modelling. Lidar-derived landscape information was used to predict and map visibility at a variety of viewing distances, to account for the variety of proximities a lookout may need to maintain to their crew and/or any potential hazards. This information was used to build a maxent model which was then applied spatially to one study area and combined with directional visibility maps to demonstrate an operationally relevant use case.
Materials and methods
Lookout data were compiled from incident databases published on the public repositories within the NIFC’s FTP server (https://ftp.wildfire.gov/). The NIFC FTP provides incident-level data, many of which contain official ArcGIS geodatabases with point, line, and polygon information. These features include but are not limited to features such as fire perimeter polygons, containment lines, and lookout point locations. Each folder on the FTP was scraped, and lookouts were identified by determining if a geodatabase contained a point feature class with ‘event’ in the name, following NWCG geospatial naming conventions (National Wildfire Coordinating Group 2006). If a suitable feature class existed the ‘FeatureCategory’ column was parsed for any occurrences of ‘Lookout’, which also follows NWCG geospatial naming conventions. All incidents from 2020 to 2023 in the seven western US geographic area coordination centres (Northwest, Northern Rockies, Northern California, Great Basin, Rocky Mountain, Southern California, Southwest) were scraped, and 171 unique lookout locations were identified. Even though we had a database of lookout points, and those lookout points were associated with specific fire events, we could not link the timing of lookout point placement with a precise understanding of contemporaneous fire extent. This limited our ability to comprehensively understand the spatiotemporal dimensions of lookout-to-fire visibility. Accordingly, we chose to model a set of short to medium-range viewing distances that would be appropriate for maintaining a line of sight with the crew and the fire on low-moderate intensity fires. However, on high-intensity fires, crews and lookouts may seek greater separation from the fire perimeter, which would necessitate and understanding of longer-distance visibility than that which was modelled in our study.
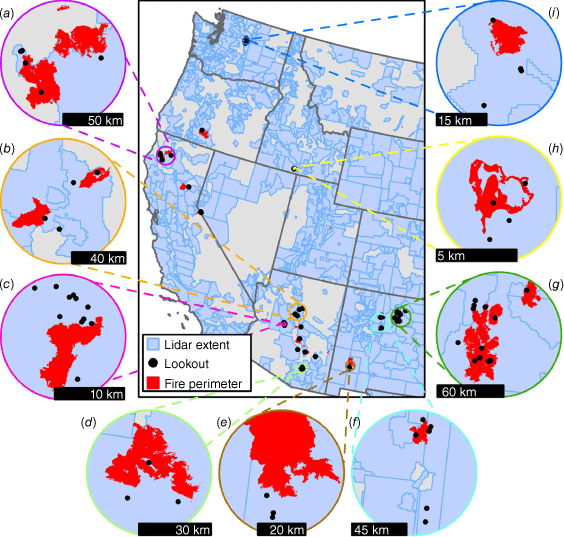
While lookout locations served as the presence data needed for modelling, lidar-derived landscape information was needed surrounding each lookout to provide suitable topographic and vegetative data required for generating visibility maps (Mistick et al. 2023). Of the 171 lookout locations, 66 were within the extent of USGS 3DEP lidar data availability (Fig. 1). Overall, 17 3DEP lidar projects were found to contain lookouts, with all lidar preceding those lookout’s associated fires, with one exception (Table 1). A total of 30 study areas were considered across these lidar projects (Table 1). Initial study areas were defined as areas within 5 km of a lookout, a radius which allowed for sufficient landscape diversity surrounding lookouts (needed for maxent modelling) while balancing file sizes of lidar downloads. Overlapping study areas were aggregated for lookouts <5 km from each other to reduce data redundancies. Lidar data were used to derive 1 m digital terrain and surface models (DTM, DSM) using lidR in R (R ver. 4.3.1) (R Core Team 2023) (lidR version 4.0.3) (Roussel et al. 2020; Roussel and Auty 2024). A DTM provides a raster of terrain elevation values that ignore vegetation height, while a DSM captures terrain elevation plus vegetation height.
Map of 66 lookouts included in the dataset, with lidar extents and associated fire perimeters. Insets, each with their own scale bar, show clusters of three or more lookouts with more detailed lookout locations relative to associated National Interagency Fire Center historical final fire perimeters for incidents with lookouts. (a) Monument Fire and River Complex, (b) Rafael, Pipeline and Tunnel, (c) Crooks, (d) Bighorn, (e) Black, (f) Cerro Pelado, (g) Calf Canyon, Hermits Peak, Cooks Peak, (h) Black Mountain, and (i) Twenty-Five mile.
| Lidar project | Lidar collection start date (MM-YYYY) | Number of study areas | Number of lookouts | Incident name | Incident year (MM-YYYY) | |
|---|---|---|---|---|---|---|
| AZ BlackRock Goodwin | 10-2021 | 1 | 1 | SaltA | 04-2021 | |
| AZ Brawley Rilliito | 03-2019 | 3 | 3 | Bighorn | 06-2020 | |
| AZ Coconino | 08-2019 | 3 | 2 | Rafael | 06-2021 | |
| 1 | Tunnel | 04-2022 | ||||
| 1 | Pipeline | 06-2022 | ||||
| 1 | Viet | 05-2021 | ||||
| AZ Maricopa Pinal | 10-2020 | 1 | 1 | Whitlow | 04-2021 | |
| AZ USGS 3DEP Processing | 08-2013 | 1 | 1 | Backbone | 06-2021 | |
| AZ Yavapai | 09-2021 | 1 | 11 | Crooks | 04-2022 | |
| CA AZ FEMA | 01-2018 | 2 | 1 | Bush | 06-2020 | |
| 2 | Mescal | 06-2021 | ||||
| CA Carr Hirz Delta Fires | 07-2019 | 3 | 2 | Monument | 07-2021 | |
| 1 | River Complex | 07-2021 | ||||
| 2 | SRF Lightning Complex | 08-2022 | ||||
| CA NoCAL 3DEP Supp. Funding | 07-2018 | 1 | 1 | Claremont-Bear | 08-2020 | |
| ID Southern ID | 10-2019 | 1 | 4 | Black Mountain | 09-2023 | |
| NM CO Southern San Luis | 09-2016 | 1 | 4 | Hermits Peak | 04-2022 | |
| NM North Central FEMA | 11-2016 | 5 | 7 | Hermits Peak | 04-2022 | |
| 6 | Cerro Pelado | 04-2022 | ||||
| 2 | NM-CIF Sandia | 04-2022 | ||||
| 1 | Calf Canyon | 04-2022 | ||||
| NM NRCS FEMA Northeast | 11-2017 | 1 | 1 | Cooks Peak | 04-2022 | |
| NM South Central | 11-2018 | 1 | 3 | Black | 06-2022 | |
| NV West Central Earth MRI | 10-2020 | 1 | 2 | Tamarack | 07-2021 | |
| OR Southwest Central Sycan | 07-2020 | 1 | 1 | Bootleg | 07-2021 | |
| WA Eastern Cascades | 10-2019 | 3 | 4 | Twenty-Five Mile | 08-2021 |
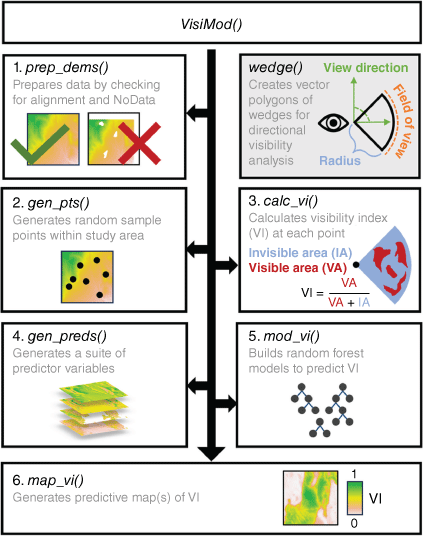
Next, the VisiMod R package (ver. 2.0) (Mistick and Campbell 2024), which was developed to facilitate mapping predicted visibility following the methods in Mistick et al. (2023) was used to prepare, model, and map visibility across all 30 study areas. The package consists of seven main functions (prep_dems(), gen_pts(), wedge(), calc_vi(), gen_preds(), mod_vi(), map_vi()), which combine to form the VisiMod() function that runs the entire visibility modelling and mapping process with just an input DTM and DSM (Fig. 2). The first function prepares the input data by checking for spatial and coordinate system agreement and filling interior and/or trimming exterior NA (NoData) values. Sample points are then generated within the study area, at which VI is calculated. The VI calculation applies an observer height of 1.7 m, to account for human height above the landscape. A suite of topographic and vegetative predictors is then generated from the DTM and DSM (e.g. per-pixel and pixel-neighbourhood average, slope, aspect, elevation, topographic position index (TPI), curvature, canopy height, and canopy cover). Using the suite of predictors and target VI values, a random forest model is then built to predict VI. This model is applied spatially, resulting in a wall-to-wall prediction of VI at one or more desired radii, with a default spatial resolution 10× the input rasters, in this case 10 m. Not only can VisiMod() account for a variety of horizontal radii (e.g. VI within a 100 or 250 m viewing distance), but it also allows users to specify opening fields-of view and view-directions (using the wedge() function, Fig. 2) to consider visibility in specific directions.
The VisiMod workflow (Mistick and Campbell 2024) for producing wall-to-wall maps of predicted VI.
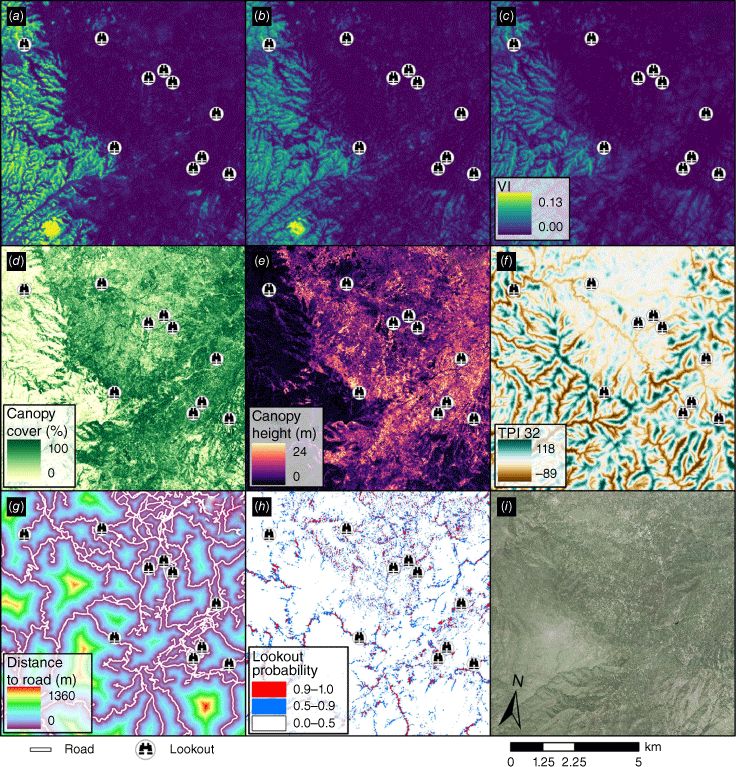
The dismo R package (ver. 1.3-14) (Hijmans et al. 2023) was used to build the maxent model. A maxent framework was selected over other presence-only modelling frameworks (such as generalised additive models or support vector machines) due to its generally superior ability to handle fewer samples of presence-only data (Valavi et al. 2022). While maxent models do not require absence data, they do require some kind of background environmental information, which serves as the basis of model training and prediction. Our maxent model used 17 predictors, all captured in 10 m resolution raster datasets: canopy cover, relative canopy cover, canopy height, relative canopy height, distance to road, VIr (for radius r in 250, 500, 1000 m), relative VI for each radius r, TPI with outer radii of x pixels for x in 2, 4, 6, 8, 16 and 32 where inner radius = x/2 (Fig. 3). Since exact viewing targets were unknown, three radii for VI were selected to represent a reasonable range of distances over which a lookout may be responsible for surveying, with 250 m representing a shorter distance, perhaps between members of the same crew, and 1000 m representing a longer distance, for inter-crew visibility or between crew and a nearby low to moderately fire behaviour. Canopy cover (the ratio of 1 m pixels with heights greater than 1 m to the total number of 1 m pixels within a 10 m pixel) and height were derived from a canopy height model equal to DSM – DTM. TPI, which indicates relative elevation within a focal neighbourhood (Weiss 2001), was derived from the DTMs. TPI is calculated as the elevation minus the average elevation within an annulus with an outer radius x and inner radius x/2, where positive TPI indicates a relative high and negative TPI indicates a relative low. Distance to road was calculated as the distance in metres to the nearest road feature, data that came from an aggregation of linear transportation features from Open Street Map (Open Street Map Contributors 2023) as well as roads and trails from the National Transportation Dataset (U.S. Geological Survey and National Geospatial Technical Operations Center 2023). For each visibility predictor, VisiMod() was used to map VI at each radius, at each study area. Relative VI was calculated as:
where VI is the VI value at a certain pixel location and VIf is the average VI value at a focal radius of 5 pixels (or 50 m). These relative VI measures were intended to capture localised hotspots in visibility, even in locations where absolute VI may be low. Relative canopy height and cover were calculated according to the same equation.
Predictors used in maxent modelling at an example site showing 10 of the 11 lookouts from the Crooks Fire in Arizona. Visibility based predictors were generated using VisiMod with radii r where (a) r = 250 m, (b) r = 500 m, and (c) r = 1000 m. (d) Canopy cover, (e) canopy height, and (f) TPI 32 were generated from lidar-derived DSM and DTMs. Roads from Open Street Map and the National Transportation Dataset are shown in (g) distance to road. (h) Predicted Lookout Probability resulting from the maxent model. (i) NAIP imagery (National Agriculture Imagery Program (NAIP) 2016).
Due to the size of study areas considered, we extracted predictor values at a random sample of points (1000 points per study area), to serve as background data for maxent instead of using the entire gridded raster data. These background data, combined with the lookout presence data, served as inputs into dismo’s maxent() function. In addition to a model built using all possible presence locations, a six-fold cross validation was done to evaluate model effectiveness. Each fold containing 11 random presence locations were left out of modelling once. Model performance was assessed according to the receiver operating characteristic (ROC) curve and its associated area under the curve (AUC), which represents the true positive rate on the y-axis (sensitivity) and the false positive rate on the x-axis (1-specificity). As noted by Phillips (2017), we cannot calculate specificity as it relies on the knowledge of true absences, which we do not have. Instead, maxent uses fractional predicted area (the proportion of samples being predicted as presence) as the x axis of the ROC curve. As fractional predicted area increases, so too should the sensitivity, even if a model was no better than random. However, if the model can possess a high sensitivity even with a relatively small fractional predicted area, it suggests that it can capture the presence niche judiciously. The AUC quantifies this relationship, such that values closer to 1 represent a better ability to precisely distinguish presence from background, whereas values closer to 0.5 represent a model whose predictive capacity is no better than a random guess (Phillips 2017). While usually applied to classifiers with true negatives, ROC curves and AUC values are applicable to maxent models by distinguishing between presence and random in lieu of absence observations (Wiley et al. 2003; Phillips et al. 2006). Variable importance was assessed according to permutation importance, calculated by randomly permuting values for each predictor variable and evaluating the associated change in the model’s AUC.
To demonstrate lookout suitability prediction using maxent, an exhaustive map of lookout likelihood was generated from raster maps of the 17 predictors across a study area encompassing the Hermits Peak Fire. This study area was selected based on the large number of lookouts from incident data, the variety of landscape conditions where lookout locations were recorded, and the wide range in predicted probability of lookout locations. To demonstrate the potential utility of this map we combined the map of lookout likelihood with a map of dominant view direction. Dominant view direction could be useful in a wildland fire management scenario when the visibility of specific hazards and crew are critically important. Dominant view direction was determined by predicting directional VI at a radius of 500 m at the eight cardinal and ordinal directions (view direction = 0, 45, 90, 135, 180, 225, 270, 315°) within fields of view equal to 45° using VisiMod() (Fig. 2), and then executing a per-pixel determination of which view direction returned the maximum VI value.
Results
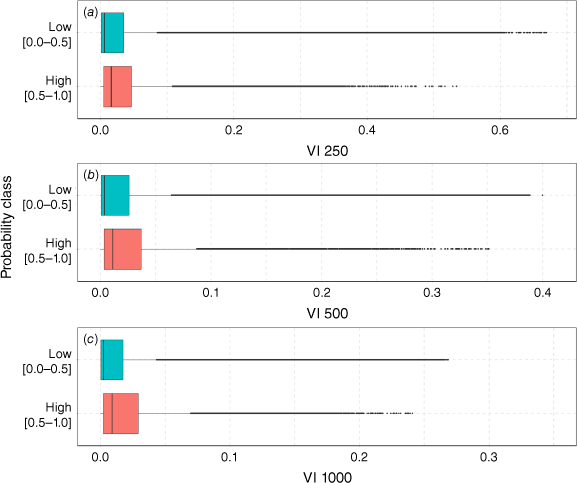
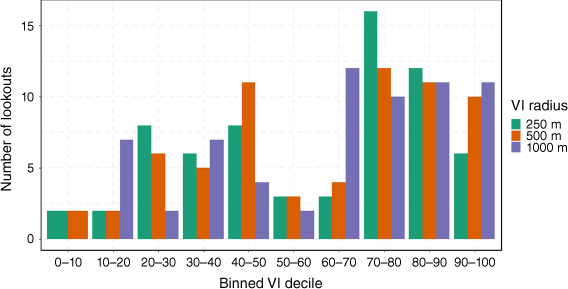
Lookout characteristics were consistent with high visibility. Lookouts were typically located near roads, with a median distance of 32 m from roads, and 73% of lookouts were within 100 m of roads. Lookouts were also generally located in areas with minimal canopy cover (median 19%) and low canopy height (median 1.1 m). TPI values at varying radii were typically negatively skewed from 0, suggesting lookouts are generally placed on relative topographic highs. To determine if lookouts were consistently located in areas with the highest potential VI, VI deciles were determined per study area (for each radius), and the decile in which lookouts fell was plotted accordingly (Fig. 4). Lookouts tended to be located in the highest-possible VI locations (70th, 80th, and 90th decile), regardless of radius (Fig. 4). On average, visibility was slightly higher in areas with higher lookout probability (see Appendix Fig. A1).
Number of lookouts per binned VI percentile, respective of study area. Decile bins are defined per study area and compared with VI values at each lookout location. Lookouts are binned by having a VI value greater than or equal to the threshold decile value for each bin.
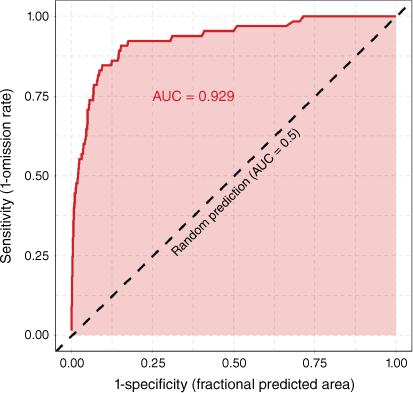
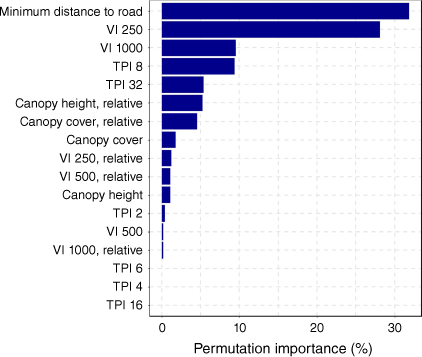
Using the six visibility-based predictors, four vegetation-based predictors, six elevation-based predictors, and distance to roads, the resulting maxent model resulted in an AUC score of 0.929 (Fig. 5), and the 6-fold cross validation resulted in an average test AUC of 0.918 (range [0.895, 0.936]). Given that the maximum possible AUC score is 1.0, our results suggest that maxent modelling is a powerful tool for determining areas on the landscape that may be suitable for placing lookouts in a wildland fire context. The three most important variables according to permutation importance were: (1) distance to roads; (2) short range VI (250 m); and (3) long range VI (1000 m). Fig. 6 highlights the importance of roads and visibility-based predictors in estimating lookout probability. TPI with outer radii 8 and 32 were the next most important, which combined with the importance of long-range VI suggest that lookout locations are recorded according to topographic highs and may favour areas with the long range visibility.
Receiver operating characteristic (ROC) curve for the maxent data with the training area under the curve (AUC).
Relative importance of predictor variables used in maxent modelling, according to permutation importance.
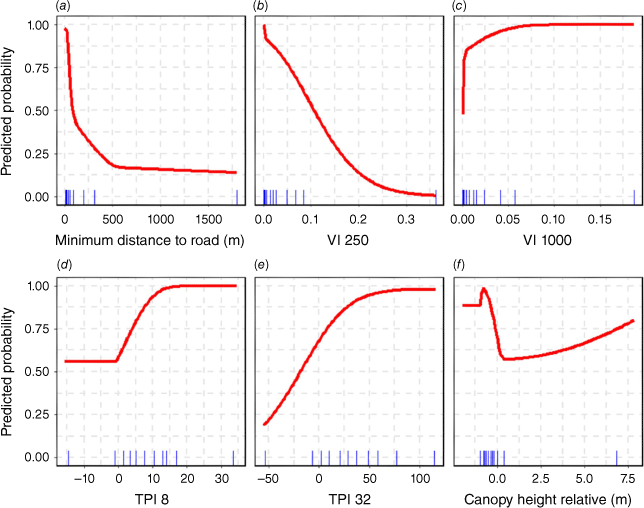
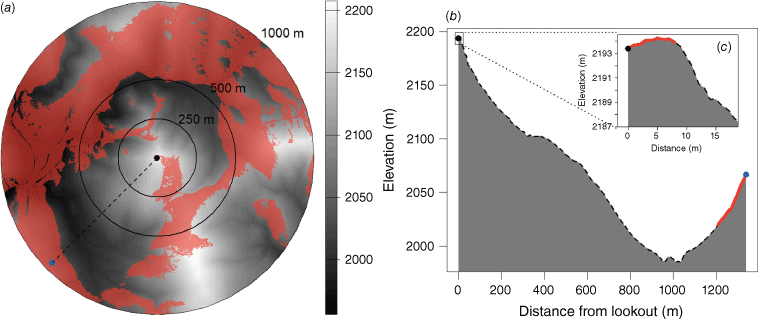
Response curves demonstrate how each variable affects lookout probability in our model (Fig. 7). For example, Fig. 7a shows how increasing distance from a road exponentially decreases the likelihood a location is suitable for a lookout. This pattern is visualized at a particular study area in Fig. 3g, h, showing how predicted lookout probability strongly follows roads. Long range VI has a positive relationship with lookout probability (Fig. 7c), which further suggests lookouts are most likely placed in areas with good long range visibility. However, short range VI has an inverse relationship with lookout probability (Fig. 7b): as short range VI increases, lookout probability decreases. We infer this is because lookouts are generally placed on local topographic high points (owing to the importance of TPI variables and their observed positive response curves (Fig. 7d, e)), whose high relief may hinder short range visibility while promoting long range visibility. This concept is demonstrated in Fig. 8, where the lookout from the Black fire in New Mexico has been placed on a topographic high. (Fig. 8a). This lookout has higher long-range VI (0.44) than short range VI (0.21) because the steep decline in elevation surrounding the lookout (Fig. 8b) prevents short range VI while promoting long-range VI. While standing on a steep mountain peak, one can often very clearly see distant landscape features (e.g. nearby mountains), but one’s ability to see portions of the mountain they just climbed are often compromised by proximate vegetation and topography.
Variable response curves generated from the maxent model, in descending alphabetical order of variable importance. Blue rugs on x-axes indicate deciles of observation data.
(a) Lookout (black dot, coordinates 32.88°N, 107.87°W) from the Black fire in New Mexico, 2022 with VI values VI1000 = 0.44, VI500 = 0.24, and VI250 = 0.21; DTM-based viewshed (red) underlaid by elevation (grayscale) with a dotted line leading to a location on the landscape that demonstrates how long range VI in this area is much greater than short range VI due to high relief. (b) Cross-section of the dotted line shown in (a) indicates visible areas (red) and how short range topography (c) can influence VI.
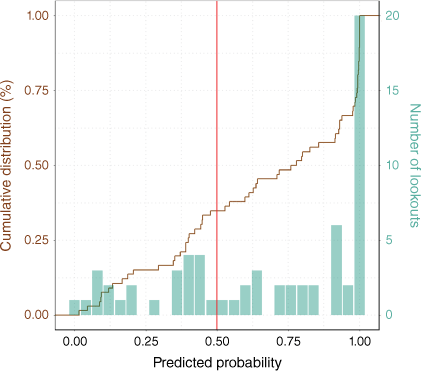
The median predicted probability among the 66 lookouts was 0.73, with 67% of lookouts being correctly predicted as a lookout using a probability threshold of 0.5 (Fig. 9). Some lookouts in the dataset may be located in low probability areas due to uncertainty in GPS coordinates associated with each lookout (e.g. coordinates assigned on-location versus after the fact), relatively high distance to roads, incident-specific situations (e.g. a crew constructing line in a heavily forested area), or visible ranges outside the scope of this analysis (e.g. distances >1000 m). The 22 lookouts with a probability less than 0.5 had a median distance to road of 141 m (versus a median of 15.8 m for lookouts correctly predicted). When compared to higher probability lookouts, lower probability lookouts had a 76% smaller median long range VI value (0.015 and 0.004, respectively) and an 82% smaller median TPI 32 value (37.6 and 6.8, respectively), suggesting the lower probability lookouts are located in areas with more limited long-range visibility and not at distinct topographic highs.
Cumulative distribution (left y-axis) and counts of predicted probability across all 66 lookout locations (right y-axis) with vertical line representing a 0.5-probability threshold.
Example case study
The Hermits Peak Fire began as a prescribed burn on 6 April 2022 in New Mexico, and was managed in conjunction with the nearby Calf Canyon Fire. The combined fires grew to over 138,000 ha, prompting evacuations and requiring a variety of equipment and personnel (InciWeb 2022). Near daily incident data was available for this fire on the NIFC FTP, and 11 lookout locations were collected and used in this example case study. Fig. 10d shows an example lookout probability map for and area including five lookouts, underlaid with directional visibility. Detailed maps are shown for a lookout with a high probability (Fig. 10, top row) and three lookouts with low probability (Fig. 10, bottom row). Across the entire study area there are few locations suitable for lookouts, but the highest probability locations are generally along or near roads in keeping with the high importance of the distance to roads variable.
(a, d, e) Predicted lookout probability overlaid on dominant view direction for the Hermits Peak fire in New Mexico. (d) Symbols for five lookouts on the NM North Central FEMA lidar project. One inset (a) shows a single lookout in (b) an area of very low canopy cover and (c) at a relative topographic high. A second inset (e) shows three lookouts, in (f) an area of relatively high canopy cover and (g) at relative topographic highs.
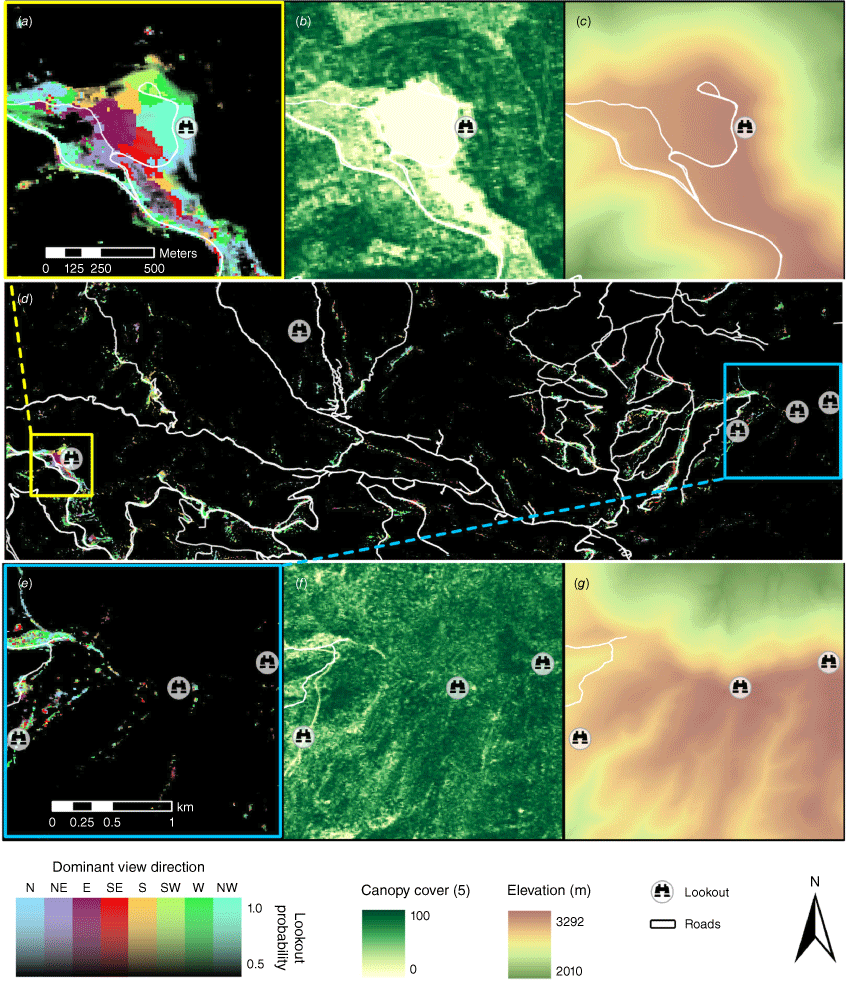
The lookout in Fig. 10a was correctly predicted as an excellent lookout location with a probability >0.99. This area is a topographic high (Fig. 10c) with minimal canopy cover (Fig. 10b), but it also has a variety of dominant view directions (Fig. 10a). The incident data also recorded a comment on this lookout feature that this location was ‘a place to look out over division alpha, on top of JohnsonMesa [sic]’. According to incident data from the date the lookout feature was created, division alpha was in the north-eastern direction, and Johnson Mesa was in the south-eastern direction. The comment further suggests that this location was selected because it provides a good, multidirectional view of areas involved in the management of the incident.
The three lookouts in Fig. 10e had probabilities less than 0.5. However, all three were within 100 m of high probability locations (probability = 0.99, 0.61, and 0.66, respectively, moving west to east). Low probability for these lookouts may be a result of imprecisely recorded incident data (e.g. a lookout placed from memory instead of using exact GPS coordinates), increased distance to road, or extenuating circumstances revealed in the comments. For example, the eastern-most lookout retains a comment: ‘Look out point, NE down into state road 518’, but state road 518 is nearly 7 km to the east, suggesting that this lookout’s target is outside the scope of this analysis, being that it is greater than 1 km from the lookout. However, the dominant view direction at this location is south, which does agree with the comment’s suggestion, indicating that it is also possible that this lookout point was not placed at the correct coordinates. The comment for the middle lookout reads, ‘Look through canopy north’, which confirms the presence of high canopy cover that reduces visibility, and also agrees with the dominant view direction being north for this area. Both the middle and eastern-most lookouts are more than 1 km from the nearest road, which likely reduced their probability. Lidar data were acquired 6 years before the fire (Table 1), and it is also possible that disturbances in vegetation or fuel reductions that increased visibility occurred since lidar was flown at this site.
Discussion
When combined with maps of visibility, vegetation and topographic information, and distance to roads, our results suggest that lookout locations derived from incident data can be used to predict locations on a landscape that may be most suitable to place a lookout in the context of wildland fire management. These findings highlight the power of geospatial data and machine learning to deliver meaningful results that may enhance safety in management decisions and planning related to wildland fires. Lookout predictions may be useful in combination with other geospatial fire safety products to identify and evaluate the suitability of safety zones (Dennison et al. 2014; Campbell et al. 2017b, 2022), map escape routes and understand wildland firefighter travel rates (Campbell et al. 2017a, 2019; Sullivan et al. 2020), assess suppression difficulty (Rodríguez y Silva et al. 2020), and to improve management strategies (Thompson et al. 2021, 2022; Buettner et al. 2023; Fillmore and Paveglio 2023).
This research is aligned with previous work that has used geospatial data and machine learning to deliver products to improve planning and management of wildfires. For example, (O’Connor et al. 2017) used boosted logistic regression to predict final fire perimeters based topography, vegetation, hydrographic features, roads, and suppression difficulty, among other variables pertinent to fire behaviour and management. These models have been applied to map potential control locations (PCLs), which can indicate strategic borders used in potential operational delineations (PODs), which have been introduced as a geospatial decision support tool that combines landscape information such as topography and ecological conditions, potential hazards, and strategic response plans to provide a comprehensive, pre-planned framework for managing wildfires and wildfire-prone landscapes (O’Connor et al. 2016; Thompson et al. 2021, 2022).
While the previous examples have resulted in operationalised applications, some changes to lookout prediction may need to be considered to for operational context. Distance to road had the highest permutation importance (Fig. 6) of any variable. Roads can provide rapid access and evacuation for lookouts, but variables based on distance to road may not be appropriate in roadless areas; while some of these roadless areas are captured in our dataset (Fig. 10e), these comparably rare situations may not be fully reflected in model and therefore must be uniquely considered. A polygon-based product may provide more succinct and easily digestible information making it more likely to be used in management and planning, rather than a complex 2-layer raster product. Further, to provide a more straightforward identification of lookout locations, the probability map could be further constrained by increasing the current probability threshold of 0.5 to a higher value such as 0.9 to indicate only the highest probability locations. This would reduce the expanse of identified potential lookout locations but would provide greater confidence that selected areas are more suitable.
The lookout probability models relied heavily on our predicted maps of VI. Given that these maps are themselves a modelled product, their inherent uncertainty likely propagated through the entire modelling workflow, which may have negatively affected the lookout probability model accuracy. In a previous study, the VI random forest models were tested in a variety of landscapes throughout the US, demonstrating an impressive capacity to accurately predict visibility in a wide range of ecological settings (Mistick et al. 2023). We did not conduct an independent accuracy assessment of the VI maps, and thus cannot precisely state the degree to which their uncertainty may have affected the lookout probability modelling results. Indeed, uncertainty in the roads dataset could have further introduced error in the final model. However, our results demonstrate that despite propagated error from any of the predictor variables, we found that lookout probability could be accurately predicted. Lidar data availability remains a limitation for nationwide application, as only 66 of a potential 171 lookouts were included in this study due to limited lidar coverage. Lidar coverage will continue to expand through the USGS 3DEP program, but currency of data may become an issue if lidar acquisitions are not repeated over time.
The resulting product could also be improved by incorporating longer (>1000 m) distances that were not considered in this study due to increased computational complexity associated with modelling visibility at such distances. Crew members acting as lookouts may be required to survey greater distances, especially if extreme fire behaviour prevents crew from operating in close proximity to the fire front. The use of binoculars also increases one’s ability to see to greater distances, something this study does not consider. Not only could longer distances improve the product for the presented use-case, but they may also expand the possible uses. For example, unmanned aircraft system (UAS) technology is becoming more widespread for wildfire detection and mitigation operations (Baek and Lim 2018; Bailon-Ruiz et al. 2022; Seraj et al. 2022). Small, crew-carried UASs are limited by battery life and require skyward visibility for launch, but these maps could be applied to find potential launch sites as well as to target desirable areas in which flying a UAS would maximise the vehicle’s view of potential crew or hazard, especially if greater distances could be accounted for. This could be accomplished by modifying our current methods to account for an observer height equal to that of the UAS (current observer height is 1.7 m, an average human height).
In this study, we focused on omnidirectional visibility as the basis of VI predictions, acting under the assumption that lookouts will generally benefit from areas with high visibility in all directions. However, at the incident level, if one sought to identify an optimal location to place a lookout that promoted high visibility in a particular direction, one could employ a similar workflow as we have done here relying instead on VisiMod’s capacity to model directionally specific visibility (Mistick et al. 2023). Further, if not only the view direction is known but also both the crew and fire location are known, and the goal is merely to optimally place a firefighter lookout in a real-time situation, then viewshed analyses can be used to map areas that maintain high degrees of shared crew and fire visibility (Mistick et al. 2022).
Moving forward, efforts should be made to catalogue additional lookout locations and metadata from fire incidents in the US and in other countries. Archiving of lookout locations has only recently begun (Table 1), and larger, more comprehensive datasets of lookout locations may lead to improved models. While our model captures areas that are most likely to be suitable for a lookout, a variety of unique conditions may present themselves on incidents that would require lookouts to be placed outside these areas. This may be why several lookouts were modelled to have probabilities <0.5: perhaps the crew was working away from roads, or the positioning of crew and/or fire required a lookout to be located within dense canopy with a narrow view, which may be modelled as a less likely lookout location. The model may be biased towards lookouts near roads and with good visibility, therefore missing these unique locations; however, this is the goal of maxent modelling: to identify the prevailing trends in landscape suitability based on provided presence data. It is also possible that some incident-derived lookout locations were sub-optimally chosen, and since our model is delineating the best possible locations for lookouts it may help improve future selection of lookout locations. With more lookout location data, the model may be able to recognise the similarities between these more unique locations, therefore providing a more comprehensive overview of lookout suitability. Specifically, it would be useful to have timestamped locations of lookouts, crews, and fire, such that current ambiguities in what lookouts are looking at (including direction and distance) can be resolved.
Conclusion
In this study, we applied maxent modelling to a combination of incident and geospatial data to produce maps of areas most suitable to place lookouts in a wildland fire context. Historical lookout locations extracted from incident data and a suite of six visibility-based predictors, generated using the VisiMod R package that was built to facilitate visibility mapping in contexts such as vegetation-based predictors, topographic-based predictors, and distance to roads provided the necessary landscape information needed to build the maxent model. The model successfully predicted lookout locations for nearly two-thirds of the historic lookout locations and had an AUC of 0.929 meaning it was exceptionally good at discerning likely lookout locations from random locations. The resulting model was used to map the likelihood a location is suitable for a lookout within the Hermits Peak Fire study area. Applying a threshold of 0.5 to the probability maps and combining them with maps of dominant view direction, we were able to provide an example of how this modelling could be used in a wildland fire management scenario.
Data availability
Incident data are publicly available from https://ftp.wildfire.gov/. Lidar data are publicly available from the USGS 3DEP Elevation program at https://www.usgs.gov/3d-elevation-program.
Declaration of funding
This work was supported by the National Science Foundation (#BCS-2117865) and the USDA Forest Service (#21-CS-11221636-120).
References
Arnold JD, Brewer SC, Dennison PE (2014) Modeling climate-fire connections within the Great Basin and Upper Colorado River Basin, western United States. Fire Ecology 10, 64-75.
| Crossref | Google Scholar |
Baek H, Lim J (2018) Design of future UAV-relay tactical data link for reliable UAV control and situational awareness. IEEE Communications Magazine 56, 144-150.
| Crossref | Google Scholar |
Bailon-Ruiz R, Bit-Monnot A, Lacroix S (2022) Real-time wildfire monitoring with a fleet of UAVs. Robotics and Autonomous Systems 152, 104071.
| Crossref | Google Scholar |
Buettner WC, Beeton TA, Schultz CA, Caggiano MD, Greiner MS (2023) Using PODs to integrate fire and fuels planning. International Journal of Wildland Fire 32, 1704-1710.
| Crossref | Google Scholar |
Campbell MJ, Dennison PE, Butler BW (2017a) A LiDAR-based analysis of the effects of slope, vegetation density, and ground surface roughness on travel rates for wildland firefighter escape route mapping. International Journal of Wildland Fire 26, 884-895.
| Crossref | Google Scholar |
Campbell MJ, Dennison PE, Butler BW (2017b) Safe separation distance score: a new metric for evaluating wildland firefighter safety zones using lidar. International Journal of Geographical Information Science 31, 1448-1466.
| Crossref | Google Scholar |
Campbell MJ, Page WG, Dennison PE, Butler BW (2019) Escape route index: a spatially-explicit measure of wildland firefighter egress capacity. Fire 2, 40.
| Crossref | Google Scholar |
Campbell MJ, Dennison PE, Thompson MP, Butler BW (2022) Assessing potential safety zone suitability using a new online mapping tool. Fire 5, 5.
| Crossref | Google Scholar |
Chao F, Chongjun Y, Zhuo C, Xiaojing Y, Hantao G (2011) Parallel algorithm for viewshed analysis on a modern GPU. International Journal of Digital Earth 4, 471-486.
| Crossref | Google Scholar |
Chen F, Du Y, Niu S, Zhao J (2015) Modeling Forest Lightning Fire Occurrence in the Daxinganling Mountains of Northeastern China with MAXENT. Forests 6, 1422-1438.
| Crossref | Google Scholar |
Cosgun U, Coşkun M, Toprak F, Yıldız D, Coşkun S, Taşoğlu E, Öztürk A (2023) Visibility evaluation and suitability analysis of fire lookout towers in Mediterranean Region, southwest Anatolia/Türkiye. Fire 6, 305.
| Crossref | Google Scholar |
De Angelis A, Ricotta C, Conedera M, Pezzatti GB (2015) Modelling the meteorological forest fire niche in heterogeneous pyrologic conditions. PLoS One 10, e0116875.
| Crossref | Google Scholar | PubMed |
Dennison PE, Fryer GK, Cova TJ (2014) Identification of firefighter safety zones using lidar. Environmental Modelling & Software 59, 91-97.
| Crossref | Google Scholar |
Fillmore SD, Paveglio TB (2023) Use of the Wildland Fire Decision Support System (WFDSS) for full suppression and managed fires within the Southwestern Region of the US Forest Service. International Journal of Wildland Fire 32, 622-635.
| Crossref | Google Scholar |
Gleason P (1991) Lookouts, Communication, Escape Routes and Safety Zones, ‘LCES’. Available at https://www.nwcg.gov/sites/default/files/wfldp/docs/lces-gleason.pdf
Hijmans R, Phillips S, Leathwick J, Elith J (2023) dismo: Species Distribution Modeling. Available at https://CRAN.R-project.org/package=dismo
InciWeb (2022) Hermits Peak Fire. Available at https://inciweb.nwcg.gov/incident-information/nmsnf-hermits-peak-fire
Inglis NC, Vukomanovic J, Costanza J, Singh KK (2022) From viewsheds to viewscapes: trends in landscape visibility and visual quality research. Landscape and Urban Planning 224, 104424.
| Crossref | Google Scholar |
Kucuk O, Topaloglu O, Altunel AO, Cetin M (2017) Visibility analysis of fire lookout towers in the Boyabat State Forest Enterprise in Turkey. Environmental Monitoring and Assessment 189, 329.
| Crossref | Google Scholar | PubMed |
Llobera M (2003) Extending GIS-based visual analysis: the concept of visualscapes. International Journal of Geographical Information Science 17, 25-48.
| Crossref | Google Scholar |
Martín Y, Zúñiga-Antón M, Rodrigues Mimbrero M (2019) Modelling temporal variation of fire-occurrence towards the dynamic prediction of human wildfire ignition danger in northeast Spain. Geomatics, Natural Hazards and Risk 10, 385-411.
| Crossref | Google Scholar |
Mistick K, Campbell M (2024) VisiMod: Map Modeled Visibility Index Across Wildland Landscapes. Available at https://github.com/kamistick/VisiMod
Mistick KA, Dennison PE, Campbell MJ, Thompson MP (2022) Using geographic information to analyze wildland firefighter situational awareness: impacts of spatial resolution on visibility assessment. Fire 5, 151.
| Crossref | Google Scholar |
Mistick KA, Campbell MJ, Thompson MP, Dennison PE (2023) Using airborne lidar and machine learning to predict visibility across diverse vegetation and terrain conditions. International Journal of Geographical Information Science 37, 1728-1764.
| Crossref | Google Scholar |
Moreno R, Zamora R, Molina JR, Vasquez A, Herrera MÁ (2011) Predictive modeling of microhabitats for endemic birds in South Chilean temperate forests using Maximum entropy (Maxent). Ecological Informatics 6, 364-370.
| Crossref | Google Scholar |
National Agriculture Imagery Program (NAIP) (2016) USGS EROS Archive - Aerial Photography - National Agriculture Imagery Program (NAIP). 10.5066/F7QN651G
National Wildfire Coordinating Group (2006) Geographic Information System Standard Operating Procedures on Incidents. Available at http://npshistory.com/publications/fire/gstop-2006.pdf
National Wildfire Coordinating Group (2022) NWCG Incident Response Pocket Guide (IRPG), PMS 461. Available at https://fs-prod-nwcg.s3.us-gov-west-1.amazonaws.com/s3fs-public/publication/pms461.pdf?VersionId=lXUgkLMK9mRTMyssaamowdM3y6u7CKpl
National Wildfire Coordinating Group (2020) S-131 Unit 3: Lookouts, Communications, Escape Routes, and Safety Zones (LCES). In ‘NWCG Instructor Guide’. pp. 1–25. Available at https://training.nwcg.gov/dl/s131/s-131-ig03.pdf
Nazeri M, Jusoff K, Madani N, Mahmud AR, Bahman AR, Kumar L (2012) Predictive modeling and mapping of Malayan Sun Bear (Helarctos malayanus) distribution using maximum entropy. PLoS One 7, e48104.
| Crossref | Google Scholar | PubMed |
Open Street Map Contributors (2023) Open Street Map. Available at https://www.openstreetmap.org
O’Connor C, Thompson M, Rodríguez Y Silva F (2016) Getting ahead of the wildfire problem: quantifying and mapping management challenges and opportunities. Geosciences 6, 35.
| Crossref | Google Scholar |
O’Connor CD, Calkin DE, Thompson MP (2017) An empirical machine learning method for predicting potential fire control locations for pre-fire planning and operational fire management. International Journal of Wildland Fire 26, 587-597.
| Crossref | Google Scholar |
Phillips SJ (2017) ‘A Brief Tutorial on Maxent.’ (AT&T Research) Available at http://biodiversityinformatics.amnh.org/open_source/maxent/
Phillips SJ, Anderson RP, Schapire RE (2006) Maximum entropy modeling of species geographic distributions. Ecological Modelling 190, 231-259.
| Crossref | Google Scholar |
R Core Team (2023) R: A Language and Environment for Statistical Computing. Available at https://www.R-project.org/
Rodríguez y Silva F, O’Connor CD, Thompson MP, Molina Martínez JR, Calkin DE (2020) Modelling suppression difficulty: current and future applications. International Journal of Wildland Fire 29, 739-751.
| Crossref | Google Scholar |
Roussel J-R, Auty D (2024) Airborne LiDAR Data Manipulation and Visualization for Forestry Applications. Available at https://cran.r-project.org/package=lidR
Roussel J-R, Auty D, Coops NC, Tompalski P, Goodbody TRH, Meador AS, Bourdon J-F, De Boissieu F, Achim A (2020) lidR: An R package for analysis of Airborne Laser Scanning (ALS) data. Remote Sensing of Environment 251, 112061.
| Crossref | Google Scholar |
Sahraoui Y, Vuidel G, Joly D, Foltête J-C (2018) Integrated GIS software for computing landscape visibility metrics. Transactions in GIS 22, 1310-1323.
| Crossref | Google Scholar |
Sanchez-Fernandez AJ, Romero LF, Bandera G, Tabik S (2021) A data relocation approach for terrain surface analysis on multi-GPU systems: a case study on the total viewshed problem. International Journal of Geographical Information Science 35, 1500-1520.
| Crossref | Google Scholar |
Seraj E, Silva A, Gombolay M (2022) Multi-UAV planning for cooperative wildfire coverage and tracking with quality-of-service guarantees. Autonomous Agents and Multi-Agent Systems 36, 39.
| Crossref | Google Scholar |
Stojanovic N, Stojanovic D (2013) Performance improvement of viewshed analysis using GPU. In ‘2013 11th International Conference on Telecommunications in Modern Satellite, Cable and Broadcasting Services (TELSIKS)’, Nis, Serbia. pp. 397–400. (IEEE: Nis, Serbia) 10.1109/TELSKS.2013.6704407
Sullivan PR, Campbell MJ, Dennison PE, Brewer SC, Butler BW (2020) Modeling wildland firefighter travel rates by terrain slope: results from GPS-tracking of Type 1 crew movement. Fire 3, 52.
| Crossref | Google Scholar |
Tabik S, Zapata EL, Romero LF (2013) Simultaneous computation of total viewshed on large high resolution grids. International Journal of Geographical Information Science 27, 804-814.
| Crossref | Google Scholar |
Thompson MP, Gannon BM, Caggiano MD (2021) Forest roads and operational wildfire response planning. Forests 12, 110.
| Crossref | Google Scholar |
Thompson MP, O’Connor CD, Gannon BM, Caggiano MD, Dunn CJ, Schultz CA, Calkin DE, Pietruszka B, Greiner SM, Stratton R, Morisette JT (2022) Potential operational delineations: new horizons for proactive, risk-informed strategic land and fire management. Fire Ecology 18, 17.
| Crossref | Google Scholar |
U.S. Geological Survey National Geospatial Technical Operations Center (2023) USGS National Transportation Dataset (NTD) Downloadable Data Collection: U.S. Geological Survey. https://www.usgs.gov/the-national-map-data-delivery
Valavi R, Guillera‐Arroita G, Lahoz‐Monfort JJ, Elith J (2022) Predictive performance of presence‐only species distribution models: a benchmark study with reproducible code. Ecological Monographs 92, e01486.
| Crossref | Google Scholar |
Wiley EO, McNyset KM, Peterson AT, Robins CR, Stewart AM (2003) Niche modeling and geographic range predictions in the marine environment using a machine-learning algorithm. Oceanography 16(3), 120-127.
| Crossref | Google Scholar |
Yan H, Feng L, Zhao Y, Feng L, Zhu C, Qu Y, Wang H (2020) Predicting the potential distribution of an invasive species, Erigeron canadensis L., in China with a maximum entropy model. Global Ecology and Conservation 21, e00822.
| Crossref | Google Scholar |


