Experimental and numerical fire behaviour analysis in Eucalyptus globulus trees
MohammadReza Modarres A * , Miguel Almeida A and Domingos X. Viegas A
A
Abstract
Eucalyptus globulus is highly susceptible to fire, and contributes to increased fire intensity. In 2021, it spanned 25 million hectares, marking it as the forest genus with the broadest area of cultivation.
This study investigates the flammability characteristics of Eucalyptus globulus relative to the fuel age, focusing on fire thermal and physical characteristics.
Experimental and numerical analyses were performed using the Fire Dynamics Simulator (FDS) within the large-eddy simulation (LES)-based Lagrangian particle cloud model.
Six-month-old Eucalyptus globulus trees present a significant fire hazard. Older trees (3 and 5 years) exhibit more intense burns owing to reduced moisture content and larger fuel elements.
The flammability of Eucalyptus globulus varies with the growth stage, as older plants generate higher heat flux and burn more intensely owing to larger fuel elements, concentrated volatile compounds and reduced moisture content. In contrast, younger plants are more prone to ignition but exhibit lower heat flux and higher flame lengths relative to crown height. Simulations using FDS 6.8.0 effectively can predict plants’ key flammability and fire characteristics based on detailed laboratory data, demonstrating this tool’s capability in fire dynamics modelling and its behaviour prediction.
These findings can enhance fire modelling result quality and risk assessment in eucalyptus forests, guiding targeted fire management strategies.
Keywords: Eucalyptus globulus, combustion, flammability, fire behaviour: modelling, Fire Dynamics Simulator (FDS), fire intensity, fuel: age, wildland–urban interface.
Introduction
Forest fires can be destructive, causing loss of lives, properties and natural resources annually. Efforts are necessary to minimise casualties and mitigate the impact of fires. Wildfires usually start by burning low-growing underbrush plants, spreading at the surface and escalating by burning the understorey and transiting to the crown. Plants, based on their behaviour in burning conditions, can be classified from fire-resistant to highly flammable fire-prone types (White and Zipperer 2010). Eucalyptus globulus is a plant species that contains highly flammable essential oils in its chemical structure and can aggravate fire behaviour and intensify its spread (Guerrero et al. 2022). In 1961, at the Second World Eucalyptus Conference by FAO, eucalyptus covered about one million hectares. By 2021, it expanded to 25 million hectares, becoming the most widely cultivated forest genus (FAO 2021; Martins et al. 2022). Considering the importance of plant age and its impact on moisture content, which typically decreases over time, fire often stops at the edge of newly planted areas. This is due to the higher moisture content of younger plants, combined with the lack of shrubs, herbaceous plants and specific soil conditions, as reported by Viegas et al. (2023) and illustrated in Fig. 1.
Evidence of varying fire behaviour in the transition zone between a mature eucalyptus plantation and a recent plantation of Eucalyptus globulus.
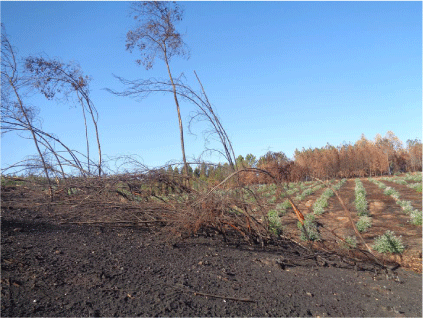
In Fig. 1, the recently planted area shows that although the herbaceous vegetation has burned, the young eucalyptus trees have survived the fire owing to their higher fuel moisture contents (FMCs). In contrast, the mature eucalyptus area (on the left), with its lower FMC and dense understorey, has experienced complete consumption of the vegetation by the fire.
Flammability of forest fuels refers to the ability of biomass to undergo combustion, assessed by factors such as ignitability: the ease with which fuel can ignite, influenced by its properties and the intensity of the heat source; consumability: the speed at which flames propagate through the fuel; combustibility: the rate of heat release during combustion; and sustainability: the duration for which combustion or burning persists (Anderson 1970; Varner et al. 2015; Cawson et al. 2020). These attributes are affected by variables such as FMC, chemical composition and environmental conditions, all of which impact the initiation and propagation of forest fires (Rosavec et al. 2022).
Understanding the flammability of forest fuels is essential for the effective management of fire-prone ecosystems and for mitigating wildfire risks. The age of plants significantly influences various attributes such as moisture content, chemical composition and structural characteristics, all of which impact their flammability. The physical and structural transformations that occur in plants over time, including changes in moisture content, have been extensively reviewed (Whelan 2009; Keeley et al. 2011). Additionally, research has explored how biomass accumulation in older plants affects fire behaviour and intensity (Cheney and Sullivan 2008). The relationship between plant age, chemical composition, flammability and fire behaviour was elucidated in studies by McArthur (1967) and Pausas and Keeley (2009). Another study examined changes in moisture content and chemical composition in pine needles, which relates to changes in flammability over time (Jolly et al. 2012). The broader ecological consequences of fire regimes, as influenced by plant age and composition, have been examined by Bond and Keeley (2005). Furthermore, practical recommendations for fire management, taking into account factors such as plant age and its impact on fire behaviour, are detailed by Pyne (1984). Because of the lack of experimental studies in vegetation combustion and wildfires, the main aim of the Centro de Estudos sobre Incêndios Florestais (CEIF) is to conduct novel studies on the flammability of forest species at the laboratory scale.
Owing to the complexities of fire behaviour in general and especially in burning plant species, the constraints of using instruments for data collection and the diversity of variables highlight computational fluid dynamics (CFD) role as a predictive tool to provide a detailed overview of the influence of fire on the surroundings. The heat release rate per unit area (HRRPUA) or heat flux and mass loss rate (MLR) from each plant are important factors in determining fire behaviour.
In the last decade, intense attention has been given to numerical models in fire dynamics analysis considering combustion physics and environmental interactions, particularly for prevention purposes in wildland-urban interface (WUI) areas. Owing to the lack of experimental work on vegetation combustion, this work aims to provide information on the flammability characteristics of eucalyptus trees based on age and utilises Fire Dynamics Simulator (FDS) as a numerical fire modelling tool for validation and prediction purposes.
Fire incorporates complicated physics and chemistry with different interacting scales in space (from less than millimetres to kilometres) and time (residence time of species from milliseconds up to days for firefront evolution). This complexity of the fire behaviour is due to non-linear physics and the chemical composition of biomass, which added to multi-phase combustion and fire–environment interactions, make this numerical problem even more complex.
Fire modelling can be approached through various methodologies, namely physical, semi-physical, empirical, quasi-empirical, semi-empirical or rule-based models. Physics-based models, which solve systems of coupled non-linear partial differential equations in three dimensions, are computationally intensive owing to their high data, CPU and time demands. In contrast, empirical models use algebraic functions to represent fire behaviour. Each approach addresses different facets of fire dynamics, such as heat and mass transfer, velocity fields and combustion analysis. For instance, Show (1919) investigated wildfire spread rates influenced by FMC and wind speed. Empirical research was conducted on the effects of wind, slope and FMC on fire spread rates (Curry and Fons 1938, 1940). Algebraic formulations were used to describe the rate of spread (ROS) based on wind speed, terrain slope, moisture content and fuel characteristics (Cheney et al. 1998; Martins Fernandes 2001). Although empirical models are useful for defining ROS, they do not provide comprehensive details on fire physics and environmental interactions. Earlier physical analyses incorporated factors such as wind effects, fuel attributes (e.g. size, compactness, temperature, density, moisture content) and topography over time into numerical models for light forest fuels (Fons 1946).
Rothermel proposed his quasi-empirical model for the evaluation of fire perimeter evolution and its spread rate for 13 forest fuel types (Rothermel 1972), based on the energy equilibrium by Frandsen (1971) and statistical and experimental data provided by Rothermel and Anderson (1966) and McArthur (1969). Later, based on Rothermel’s fire spread model, fire computation tools such as BEHAVE (Andrews 1986), its updated version BehavePlus (Andrews et al. 2005) and FARSITE (Finney 1998) were developed. FARSITE is a 2D semi-empirical fire simulation tool applied with simplified physics in wildfires, which can handle the modelling of vegetative fires uncoupled from atmospheric conditions, and coupled to terrain and fuel characteristics, e.g. thickness, packing ratio (the ratio of bulk density to the density of dry vegetation), surface area-to-volume ratio and FMC, even at large regional scales. Sullivan provided a comprehensive review of the physical and quasi-physical models (Sullivan 2009a), empirical and quasi-empirical models (Sullivan 2009b), and fire simulation and mathematical analogous models (Sullivan 2009c). Emmons tried to establish mathematical relationships for firefront thickness and its spread rate (Emmons 1964). Physics-based coupled mesoscale atmosphere–fire models are used as potential forecasting tools to tackle wildfires, with the capability to model incidents on large regional scales (Clark et al. 1996; Filippi et al. 2011; Mandel et al. 2011). A simplified semi-physical model for fire analysis was introduced by coupling the fire rate of spread and fire-induced wind (Balbi et al. 2007, 2009, 2020). More detailed physics-based fire models have been proposed by Linn and Harlow (1997), Mell et al. (2007) and Morvan et al. (2018). The advantage of physics-based numerical models is their capability to integrate the effects of different fuel types with characteristics of terrain (slope and elevation) and meteorological conditions (wind, temperature and humidity) on fire evolution.
Numerical simulation of vegetation combustion has been used as a predictive tool with validation based on experimental data (Mell et al. 2009; Modarres and Almeida 2022). According to recent trends in habitation and proximity of residential areas to forest edges, the risk of fires in WUI areas is greater than before. Given this, because each forest species contributes to wildfires and their expanse differently, in the present study, laboratory flammability results for Eucalyptus globulus trees in different arrangements and maturities are used for validation of an FDS analysis in 3D. To achieve this, the open-source FDS 6.8.0 3D finite-volume code developed by the National Institute of Standards and Technology (NIST) was used to numerically model the flammability of Eucalyptus globulus plants.
Numerical modelling
Fire is a transient phenomenon with a wide spectrum of processes happening at different time and length scales. This image is much more complex when the physical and chemical characteristics of the fuel elements, heat transfer modes and firebrand release are added.
Given the complexities of fire behaviour in general, and specifically wildfires, FDS intends to solve fire behaviour equations including large-eddy structures as in fire plumes. Using FDS, thermally driven low-Mach (<0.3) turbulent combustion in wildfires is modelled using some simplifying assumptions.
The advantage of a large-eddy simulation (LES) is taking the space filter of each variable in a computational cell (uniform evolution) into account rather than solving the smallest length scales in turbulence. The LES formulations can be obtained by low-pass spatial filtering of the Navier–Stokes equations filtering the small scales out from the direct numerical simulation (DNS) formulations (Sánchez-Monroy et al. 2019). Given this, the flow is solved explicitly at scales larger than the filter width, and for sub-grid scale by closure models. The explicit anisotropic box-filtered LES equations for mass, momentum, species and enthalpy transports are defined by Eqns 1–4 (see list of definitions at the end of this article).
The temperature field is obtained from the equation of state (EOS), Eqn 5. Any scalar such as ω(x, t) can be filtered implicitly in space by conventional filtering, , density-weighted Favre-filtering as or explicitly by box-filtering to determine bulk source terms, in a box with a volume of ∀b with a centre point at x, .
Applying low-Mach assumption, the sensible enthalpy can be expressedbased on the thermodynamic (background) pressure, bonding it to enthalpy and internal energy as . Given this, the conservation of energy is not explicitly solved; instead, the velocity divergence, by taking the material derivation of the EOS, is replaced. This equation is called the ‘divergence constraint equation’, Eqn 6.
In conservation equations, the terms, τ, J and q denote the fluxes of momentum, species and heat, and a box/spatial filter, , is applied to the source terms as shown in Tables 1 and 2. The viscous stress is closed by using the variation of Deardorff’s formulation for turbulent (or eddy) viscosity (Deardorff 1980):
where the model constant, ψ, is equal to 0.1 (Pope 2000), and is the LES filter width. The sub-grid-scale kinetic energy is derived from Eqn 8.
In Eqn 8, is the mean velocity (here, u, the velocity component in the x-direction) at the centre of the grid cell and is the weighted average of velocity u over the adjacent cells. The values of other velocity components, v and w, are determined in the same manner.
| Transport equation | Source terms | Formulation | ||
|---|---|---|---|---|
| Momentum | ||||
| Species | ||||
| Heat transfer | Radiation | |||
| Convection | ||||
| Enthalpy | ||||
The source term for drag forces includes drag coefficients for spherical and cylindrical particles. The mathematical definition for these is given by Eqns 9 and 10, respectively (Porterie et al. 1998; Pope 2000; Rehm et al. 2002; McGrattan et al. 2013).
These equations are functions of the local Reynolds number, . The surface-to-volume ratio for spherical and cylindrical particles is defined by , and , respectively. The mean chemical source term for the fuel in the species transport equation is obtained from the eddy dissipation concept (EDC) turbulent combustion model with Eqn 11 (Magnussen and Hjertager 1977; Rehm et al. 2002).
According to this model, the rate of turbulent mixing is slower than the infinitely fast chemical kinetics, meaning the limiting part of this process is the turbulent mixing of lumped species. Based on this assumption, the reaction occurs in the fine structures of turbulence where turbulence kinetic energy dissipation becomes significant.
The convective heat flux is determined from Eqn 12 (Holman 2008; Mell et al. 2009):
where the corresponding heat transfer coefficient in the enthalpy transport equation is acquired from Eqn 13 for a cylinder with a radius equal to (Porterie et al. 1998).
The radiation transport equation (RTE) is given by:
In this equation, the absorption coefficient can be correlated with the fuel bed’s surface-to-volume and packing ratios (NAS 1961), as in Eqn 15.
The soot content of vegetation fires is considered one of the important attributes of forest fires as they are soot-laden, and this can be weighted as a grey medium in both large and sub-grid scales.
The net contribution of radiation in the transportation of enthalpy for a non-scattering grey medium is obtained by integrating the RTE, Eqn 14, over all solid angles, and is given by Eqn 16:
where κ, and are the absorption coefficient, radiation intensity per unit of a solid angle and integrated radiant intensity from a black body, which are substituted in Eqns 4 and 6. Radiation in FDS is solved using the spatial discretisation method based on the finite volumes approach for the emission term in the RTE, incorporating 100 solid angles for the angular discretisation of Eqn 14 (McGrattan et al. 2013). The fires from vegetation fuels are considered heavily soot-laden owing to the continuity of the radiation spectrum of the soot. This feature makes gas independent of the grey medium to simplify computations. To do so, vegetation fuel elements are assumed to be non-scattering with perfect absorption at the sub-grid-scale and spatially fixed with a uniform distribution over a bulk volume (Mell et al. 2009).
Any hydrocarbon stoichiometric combustion can be defined as the following reaction:
The hydrocarbon content of each vegetation species is obtained through pyrolysis for each solid fuel type for FDS gaseous combustion analysis. The heat of combustion is the magnitude of the enthalpy change from reactants into products (Poinsot and Veynante 2005).
Based on the molar heat of combustion at constant pressure, the heat release rate per unit volume (HRRPUV) from the combustion process can be written as:
where is the Favre-averaged mass-based heat of combustion at .
Thermal degradation including pyrolysis and char oxidation is analysed for the vegetation fuels by determining the mass source terms for water vapour and fuel elements, separately, as stated in Table 2 to be used in Eqns 1, 3, and 4. Considering the vegetation thermally thin, the explicitly spatially filtered temperature profile of the fuel element i is obtained from Eqn 19 (Porterie et al. 1998):
In this equation, the first and second terms on the right-hand side are due to endothermic FMC evaporation and solid fuel pyrolysis processes, respectively. The fuel bed elements’ bulk contributions to convective and radiative heat transfers are defined by the third and fourth terms on the right-hand side.
In Eqn 19, the bulk density and the specific heat are correlated in solid-phase dry vegetation by:
where, at the beginning of combustion, ρi,b,H2O = ρbvMi.
Experimental analysis
The following experimental observations mainly aim to investigate fire behaviour in Eucalyptus globulus species based on plant age. The main indicators that determine the behaviour of fire in vegetation fuels are defined by flammability factors such as ignitability, sustainability, consumability and combustibility (Anderson 1970; Martin et al. 1994). These characteristics differ for each fuel type and change the fire behaviour characteristics for a variety of plant ages.
Apparatus setup
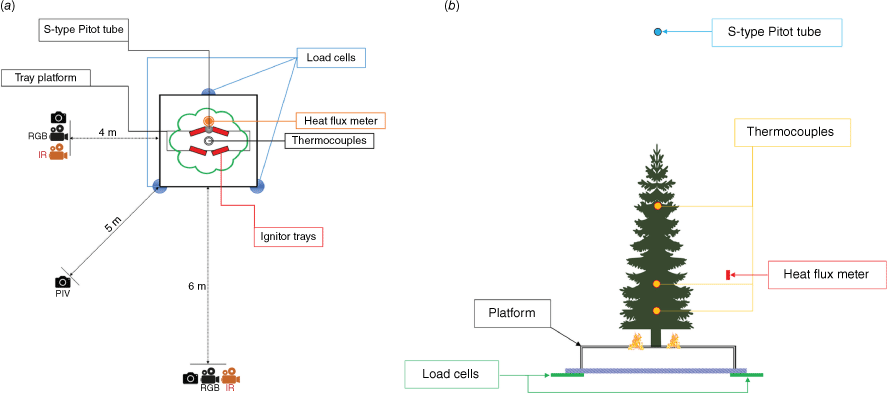
The experimental setup featured two infrared (IR) cameras, the Forward Looking Infrared (FLIR) ThermaCam SC660 and SC640, positioned 4 and 6 m away from the test platform in lateral and frontal positions, respectively. Thermal images were captured at a rate of 15 frames s–1 with an emissivity of 1, covering a temperature range of 300–1000°C.
The particle image velocimetry (PIV) setup included a Speedsense 1040 camera, with a National Instruments (NI) 1030 frame grabber with an acquisition frequency of 167 Hz installed at a 5 m height and a 5.8 m diagonal distance to detect released firebrands. The capturing frame covered a 2320 pixel (186 cm) by 1728 pixel (139 cm) rectangular area. Data collected from PIV and IR cameras were outside the scope of this study and thus were not analysed.
To measure flame dimensions, two Nikon D70 and V1 RGB (red, green, blue) cameras were fixed at 4 and 6 m distances in lateral and frontal positions.
To detect the MLR from burning species, three 67M25A-I40 load cells with a measurement range from 0.5 to 500 kg and precision of 0.1 g were utilised.
Measurement of the fire-induced updraft plume velocity (UPV) was performed with an S-type Pitot tube installed at 4 m height from the test platform. It was connected to a Gems5266-50L bi-directional pressure transducer, and the modification of the signal was processed by a low-range 0–50 Pa differential pressure transmitter. The pressure transducers were connected to the NI cDAQ-9174 USB chassis and data logging was performed by the NI 9211 module (±80 mV).
Arrays of K-type thermocouples with a bead size of 1.5 mm were connected to an NI cDAQ-9174 chassis with an NI 9213 thermocouple (TC) module at heights of 30, 75 and 140 cm from the ignitor trays.
The total heat flux from the flame was measured using a Vatel TG 9000-9 sensor with a calibration uncertainty of ±0.76 mV/(W/cm2) installed at a 1.5 m height above the load cells and connected to the same NI cDAQ-9174 chassis.
The fuel moisture content of the vegetation species was measured by an A&D MX-50 moisture analyser with an accuracy of ±0.1% (s.d.) for a sample greater than 1 g but less than 5 g and drying temperature increments of 1°C from 50 to 200°C. Fig. 2 depicts the overall layout of the instruments used to conduct the experiments.
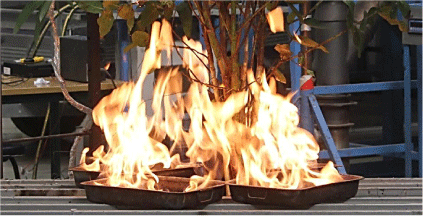
To initiate ignition, trays containing 250 mL of 96% (v/v) denatured ethanol with dimensions of 32 × 23 × 5 cm, as shown in Fig. 3, were used to imitate surface fire affecting the tree samples in laboratory conditions.
The acquisition process in all experiments started immediately after the ignition of the alcohol in the trays. The acquisition frequency of all data loggers, including the IR cameras, was set to 1 Hz.
Methodology
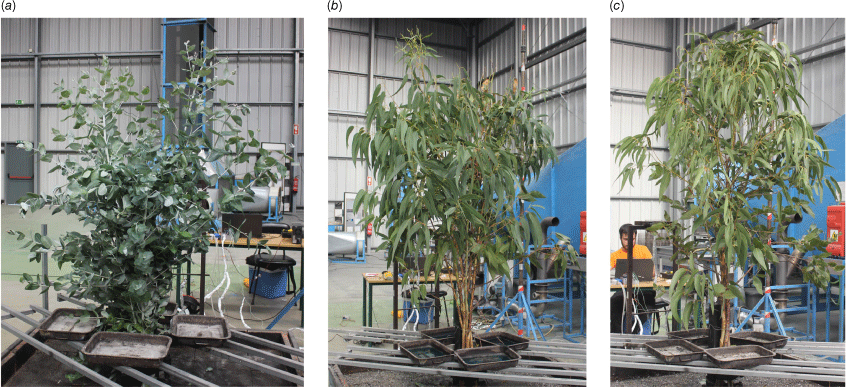
Laboratory studies included fire behaviour analysis as a function of plant age in eucalyptus trees. The growth of these plants is associated with changes in their physical and flammability characteristics. In this work, samples with ages of 6 months (Euc_6M), 3 years (Euc_3Y) and 5 years (Euc_5Y) with an artificially induced crown base height (CBH) of 25 cm were studied. Samples from the first plantation cycle were collected in summer from the same landscape with similar sun exposure properties and tested on the same day. To increase the degree of certainty, tests were repeated up to five times. Fig. 4 shows representative images of all case studies.
As illustrated in Fig. 4a, in young eucalyptus trees, the leaves are oval or heart-shaped, soft and bluish, positioned on opposite sides of the stem. As the trees mature, the leaves transform into elongated, sickle shapes, becoming tougher, greener, and arranged alternately along the stem.
Table 3 shows the details of each case study. In this table, ‘Euc’ denotes the plant, the subsequent number indicates the age, and the Roman numerals in the next column represent the repetition number for each experiment. The maximum data uncertainty for the acquired mass, fuel moisture content and sample dimensions is 10.1, 13.8 and 16.1%, respectively.
| Case | Test no. | Initial mass M0 (g) | Final mass M f (g) | Frontal crown diameter CD1 (cm) | Lateral crown diameter CD2 (cm) | Crown height CH (cm) | |
|---|---|---|---|---|---|---|---|
| Euc_6M | I | 3220 | 2160 | 125 | 110 | 132 | |
| II | 3360 | 2246 | 157 | 154 | 160 | ||
| III | 3280 | 2215 | 140 | 130 | 159 | ||
| IV | 3160 | 2240 | 130 | 110 | 140 | ||
| Euc_3Y | I | 4980 | 3840 | 135 | 120 | 190 | |
| II | 4929 | 3638 | 140 | 132 | 194 | ||
| III | 4446 | 3406 | 125 | 120 | 190 | ||
| IV | 4940 | 3945 | 140 | 130 | 175 | ||
| Euc_5Y | I | 5338 | 4182 | 200 | 166 | 267 | |
| II | 5380 | 4300 | 200 | 180 | 268 | ||
| III | 5440 | 4125 | 180 | 160 | 271 | ||
| IV | 5140 | 3878 | 200 | 160 | 269 | ||
| V | 5460 | 4140 | 200 | 200 | 270 |
M0, initial mass; Mf, final mass; CD1, frontal crown diameter; CD2, lateral crown diameter; CH, crown height.The italicized lines correspond to the repetition of each case with the maximum flame heights and recorded heat fluxes.
Reference test
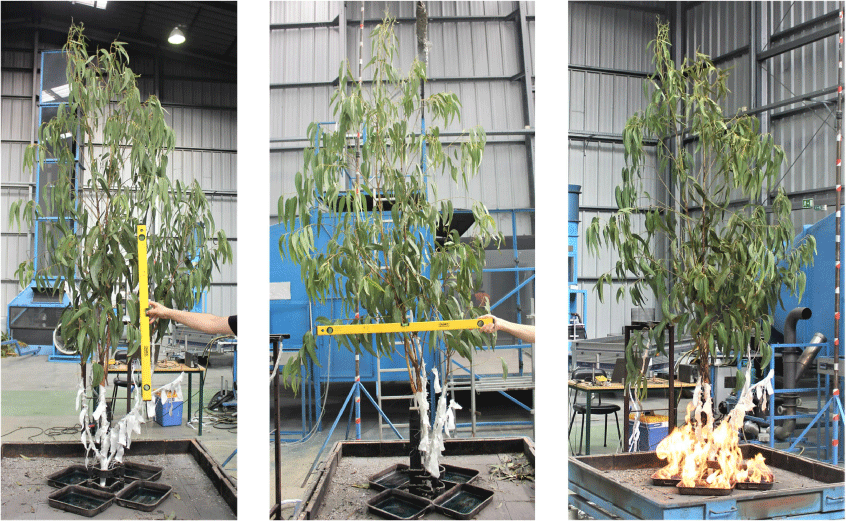
Considering that the burning denatured alcohol might interfere with the measurement of the heat flux from the burning trees, a reference test, Fig. 5, was carried out. In this test, the burning conditions were identical to the regular experiments; however, a eucalyptus sample was used with the lower leaves and branches protected by fireproof strips. This allowed analysis of heat flux from the ignition trays reaching the heat flux meter. Based on the heat flux values from the reference test it could be estimated that the temporal trend for energy release was likely to be monotonic during 250 s of ignition time and hence did not interfere with the total flammability of the samples.
Mass characterisation of the plants
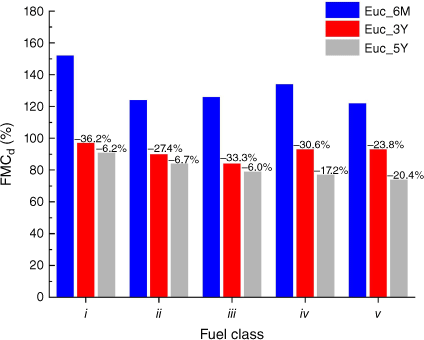
To categorise the different segments of plants, information was collected on ignitibility, biomass distribution and FMC. Destructive sampling was performed under pre-burn conditions for all case studies. The plant segments were divided into five classes: i, foliage; and parts with a diameter: ii, less than 3 mm; iii, more than 3 mm and less than 6 mm; iv, more than 6 mm and less than 10 mm; and v, parts larger than 10 mm. These are detailed in Tables 4–6 for the three cases of Euc_6M, Euc_3Y, and Euc_5Y.
| Pre-burn | |||||
|---|---|---|---|---|---|
| Class | Plant segment | M0 (g) | M f (g) | FMC d (%) | |
| i | Foliage | 1174.3 | 466.0 | 152 | |
| ii | 0 < Ø < 3 mm | 211.3 | 94.4 | 124 | |
| iii | 3 ≤ Ø < 6 mm | 279.2 | 123.5 | 126 | |
| iv | 6 ≤ Ø < 10 mm | 63.6 | 27.2 | 134 | |
| v | Ø ≥ 10 mm | 540.8 | 244.2 | 122 | |
M0, initial mass; Mf, final mass; FMCd, dry-based FMC.
| Pre-burn | |||||
|---|---|---|---|---|---|
| Class | Plant segment | M0 (g) | M f (g) | FMC d (%) | |
| i | Foliage | 1354.9 | 687.7 | 97 | |
| ii | 0 < Ø < 3 mm | 88.7 | 46.6 | 90 | |
| iii | 3 ≤ Ø < 6 mm | 340.2 | 184.9 | 84 | |
| iv | 6 ≤ Ø < 10 mm | 79.8 | 41.3 | 93 | |
| v | Ø ≥ 10 mm | 1123.5 | 582.3 | 93 | |
M0, initial mass; Mf, final mass; FMCd, dry-based FMC.
| Pre-burn | |||||
|---|---|---|---|---|---|
| Class | Plant segment | M0 (g) | M f (g) | FMC d (%) | |
| i | Foliage | 1516.3 | 792.5 | 91 | |
| ii | 0 < Ø < 3 mm | 170.9 | 92.8 | 84 | |
| iii | 3 ≤ Ø < 6 mm | 325.4 | 181.9 | 79 | |
| iv | 6 ≤ Ø < 10 mm | 171.2 | 96.7 | 77 | |
| v | Ø ≥ 10 mm | 510.4 | 293.6 | 74 | |
M0, initial mass; Mf, final mass; FMCd, dry-based FMC.
By comparing the data from Tables 4 to 6 in Fig. 6, it is quite evident that the age of the tree is directly related to the decrease in FMC in all fuel classes. This characteristic increases the fire risk in older species. According to Fig. 6, the FMCd in Euc_6M on average is 30.3% higher than in Euc_3Y, and in Euc_5Y is 11.3% lower in comparison with Euc_3Y.
Experimental results
The flammability parameters of the plants such as heat flux from the firefront, temperature profiles, mass decay and the updraft convective plume velocity were quantitatively studied. These measurements are directly related to the way flammability is typically defined, as they provide a comprehensive understanding of a plant’s flammability characteristics, heat release, fire spread and spotting potential.
Flame dimensions
One of the prominent features of a flame is its physical characteristics. The flame dimensions (height, length, perimeter, depth and tilting), which are extracted from the RGB camera images, have a significant role in determining the important parameters of the flame, including fireline intensity. Fig. 7 depicts the maximum flame dimensions corresponding to the second, second and fifth repetitions of each age group, in italics in Table 3.
Maximum flame dimensions corresponding to the second, second and fifth test repetitions according to Table 3 for (a) Euc_6M, (b) Euc_3Y, and (c) Euc_5Y, respectively.
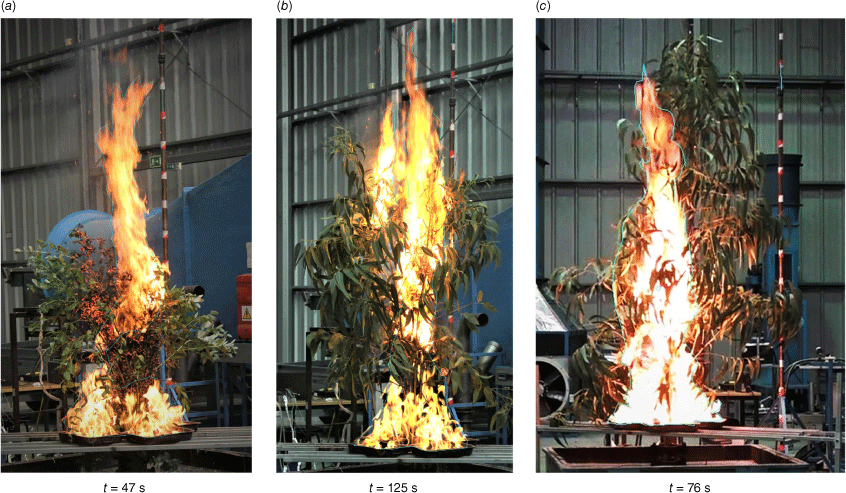
By performing a pixel analysis of the flame area, adjusting the brightness and contrast for optimal clarity, and using the reference rod in the background as scale, the flame dimensions were extracted. Table 7 shows the approximate flame area, perimeter and height corresponding to the case with the maximum flame height in the test repetitions. A major uncertainty associated with these measurements can be due to observational/parallax errors. The flame height, Hf, refers to the vertical flame size measured from the alcohol trays upto the flame tip.
| Case study | Area (m2) | Perimeter (m) | Height (m) | |
|---|---|---|---|---|
| Euc_6M | 0.62 | 5.20 | 1.86 | |
| Euc_3Y | 0.95 | 7.22 | 2.12 | |
| Euc_5Y | 1.04 | 7.59 | 2.60 |
According to Table 7, although younger plants have higher moisture contents, due to high packing ratios, the flames can reach considerably greater heights. Moreover, with increasing plant age, owing to the lower moisture contents, the flame dimensions and the corresponding heat flux increase. It should be noted that the ratio of the flame height to CBH in younger plants reaches higher values, which greatly increases concern about risk from eucalyptus forests of any age.
Heat flux
Heat flux is a crucial indicator of flammability, reflecting factors such as combustibility and sustainability. It also provides valuable insights into consumability and ignitability. A higher heat flux value suggests greater combustibility, as energy is released more rapidly during combustion. In terms of sustainability, maintaining a high heat flux over an extended period indicates that the material can support prolonged combustion. The period of high heat flux can be attributed to higher mass loss rates, which can be directly dependent on combustion efficiency, and this shows the effectiveness of material conversion into heat during combustion. Ignitability can be inferred from the initial spikes in the heat flux profile; materials with low ignitability may exhibit a delayed rise in energy release after ignition begins.
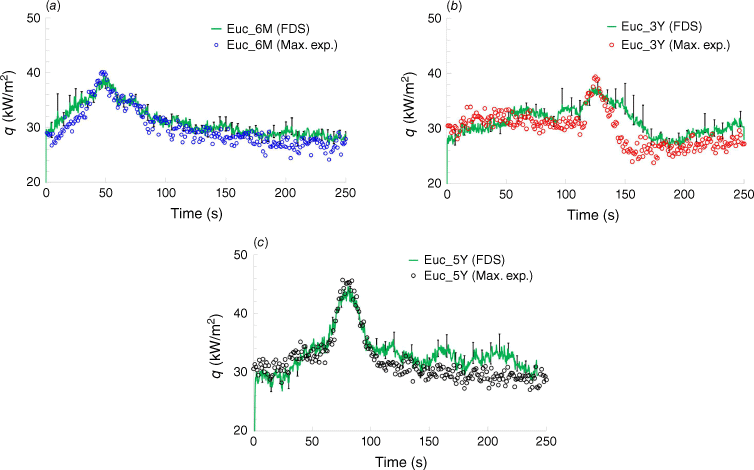
The heat flux (q) profiles were plotted for each case study reflecting the flammability characteristics of each plant in Fig. 8 with corresponding uncertainty parameters reported in Table 8. These plots include the maximum (Max.) and mean (Mean) values from the experiments for different plant ages, as well as the reference test measured 80 cm above the platform. The time frame of the plots and analysis aligns with the duration of the burning alcohol trays, as confirmed by the reference test depicted. in Fig. 5.
Heat flux profiles, q (kW/m2) against time (s) for the maximum (Max.) and mean (Mean) of heat flux conditions and the reference (Ref.) test for (a) Euc_6M, (b) Euc_3Y, and (c) Euc_5Y. Time 0 s corresponds to the initiation of the ignition.
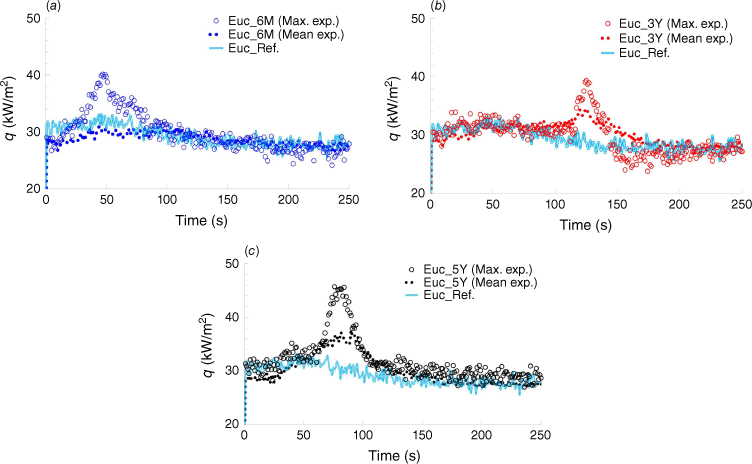
Comparing the heat flux values suggests that as Eucalyptus globulus ages, it becomes more combustible and consumable, but less sustainable in its burning. The youngest samples tend to ignite more easily but burn mildly, whereas the oldest samples burn intensely but for a shorter period. This is due to changes in the plant’s chemical composition, moisture content and physical structure with age.
| Case study | qmax (kW/m2) | σ (±kW/m2) | σ M (kW/m2) | |||
|---|---|---|---|---|---|---|
| Euc_6M | Max. exp. | 39.37 | 29.62 | 3.63 | 0.01 | |
| Mean exp. | 31.12 | 28.64 | 2.09 | 0.01 | ||
| Euc_3Y | Max. exp. | 40.10 | 29.77 | 3.91 | 0.02 | |
| Mean exp. | 34.31 | 30.03 | 2.63 | 0.01 | ||
| Euc_5Y | Max. exp. | 45.69 | 31.75 | 4.49 | 0.02 | |
| Mean exp. | 37.56 | 30.40 | 3.39 | 0.01 | ||
| Euc_Ref | Instantaneous | 29.14 | 29.12 | 2.55 | 0.01 |
qmax, , σ and σM are the maximum, mean, s.d. and s.e. of q, respectively.
From Fig. 8, total heat flux (THF) corresponds to the area integrated under each curve during the 250 s, tabulated in Table 9. From the heat flux data, it can be inferred that older eucalyptus trees can release energy at higher rates per unit area in comparison with younger plants.
Flame temperature
The temperature profile during combustion can reflect aspects of flammability such as combustibility, sustainability, ignitability, and less directly, consumability. Thermocouples at various heights of the burning vegetation were used to assess the thermal dynamics for a comprehensive flammability analysis. Moreover, these data can help identify different vegetation combustion phases, including ignition, growth, flashover, fully developed and decay phases. This information is vital for understanding the complete combustion process for each forest fuel and the factors influencing each phase.
Fig. 9 shows the thermocouple data obtained at 30, 75 and 140 cm heights from the ignitor trays for the test repetitions with the highest flame lengths for three case studies.
Temperature profiles, T (°C), against time (s) for Euc_6M, Euc_3Y, and Euc_5Y. The combustion phases are illustrated for Euc_5Y_TC_30. TC_30, TC_75, and TC_140 refer to data acquisition points at 30, 75, and 140 cm heights respectively from the ignitor trays.
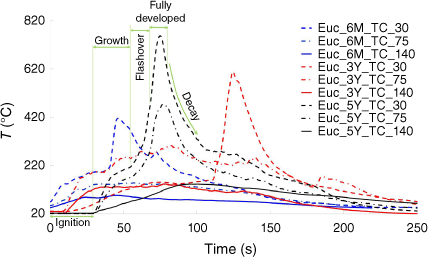
The uncertainty parameters for the thermocouples data are reported for Euc_6M, Euc_3Y and Euc_5Y in Table 10.
| Case study | Tmax (°C) | σ (±°C) | σ M (°C) | ||
|---|---|---|---|---|---|
| Euc_6M_TC_30 | 415.1 | 152.1 | 91.9 | 6.2 | |
| Euc_6M_TC_75 | 148.2 | 105.1 | 33.5 | 2.3 | |
| Euc_6M_TC_140 | 96.8 | 70.5 | 18.2 | 1.1 | |
| Euc_3Y_TC_30 | 605.6 | 153.7 | 120.2 | 7.4 | |
| Euc_3Y _TC_75 | 301.9 | 176.2 | 76.7 | 4.7 | |
| Euc_3Y _TC_140 | 143.1 | 87.6 | 37.1 | 2.3 | |
| Euc_5Y _TC_30 | 757.1 | 176.1 | 164.4 | 10.1 | |
| Euc_5Y _TC_75 | 473.8 | 133.5 | 107.5 | 6.5 | |
| Euc_5Y _TC_140 | 149.6 | 88.1 | 44.4 | 2.8 |
Tmax, , σ, and σM are the maximum, mean, and average s.d. and s.e. of T, respectively.
Convective plume
Updraft plume velocity in forest fires is dependent on the interactions among different parameters such as heat release rate, meteorology and landscape topography as environmental characteristics, and natural fuel arrangement and moisture contents. The fire intensity governed by these factors determines the buoyant flow conditions and in turn the size, shape, aerodynamics, transport and spotting potentials of airborne-lofted firebrands.
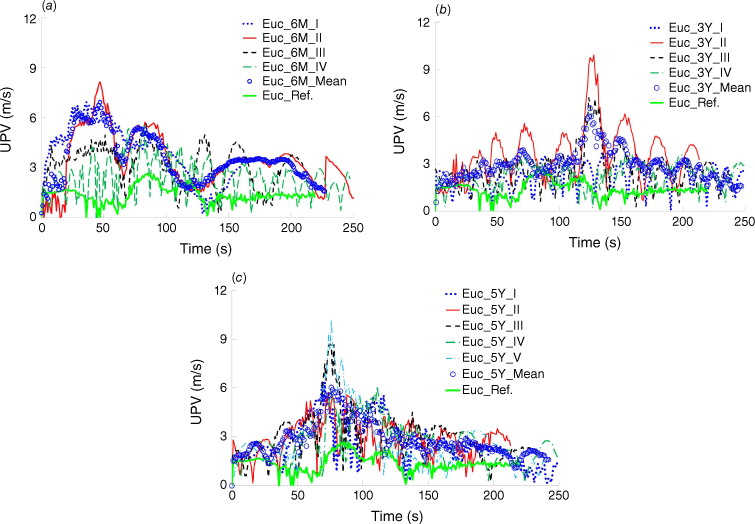
To analyse the updraft convective plume velocity, an S-type Pitot tube was used with a paired TC. The dynamic pressure data acquired by transducers along with air density variations from temperature were transformed into units of metres per second using the apparatus’s corresponding conversion factor. In Fig. 10, the plume velocity is illustrated for all repetitions of each case study and uncertainty parameters are reported in Table 11.
The updraft plume velocity (UPV) profiles (m/s) against time (s), (a) Euc_6M; (b) Euc_3Y; (c) and Euc_5Y. Roman numbers in the figures denote the number of the test repetition.
| Case study | UPVmax (m/s) | (m/s) | σ (±m/s) | σ M (m/s) | |
|---|---|---|---|---|---|
| Euc_6M | 8.15 | 3.28 | 1.62 | 0.04 | |
| Euc_3Y | 9.92 | 3.42 | 1.33 | 0.06 | |
| Euc_5Y | 10.21 | 3.64 | 1.41 | 0.07 |
UPVmax, , σ, and σM are the maximum, mean, s.d. and s.e. of UPV, respectively.
According to this figure, the trend in convective flow velocity corresponds to the different combustion phases illustrated in Fig. 9. Data from Almeida et al. (2021) state that the maximum UPV for Pinus pinaster, Quercus robur, Quercus suber and Eucalyptus globulus samples reached 3.6, 3.8, 6.3, and 7.3 m/s, respectively. The increase in UPV of eucalyptus trees from Euc_6M to Euc_5Y suggests that older trees generate higher plume velocities. This can be attributed to the increased concentrations of volatile compounds and lower FMC values. Higher UPV indicates higher fire intensity, smoke dispersion and environmental effects. This can contribute to increased firebrand transport, a higher probability of severe spotting, and broader implications for fire management and environmental impact assessments.
Mass loss rate
The MLR primarily reflects combustibility and consumability but can also offer some insights into the sustainability and ignitability of fuel. MLR is a key indicator of how quickly a material burns, which is directly related to its combustibility. A higher MLR means fast burning, signifying high consumability. A steady MLR over an extended period indicates a degree of sustainability in the burning process. Although MLR does not directly measure ignitability, higher ignitability causes a higher initial mass loss rate.
The maximum fuel MLR, i.e. the rate at which fuel is consumed, , is 39.9, 56.8 and 70.1 g/s for Euc_6M, Euc_3Y and Euc_5Y respectively. The corresponding heat release rate (HRR) for each case can be calculated based on the fuel’s mass-based heat of combustion and the maximum MLR with Eqn 21.
Recognising the insufficient number of formulations relating the heat flux or HRR to the flame height, new formulation based on the maximum HRR and the corresponding flame heights, Hf, from Table 7, was developed, Eqn 22.
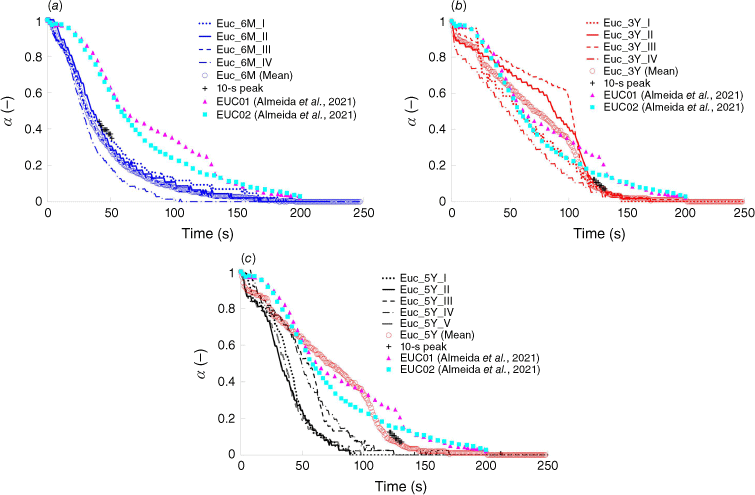
To compare mass decay behaviour, the normalised instantaneous relative mass decay, α, is defined by Eqn 23. The initial and final masses in this ratio are the values reported in Table 3.
The data acquired for the normalised instantaneous relative mass decay were compared with the data from Almeida et al. (2021), which includes analyses of firebrands produced by four different forest species and concludes that young Eucalyptus globulus has the lowest potential to produce short-range spot fires, followed by Pinus pinaster, Quercus robur and Quercus suber. The species mass loss behaviour observed in this study indicates a similarity in flammability factors for Eucalyptus globulus samples including packing ratios or bulk densities and FMCs compared with their study.
As stated by Almeida et al. (2021), the 10-s peak heat flux has an exponential behaviour, and mass decay for each plant age can be characterised based on the relative mass decay coefficient, , using Eqn 24 as a function of elapsed time, t.
Performing regression for the 10-s peak and Mean data in Fig. 11, the relative mass decay coefficients can be obtained, shown in Table 12.
Normalised instantaneous relative mass decay (α) vs time (s). Roman characters refer to the repetition number. Plus symbols (+) correspond to the 10-s peak heat flux values. ‘Mean’ corresponds to the average of all repetitions for (a) Euc_6M; (b) Euc_3Y; (c) Euc_5Y.
| Case study | Data | × 10−5 (s−1) | R2 | |
|---|---|---|---|---|
| Euc_6M | 10 s-peak | 1800 | 0.94 | |
| Mean | 1200 | 0.89 | ||
| Euc_3Y | 10 s-peak | 2000 | 0.92 | |
| Mean | 1533 | 0.93 | ||
| Euc_5Y | 10 s-peak | 3200 | 0.72 | |
| Mean | 2020 | 0.92 |
According to this table, increasing plant age causes a significant increase in fuel consumability during a fire. The main cause of the escalation in flammability is the lower FMC in all fuel classes, as illustrated in Fig. 6.
Numerical results: FDS
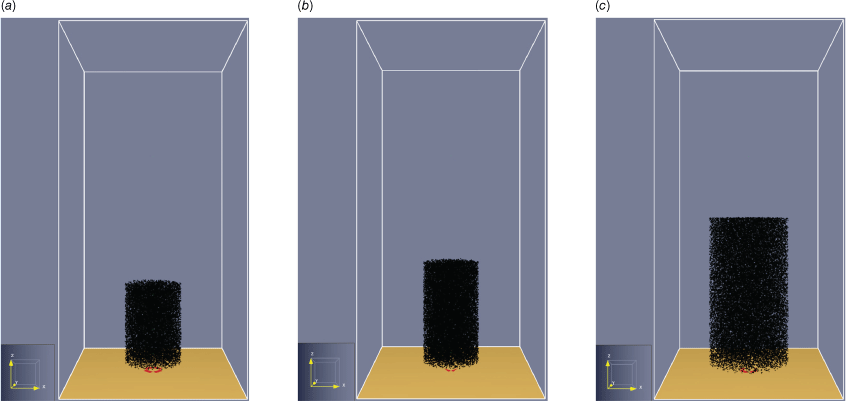
Considering the plants’ geometries and their physical characteristics with details stated in Tables 4–6, a factor of 0.8 was determined as a shear factor to be applied to the maximum crown diameter. The tree structure was designated as a heterogeneous cylindrical particle cloud as illustrated in Fig. 12 for Euc_6M, Euc_3Y and Euc_5Y.
Stationary cylindrical particle cloud model for FDS modelling of the eucalyptus samples: (a) Euc_6M; (b) Euc_3Y; (c) Euc_5Y.
To determine a mesh resolution suitable for FDS analysis with the potential to capture the flame and convective plume dynamics, Eqn 25, the characteristic fire diameter (McGrattan et al. 2013), as a function of the total HRR, , was used to assess the grid based on the following expression.
The coefficient in this equation is determined based on the thermophysical properties of the air. The characteristic fire diameter to cell face size ratio must satisfy the criteria in Table 13 for coarse, medium and fine grid resolution.
For the present case studies with the largest cell size of 0.0282 m, the to max(δx, δy, δz) ratio classifies the mesh grid quality in a medium range.
The bulk density, ρs,n in Eqn 26 is defined as the mass of the nth component of a solid body in a volume that it occupies, and it is calculated in Table 14 based on the details given in Tables 4–6.
In FDS analysis, the cylindrical Lagrangian particles have a uniform distribution throughout the cloud. The foliage was considered Cartesian planar particles with a mean length of 0.15 m and width of 0.015 m applying the disc drag law. The thickness of the leaves was set to 5 × 10⁻⁴ m. Different fuel classes from Tables 4 to 6 were imported into the FDS considering the maximum diameter of each class as the cylindrical fuel with the respective drag law and a length of 0.20 m with the corresponding FMCs.
| Case study | ρs,i (kg/m3) | ρs,ii (kg/m3) | ρs,iii (kg/m3) | ρs,iv (kg/m3) | ρs,v (kg/m3) | |
|---|---|---|---|---|---|---|
| Euc_6M | 1.15 | 0.21 | 0.27 | 0.06 | 0.53 | |
| Euc_3Y | 0.78 | 0.05 | 0.20 | 0.05 | 0.65 | |
| Euc_5Y | 0.47 | 0.04 | 0.10 | 0.04 | 0.24 |
The diameter for the particles in fuel class v was set to 0.03 m. The difference between the different ages of the fuel samples was defined based on the particle sizes, particle distributions in space with bulk density and FMC.
As the chemical composition of any species has an undeniable role in the energy release process, the pyrolysis data for Eucalyptus globulus biomass were used (Neves et al. 2017). The stoichiometric coefficients of CHON in Table 15 were implemented in the FDS models. The heat of combustion was set to 17,384 kJ/kg (Pérez et al. 2006).
| Element | Stoichiometric coefficients | |
|---|---|---|
| C | 1 | |
| H | 1.63 | |
| O | 0.7516 | |
| N | 1.834 × 10⁻³ |
Procedure
The FDS applies a low-Mach approximation for the solution of the thermally driven flows. To apply this hypothesis, the energy equation is replaced by the velocity divergence. The LES form of the Navier–Stokes equations is solved in rectilinear (preferably uniform), structured and staggered grids with Deardorff’s eddy viscosity sub-grid closure model. Using the mixing-controlled (fast chemistry) theory of EDC, the combustion process is modelled. The second-order accurate finite difference scheme is used to discretise the equations in the 3D computational grid with the explicit predictor-corrector scheme for the time evolution of the parameters.
The system used for performing the computations was an HP Z8 G4 workstation with Intel® Xeon® Gold 6136 CPU with 12 cores and a total of 384 GB of physical memory (RAM). The total time steps, mean time step sizes and cumulative CPU time are reported in Table 16 for 250 s of simulation time for each case study.
| Case study | No. time steps | Average time step size × 10−4 (s) | Cumulative CPU time × 104 (h) | |
|---|---|---|---|---|
| Euc_6M | 48,266 | 55.03 | 1.93 | |
| Euc_3Y | 44,314 | 57.98 | 1.69 | |
| Euc_5Y | 40,800 | 61.47 | 1.33 |
The time step employed in this FDS study ranges between 0.00015 and 0.0196 s, keeping the Courant–Friedrichs–Lewy (CFL) number below 0.9 to satisfy this criterion for LES simulations. This condition ensures that the time step remains within limits determined by the grid spacing and maximum fluid velocity.
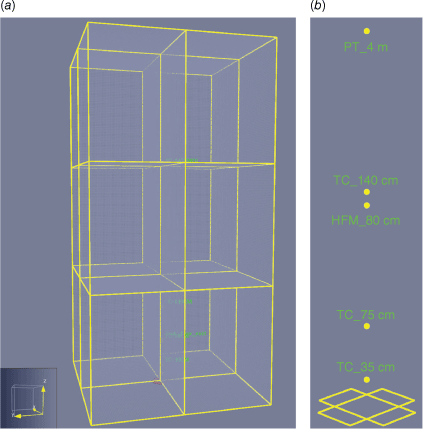
The computational domain has a size of 3 × 3 × 6 m in x, y and z directions. The grid contains 2,484,432 uniform mesh cells with an aspect ratio of one. The domain is split into 12 volumes of 1.5 × 1.5 × 2 m each with cell counts of 54 × 54 × 71 in x, y and z directions to utilise the parallel computing package of FDS with 12 Message Passing Interface (MPI) processes and 2 Open Multi-Processing (OpenMP) threads.
All the boundaries except the platform base (Fig. 13a) are considered open ‘vents’ with a quiescent environmental condition. The platform in the FDS model was considered as adiabatic. The igniter trays in FDS were considered as burner vents (Fig. 13b), with a ramp-up time based on Fig. 8 and the thermochemical properties of 96% (v/v) ethanol as shown in Table 17 (Martinka et al. 2019).
Configuration of the computational domain: (a) isometric view of the computational grid split into 12 mesh zones; (b) arrangement of the thermocouples (TC) at 30, 75, and 140 cm, the heat flux meter (HFM) at 80 cm, and Pitot tube (PT) at 4 m vertical position from the crown base with a CBH of 25 cm.
| Property | Value | |
|---|---|---|
| Density (kg/m3) | 789.5 | |
| Effective heat of combustion (MJ/kg) | 30.6 | |
| Heat flux (kW/m2) | 568.5 |
The thermo-physical and chemical properties of the samples applied to the FDS models are summarised in Table 18.
| Property | Euc_6M | Euc_3Y | Euc_5Y | Comments | |
|---|---|---|---|---|---|
| T a (°C) | 26 | 28 | 25 | Measured | |
| Δh c (kJ/kg) | 17,384 | Pérez et al. (2006) | |||
| χ r | 35% × HRRPUV | Default | |||
| χ s | ≈0.01 | [750–900°C] (Neves et al. 2017) | |||
| χ char | ≈0.11 | ||||
| χCO | ≈0.32 | ||||
| σ (m−1) | 5690 | Fernandes and Rego (1998) | |||
| ρ e (kg/m3) | 650 | ||||
| ρ s,n (kg/m3) | Table 14 | Measured | |||
| M a (%) | 53 | Measured | |||
| Dimensions | Table 3 | Measured | |||
| M e,n (%) | Tables 4–6 | Measured | |||
| c p,v | McGrattan et al. (2013) | ||||
Heat flux
Considering the vegetation as cylindrical particles with corresponding drag and applying the properties in Table 18, the heat fluxes from FDS were validated for the cases with the highest heat flux and flame heights in Fig. 14. The corresponding uncertainty parameters for the FDS results are reported in Table 19.
Flame height
To determine the flame heights from FDS, Eqn 22 results were compared with the formulations by Kim (2009), Eqn 27, and Heskestad (1983), Eqn 28.
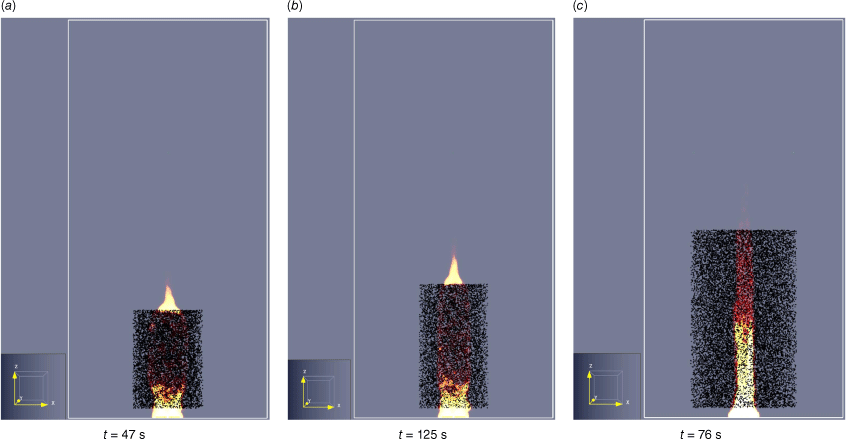
Eqn 27 was developed to calculate flame heights from Pinus densiflora fuel beds, and Eqn 28 for pool fires. The calculated flame heights from FDS data were compared with experimental data at times of maximum heat flux. Visual flames from FDS are illustrated in Fig. 15, and the relative errors between this method and the empirical data are detailed in Table 20.
Visual flame from FDS corresponding to the maximum flame height condition for (a) Euc_6M; (b) Euc_3Y; (c) Euc_5Y.
| Approach | H f (m) [Relative error (%)] | |||
|---|---|---|---|---|
| Euc_6M | Euc_3Y | Euc_5Y | ||
| Eqn 22 | 1.82 [−2.4] | 2.25 [6.1] | 2.56 [−1.7] | |
| FDS | 1.81 [−2.5] | 1.86 [−12.3] | 2.39 [−7.9] | |
| Kim (2009) | 2.11 [13.4] | 2.19 [3.1] | 2.86 [10.1] | |
| Heskestad (1983) | 1.62 [−13.1] | 2.05 [−3.3] | 1.82 [−30.0] | |
A comparison of flame height prediction approaches reveals that Eqn 22 generally performs with consistent accuracy and the smallest overall errors.
Mass loss rate
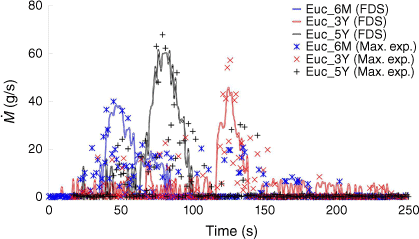
The instantaneous MLR from both FDS simulations and experimental results for this study are shown in Fig. 16, with associated uncertainty parameters detailed in Table 21. The experimental MLR was calculated by differentiating the mass loss data over time and smoothing to highlight the underlying trends in the measurements. According to the FDS, the total MLRs for Euc_6M, Euc_3Y, and Euc_5Y were 1017.8, 1200.8, and 1452.2 g, respectively. Compared with the experimental values of 1114, 1291 and 1320 g, the respective relative errors were calculated as −8.6, −7.0 and 10.0%.
FDS results for the mass loss rate (MLR) profiles, (g/s), against time (s), from different case studies corresponding to the maximum heat flux condition for Euc_6M, Euc_3Y, Euc_5Y.
| Case study | (g/s) | σ (±g/s) | σ M (g/s) | |
|---|---|---|---|---|
| Euc_6M | 3.91 | 2.68 | 0.08 | |
| Euc_3Y | 4.59 | 3.07 | 0.09 | |
| Euc_5Y | 5.56 | 3.92 | 0.12 |
is the FDS mean. σ and σM are the s.d. and s.e. of the FDS and the empirical data.
Studies such as Morrisset et al. (2022) explored the effects of various data smoothing techniques on MLR data for charring and non-charring solids and the influence of high-order filters’ on peak MLR reduction.
Flame temperature
The temperature profiles from the FDS analysis are presented in Fig. 17, where they are compared with the experimental results, with uncertainty parameters in Table 22. The graph shows the temperature variation over time for different conditions. The FDS predictions demonstrate reasonable agreement with the experimental data, capturing the overall trends and peak temperatures. However, some discrepancies, particularly in the later stages of the experiment, are noted. These differences may be attributed to simplification in the FDS model, which assumes uniformly dispersed particles in the solution domain. In contrast, real trees have structural variations from the crown base to the apex. This simplification in the model likely contributes to the observed deviations in the latter part of the figures.
FDS results for the temperature profiles, T (°C), against time (s) at different vertical spots compared with the experimental cases corresponding to the maximum heat fluxes for (a) Euc_6M, (b) Euc_3Y, and (c) Euc_5Y.
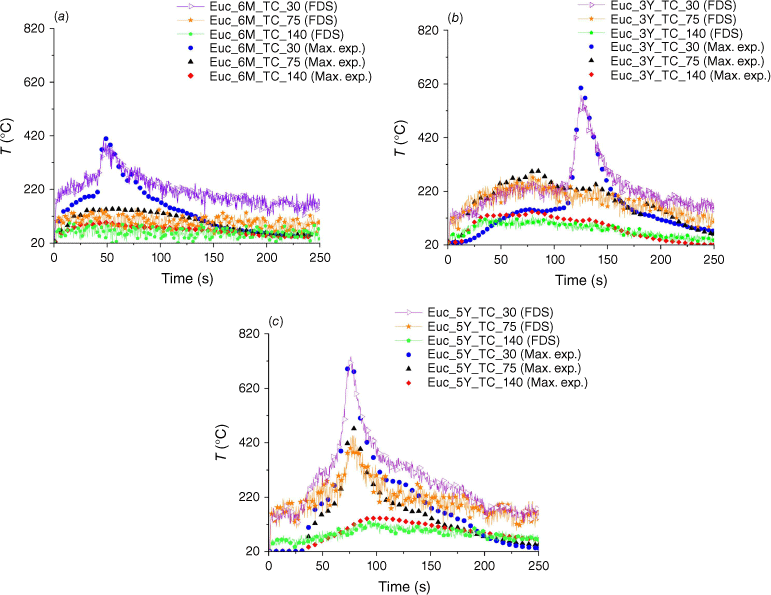
| Case study | Probe | σ (±°C) | σ M (°C) | ||
|---|---|---|---|---|---|
| Euc_6M | _TC_30 | 210.9 | 56.7 | 2.1 | |
| _TC_75 | 180.3 | 49.9 | 1.8 | ||
| _TC_140 | 72.5 | 24.1 | 1.4 | ||
| Euc_3Y | _TC_30 | 216.2 | 93.8 | 2.9 | |
| _TC_75 | 185.8 | 45.2 | 1.4 | ||
| _TC_140 | 84.6 | 25.5 | 0.8 | ||
| Euc_5Y | _TC_30 | 242.9 | 87.9 | 3.7 | |
| _TC_75 | 195.9 | 88.5 | 2.8 | ||
| _TC_140 | 93.3 | 31.2 | 0.9 |
is the FDS mean. σ and σM are the s.d. and s.e of the FDS and the empirical data.TC_30, TC_75, and TC_140 are thermocouples 30, 75, and 140 cm from the ignitor trays for Euc_6M, Euc_3Y, and Euc_5Y.
Convective plume
The UPV profiles obtained from the FDS analysis are shown in Fig. 18, alongside the experimental results for comparison. The uncertainty parameters are shown in Table 23. The FDS model effectively captures the initial increase and peak values of UPV. However, inconsistencies arise in the later stages of the profiles. These discrepancies, much like those observed in the temperature profiles, are likely due to the FDS model’s simplifications. Specifically, the model assumes uniformly dispersed particles, which do not fully reflect the actual structural variations of the tree from the crown base to the apex. This difference in modelling likely contributes to the observed deviations.
The updraft plume velocity (UPV) profiles(m/s) against time (s) from FDS compared with the experimental data corresponding to the maximum heat flux condition for Euc_6M, Euc_3Y, and Euc_5Y.
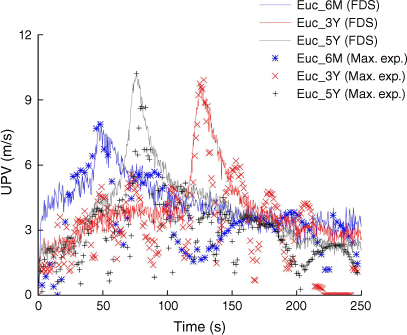
| Case study | (m/s) | σ (±m/s) | σ M (m/s) | |
|---|---|---|---|---|
| Euc_6M | 3.67 | 1.12 | 0.03 | |
| Euc_3Y | 3.72 | 1.22 | 0.04 | |
| Euc_5Y | 3.78 | 1.27 | 0.04 |
is the FDS mean. σ and σM are the s.d. and s.e. of the FDS and the empirical data.
Comparing FDS simulations with corresponding experimental data demonstrates the capability of this numerical tool in predicting key thermal and physical flame characteristics, such as heat flux, flame dimensions, mass loss rate, temperature and UPV profiles. This accuracy is achievable using appropriate parameter settings based on the experimental data. This predictive accuracy is crucial in the fields of fire dynamics and safety engineering, where a reliable understanding of flame behaviour and the flammability of vegetation and forest fuels is essential for effective risk assessment and mitigation strategies.
Conclusion
This paper reports the experimental and numerical analysis of the flammability parameters of Eucalyptus globulus plants at different stages of growth: 6 months, 3 and 5 years. Based on the heat release rates in this research, an empirical formula is proposed as a correlation for flame height.
This analysis reveals that older plants produce higher heat flux during combustion, which is attributed to their larger fuel elements, concentrated volatile compounds and reduced fuel moisture content (FMC). In contrast, younger plants, characterised by higher bulk densities and lower surface-to-volume ratios, are more prone to ignition and exhibit higher flames with lower heat flux values. In comparison, older plants, with lower bulk densities and higher surface-to-volume ratios, burn more intensely for shorter durations. This shift is due to changes in the plant’s chemical composition, moisture content and physical structure with age.
This study demonstrates that as Eucalyptus globulus matures, its combustibility and consumability increase. Consequently, older plants showed a higher propensity for ignition and released more heat, with reduced sustainability. In contrast, younger plants, which have higher ignitability, exhibit higher flame lengths relative to crown height. This dynamic interplay between ignitability, combustibility, consumability and sustainability is influenced by changes in chemical content, bulk density and surface-to-volume ratio with plant ages.
In this study, FDS 6.8.0, a physics-based fire simulator, was used to model these characteristics, incorporating the chemical and physical properties of the plants into the code. The simulations, based on the LES turbulence model, were compared with experimental data for the fire’s thermophysical properties and mass loss behaviour. Comparing FDS simulations with experimental data demonstrates the tool’s ability to predict key thermal and physical flame characteristics, such as heat flux, flame dimensions, mass loss rate, temperature and updraft plume velocity (UPV) profiles. This accuracy is achieved through appropriate parameter settings aligned with experimental data.
The study also suggests that modelling trees with a cylindrical configuration and 80% of the crown diameter serves as a useful approximation for uniformly dispersed particles, despite real trees having structural variations both vertically and horizontally. Overall, FDS proved to be an invaluable tool for predicting the transient behaviour of fire and the flammability of forest species, providing valuable insights for effective risk assessment and the development of mitigation strategies. This capability allows a better understanding of how plant age affects fire behaviour and the adoption of appropriate safety measures based on the fire characteristics from burning species.
Nomenclature
| CD | Drag coefficient |
| cp | Constant-pressure specific heat, J kg−1 K−1 |
| D | Mass diffusivity, m2 s−1; diameter of the pool fire, m |
| D* | Characteristic fire diameter, m |
| e | Internal energy, kJ kg−1 |
| Drag force per unit volume, N m−3 | |
| g | Gravitational acceleration, m s−2 |
| Hf | Flame height, m |
| h | Mixture enthalpy, kJ kg−1 |
| hc | Convection heat transfer coefficient, W m−2 K−1 |
| hg | Specific enthalpy of species g at temperature T, kJ kg−1 |
| hs | Sensible enthalpy, kJ kg−1 |
| I | Identity matrix |
| I | Radiation intensity per unit of solid angle, kW m−2 |
| J | Diffusive mass flux, kg s m−2 |
| k | Thermal conductivity, W m−1 K−1 |
| ksgs | Sub-grid-scale kinetic energy, m2 s−2 |
| M | Fuel moisture content, %; humidity, %; molecular weight of the species g, g mol−1; solid fuel mass, g |
| Mass loss rate, g s−1 | |
| Chemical mass consumption of gaseous species g, kg s−1 m−3 | |
| Mass production by thermal degradation of vegetation, kg s−1 m−3 | |
| p | Hydrodynamic pressure, Pa |
| Background pressure, Pa | |
| p0 | Thermodynamic pressure, Pa |
| Pr | Prandtl number |
| Convective heat flux, kW m−2 | |
| Conductive heat release rate per unit volume, kW m−3 | |
| Heat release rate per unit volume by chemical reactions, kW m−3 | |
| Heat release rate, kW | |
| Total heat release rate, kW | |
| Conductive + radiative heat source, kW m−3 | |
| q | Heat flux vector, kW m−2 |
| r | Stoichiometric ratio; radius, m |
| Re | Reynolds number |
| Favre-weighted strain rate tensor | |
| ŝ | The unit vector in the direction of the radiation intensity |
| Sc | Schmidt number |
| t | Time, s |
| T | Temperature, °C |
| Filtered temperature, °C | |
| u | Velocity vector, m s−1 |
| u | Velocity vector component in the x-direction, m s−1 |
| û | Weighted average of the velocity component in the x-direction over the adjacent cells, m s−1 |
| Mean velocity component in the x-direction at the centre of the grid cell, m s−1 | |
| U | Integrated radiant intensity, kW m−2 |
| v | Velocity vector component in the y-direction, m s−1 |
| V | Volume, m3 |
| w | Velocity vector component in the z-direction, m s−1 |
| Wg | The molecular weight of gas species g, kg kmol−1 |
| The average molecular weight of the gaseous mixture, kg kmol−1 | |
| x | Position vector = (x,y,z) |
Subscripts
| 0 | Initial state |
| 1 | Frontal |
| 2 | Lateral |
| a | Ambient |
| b | Bulk property; black body |
| c | Combustion; chemical; convection |
| d | Dry-based |
| e | Fuel element |
| f | Final state; flame |
| F | Fuel |
| g | Gaseous species |
| i | Fuel element, unit vector in the x-direction |
| j | Unit vector in the y-direction |
| k | Unit vector in the z-direction |
| n | Component; fuel class |
| r | Radiative |
| s | Solid, soot |
| t | Turbulent |
| v | Dry vegetation |
Greek letters
| α | Normalised instantaneous relative mass decay, 1 |
| γ | Ratio of the specific heats, 1 |
| δx | Computational cell size in the x-direction, m |
| δy | Computational cell size in the y-direction, m |
| δz | Computational cell size in the z-direction, m |
| ζg | Mass fraction of species g |
| Δ | LES filter width, m |
| ΔHc | Molar heat of combustion, kJ kmol−1 |
| Δhc | Mass-based heat of combustion, kJ kg−1 |
| Δhvap | Vaporisation heat, kJ kg−1 |
| Δhpyr | Pyrolysis heat, kJ kg−1 |
| κ | Radiative absorption coefficient, 1 |
| μ | Dynamic viscosity of the gaseous mixture, kg m−1 s−1 |
| νt | Turbulent (or eddy) viscosity, m2 s−1 |
| ρ | Density, kg m−3 |
| σ | Standard deviation |
| σB | Stefan–Boltzmann constant, 5.67 × 10⁻¹¹ kW m−2 K−4 |
| σi | Surface to volume ratio of fuel element i, m−1 |
| σM | Standard error |
| τ | Stress tensor, Pa |
| Relative mass decay coefficient, s−1 | |
| χchar | (=mi.char/me,v) Char yield or the fraction of solid dry vegetation fraction converted to char, 1 |
| χr | Fraction of the local chemical heat release in radiation form to the surroundings, 1 |
| χs | Soot yield, 1 |
| χCO | CO yield, 1 |
| Ψ | Deardorff turbulent (or eddy) viscosity model's constant |
| Ω | (=ρbv/ρi) packing ratio, 1 |
Acronyms
| CEIF | Centro de Estudos sobre Incêndios Florestais |
| CBH | Crown base height |
| CD | Crown diameter |
| CFD | Computational fluid dynamics |
| CFL | Courant–Friedrichs–Lewy number |
| CH | Crown height |
| DNS | Direct numerical simulation |
| EDC | Eddy dissipation concept |
| EOS | Equation of state |
| FDS | Fire dynamics simulator |
| FLIR | Forward Looking Infrared |
| FMC | Fuel moisture content |
| HFM | Heat flux meter |
| HRRPUA | Heat release rate per unit area |
| HRRPUV | Heat release rate per unit volume |
| IR | Infrared |
| LES | Large-eddy simulation |
| MLR | Mass loss rate |
| MPI | Message Passing Interface |
| NI | National Instruments |
| NIST | National Institute of Standards and Technology |
| OpenMP | Open Multi-Processing |
| PIV | Particle image velocimetry |
| PT | Pitot tube |
| ROS | Rate of spread |
| RTE | Radiative transport equation |
| TC | Thermocouple |
| THF | Total heat flux |
| UPV | Updraft plume velocity |
| WUI | Wildland–urban interface |
Data availability
The data for this study, including the experimental and numerical results, are stored in the Laboratório de Estudos sobre Incêndios Florestais (LEIF) archive repository and are available on reasonable request.
Declaration of funding
This research was funded by the Portuguese Foundation for Science and Technology (www.fct.pt) through Project Smokestorm, ‘Forecasting and communicating wildland fire smoke effects’ (Ref. PCIF/MPG/0147/2019).
Acknowledgements
The authors would like to thank João Carvalho for his efforts in preparing and setting up the experiments, without whose cooperation these experiments would not have been possible.
References
Almeida M, Porto L, Viegas D (2021) Characterization of firebrands released from different burning tree species. Frontiers in Mechanical Engineering 7, 651135.
| Crossref | Google Scholar |
Anderson HE (1970) Forest fuel ignitibility. Fire Technology 6, 312-319.
| Crossref | Google Scholar |
Andrews PL (1986) BEHAVE: Fire Behavior Prediction and Fuel Modeling System – BURN Subsystem, Part 1. The bark beetles, fuels, and fire bibliography. 10.2737/INT-GTR-194
Andrews PL, Bevins CD, Seli RC (2005) BehavePlus fire modeling system, version 4.0: User’s Guide. General Technical Report RMRS-GTR-106 Revised. (USDAForest Service, Rocky Mountain Research Station: Ogden, UT) 10.2737/RMRS-GTR-106
Balbi JH, Rossi JL, Marcelli T, Santoni PA (2007) A 3D physical real-time model of surface fires across fuel beds. Combustion Science and Technology 179, 2511-2537.
| Crossref | Google Scholar |
Balbi JH, Morandini F, Silvani X, Filippi JB, Rinieri F (2009) A physical model for wildland fires. Combustion and Flame 156, 2217-2230.
| Crossref | Google Scholar |
Balbi JH, Chatelon FJ, Morvan D, Rossi JL, Marcelli T, Morandini F (2020) A convective–radiative propagation model for wildland fires. International Journal of Wildland Fire 29, 723-738.
| Crossref | Google Scholar |
Bond WJ, Keeley JE (2005) Fire as a global ‘herbivore’: the ecology and evolution of flammable ecosystems. Trends in Ecology & Evolution 20, 387-394.
| Crossref | Google Scholar | PubMed |
Cawson JG, Hemming V, Ackland A, Anderson W, Bowman D, Bradstock R, Brown TP, Burton J, Cary GJ, Duff TJ, Folkov A, Furlaud JM, Gazzard T, Kilinc M, Nyman P, Peacock R, Ryan M, Sharples J, Sheridan G, Tolhurst K, Wells T, Zylstra P, Penman TD (2020) Exploring the key drivers of forest flammability in wet eucalypt forests using expert-derived conceptual models. Landscape Ecology 35, 1775-1798.
| Crossref | Google Scholar |
Cheney NP, Sullivan A (2008) ‘Grassfires: fuel, weather and fire behaviour.’ (CSIRO Publishing: Melbourne, Australia) 10.1071/9780643096493
Cheney NP, Gould JS, Catchpole WR (1998) Prediction of fire spread in grasslands. International Journal of Wildland Fire 8, 1-13.
| Crossref | Google Scholar |
Clark TL, Jenkins MA, Coen J, Packham DR (1996) A coupled atmosphere–fire model: convective feedback on fire-line dynamics. Journal of Applied Meteorology and Climatology 35, 875-901.
| Crossref | Google Scholar |
Curry JR, Fons WL (1938) Rate of spread of surface fires in the ponderosa pine type of California. Journal of Agriculture Research 57, 239-267 Available at https://naldc.nal.usda.gov/catalog/IND43969096.
| Google Scholar |
Curry JR, Fons WL (1940) Forest-fire behavior studies. Mechanical Engineering 62, 219-225 Available at https://www.fs.usda.gov/research/treesearch/50522.
| Google Scholar |
Deardorff JW (1980) Stratocumulus-capped mixed layers derived from a three-dimensional model. Boundary-Layer Meteorology 18, 495-527.
| Crossref | Google Scholar |
Emmons HW (1964) Fire in the forest. Fire Research Abstracts and Reviews 5, 163-178.
| Google Scholar |
FAO (Food and Agriculture Organization of the United Nations) (2021) FAOSTAT: database – crop production. Available at http://faostat.fao.org/
Fernandes PM, Rego FC (1998) A new method to estimate fuel surface area-to-volume ratio using water immersion. International Journal of Wildland Fire 8, 121-128.
| Crossref | Google Scholar |
Filippi JB, Bosseur F, Pialat X, Santoni PA, Strada S, Mari C (2011) Simulation of coupled fire/atmosphere interaction with the MesoNH-ForeFire models. Journal of Combustion 2011, 540390.
| Crossref | Google Scholar |
Fons WL (1946) Analysis of fire spread in light forest fuels. Journal of Agricultural Research 72, 92-121 Available at https://www.fs.usda.gov/research/treesearch/58122.
| Google Scholar |
Frandsen WH (1971) Fire spread through porous fuels from the conservation energy. Combustion and Flame 16, 9-16.
| Crossref | Google Scholar |
Guerrero F, Carmona C, Hernández C, Toledo M, Arriagada A, Espinoza L, Bergmann J, Taborga L, Yañez K, Carrasco Y (2022) Drivers of Flammability of Eucalyptus globulus Labill Leaves: terpenes, essential oils, and moisture content. Forests 13, 1-23.
| Crossref | Google Scholar |
Heskestad G (1983) Luminous heights of turbulent diffusion flames. Fire Safety Journal 5, 103-108.
| Crossref | Google Scholar |
Jolly WM, Parsons RA, Hadlow AM, Cohn GM, McAllister SS, Popp JB, Hubbard RM, Negron JF (2012) Relationships between moisture, chemistry, and ignition of Pinus contorta needles during the early stages of mountain pine beetle attack. Forest Ecology and Management 269, 52-59.
| Crossref | Google Scholar |
Keeley JE, Bond WJ, Bradstock RA, Pausas JG, Rundel PW (2011) ‘Fire in Mediterranean ecosystems: ecology, evolution and management.’ (Cambridge University Press: Cambridge) 10.1017/CBO9781139033091
Kim DH (2009) Study on flame height equation for the Pinus densiflora surface fuel bed. Fire Science and Engineering 23, 10-15.
| Google Scholar |
Linn R, Harlow FH (1997) FIRETEC: A transport description of wildfire behavior. (Los Alamos National Lab., Los Alamos: NM, USA) 10.2172/505313
Magnussen BF, Hjertager BH (1977) On mathematical modeling of turbulent combustion with special emphasis on soot formation and combustion. Symposium (International) on Combustion 16, 719-729.
| Crossref | Google Scholar |
Mandel J, Beezley JD, Kochanski AK (2011) Coupled atmosphere-wildland fire modeling with WRF 3.3 and SFIRE 2011. Geoscientific Model Development 4, 591-610.
| Crossref | Google Scholar |
Martin RE, Gordno DA, Gutierrez ME, Lee DS, Molina-Terrén DM, Schroeder RA, Sapsis DB, Stephens SL, Chambers M (1994) Assessing the flammability of domestic and wildland vegetation. Proceedings of the International Conference on Fire and Forest Meteorology 12, 130-137 Available at https://www.frames.gov/catalog/43907.
| Google Scholar |
Martinka J, Rantuch P, Wachter I (2019) Impact of water content on energy potential and combustion characteristics of methanol and ethanol fuels. Energies 2019 12, 1-16.
| Crossref | Google Scholar |
Martins FB, Benassi RB, Torres RR, de Brito Neto FA (2022) Impacts of 1.5°C and 2°C global warming on Eucalyptus plantations in South America. The Science of The Total Environment 825, 153820.
| Crossref | Google Scholar | PubMed |
Martins Fernandes PA (2001) Fire spread prediction in shrub fuels in Portugal. Forest Ecology and Management 144, 67-74.
| Crossref | Google Scholar |
McGrattan KB, McDermott R, Weinschenk C, Overholt K, Hostikka S, Floyd J (2013) ‘Fire Dynamics Simulator technical reference guide volume 1: mathematical model.’ (National Institute of Standards and Technology: Gaithersburg, MD) 10.6028/NIST.SP.1018e6
Mell W, Jenkins MA, Gould J, Cheney P (2007) A physics-based approach to modelling grassland fires. International Journal of Wildland Fire 16, 1-22.
| Crossref | Google Scholar |
Mell W, Maranghides A, Mcdermott R, Manzello SL (2009) Numerical simulation and experiments of burning Douglas fir trees. Combustion and Flame 156, 2023-2041.
| Crossref | Google Scholar |
Modarres M, Almeida M (2022) Application of the computational fluid dynamics in forest fires investigations for mitigation of the wildland–urban interface fires’ risks. In ‘Advances in forest fire research’. (Eds DX Viegas, LM Ribeiro) pp. 533–538. (Coimbra University Press: Coimbra, Portugal) 10.14195/978-989-26-2298-9_83
Morrisset D, Santamaria S, Hadden R, Emberley R (2022) Implications of data smoothing on experimental mass loss rates. Fire Safety Journal 131, 103611.
| Crossref | Google Scholar |
Morvan D, Accary G, Meradji S, Frangieh N, Bessonov O (2018) A 3D physical model to study the behavior of vegetation fires at laboratory scale. Fire Safety Journal 101, 39-52.
| Crossref | Google Scholar |
Neves D, Matos A, Tarelho L, Thunman H, Larsson A, Seemann M (2017) Volatile gases from biomass pyrolysis under conditions relevant for fluidized bed gasifiers. Journal of Analytical and Applied Pyrolysis 127, 57-67.
| Crossref | Google Scholar |
Pausas JG, Keeley JE (2009) A burning story: the role of fire in the history of life. Bioscience 59, 593-601.
| Crossref | Google Scholar |
Pérez S, Renedo CJ, Ortiz A, Mañana M, Silió D, Peredo J (2006) Comparison of energy potential of the Eucalyptus globulus and the Eucalyptus nitens. The Renewable Energies & Power Quality Journal 1, 196-200.
| Crossref | Google Scholar |
Porterie B, Morvan D, Larini M, Loraud JC (1998) Wildfire propagation: a two-dimensional multiphase approach. Combustion, Explosion and Shock Waves 34, 139-150.
| Crossref | Google Scholar |
Rehm RG, McGrattan KB, Baum HR (2002) Large eddy simulation of flow over a wooded building complex. Wind and Structures 5, 291-300.
| Crossref | Google Scholar |
Rosavec R, Barčić D, Španjol Ž, Oršanić M, Dubravac T, Antonović A (2022) Flammability and combustibility of two Mediterranean species in relation to forest fires in Croatia. Forests 13, 1266.
| Crossref | Google Scholar |
Sánchez-Monroy X, Mell W, Torres-Arenas J, Butler BW (2019) Fire spread upslope: numerical simulation of laboratory experiments. Fire Safety Journal 108, 102844.
| Crossref | Google Scholar |
Show SB (1919) Climate and forest fires in northern California. Journal of Forestry 17, 965-979.
| Crossref | Google Scholar |
Sullivan AL (2009a) Wildland surface fire spread modelling, 1990–2007. 1: Physical and quasi-physical models. International Journal of Wildland Fire 18, 349-368.
| Crossref | Google Scholar |
Sullivan AL (2009b) Wildland surface fire spread modelling, 1990–2007. 2: Empirical and quasi-empirical models. International Journal of Wildland Fire 18, 369-386.
| Crossref | Google Scholar |
Sullivan AL (2009c) Wildland surface fire spread modelling, 1990–2007. 3: Simulation and mathematical analogue models. International Journal of Wildland Fire 18, 387-403.
| Crossref | Google Scholar |
Varner JM, Kane JM, Kreye JK (2015) The flammability of forest and woodland litter: a synthesis. Curr Forestry Rep 1, 91-99.
| Crossref | Google Scholar |
Viegas DX, Ribeiro C, Almeida M, Pinto P, Ribeiro LM, Silva Á (2023) Field and laboratory analysis of the junction fire process in the catastrophic fire of Pedrógão Grande in June 2017. International Journal of Wildland Fire 32, 951-967.
| Crossref | Google Scholar |
Whelan RJ (2009) The ecology of fire – developments since 1995 and outstanding questions. The Proceedings of the Royal Society of Queensland 115, 59-68.
| Crossref | Google Scholar |
White RH, Zipperer WC (2010) Testing and classification of individual plants for fire behaviour: plant selection for the wildland–urban interface. International Journal of Wildland Fire 19, 213-227.
| Crossref | Google Scholar |


