An integrated framework for habitat restoration in fire-prone areas. Part 2 – fire hazard assessment of the different land management scenarios
R. Vaz A * , P. Maia B , J. Keizer C , P. Fernandes D , S. C. Pereira A and D. Carvalho AA
B
C
D
Abstract
Climate change has increased the occurrence of fire-prone weather and extreme weather events in Europe. Improving resilience of forests to reduce fire hazard has become an imperative challenge to tackle.
This study aims to incorporate extreme fire events from future climate projections in developing forest planning and land management scenarios, evaluating fire risk mitigation potential.
Using the wildfire–atmosphere coupled modelling system WRF-SFIRE, land management scenarios for the Lombada Forest Intervention Region (ILMA) in northeast Portugal were assessed under a business-as-usual future climate scenario. The Fire Weather Index (FWI) was used as a predictor of fire danger to select two fire events.
Agricultural areas can function as barrier for wildfire conditions under cooler weather. Management of the existing pine forest yielded a reduction in fire spread speed and intensity, namely in lower wind speed regimes, significantly improving suppressive capabilities.
Fuel treatment of maritime pine performed best in reducing fire spread rate, intensity and improving suppression capability. Replacing agricultural areas with oak-based land cover can promote higher fire intensity and spread rates in the younger stanges or if left unmanaged.
This framework can be used to provide additional tools for forest management across different landscapes reducing fire hazard and vulnerability and improving forest resilience, under climate change.
Keywords: alternative landscape scenarios, climate change, fire modelling, fire propagation, fireline intensity, fuel models, land management strategies, WRF-SFIRE.
Introduction
Wildfires have been one of Europe’s biggest challenges, amplified by climate change in both frequency and intensity (Bedia et al. 2015). Increasing droughts and fire fire-prone weather have promoted larger wildfires (IPCC 2022). Regions prone to fire in Europe are projected to shift northward along the 40°–45° latitudes, as global temperatures are predicted to increase by up to 4°C (Galizia et al. 2023). Rising temperatures and drought from anthropogenic climate change have boosted fuel aridity, leading to an increase in burned areas (Abatzoglou and Williams 2016). Particularly extreme fires have occurred in recent years, such as the October 2017 fire events in Portugal (Viegas et al. 2019), preceded by the Pedrogão Grande fire in July that year (San-Miguel-Ayanz et al. 2020), and the 2021 Greek fire season (Giannaros et al. 2022) sometimes associated with high atmospheric instability fostering pyro convection Senande-Rivera et al. 2022). The 2017 events in Portugal caused a total of 117 human fatalities, with estimated damages around 1.5 billion euros (Aparício et al. 2022). Current future climate projections show that critical fire seasons and events are expected to span over longer periods that are associated with extended periods of drought and higher temperatures in the Mediterranean (Bedia et al. 2015; Aparício et al. 2022; Senande-Rivera et al. 2022; Vacek et al. 2023).
To tackle the emerging climate change issues, studies looking into increasing vegetation resilience have been carried out, aiming to articulate new initiatives such as reforestation with more sustainable and less flammable species, using Geographical Information System (GIS) based mapping and applying custom land management models (Navalho et al. 2017). Fuel breaks, land cover mosaics and fuel treatments have been used as methods to reduce fire spread (Moreira et al. 2011; Fernandes 2013; Sá et al. 2022; Regos et al. 2023).
Simulation frameworks have been employed to quantify fire hazard using fire spread modelling systems, such as FlamMap (Finney 2006), FARSITE (Finney 1995; Finney 1998; Finney 2004), WRF-SFIRE/Fire (Mandel et al. 2011), ForeFire/Meso-NH (Lafore et al. 1998; Filippi et al. 2013). These tools estimate fire spread either empirically or semi-empirically (Bakhshaii and Johnson 2019) by either one-way coupling of fire spread and the atmosphere (with the atmosphere forcing fire spread) or a two-way coupling in which atmosphere and fire mutually interact as a system. Among these models, methods like the Minimum Travel Time (Finney 2002; Finney 2006) have been used to determine wildfire behaviour under a constant atmospheric state. This method has been applied to design fuel treatment scenarios that optimise the spatial layout of fuel treatments, aiming to integrate them in fire management plans (Alcasena et al. 2015; Sá et al. 2022; Jahdi et al. 2023). Nonetheless, one-way models do not explicitly resolve the atmospheric dynamics from fires (Van Wagner 1977; Albini 1979; Rothermel 1991; Scott and Reinhardt 2001). Two-way coupled atmospheric-fire spread models like WRF-SFIRE/Fire and ForeFire/Meso-NH shed new light on how heat, mass and momentum are transferred from fire combustion into the atmosphere, and how those physical processes influence fire progression and rates of spread (Bakhshaii and Johnson 2019).
Fire-smart planning of land management is expected to reduce fire hazard and burned area, thus cutting fire suppression expenditures and decreasing fire-caused damages (Lecina-Diaz et al. 2023). This highlights the need for employing models connecting fuel treatments with the drivers of suppression difficulty and costs (Thompson and Anderson 2015) such as fire size (Thompson et al. 2013), fire intensity (Fitch et al. 2013) and ecological dynamics (Taylor et al. 2013). Fireline intensity is one of the fire behaviour descriptors used to classify the difficulty of controlling a wildfire (Byram 1959). Fireline intensity thresholds assist in determining effective fire suppression and tactics (Andrews 1982; Andrews 2011). Extremely high fireline intensities have been associated with fire behaviour driven or influenced by pyroconvection (Tedim et al. 2018). Based on different thresholds of fireline intensity, firefighters may apply different strategies to tackle the fire and its perimeter (Andrews 1982; Andrews 2011).
This Part 2 of a two-part study aims to investigate different land management scenarios with the two-way coupled atmosphere–fire WRF-SFIRE model under future climate projections, determining which scenarios minimise burned area and maximise fire suppression capabilities, building a framework that can be adapted to any region for land management testing. WRF-SFIRE is based on the Rothermel fire spread model (Rothermel 1972) coupled to a fuel moisture model (Mandel et al. 2011), and has been used operationally in Greece and Israel (Mandel et al. 2014; Giannaros et al. 2020). It uses 13 fuel models that nominally describe the properties of surface fuels, and that can be assigned to a given land cover category (Rothermel 1972; Albini 1976; Anderson 1981).
In Part 1, four land management scenarios were devised in coordination with stakeholders in the Baixa da Lombada, an Integrated Landscape Management Area (AIGP in Portuguese, ILMA hereafter, Fig. 1). The ILMA is located in a protected area of the Montesinho Natural Park, in a transitional area between drywarm to hot summer (Csb-Csa) in a Mediterranean Climate Zone (Kottek et al. 2006). To simulate the scenarios, potential distribution bioclimatic analysis was performed on Pyrenean oak and holm oak forests, using MaxEnt (Phillips et al. 2017) for future climate projections between 2046 and 2065. Through engagement with local forest stakeholders, the suggested oak distributions were refined into the four land management scenarios, adding expert knowledge and incorporating socio-economic needs. The four land management scenarios incorporate management, replacement, or management and replacement of the present land cover. The ILMA was chosen as a stepping stone to build the framework presented in this two-part work, aiming to provide a inter-regional applicability to any area of interest. Supported by literature review, the land management scenarios were converted into one of the 13 fuel models required by WRF-SFIRE.
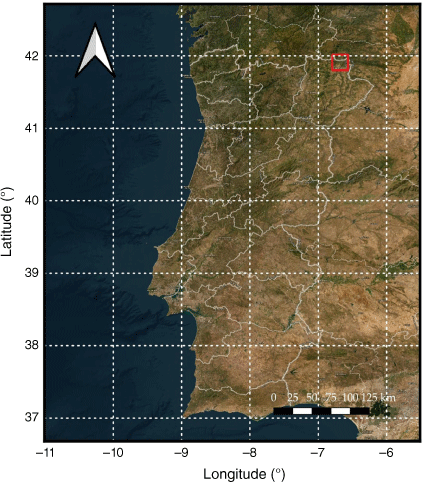
Location of the Integrated Landscape Management Area of Baixa da Lombada (ILMA), in red, in the northeast of Portugal.
Part 2 builds further from the four land management scenarios converted into the National Forest Fire Laboratory (NFFL) fuel models, incorporating them into WRF-SFIRE.
Materials and methods
The Weather Research and Forecast – Advanced Research Weather (WRF-ARW) (Skamarock et al. 2019) in conjunction with the coupled two-way interactive fire spread model, WRF-SFIRE v 4.2 (Mandel et al. 2011, 2014) were used to simulate fire spread over the different land covers defined in part 1, for the ILMA.
Climate data downscaling
To provide WRF-SFIRE’s initial and boundary conditions, future climate projections from the Coupled Model Intercomparison Project Phase 6 (CMIP6) (Eyring et al. 2016) – Max Planck Institute Global Circulation Model MPI-ESM1.2-HR were used. MPI-ESM1.2-HR (henceforth called MPI-CMIP6) output was chosen because it was the only available one at the time this study was carried out with all the initial and boundary meteorological fields needed to force Weather Research and Forecasting (WRF). MPI-CMIP6 data with approx. 100 km of horizontal resolution (Mauritsen et al. 2019) was then dynamically downscaled to a 5 km resolution mesh for the 2046–2065 period, considering the Shared Socioeconomic Pathway 5-8.5 (SSP5-8.5) (Carvalho et al. 2022).
Identification and selection of high fire danger events
The Fire Weather Index (FWI) (Van Wagner and Pickett 1984; Van Wagner 1987) was calculated for the 2046–2065 period, using the downscaled 5 km horizontal resolution WRF-MPI-CMIP6 climate data for the ILMA. FWI is one of the main fire danger indexes used worldwide and is one of the best fire danger predictors for fire-weather studies in the Mediterranean region (Viegas et al. 1999; Good et al. 2008; Bedia et al. 2018; Sirca et al. 2018). Relative humidity, temperature, rainfall, and wind speed data were used to calculate the FWI, using a set of prescribed parameters (Lawson and Armitage 2008).
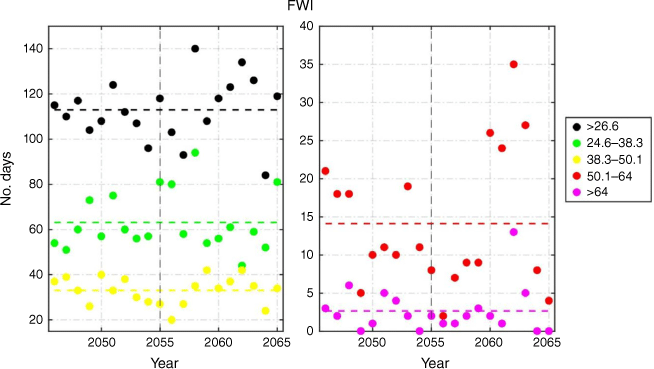
Fig 2 shows the 20-year distribution of FWI values, ranging from Very High Danger (24.6–38.3) to Exceptional Danger (>64) (IPMA 2023). Among all thresholds, the one with most importance is the Exceptional Danger, with highest fire potential. Within the 20-year period, only 4 days are ruled out with no Exceptional Danger observed. Given the number of years that would fit into these criteria, one of them was selected, keeping in mind an above average number of days per year with Very High fire danger, which would account for a more consistent fire danger throughout the whole year. Among them, 2055 was chosen and another dynamical downscaling was performed to increase the horizontal resolution of the climate data from 5000 to 1200 m, thus refining the atmospheric inputs passed to WRF-SFIRE. Then, the FWI was recalculated for the ILMA, using a 1.2 km resolution WRF-MPI-CMIP6 output.
The two panels show the annual number of days per FWI danger class, between 2046 and 2065, as adopted by IPMA: 24.6–38.3 – Very High (green); 38.3–50.1 – Maximum (yellow); 50.1–64 – Extreme (red); >64 – Exceptional (magenta). Different vertical scales are used to represent all intervals in each panel. Horizontal coloured dashed lines represent mean number of days per threshold, vertical dashed line shows the chosen year, 2055.
Using the same methodology, the FWI was then recalculated between April and October. Analysing the results (Fig. 3c), August holds six out the top seven highest Extreme FWI days, FWI > 50 (IPMA 2023). Average relative humidity (RH) for the ILMA at 12 UTC, in Fig. 3b), shows that the highest danger days are associated with very low values of RH, around 25%, with average temperatures being more variable, ranging between just above 20°C and 35°C, as shown in Fig. 3a).
Daily temperature (a), relative humidity (b), at 12 UTC, and Fire Weather Index (c), between April and October for 2055.
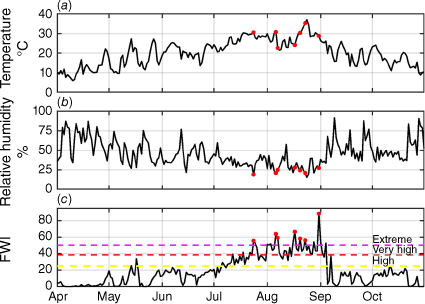
While the FWI is comprised of several sub-indexes, the two most important encompassing all variables and interactions are the Build Up Index (BUI), characterising fuel dryness, and the Initial Spread Index (ISI), describing potential fire-spread rate through wind speed and fine dead fuel moisture content, indicated by the Fine Fuel Moisture Code (FFMC). The FFMC component in the FWI describes the moisture status of fast-drying surface forest fuels (i.e. litter), with a drying time-lag of 5–16 h (Van Wagner and Pickett 1984; Van Wagner 1987).
WRF-SFIRE coupled moisture model used in this study relies on continuous surface temperature and RH changes to model the moisture present in surface fuels, unlike the daily FWI index, which is calculated at 12 h noon each day. To attenuate the effects of daily fluctuations in fuel moisture within the selected high FWI events, the driest days were considered when selecting the fire events.
WRF-SFIRE setup and domain discretisation
The four land management scenarios described in Part 1 were then inserted into WRF-SFIRE as NFFL model codes (Anderson 1981), read by the surface fire spread model embedded into SFIRE (Rothermel 1972). NFFL fuel models are fuel models comprised of dead or dead and live fuels and consider three fuel size classes, or time-lags (1, 10, 100 h) (Rothermel 1972; Albini 1976). These outline the dependence of fuel size and time required to react to changes in atmospheric humidity and temperature, also present in the Canadian Forest Fire Danger Rating System, by Van Wagner (Van Wagner and Pickett 1985).
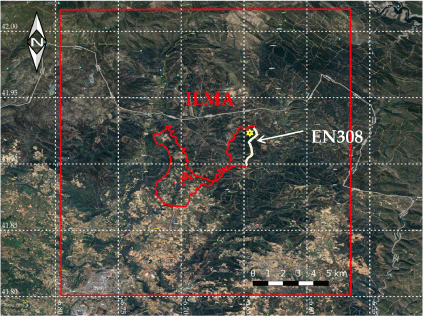
The simulation domain for the ILMA, in the northeast of Portugal, is shown in Fig. 4 (red square) with a horizontal resolution of 240 m. Land use data were retrieved from Corine Land Cover 2018 (100-m resolution) (Büttner et al. 2021), and remapped into the USGS 24 categories, to provide a more up-to-date and higher resolution current land use data (Pineda et al. 2004). USGS categories are assimilated into WRF-SFIRE to provide information on several land cover properties like roughness and albedo, important in solving wind speed and temperature fluxes at the surface.
Surface image of the Integrated Landscape Management Area (ILMA) outlinedin red, contained within the simulation domain, red square. The ignition point is marked with a yellow star, near the EN308 road (white line). The ignition point is located at the highest point within the area.
Physical parametrisations were conserved while downscaling from 1200 to 240 m, providing initial and boundary conditions from the coarser domain into the coupled WRF-SFIRE, shown in Table 1.
| Scheme | d01 | |
|---|---|---|
| Microphysics | WSM-6 (6) (Hong and Lim 2006) | |
| Longwave Radiation | RRTMG (4) (Iacono et al. 2008) | |
| Shortwave Radiation | RRTMG (4) (Iacono et al. 2008) | |
| Surface Layer | Revised MM5 (1) (Jiménez et al. 2012) | |
| Land Surface | NOAH LSM (2) (Tewari et al. 2004) | |
| Cumulus | n/d (0) | |
| Boundary Layer | YSU (1) (Hong et al. 2006) |
The atmospheric model grid was divided by a ratio of 10, into a 24-m horizontal resolution subgrid was generated during pre-processing, containing fuel model information from the custom fuel maps (25-m resolution), and topographical data retrieved from the European Union – Digital Elevation Model (EU-DEM, 25 m resolution) (EU-DEM v1.1 User Guide 2019).
Initial fuel moisture was calculated by WRF-SFIRE coupled fuel moisture model, starting from equilibrium moisture at model startup.
Choosing the ignition point and fire events
To select an ignition point inside the study area, criteria that maximise fire intensity and growth were considered. The ignition location was maintained throughout the two chosen fire events, basing the choice on three factors: surface meteorology, ignition probability and highest fire spread potential. Only two temporal events were used in this study due to computational constraints. Simulating fire–atmosphere interactions requires heavy resources that prevent the use of multiple ignition points at present.
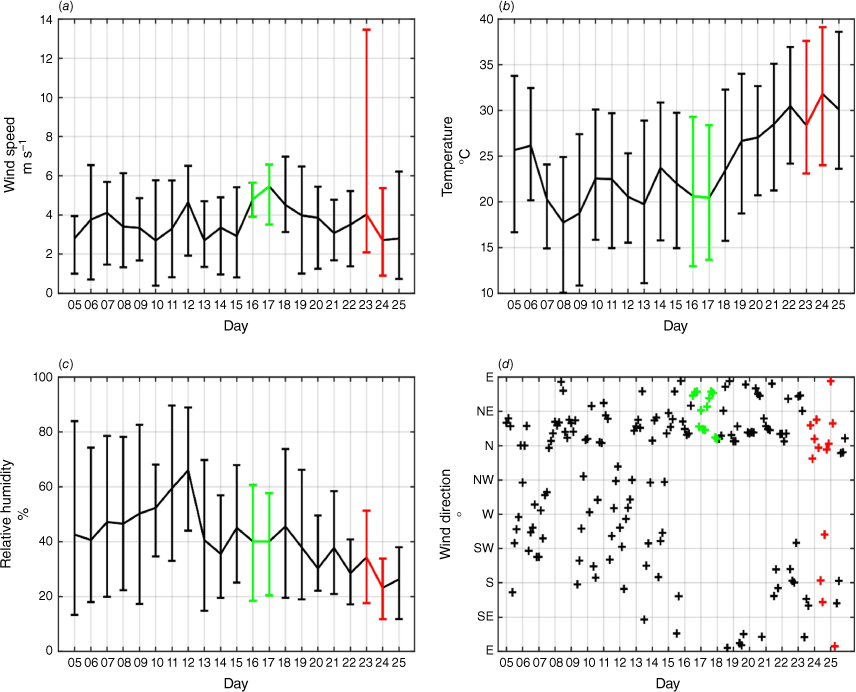
To select ignition times within August, we have accounted for similar wind direction patterns, providing enough temporal distance between both selected events and ensuring the fire spread throughout the ILMA. Two ignition dates with Extreme FWI (>50) were chosen, as shown in Figs 3, 5 and Table 2.
Modelled for August 2055 within the ILMA: average, minimum, and maximum daily values of: (a) 10-m wind speed (m s−1); (b) 2-m temperature (°C); (c) 2 -m relative humidity (%). (d) shows the mean wind direction every 3 h. In green, the period covered by Cool/Moist fire event is marked, and in red, by Hot/Dry.
| Date | T 2 m (°C) | RH (%) | WS (m s−1) | FWI | ISI | FFMC | BUI | ||
|---|---|---|---|---|---|---|---|---|---|
| Cool/Moist | 16/08 | 24.8 | 21.6 | 4.3 | 53 | 16.1 | 93.7 | 249 | |
| 17/08 | 24.1 | 28.0 | 6.4 | 67 | 23.1 | 93.6 | 253 | ||
| Hot/Dry | 23/08 | 35.3 | 21.1 | 3.3 | 55 | 17.2 | 94.6 | 281 | |
| 24/08 | 37.1 | 15.4 | 1.2 | 44 | 12.2 | 95.6 | 251 |
Fire events 1 and 2 are characterised by high values of BUI due to prolonged drought (>250).
Despite having much lower daily average temperature and higher RH (Table 2, Fig. 5), the FWI was higher in fire event 1 than in event 2 due to higher wind speeds. It is noteworthy, however, that the BUI drops significantly towards the end of the event due to convective precipitation occurring in the southernmost edge of the simulation domain, with no impact on the ILMA.
Fire events 1 and 2 will henceforth be called Cool/Moist and Hot/Dry, respectively.
The ignition location was then set by analysing the highest burning potential within the ILMA, assuming a N/NE wind direction. Once more, computational constraints determined that only one general wind pattern would be analysed comparatively. Upholding a similar wind direction allowed to compare two different temperature-fuel moisture conditions (Table 2) while maintaining a general spread direction for consistency. The northeast section of the ILMA is covered by undermanaged, low and closed canopy pine forests, with the highest fuel load and fire intensity potential among all representative covers in the ILMA. Given the computation constraints, another imposed condition was the proximity to ignition sources as well as the likelihood of human-caused and natural ignitions, although to a lesser extent as wind direction is the main constraint in driving fire progression. The northeastern flank of the ILMA is also limited by the EN308 road and is the second highest elevation region of the study area (800 m a.m.s.l.). Roads have been shown to increase the probability of human-caused fire ignitions (Narayanaraj and Wimberly 2012; Ricotta et al. 2018), and elevation to contribute to a higher chance of lighting strike ignitions during summer (Schultz et al. 2019). The ignition point is shown in Fig. 4 as a result of the overlapping criteria, taking into consideration potential extreme fire events characteristic of future climate while maintaining consistency due to computational restraints. Although based on FWI analysis, there were other extreme fire conditions for this area throughout the 2046–2065 period, the chosen year (2055) was one of the very few that would provide similar fire spread direction consistency required when using only two points in time.
Burned area, fireline intensity and fluxes
Fireline intensity (I, kW m−1) is the energy released per metre of fireline per unit of time on the firegrid, and is calculated by SFIRE by employing Byram’s formula (Byram 1959):
where H is the heat of combustion (kJ kg−1), R is the rate of spread (m s−1), and w is fuel consumption in the active flaming zone (kg m−2).
Sensible heat fluxes (Hf, kW m−2) are calculated based on the fraction of fuel burned ω per unit of time tr, accounting for fuel moisture content Mf, fuel load W0 and the fuel’s heat of combustion H (Mandel et al. 2011):
Fire area, fireline intensity and fire heat flux were output at a temporal resolution of 15 min. Fire area was assessed by the number of fire model grid points burned, Fire area = Sr2 grid points, with Sr2 being the area of each grid point. Fireline intensity and heat fluxes were then linearly interpolated between fireline positions to generate maps, encompassing both variables on a regular grid (Amidror 2002).
Fire Radiative Power (FRP) was obtained from the cumulative sum of the fire heat flux on the fireline per second.
Land cover changes within the ILMA
Land cover changes in the ILMA were categorised into NFFL fuel models, ranging between models 1 through 9 in part 1. A scenario was assigned to each land cover map, and management strategy thereof. Current land cover developed into two land management scenarios: current land cover as is (Base Scenario) and its subsequent management, namely by managing the maritime pine stand to create different forest typologies within the area (Scenario 1 – S1), and alternative land use scenarios: new forest implementation without subsequent management (Scenario 2 - S2), new forests implementation with subsequent management to increase forest typology variability within the area (Scenario 3 - S3) and a combination of management of the new forests and of the pre-existing maritime pine forest (Scenario 4 - S4).
The defined areas within the ILMA subjected to land use changes and/or land management were grouped into three areas (A, B, C), as shown in Fig. 6.
ILMA fuel model per land management scenario, described in Part 1. Illustrated above are the colour coded NFFL fuel models for the Base scenario. A, B, and C are shown in dashed boxes as regions of interest for analysing changes in patterns from model outputs. Beneath is the description of the landcover scenarios and their respective fuel codes numbered.
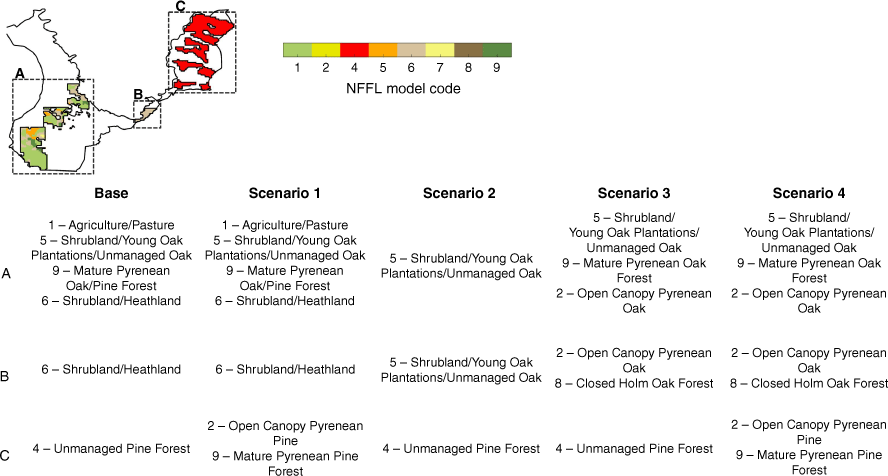
The introduction of simulated management procedures to the pine forest in C, and the replacement/management of land cover in A and B, have changed the patterns of fuel load distribution by size class. It should be added that while fuel model 4 is used for chaparral, its behaviour was deemed similar to an undermanaged maritime pine forest, as explained in Part 1. The amount of finer fuels (1–10 h time-lag) in the ILMA changed from a representative 86.0% to: 84.4% for S1; 87.3% for S2; 85.3% for S3; 84.1% for S4.
Evaluating scenario performance
To characterise the fire behaviour performance of the land cover changes to the study area, results were analysed from four different perspectives: burned area within the ILMA; differences produced by the different landcovers on fireline rate of spread; influence of new land covers on fireline intensity; how new land covers affect the firefighter's capacity to control a fire, expressed in thresholds of fireline intensity within the ILMA (Alexander 1985). These methods aim to assess the resilience to wildfire of newly vegetated areas, outlining which of the scenarios performed better in comparison with the current land cover.
Results
Fire spread in the ILMA
Simulation results for the first 24 h post ignition are shown in Fig. 7, for fire events 1 and 2. Comparing fire progressions between both events, it’s visible that fire spread has halted as it reached the ILMA, between 6 and 9 h, in Cool/Moist, whereas in 2, the fire proceeded and spread throughout most of the study area.
Fire growth isochrones for the first 24 h of the fire for the baseline conditions and the scenarios 1–4 (S1–S4, respectively), starting at the ignition time (0 h), discretised in 3- h intervals. Hatched areas correspond to land management changes per scenario, as in Fig. 6. Arrows in Base show the general spread direction of the fire at the ignition time, for both events. The green polygon in Cool/Moist Base shows an area comprised mostly of agriculture/pasture, present also in S1. The ignition location is represented by a red star.
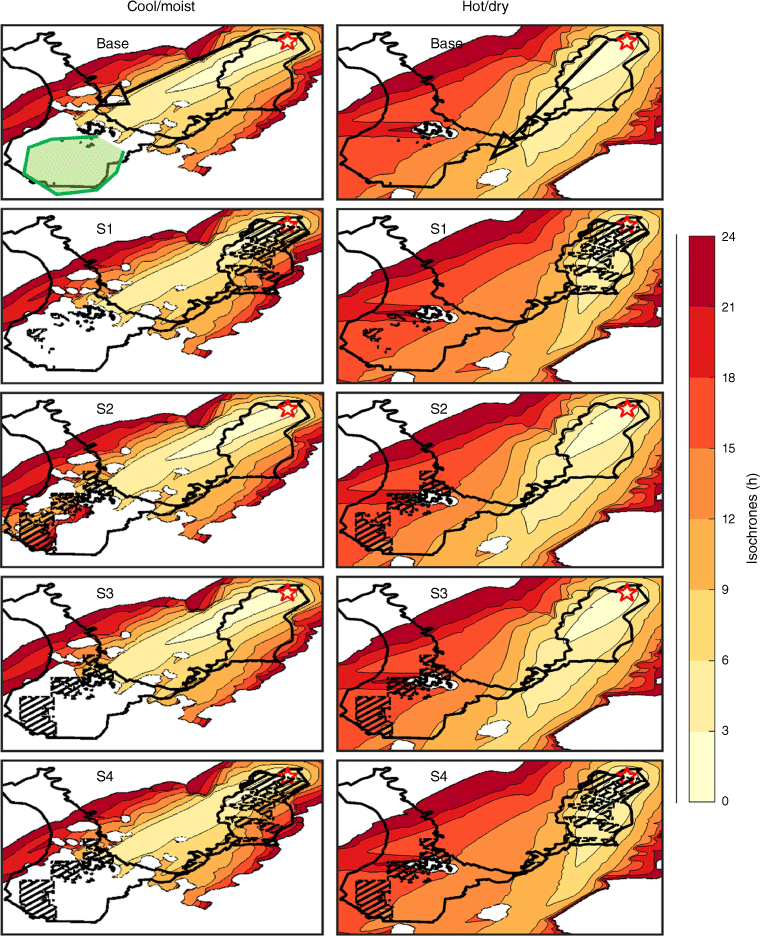
In Fig. 7 Base, S2, and S3, Cool/Moist and Hot/Dry events, fire spreads faster than in S3 and S4 during the first 3–6 h. In both events, changes in the C area from an unmanaged pine into an open canopy managed pine and closed canopy managed pine has shown to significantly decrease progression during the initial stages of the fire, but also divert its spread direction from SW into SSW due to a shift in the wind direction. Cool/Moist S2 is shown as an outlier with fire consuming most of the young oaks in area A, whereas in Base, S1, S3 and S4, the agricultural/pasture area (green polygon, Fig. 7, Base) within and surrounding the ILMA acts as a natural barrier for fire spread.
Effect of fuel moisture on fire progression
Table 3 shows the simulated dead fuel moisture variations in areas A, B and C during the first 24 h of the fire.
| Minimum (%) | Maximum (%) | Mean (%) | |||
|---|---|---|---|---|---|
| Cool/moist | Base | 12.0 | 15.5 | 13.6 | |
| S1 | 12.2 | 15.1 | 13.5 | ||
| S2 | 11.9 | 15.8 | 13.7 | ||
| S3 | 12.1 | 15.3 | 13.6 | ||
| S4 | 12.3 | 15.1 | 13.5 | ||
| Hot/Dry | Base | 5.1% | 9.0 | 6.5 | |
| S1 | 5.4 | 8.8 | 6.7 | ||
| S2 | 4.7 | 9.1 | 6.3 | ||
| S3 | 5.2 | 8.8 | 6.5 | ||
| S4 | 5.5 | 8.6 | 6.7 |
Dead fuel moisture works as a dampening agent to fire spread and intensity, with each assigned NFFL fuel model having a certain threshold denominated ‘moisture of extinction’ above which fire spread ceases (Anderson 1982). Agriculture/pasture areas are comprised only of fine fuels in the 1 h time-lag category and have a low moisture of extinction of 12% (Rothermel 1972; Albini 1976). This prevents the fire from spreading through the middle of the ILMA under higher moisture scenarios, such as Cool/Moist.
As each event has similar wind direction conditions, changes in fire progression can be attributed to wind speed, fuel moisture content, and land cover changes. The exchange of heat between fire and the atmosphere is also likely to create variations in the interaction between the atmosphere and the fire, however, they lie outside of the scope of this study.
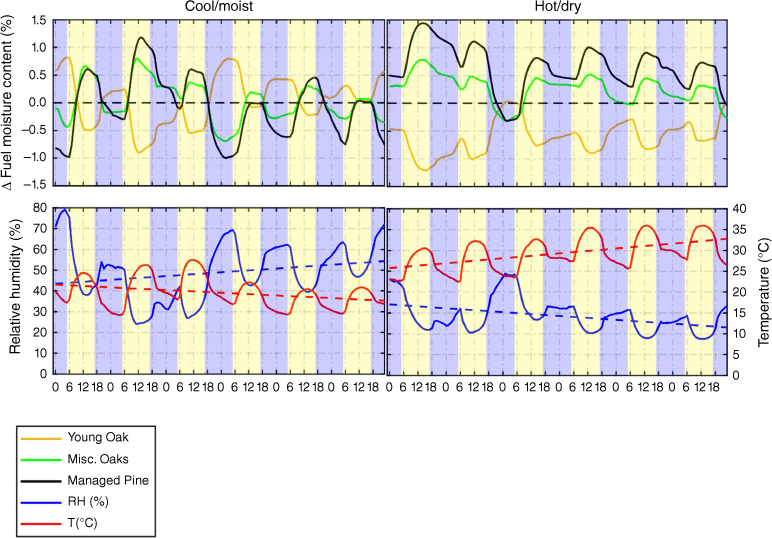
Higher temperature and lower RH in Hot/Dry have contributed to a discrepancy in fuel moisture between fire events, resulting in a halving of fuel moisutre, in comparison to Cool/Moist (Table 3). Furthermore, variations between minimum and maximum moisture between scenarios are observed due to fuel model changes and how fuel moisture reacts to the atmospheric state. But impact of these on fire behaviour variation should be negligible. Fig. A1 (Appendix) shows how fuel moisture conditions evolve on the 5 preceding days to the fire, with most variations being lower than ±1% from fuel model changes and their 1, 10, and 100 h fuel proportions.
Effect of fuels on fireline intensity and spread
Fig. 8 illustrates how the percentage of fuel categories burned, fire growth rate and cumulative Fire Radiative Power (FRP) vary in the ILMA within the first 24 h (at 3 h intervals) for the different land management scenarios and for the two fire events. In Cool/Moist, agricultural/pasture areas displayed little to no burning. Energy release from the fire remains relatively low while the fire spreads towards the southwest, as shown by the relatively stable cumulative FRP throughout the burning period. Fire growth rates remain steady after the first 3 h, with significant changes only occurring near the last 3 h. Fig. 8 also illustrates that during the early stages of fire development (3–6 h), the FRP reached values as high as 15–20 MW in both fire events, despite having a lower burn rate - highlighting the effect the unmanaged pine forest in producing higher fireline intensities. While the pine forests, both managed and unmanaged, have slowly burned out over a period of 18 h in Cool/Moist, in Hot/Dry it took little over 6 h to burn through it entirely.
Burned categories as a percentage of the total burnt area every 3 h, mean 3 h fire Growth Rate (ha h-1), and spatially integrated, mean 3 h Fire Radiative Power (FRP) for all burning points of the active fireline. Each 24- h block of Burned Categories represents a scenario per event, designated as: B, Base; 1–4, Scenarios 1–4.
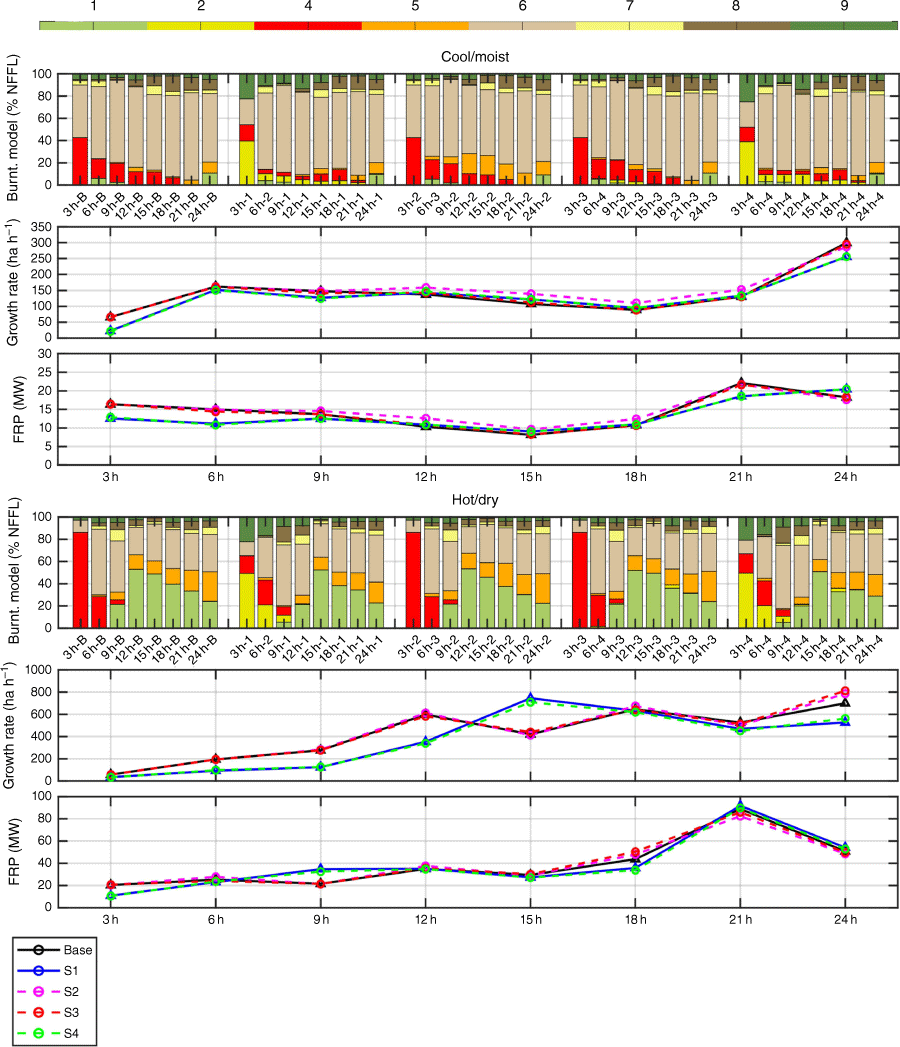
The employment of fuel models to simulate the management of the pine forest was shown to halve fire growth and FRP in both S1 and S4 during the first 9 h of Hot/Dry. In Cool/Moist, S1 and Base scenarios, agricultural/pasture areas hindered fire spread due to the high fuel moisture content, whereas in Hot/Dry, agricultural areas behaved as a proxy to increase fire burning rates, due to its high burnup speed in the fuel model parametrisation, despite producing maintaining its FRP. Fire burn rates peak after 12–15 h in Hot/Dry, after which young/unmanaged oaks (fuel model 5) and Mediterranean shrublands (fuel model 7) begin to burn, resulting in an increase in FRP as the proportion of burned agricultural/pasture areas decreased.
Across all events and scenarios, especially in Cool/Moist, the most prevalent burning land cover category is the Mediterranean shrublands surrounding and contained within ILMA, as shown in Fig. 8.
Fireline time of arrival
Land management differences between the scenarios produced notable differences in how fire progressed through the ILMA. These differences are shown in the form of time of arrival (ToA) of the fireline in Fig. 9, between the Base scenario and scenarios S1 to S4. A negative ToA (in red) represents the locations where the fire arrived earlier, and a positive ToA (in blue) where the fire arrived later.
Fireline time of arrival differences (in minutes) between Base scenario and scenarios 1–4 with negative values meaning the fireline arrived later at a designated point, and the opposite of that marked in red. S1 through S4 represent the differences between the Base scenario and scenarios 1–4. Dashed squares represent areas of focus in: Cool/Moist S1 – area C; Cool/Moist S3– area B; Hot/Dry S2 – area A; Hot/Dry S3 – Area A. Arrows in Cool/Moist S4 show the fire progression direction, and arrows in Hot/Dry S3 and S4 indicate the progression direction after the wind turns from N/NE into E/SE. The red star represents the ignition point.
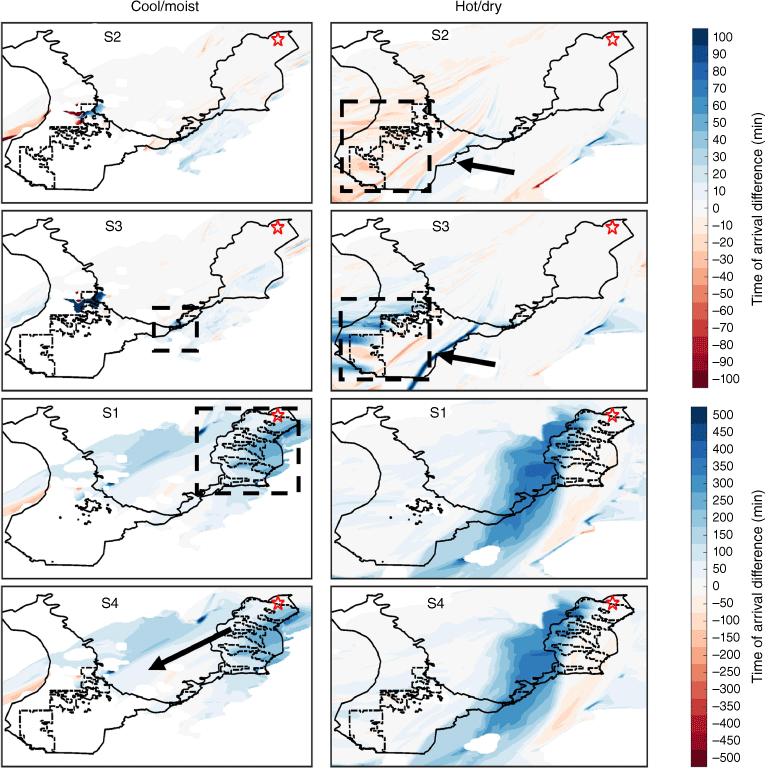
In Cool/Moist and Hot/Dry events, S1 and S4, managed pine cover has increased ToA both within and downstream of the wind direction in the ILMA, slowing fireline progression by up to 400 min (Fig. 9). Managed pines has also shown to have a reducing effect under high wind speed in Cool/Moist, with increases in ToA being generally less than 250 min. The arrow in Fig. 9 Cool/Moist S4 shows the general path of the head of the fire, surrounded by an area of near zero ToA, despite changes in cover. This highlights that head fire spread is less affected by fuel model changes and more influenced by wind, with changes being noticeable mostly on the flanks of the fire perimeter. Negative ToA is also observed to the south of the managed pine region (Fig. 9, S1 and S4 – area C). This occurs due to the effect of wind rotation on a slower moving fireline. Whereas it would initially spread further SW, due to the retarding effect the management of pine had on fire progression, the fireline acquires a more SSW direction of spread instead of the SW as it would have been initially observed in the Base scenario. This difference is otherwise shown in Fig. 7 between Base and S2 as the fire head tips further south, even at a lower speed.
The changes in ToA in area A are displayed in S2 and S3 for Hot/Dry event. In S2, the introduction of young oaks has increased fire spread rate both within the changed perimeter and downstream of the general spread direction (west to east), translating into an earlier ToA of the fireline by up to 40 min. In contrast to S2, the young, mature and open canopy oaks have generally increased the ToA, reducing spread within and downstream in S3.
In Hot/Dry, Fig. 9 S3, a negative ToA elongated strip on the eastern edge of the ILMA is shown along the general fire spread direction (NE-SW), marked by an arrow. These ToA differences are related to the location of the fire’s flank as the wind shifts from NE–SW to E–W and cannot be related directly to any change in landscape cover as they show no connection to B, and are solely due to changes in atmospheric dynamics, which is outside of the scope of this work. In Fig. 9, Cool/Moist S3, the introduction of oaks has increased ToA SW of B (dashed square), but due to its size (in comparison with the remaining ILMA) these are mostly negligible in influence.
Fireline intensity
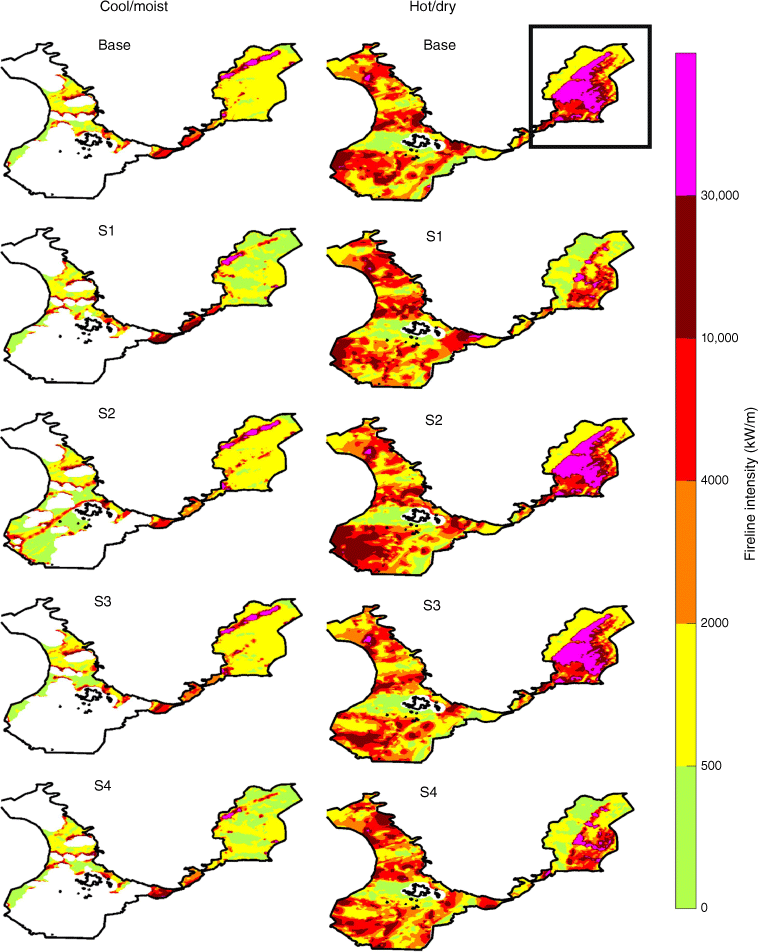
Within the ILMA, Hot/Dry is on average more intense than Cool/Moist (Fig. 10), namely the NE portion, area C (Fig. 10, outlined in a black square), with extreme values of fireline intensity (>30,000 kW m−1). Managed pine in Cool/Moist decreased fireline intensities along the fire spread direction and on the flanks of the fire. Between both fire events, the main differences lie in area C, a broader area of very high fireline intensities in Hot/Dry in comparison to Cool/Moist. In Hot/Dry, S2 has the highest overall intensity of all scenarios, showing a larger area with fireline intensity between 10,000 kW m−1 and 30,000 kW m−1, within A.
Suppression capability
Fig. 11 shows the capacity of control classes (CC) analysis from fireline intensity for both events, and its representativeness on the 24-h burned area. During Cool/Moist, fires above suppression capacity (>10,000 kW m−1) account for approximately 10% of the total fire area, with little changes to this threshold in any of the scenarios. The largest changes are seen in the lower end of the CC. The replacement of the base cover in A with young oaks cannot be used to assess any changes as it has only been burned in S2. However, the effect of the mix between open mature oak and closed mature oak in B, replacing the Mediterranean shrubland, not only slowed down flank fire spread, but also helped reduce fireline intensity as seen in the shift of percentage between Extremely Difficult CC into Very Difficult CC, when comparing in S3. Management of the pine forest in C had the greatest impact in increasing CC and reducing fireline intensity in S1 and S4, as the Fairly Easy and Moderately Difficult to control fires increased from 50% of the total area, in the Base up to 55–70%, in S1 and S4, most of which have become Fairly Easy to control. The sharpest reduction is seen in the Extremely Difficult to control areas from 25–35% in Base and S3, to 10%, in S1, S4.
Capacity of Control thresholds to evaluate suppression difficulty, defined by Fireline intensity as follows: Fairly Easy <500 kW m−1; Moderately Difficult, 500–2000 kW m−1; Very Difficult, 2000–4000 kW m−1; Extremely Difficult, 4000–10,000 kW m−1; Impossible >10,000 kW m−1.
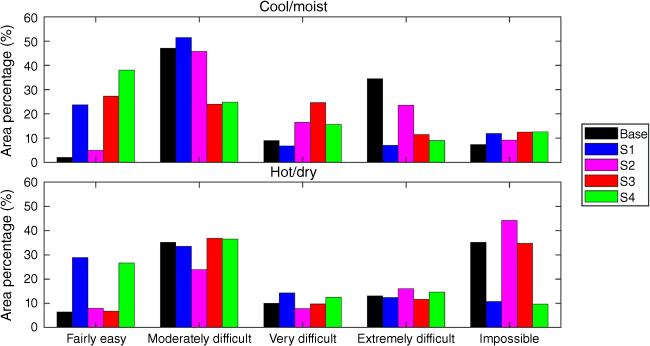
In Hot/Dry, Fairly Easy to control fires had a three-fold increase after fuel treatments in C (S1 and S4), and fires above suppression threshold decreased from 35–45% of the fire area to 10% in S1, S4. Replacing Base cover with young oaks, in S2 - A, decreased the amount of Fairly Easy to Moderately Difficult CC fires by about 10% when compared to both the Base and S2, increasing the total area within the Impossible to control threshold by 10% as a result.
Discussion
Observations of fire spread and intensity
Simulations showed that employing fuel management strategies have reduced fire spread rates in maritime pine forested areas, especially when under a low wind speed regime in Hot/Dry. Fireline intensity patterns in C also show a sharp reduction in managed scenarios S1, S3, S4, when compared to Base and S2. Under a higher wind speed, the reducing effect was less pronounced in Cool/Moist, and was consistent with field observations from prescribed burns for both events (Fernandes et al. 2004). Management of the pine forest was the greatest contributor to both fire spread and intensity within the ILMA, effectively reducing fires above the suppression threshold of by up to three times, under very dry fuel conditions in association with low wind speeds.
Results suggest that agricultural/pasture areas could be used as fuel breaks in fires dominated by high winds but moderate humidity levels, and have in fact been used to assist in fire management operations (Ascoli et al. 2018; Bertomeu et al. 2022). The same authors (Bertomeu et al. 2022) have also shown that agricultural areas have proven to produce faster spreading fires due to its low compacted fuel structure, despite producing very lower fire intensities, as is the case in the ILMA.
Assessing model behaviour and initial assumptions
The FFMC component stands out as a more accurate representation of fuel moisture when considering the various fuels incorporated in the Rothermel fire spread model, which is employed by WRF-SFIRE.
However, if we convert the FFMC values from Table 1 into fuel moistures, as shown by Van Wagner (Van Wagner and Pickett 1985), we obtain fuel moisture contents between 8.5% and 8.6% for Cool/Moist, and 6.2% and 7.4% for Hot/Dry. Whereas values from Hot/Dry fall in line (~+1%) with those expected from the FFMC, Cool/Moist shows an overprediction of nearly +5% fuel moisture in comparison with Van Wagner’s method. WRF-SFIRE built in fuel moisture model (Mandel et al. 2014) uses Van Wagner’s FFMC formulation (Van Wagner 1987) based on equilibrium moisture, albeit at every model timestep. Differences in formulating how fine fuel moisture evolves have been shown to produce significant differences in fire spread predictions (Anderson 2009), which may have been a source of error when determining fuel moisture at the ignition time in the simulations.
Nonetheless, higher values of fuel moisture in Cool/Moist associated with higher wind speeds had a delaying effect on flank fire spread, resulting in the observed ‘cigar shaped’ fires (Anderson 1983; Alexander and Lanoville 1989; Clark et al. 2004) as shown in Fig. 7 while also limiting fireline intensity.
Conclusions
This study aimed to investigate different land management scenarios under future climate projections, in terms of their resilience to fire events. For that, four different land management scenarios, with distinct fuel loads and characteristics, were investigated under two different fire episodes with the atmosphere–fire spread coupled model WRF-SFIRE.
Among all scenarios, managing the maritime pine has been shown to provide the highest decreases in fire spread rate and intensity. Introducing young oaks in detriment of agricultural/pasture landcovers promoted higher spread rates and fireline intensity, with mature and open canopy oaks providing the best results in comparison with the Base scenario. The combination of managing the maritime pine forest with the addition of mature and open canopy oak provided the best outcome among all scenarios, with marginal benefits when compared to managing the maritime pine.
The restrictions from extinction fuel moisture in the NFFL fuel models, namely model 1 associated with agriculture and pasture, was shown to impair fire progression under a higher fuel moisture scenario. Disparities in fine fuel moisture values obtained between FFMC and SFIRE’s moisture model have shown the need to refine the selection process in selecting extreme fire events for future studies.
This study showed that forest management can have an important role in building up resistance to wildfire spread and forest resilience, especially in southern Europe where climate change is expected to increase future fire danger. Simulation tools that incorporate real time atmosphere–fire dynamics - such as WRF-SFIRE - will provide an important tool to not only assess fire danger, but also to further study the impact of climate change on forest fires.
Data availability
The datasets generated during and/or analysed during the current study are available from the corresponding author on request.
Conflicts of interest
Paulo Fernandes is an Associate Editor of the International Journal of Wildland Fire. To mitigate the potential conflict of interest he didn’t have any editor-level access for this paper during peer review. Authors do not have any other conflicts of interest to declare.
Declaration of funding
This work was funded by EEAGrants (2014–2021) under the Programme ‘Environment, Climate Change and Low Carbon Economy’, through the funding of Project FoRES – Development of Forests RESilience to fires in a climate change scenario (04_CALL#5_FoRES).
Acknowledgements
This work was supported by EEAGrants (2014–2021) under the Programme ‘Environment, Climate Change and Low Carbon Economy’, through the funding of Project FoRES – Development of Forests RESilience to fires in a climate change scenario (04_CALL#5_FoRES). The authors also acknowledge financial support to Centre for Environmental and Marine Studies (CESAM) by FCT/MCTES (UIDP/50017/2020+UIDB/50017/2020+ LA/P/0094/2020), through national funds; financial support to CITAB by National Funds from FCT – Portuguese Foundation for Science and Technology, under the project UIDB/04033/2020 (https://doi.org/10.54499/UIDB/04033/2020); and ‘Missão Interface’, co-funded by PRR – Plan for Recovery and Resilience (operation code 01/C05-i02/2022.P145).
Funding for this work was also provided by the FCT—Fundação para a Ciência e a Tecnologia (Portuguese Foundation for Science and Technology) within the project ClimACT with the reference 2022.01896.PTDC and DOI 10.54499/2022.01896.PTDC (https://doi.org/10.54499/2022.01896.PTDC).
References
Abatzoglou JT, Williams AP (2016) Impact of anthropogenic climate change on wildfire across western US forests. Proceedings of the National Academy of Sciences of the United States of America 113(42), 11770-11775.
| Crossref | Google Scholar | PubMed |
Alcasena FJ, Salis M, Ager AA, Arca B, Molina D, Spano D (2015) Assessing landscape scale wildfire exposure for highly valued resources in a Mediterranean area. Environmental Management 55(5), 1200-1216.
| Crossref | Google Scholar | PubMed |
Alexander M (1985) Estimating the length-to-breadth ratio of elliptical forest fire patterns. In ‘Proceedings of the Eighth Conference on Fire and Forest Meteorology’. (Eds LR Donoghue and RE Martin) pp. 287–304. (April 29-May 2, 1985, Detroit, Michigan). Society of American Foresters, Bethesda, Maryland. SAF Publication 85-04.
Alexander ME, Lanoville RA (1989) Predicting fire behavior in the black spruce-lichen woodland fuel type of western and northern Canada. (For. Can., North. For. Cent., Edmonton, Alberta, and Gov. Northwest Territ., Dep. Renewable Resour., Territ. For. Fire Cent., Fort Smith, Northwest Territories. Poster (with text))
Amidror I (2002) Scattered data interpolation methods for electronic imaging systems: a survey. Journal of Electronic Imaging 11(2), 157-176.
| Crossref | Google Scholar |
Anderson K (2009) 3A. 4 A COMPARISON OF HOURLY FINE FUEL MOISTURE CODE CALCULATIONS WITHIN CANADA. Available at https://www.semanticscholar.org/paper/A-COMPARISON-OF-HOURLY-FINE-FUEL-MOISTURE-CODE-Anderson/4453525a4605f3b36558ef2e60a330efb9e7b108
Aparício BA, Santos JA, Freitas TR, Sá ACL, Pereira JMC, Fernandes PM (2022) Unravelling the effect of climate change on fire danger and fire behaviour in the Transboundary Biosphere Reserve of Meseta Ibérica (Portugal-Spain). Climatic Change 173(1), 1-20.
| Crossref | Google Scholar |
Bakhshaii A, Johnson EA (2019) A review of a new generation of wildfire–atmosphere modeling. Canadian Journal of Forest Research 49(6), 565-574.
| Crossref | Google Scholar |
Bedia J, Herrera S, Gutiérrez JM, Benali A, Brands S, Mota B, Moreno JM (2015) Global patterns in the sensitivity of burned area to fire-weather: implications for climate change. Agricultural and Forest Meteorology 214–215, 369-379.
| Crossref | Google Scholar |
Bedia J, Golding N, Casanueva A, Iturbide M, Buontempo C, Gutiérrez JM (2018) Seasonal predictions of Fire Weather Index: paving the way for their operational applicability in Mediterranean Europe. Climate Services 9, 101-110.
| Crossref | Google Scholar |
Bertomeu M, Pineda J, Pulido F (2022) Managing wildfire risk in mosaic landscapes: a case study of the Upper Gata River Catchment in Sierra de Gata, Spain. Land 11, 465.
| Crossref | Google Scholar |
Büttner G, Pataki R, Maucha G, Kosztra B, Kleeschulte S, Vittek M, Hazeu G, Schröder C, Littkopf A (2021) ‘CORINE land cover product user manual.’ (European Environment Agency (EEA)). Available at https://land.copernicus.eu/user-corner/technical-library/clc-product-user-manual
Carvalho D, Rafael S, Monteiro A, Rodrigues V, Lopes M, Rocha A (2022) How well have CMIP3, CMIP5 and CMIP6 future climate projections portrayed the recently observed warming. Scientific Reports 12, 11983.
| Crossref | Google Scholar | PubMed |
Clark TL, Coen J, Latham D (2004) Description of a coupled atmosphere–fire model. International Journal of Wildland Fire 13(1), 49-63.
| Crossref | Google Scholar |
EU-DEM v1.1 User Guide (2019) Copernicus. Retrieved from https://land.copernicus.eu/user-corner/technical-library/eu-dem-v1-1-user-guide/view
Eyring V, Bony S, Meehl GA, Senior CA, Stevens B, Stouffer RJ, Taylor KE (2016) Overview of the Coupled Model Intercomparison Project Phase 6 (CMIP6) experimental design and organization. Geoscientific Model Development 9(5), 1937-1958.
| Crossref | Google Scholar |
Fernandes PM (2013) Fire-smart management of forest landscapes in the Mediterranean basin under global change. Landscape and Urban Planning 110, 175-182.
| Crossref | Google Scholar |
Fernandes PAM, Loureiro CA, Botelho HS (2004) Fire behaviour and severity in a maritime pine stand under differing fuel conditions. Annals of Forest Science 61(6), 537-544.
| Crossref | Google Scholar |
Filippi J-B, Pialat X, Clements CB (2013) Assessment of ForeFire/Meso-NH for wildland fire/atmosphere coupled simulation of the FireFlux experiment. Proceedings of the Combustion Institute 34(2), 2633-2640.
| Crossref | Google Scholar |
Finney MA (1995) FARSITE: A fire area simulator for fire managers. In ‘The Biswell Symposium: Fire issues and solutions in urban interface and wildland ecosystems’. (Eds DR Weise, RE Martin (tech. coords.)). 15–17 February 1994, Walnut Creek, California. General Technical Report PSW-GTR-158. pp. 55–56. (U.S. Department of Agriculture, Forest Service, Pacific Southwest Research Station: Albany, CA)
Finney MA (2002) Fire growth using minimum travel time methods. Canadian Journal of Forest Research 32(8), 1420-1424.
| Crossref | Google Scholar |
Finney MA (2006) An overview of FlamMap fire modeling capabilities. In ‘Fuels management—how to measure success: conference proceedings’, 28–30 March 2006, Portland, Oregon. Proceedings RMRS-P-41. (Eds PL Andrew, BW Butler) pp. 213–220. (U.S. Department of Agriculture, Forest Service, Rocky Mountain Research Station: Fort Collins, CO)
Fire danger forecast (n.d.) EFFIS. Available at https://effis.jrc.ec.europa.eu/about-effis/technical-background/fire-danger-forecast
Galizia LF, Barbero R, Rodrigues M, Ruffault J, Pimont F, Curt T (2023) Global warming reshapes European pyroregions. Earth’s Future 11(5), e2022EF003182.
| Crossref | Google Scholar |
Giannaros TM, Lagouvardos K, Kotroni V (2020) Performance Evaluation of an Operational Rapid Response Fire Spread Forecasting System in the Southeast Mediterranean (Greece). Atmosphere 11(11), 1264.
| Crossref | Google Scholar |
Giannaros TM, Papavasileiou G, Lagouvardos K, Kotroni V, Dafis S, Karagiannidis A, Dragozi E (2022) Meteorological Analysis of the 2021 Extreme wildfires in Greece: lessons learned and implications for early warning of the potential for pyroconvection. Atmosphere 13(3), 475.
| Crossref | Google Scholar |
Good P, Moriondo M, Giannakopoulos C, Bindi M (2008) The meteorological conditions associated with extreme fire risk in Italy and Greece: relevance to climate model studies. International Journal of Wildland Fire 17(2), 155-165.
| Crossref | Google Scholar |
Hong SY, Lim JOJ (2006) The WRF single–moment 6–class microphysics scheme (WSM6). Asia-pacific Journal of Atmospheric Sciences 42, 129-151.
| Google Scholar |
Hong S-Y, Noh Y, Dudhia J (2006) A New Vertical Diffusion Package with an Explicit Treatment of Entrainment Processes. Monthly Weather Review 134(9), 2318-2341.
| Crossref | Google Scholar |
Iacono MJ, Delamere JS, Mlawer EJ, Shephard MW, Clough SA, Collins WD (2008) Radiative forcing by long-lived greenhouse gases: calculations with the AER radiative transfer models. Journal of Geophysical Research 113(D13), D13103.
| Crossref | Google Scholar |
IPCC (2022) Climate Change 2022: Impacts, Adaptation and Vulnerability. In ‘Contribution of Working Group II to the Sixth Assessment Report of the Intergovernmental Panel on Climate Change’. (Eds H-O Pörtner, DC Roberts, M Tignor, ES Poloczanska, K Mintenbeck, A Alegría, M Craig, S Langsdorf, S Löschke, V Möller, A Okem, B Rama). 3056 pp. (Cambridge University Press: Cambridge, UK and New York, NY, USA) 10.1017/9781009325844
IPMA (2023) Rural Fire Danger – Fire Weather Index [FWI]. Available at (Portuguese) https://www.ipma.pt/en/enciclopedia/otempo/risco.incendio/index.jsp?page=pirfwi.xml
Jahdi R, Del Giudice L, Melis M, Lovreglio R, Salis M, Arca B, Duce P (2023) Assessing the effects of alternative fuel treatments to reduce wildfire exposure. Journal of Forestry Research 34(2), 373-386.
| Crossref | Google Scholar |
Jiménez PA, Dudhia J, González-Rouco JF, Navarro J, Montávez JP, García-Bustamante E (2012) A revised scheme for the WRF surface layer formulation. Monthly Weather Review 140(3), 898-918.
| Crossref | Google Scholar |
Kottek M, Grieser J, Beck C, Rudolf B, Rubel F (2006) World Map of the Köppen?Geiger climate 497 classification updated. Meteorologische Zeitschrift 15, 259-263.
| Crossref | Google Scholar |
Lafore JP, Stein J, Asencio N, Bougeault P, Ducrocq V, Duron J, Fischer C, Héreil P, Mascart P, Masson V, Pinty JP, Redelsperger JL, Richard E, Vilà-Guerau de Arellano J (1998) The Meso-NH Atmospheric Simulation System. Part I: adiabatic formulation and control simulations. Annales Geophysicae 16, 90-109.
| Crossref | Google Scholar |
Lecina-Diaz J, Chas-Amil M-L, Aquilué N, Sil Â, Brotons L, Regos A, Touza J (2023) Incorporating fire-smartness into agricultural policies reduces suppression costs and ecosystem services damages from wildfires. Journal of Environmental Management 337, 117707.
| Crossref | Google Scholar | PubMed |
Mandel J, Beezley JD, Kochanski AK (2011) Coupled atmosphere-wildland fire modeling with WRF 3.3 and SFIRE Geoscientific 2011. Model Development 4(3), 591-610.
| Crossref | Google Scholar |
Mandel J, Amram S, Beezley JD, Kelman G, Kochanski AK, Kondratenko VY, Lynn BH, Regev B, Vejmelka M (2014) Recent advances and applications of WRF–SFIRE. Natural Hazards and Earth System Sciences 14(10), 2829-2845.
| Crossref | Google Scholar |
Mauritsen T, Bader J, Becker T, Behrens J, Bittner M, Brokopf R, et al. (2019) Developments in the MPI‐M Earth System Model version 1.2 (MPI‐ESM1.2) and its response to increasing CO2. Journal of Advances in Modeling Earth Systems 11, 998-1038.
| Crossref | Google Scholar | PubMed |
Moreira F, Viedma O, Arianoutsou M, Curt T, Koutsias N, Rigolot E, Barbati A, Corona P, Vaz P, Xanthopoulos G, Mouillot F, Bilgili E (2011) Landscape – wildfire interactions in southern Europe: Implications for landscape management. Journal of Environmental Management 92((10), 2389-2402.
| Crossref | Google Scholar | PubMed |
Narayanaraj G, Wimberly MC (2012) Influences of forest roads on the spatial patterns of human- and lightning-caused wildfire ignitions. Applied Geography 32(2), 878-888.
| Crossref | Google Scholar |
Navalho I, Alegria C, Quinta-Nova L, Fernandez P (2017) Integrated planning for landscape diversity enhancement, fire hazard mitigation and forest production regulation: a case study in central Portugal. Land Use Policy 61, 398-412.
| Crossref | Google Scholar |
Phillips SJ, Dudík M, Schapire RE (2017) A Brief Tutorial on Maxent. Available at http://biodiversityinformatics.amnh.org/open_source/maxent/. Accessed on 2024-10-29.
Pineda N, Jorba O, Jorge J, Baldasano JM (2004) Using NOAA AVHRR and SPOTVGT Data to Estimate Surface Parameters: Application to a Mesoscale Meteorological Model. International Journal of Remote Sensing 25, 129-143.
| Crossref | Google Scholar |
Regos A, Pais S, Campos JC, Lecina-Diaz J (2023) Nature-based solutions to wildfires in rural landscapes of Southern Europe: let’s be fire-smart! International Journal of Wildland Fire 32(6), 942-950.
| Crossref | Google Scholar |
Ricotta C, Bajocco S, Guglietta D, Conedera M (2018) Assessing the influence of roads on fire ignition: does land cover matter? Fire 1(2), 24.
| Crossref | Google Scholar |
Rothermel RC (1972) ‘A Mathematical Model for Predicting Fire Spread in Wildland Fuels, vol. 115.’ (Intermountain Forest Range Experiment Station, Forest Service, US Department of Agriculture, Ogden) Available at https://research.fs.usda.gov/treesearch/32533
Sá ACL, Aparicio B, Benali A, Bruni C, Salis M, Silva F, Marta-Almeida M, Pereira S, Rocha A, Pereira J (2022) Coupling wildfire spread simulations and connectivity analysis for hazard assessment: a case study in Serra da Cabreira, Portugal. Natural Hazards and Earth System Sciences 22(12), 3917-3938.
| Crossref | Google Scholar |
Schultz CJ, Nauslar NJ, Wachter JB, Hain CR, Bell JR (2019) Spatial, temporal and electrical characteristics of lightning in reported lightning-initiated wildfire events. Fire 2(2), 18.
| Crossref | Google Scholar | PubMed |
Senande-Rivera M, Insua-Costa D, Miguez-Macho G (2022) Towards an atmosphere more favourable to firestorm development in Europe. Environmental Research Letters 17(9), 094015.
| Crossref | Google Scholar |
Sirca C, Salis M, Arca B, Duce P, Spano D (2018) Assessing the performance of fire danger indexes in a Mediterranean area. iForest-Biogeosciences and Forestry 11(5), 563-571.
| Crossref | Google Scholar |
Skamarock WC, Klemp JB, Dudhia J, Gill DO, Liu Z, Berner J, Wang W, Powers JG, Duda MG, Barker DM, Huang XY (2019). ‘A Description of the Advanced Research WRF Model Version 4.’ (UCAR/NCAR) 10.5065/1DFH-6P97
Taylor MH, Rollins K, Kobayashi M, Tausch RJ (2013) The economics of fuel management: wildfire, invasive plants, and the dynamics of sagebrush rangelands in the western United States. Journal of Environmental Management 126, 157-173.
| Crossref | Google Scholar | PubMed |
Tedim F, Leone V, Amraoui M, Bouillon C, Coughlan M, Delogu G, Fernandes P, Ferreira C, McCaffrey S, McGee T, Parente J, Paton D, Pereira M, Ribeiro L, Viegas D, Xanthopoulos G (2018) Defining extreme wildfire events: difficulties, challenges, and impacts. Fire 1(1), 9.
| Crossref | Google Scholar |
Tewari M, Chen F, Wang W, Dudhia J, LeMone K, Mitchell MA, Ek M, Gayno G, Wegiel J, Cuenca RH (2004) Implementation and verification of the unified NOAH land surface model in the WRF model. In ‘20th Conference on weather analysis and forecasting/16th Conference on numerical weather prediction'. 11–15.’. Available at https://www.researchgate.net/publication/286272692_Implementation_and_verification_of_the_united_NOAH_land_surface_model_in_the_WRF_model
Thompson M, Anderson N (2015) Modeling fuel treatment impacts on fire suppression cost savings: a review. California Agriculture 69(3), 164-170.
| Crossref | Google Scholar |
Thompson MP, Vaillant NM, Haas JR, Gebert KM, Stockmann KD (2013) Quantifying the potential impacts of fuel freatments on wildfire suppression costs. Journal of Forestry 111(1), 49-58.
| Crossref | Google Scholar |
Vacek Z, Vacek S, Cukor J (2023) European forests under global climate change: review of tree growth processes, crises and management strategies. Journal of Environmental Management 332, 117353.
| Crossref | Google Scholar | PubMed |
Van Wagner CE (1977) Conditions for the start and spread of crown fire. Canadian Journal of Forest Research 7, 23-34.
| Crossref | Google Scholar |
Van Wagner CE (1987) Development and structure of the Canadian forest fire weather index system. Vol. 35. Available at https://ostrnrcan-dostrncan.canada.ca/handle/1845/228434
Viegas DX, Bovio G, Ferreira A, Nosenzo A, Sol B (1999) Comparative study of various methods of fire danger evaluation in southern Europe. International Journal of Wildland Fire 9(4), 235-246.
| Crossref | Google Scholar |
Appendix
Daily cycle of fuel moisture, at a 15 min interval, for areas A + B, and C. Young Oak are the predominant species of cover after change in S2, zones A+B. Miscellaneous oaks are different maturity oak trees present in S3 and 4, in areas A + B. Managed pine corresponds to the changes of cover in area C due to fuel management of the pine forest. Below: Temperature (T) and relative humidity (RH) are shown for Cool/Moist, left panel, and Hot/Dry, right panel. Dashed red and blue lines correspond to 6-day trends of temperature and relative humidity, respectively, spanning the ignition day and 5 days prior. Day and nighttime are represented in shaded in light yellow and blue.
