
Merging weather radar and rain gauges for dryland agriculture
Peter Weir A B * and Peter Dahlhaus A B
A
B
Abstract
The areal extent of rainfall remains one of the most challenging meteorological variables to model accurately due to its high spatial and temporal variability. Weather radar is a remote sensing instrument that is increasingly used to estimate rainfall by providing unique observations of precipitation events at fine spatial and temporal resolutions, which are difficult to obtain using conventional rain gauge networks. Dense rain gauge networks combined with operational weather radars are widely considered as the most reliable source of rainfall depth estimates. This paper compares the various sources of rainfall data available and explores the benefits of merging radar data with rain gauge data by reviewing the outcomes of a case study of a major agricultural cropping and pasture region. Comparison is made of rainfall measurements obtained from a dense rain gauge network covered by the output from a weather radar installation. We conclude that merging radar data with rain gauge data provides improved resolution of the spatial variability of rainfall, resulting in a significantly improved data source for agricultural water management and hydrological modelling. However, the use of weather radar merged with rain gauge data is generally underrated as a management tool.
Keywords: gridded precipitation, precipitation, radar, radar-rain gauge merging, rain gauges, rainfall, spatial interpolation, weather radar.
1.Introduction
In dryland (rain-fed) agriculture the amount of water available to grow a crop is determined primarily by the in-season rainfall and the amount of water stored in the soil profile prior to seeding of the crop. Knowledge of the amount of rainfall and its spatial distribution are fundamental for the management decisions being made using precision agriculture for the growing of crops and pastures. The high variability of rainfall over area and time makes single-point observations of limited use by themselves. Point measurements of rainfall can be measured more accurately by a network of rain gauges, but there is limited representation of the spatial variability as it is difficult to interpolate reliably from observations of surrounding rain gauges due to their sparse spatial distribution (Nashwan et al. 2018). Hydrological modelling requires accurate rainfall estimates at high spatial resolution. A solution to this problem has been the development of a wide range of gauge-based gridded datasets for both global and regional sites to provide spatiotemporal coverage of rainfall in ungauged or sparsely gauged areas (Hofstra et al. 2008; King et al. 2013). These datasets use surface weather stations to generate gridded rainfall estimates, using various interpolation techniques.
Since the 1970s, when weather radars began common operational use, there has been intense research interest in the merging of weather radar and rain gauge observations (Anagnostou and Krajewski 1999; Seed et al. 2008; Goudenhoofdt and Delobbe 2009; Velasco-Forero et al. 2009; Berndt et al. 2014; Nanding and Rico-Ramirez 2019). A weather radar installation can be considered as a remote sensing instrument measuring the reflectivity of rainfall at a specific altitude.
The purpose of this paper is to explore the use of weather-based radar merged with rain gauge network observations to estimate the amount of rainfall at ground level and provide a map of rainfall at high spatial and temporal resolution at the agricultural field scale. Owing to the availability of data, the radar installation at Rainbow, a locality in the Wimmera region of Victoria, Australia has been chosen as a case study. Additionally, private datasets from the Longerenong Agricultural College DATA Farm rain gauge network, within the coverage of the Rainbow weather radar, have been included in the analysis.
Australia’s climate is highly variable with increasing frequency of excessive rainfall events, which is exacerbated by the effects of climate change. Pepler et al. (2021) state that over recent decades, in parts of southern Australia, cool-season rainfall has declined, but during the warm half of the year there has been an increase in thunderstorm rainfall. These recent rainfall declines in southern Australia have been affected by changes in Southern Hemisphere circulation due to increased levels of atmospheric greenhouse gases (Rauniyar and Power 2020). The resulting deviations from the climatic averages mean that larger differences in rainfall depths now occur over small distances between the measuring weather station and the agricultural field of interest. Jayaweera et al. (2023) investigated the trends in extreme rainfall across Australia as a consequence of rainfall intensification due to a warming climate. These changes in climate present significant challenges for dryland (non-irrigated) extensive agricultural farming systems, especially considering that rainfall is the major input of water for these systems. The increase in unseasonal rainfall events due to climate change results in significant spatial and temporal variations of soil moisture from more ‘scattered showers’ (cf. rain) and intense localised thunderstorms.
2.Materials and methods
2.1. Case study area
The Wimmera region lies within western Victoria, Australia (Fig. 1), covering ~30,000 km2. The region is one of Australia’s most productive grain growing regions due to the soils and climate (Agriculture Victoria 2023; Wimmera Catchment Management Authority 2023). Parts of the region comprise Grey Vertosol soils, which are the principal cropping soils of western Victoria. The Red and Brown Vertosol soils are also used for cropping but are not as high yielding as the Grey Vertosol soils. Most of the landscape is generally either flat or undulating. The Wimmera has a semi-arid to sub-humid Mediterranean type climate with rainfall varying from 475 to 615 mm year–1 (Wimmera Catchment Management Authority 2024).
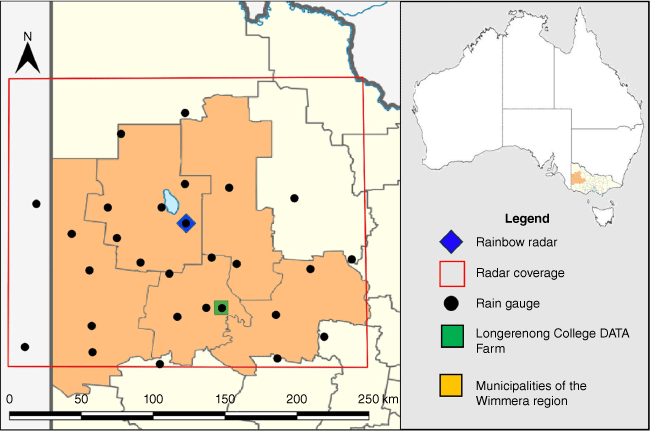
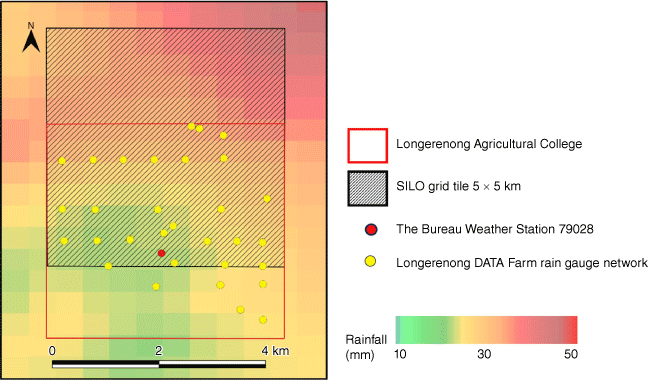
Location of the Australian Bureau of Meteorology Rainbow weather radar and the contributing rain gauge network (Table 1) within the coverage of the Rainbow weather radar in the state of Victoria, Australia.
2.2. Rainfall data
Within the case study region, rainfall data are generated by three basic methodologies: rain gauges, radar and satellite.
Rainfall data were obtained from the Australian Bureau of Meteorology (The Bureau) network of official rain gauge sites which meet the rain gauge standards set by the World Meteorological Organization (WMO) for the installation and maintenance of rain gauges. The Bureau has an extensive network of manual and automatic stations rain gauge stations around the country, especially in areas of significant population density. The value proposition of merging The Bureau weather radar data with The Bureau rain gauge network is to provide spatial detail in the gaps between The Bureau rain gauges and in areas where there are no rain gauges at all. The most common manual gauge has a 203-mm circular funnel that collects the rain into a graduated and calibrated cylinder. Automatic rain gauges (pluviometers) are of the tipping bucket type (0.2 mm of rainfall per tip), most recording at 1-min intervals with a counter recording the number of tips. Observations of daily rainfall are nominally made at 09:00 hours local time and recorded as the total for the previous 24 h. More frequent observations are also made at selected stations. The data were accessed from The Bureau website.1
Rain gauge data used in this study are collected from a subset of 26 Bureau official contributing gauges (as specified in the metadata of the radar dataset files) within the area covered by the weather radar installation near the township of Rainbow, in the Wimmera region (Fig. 1 and Table 1). The sparsity of the network is ~30–100 km between stations, which is a major limitation of the coverage provided in this region, highlighting the necessity for spatial interpolation in order to map rainfall at field scale.
| Station ID | Name | Latitude | Longitude | |
|---|---|---|---|---|
| 25564 | Shaugh | −35.8429 | 140.8184 | |
| 26099 | Naracoorte | −36.9813 | 140.7270 | |
| 76006 | Tutye | −35.2858 | 141.4935 | |
| 76064 | Walpeup | −35.1201 | 142.0040 | |
| 77010 | Hopetoun | −35.7151 | 142.3569 | |
| 77011 | Wagon Flat | −35.8726 | 141.3884 | |
| 77097 | Yaapeet | −35.6856 | 142.0031 | |
| 77098 | Rainbow Radar | −35.9974 | 142.0105 | |
| 77099 | Rainbow (Pigick Comparison) | −35.8715 | 141.8172 | |
| 77100 | Birchip (Marlbed Comparison) | −35.7980 | 142.8767 | |
| 78015 | Nhill | −36.3093 | 141.6486 | |
| 78018 | Warracknabeal | −36.3204 | 142.4161 | |
| 78030 | Telopea Downs | −36.0821 | 141.1003 | |
| 78032 | Gerang Gerung (Comparison) | −36.3982 | 141.8793 | |
| 78073 | Kaniva Comparison | −36.3721 | 141.2422 | |
| 78082 | Warracknabeal (Earlstan Comp.) | −36.2705 | 142.2162 | |
| 78087 | Yanac North Comparison | −36.1147 | 141.4612 | |
| 78088 | Donald Comparison | −36.3611 | 143.0038 | |
| 79028 | Longerenong | −36.6722 | 142.2991 | |
| 79097 | Kanagulk | −37.1169 | 141.8031 | |
| 79099 | Edenhope | −37.0222 | 141.2657 | |
| 79100 | Horsham | −36.6699 | 142.1733 | |
| 79102 | Marroo West (Warranooke) | −36.7259 | 142.7294 | |
| 79105 | Stawell | −37.0720 | 142.7402 | |
| 79109 | Patyah (Booroopki Comparison) | −36.8132 | 141.2599 | |
| 80128 | Charlton | −36.2846 | 143.3341 |
Gridded analysis of rainfall data is used by major meteorological organisations across the world with continental-scale daily climate surfaces derived by interpolating the observed point data. Australian modellers have historically used two publicly available archived products that both cover Australia on an ~5- × 5-km grid: Queensland Department of Science, Information Technology and Innovation SILO (Scientific Information for Land Owners) and the Australian Bureau of Meteorology Australian Gridded Climate Data (AGCD).
The SILO dataset is interpolated rainfall observed at Bureau gauging stations across Australia, based on smoothing splining and Kriging techniques described in Jeffrey et al. (2001). AGCD is a product developed by The Bureau and CSIRO as part of the Australian Water Availability Project. Similar to SILO, the AGCD dataset is interpolated rainfall observed at Bureau gauging stations across Australia, with the interpolation method using a two-step process (Beesley et al. 2009), interpolating anomalies of daily rainfall using Barnes’ successive correction method (Jones et al. 2009) that applies a weighted averaging process to the station data. On the maps, each grid point represents an approximately square area with sides of ~5 km (0.05°), as illustrated in Fig. 2. This grid point analysis technique provides an objective average rainfall for each grid square. However, in data-rich areas such as south-east Australia or in regions with strong gradients, this applied analysis results in grid point values that may differ slightly from the exact rainfall amount measured at the contributing stations, due to data smoothing effects.
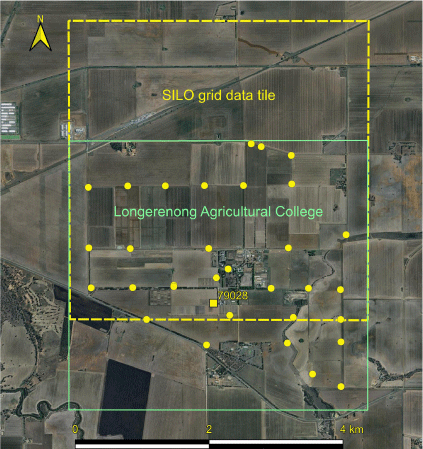
Longerenong DATA Farm rain gauge network (Map data Google Satellite, WMS, see https://mt0.google.com/vt/lyrs=s&x=x}&y=y}&z=z}, accessed 17 February 2024).
Fu et al. (2022) compared the SILO and AGCD, showing that both grids could produce significant differences in rainfall at the local scale. This is because the products use different interpolation algorithms and different gauging stations for compilation and interpolation. AGCD is limited to data obtained from ‘qualified’ stations in the Australian Data Archive for Meteorology (ADAM), whereas SILO also uses data from organisations such as local governments, mining companies, national parks and private properties.
Chappell et al. (2013) evaluated the Tropical Rainfall Measuring Mission (TRMM) Multisatellite Precipitation Analysis (TMPA-RT) near real-time product (3B42RT) which provided images (~5-km resolution) for estimating daily rainfall maps across Australia, assessing that blending the 3B42RT satellite and rain gauge data was not worthwhile. Chua et al. (2020) evaluated the US National Oceanographic and Atmospheric Administration’s (NOAA) Climate Prediction Center morphing technique (CMORPH) and the Japan Aerospace Exploration Agency’s (JAXA) Global Satellite Mapping of Precipitation (GSMaP) satellite precipitation estimates over Australia across an 18-year-period of 2001–2018. They concluded that a considerable amount of progress is needed to bring unblended datasets to a level comparable to that of rain gauges. Recently Hines et al. (2022) developed the tool Precipitation Profiler-Observation Fusion and Estimation (PPrOFusE), a method for fusing ground-based rain gauge data with multi-satellite platform precipitation data to deliver high-quality gauge and multi-satellite fused precipitation data for large-scale regional analysis, but recognised there are limitations with this proposed method which merit further work. While acknowledging the possibilities that the PPrOFusE tool offers, we chose to focus on the well-developed weather radar based Rainfields-3 datasets instead.
Located within the Rainbow weather radar footprint, 85 km south of the radar site, is a dense network of 30 automatic rain gauges, shown as yellow dots in Fig. 2 located within the Longerenong DATA Farm, Longerenong Agricultural College, comprising 1250 ha, located at latitude 36.6657°S and longitude 142.2999°E, represented by the green square in Fig. 1. These automatic tipping bucket rain gauges are connected using low range wide area network (LoRaWAN) protocols, uploading their data every 30 min. The spatial separation of the gauges is ~500 m on average.
The focal point for this case study is The Bureau weather station, ID 70928, Longerenong, located within the bounds of the Longerenong Agricultural College and within the Longerenong DATA Farm rain gauge network. In addition, the area is overlapped by a SILO 5- × 5-km grid data tile, with the corresponding AGCD grid data tile being coincident with the SILO grid data tile (Fig. 2).
2.3. Radar data
The radar data used in this study are sourced from the long-term archive of The Bureau operational radar network. The Rainfields 3 dataset (Seed et al. 2022) is used operationally in Australia for Quantitative Precipitation Estimate (QPE) applications where accurate estimates of rain rate are required from radar. The Rainfields 3 legacy datasets are accessible 48 h behind real time and are covered by open Creative Commons licence CC4-BY-NC.
Merged radar rainfall data are calculated using the radar reflectivity data from rain drops, which is an indirect instantaneous measurement of rainfall at a known height. The main steps to estimate rainfall from radar in real time follow: (1) measurement of radar reflectivity and removal of known sources of errors such as beam blockage, reflections and ground scattering of the radar beam; (2) Z–R conversion: the algorithm used to convert reflectivity (Z) to rainfall (R) rate, which can vary from location to location and between different precipitation types; and (3) merging with rain gauge network rainfall data to remove any field bias. Radar rainfall estimation is made for a 500- × 500-m pixel that is 1000 m above the radar, whereas the rain gauge observes the rainfall accumulation at a point on the ground. Surface rainfall maps are constructed by using a Kriging interpolation technique (Seed and Pegram 2001; Wesson and Pegram 2006) to interpolate the radar observations. The radar data have been blended with selected rainfall observations from The Bureau rain gauge network to account for any systematic biases, adding spatial detail between the rain gauges based on Kriging interpolation using a set of algorithms to estimate the rain rate at ground level from the radar reflectivity observations in the atmosphere.
The QPE merged radar rainfall is downloaded in the form of 15-min rain accumulation grids, from network Common Data Form (netCDF) libraries, with a horizontal grid spacing of 500 × 500 m. The metadata of these data files contain a list of The Bureau station identifiers of the contributing gauges (Table 1), used in the Kriging algorithms for that 15-min data collection. The mapping projection is Albers Conical Equal Area with all times and dates in Universal Coordinated Time (UTC). The 15-min data are appropriately summed to provide a reading of the total amount of rainfall measured in the 24-h period preceding 09:00 hours on the day of reading, converting to local time, and subsequently reprojecting the gridded data to EPSG:4283 – GDA94, a common geodetic coordinate system used in Australia. The data are then in a format that facilitates further analysis by comparison with other daily rainfall data collected other devices such as GPS located rain gauges.
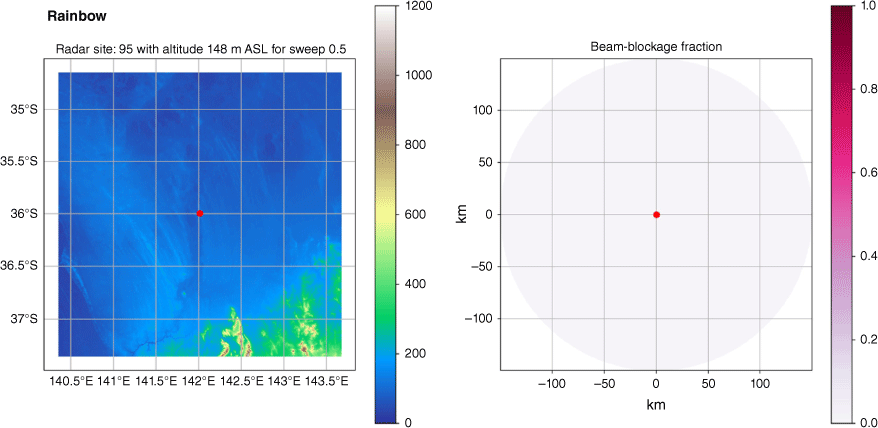
Most of the Wimmera region is covered by The Bureau’s weather radar located on private farmland near Rainbow, Victoria (latitude 35.9975°S, longitude 142.0133°E, altitude 148.225 m, height 27 m). The Rainbow weather radar is a Meteor 735CDP (high resolution C-Band, Doppler and Dual Polarisation enabled), and generates data (typically) 24 h day–1 centred in a 256- × 256-km grid with 500- × 500-m spatial resolution (Fig. 1).
Beam blockage is mostly due to topographic features, and the Rainbow radar is situated in a landscape of flat to gently undulating plains. The radar beam has good coverage extending up to 200 km with minimal impact of any obstructions and has a full 360° view (Fig. 3).
Beam blockage map for the Rainbow weather radar installation (8 December 2021, Australian Unified Radar Archive, see https://open-radar-beamblock-maps.s3-ap-southeast-2.amazonaws.com/95_0_CBB_map.png). ASL, above sea level.
2.4. Statistical methods
Regression analysis, a statistical method used to explain the strength of the relationship between a dependent variable and one or more independent variables, was used in this case study.
The independent variables are the rain gauge network daily observations (Gobs) and the dependent variables are the Rainfields 3 QPE merged radar rainfall daily observations (Robs) as they depend on the algorithmic processing of the selected contributing Bureau rain gauges and radar data.
To statistically analyse the comparison between the rain gauge network daily observations and merged radar rainfall daily observations, five standard metrics were used considering time series of Gobs and Robs, each with the same number n of time steps. The linear regression line describes the relationship between Gobs and Robs. The resulting linear equation is used to calculate predicted daily rainfall values (Rpre) for corresponding daily Gobs values.
The Pearson correlation coefficient (Corr ∈ [−1, 1]) estimates the strength and direction of the linear relationship between time series:
The Pearson correlation measures the strength of the linear relationship between two variables (a measure of linear correlation between two sets of daily rainfall data) and has values between −1 to 1: a value of −1 meaning a total negative linear correlation, 0 being no correlation and +1 meaning a total positive correlation. If the coefficient value lies between ±0.50 and ±1, then it is said to be a strong correlation. If the value lies between ±0.30 and ±0.49, then it is said to be a medium correlation. When the value lies below ±0.29, then it is said to be a weak correlation.
The coefficient of determination (R2) measures how well the least squares regression line fits (with range 0–1), 1 is best fit for a radar value predicted perfectly by the rain gauge observation.
Sum of squares of residuals, RSS:
Total sum of squares (TSS) is the sum of all squared differences between the mean of an observation and the individual values in that observation.
The R2 is the square of the correlation coefficient.
The root mean squared error (RMSE) measures the average difference between predicted and observed values:
The lower the RMSE value, the better the linear regression is. A zero value indicates that the predicted and observed values match precisely. Higher values indicate a poorer fit to the least squares regression line.
The Nash–Sutcliffe Efficiency (NSE ∈ (−∞, 1]) measures how well the outputs of a model reproduce observations against a model that uses only the average of the observed data:
The NSE ranges from −∞ to 1 (1 = perfect score, optimal value), with NSE = 0 representing a radar daily rainfall accuracy corresponding to the mean of the gauge daily rainfall. Values of 0.6–1.0 are generally viewed as acceptable levels of performance, whereas values <0.0 indicate that the mean observed value is a better predictor than the simulated value, which indicates unacceptable performance.
Lin’s concordance correlation coefficient (CCC) is the concordance between a new test or measurement (Y) and a gold standard test or measurement (X). This statistic quantifies the agreement between these two measures of the same variable, namely daily rainfall, with the rain gauge measurement (Gobs) represented by X, and the radar measurement estimation of rainfall (Robs) represented by Y. Values near +1 indicate strong concordance between Gobs and Robs, values near −1 indicate strong discordance and values near zero indicate no concordance (Lawrence and Lin 1989).
3.Results
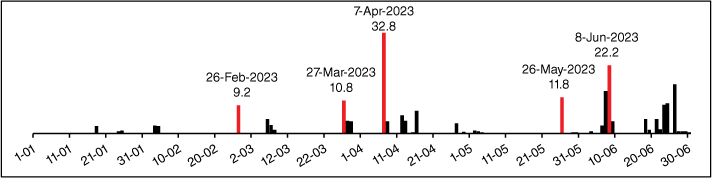
Five significant rainfall events observed at Longerenong on 26 February, 27 March, 7 April, 26 May and 8 June 2023 were chosen for this case study, providing a wide seasonal coverage of rainfall for this location (Fig. 4).
Daily rainfall observed at The Bureau station for Longerenong (ID 079028) for the time series January–June 2023.
There is a need to handle observed points that are far from the least squares regression line, termed outliers. Commonly an outlier is defined as any point located farther than two standard deviations above or below the best-fit line. The standard deviation (σ) of the residuals (or errors) is used and is calculated as follows:
All points for which the residual is greater than 2σ were removed and a new regression line was computed using the remaining points. The results that follow are from the linear regression analysis of these observations of rainfall data after the outliers have been removed.
3.1. Daily merged radar rainfall maps
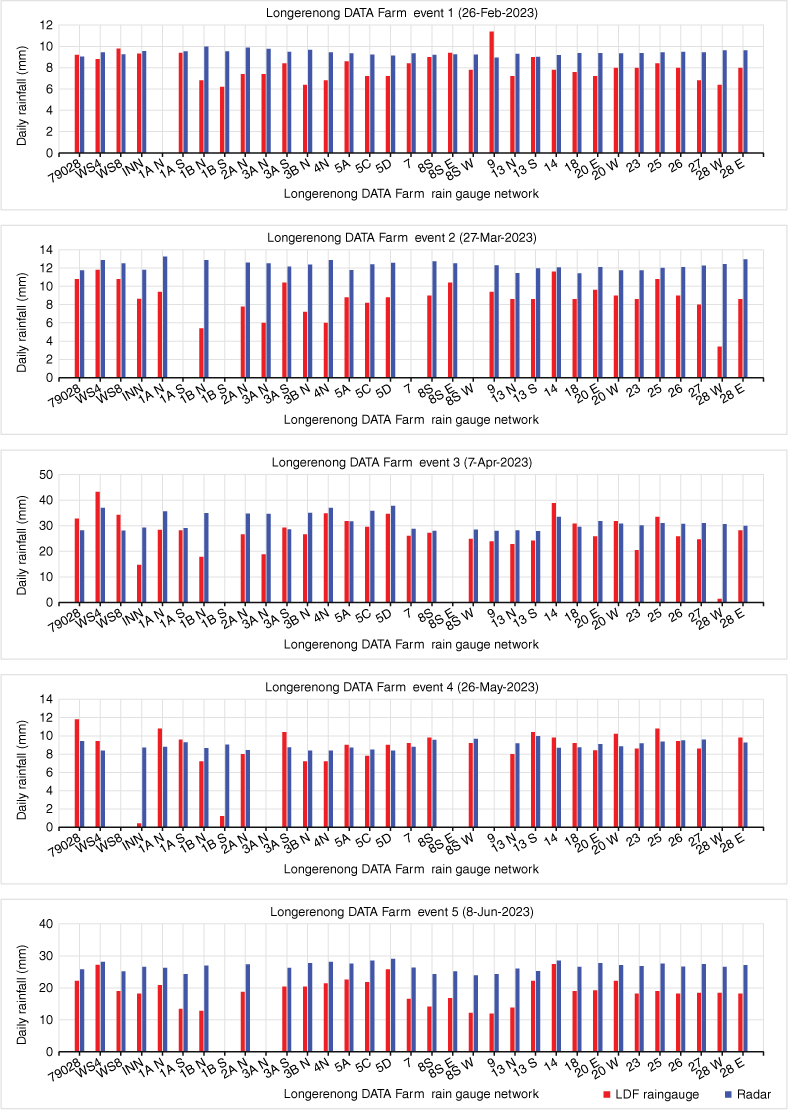
The daily merged radar rainfall maps and the locations of the chosen contributing Bureau rain gauges, detailed in the metadata of the 15-min Rainfields 3 QPE data files as listed in Table 1, are presented in Fig. 5.
Accumulated daily rainfall from the Rainbow QPE merged radar rainfall dataset for the five selected rainfall events.
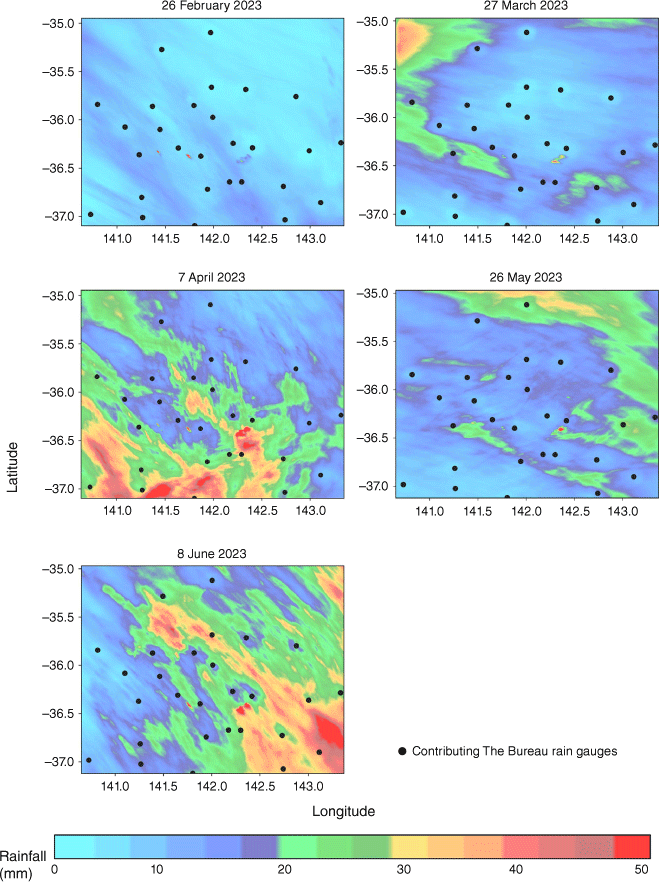
The halo effects displayed in the maps around some of these rain gauge sites chosen as Kriging points, are likely due to erroneous artifacts introduced by the Kriging interpolation algorithms implemented in the Rainfields 3 system, also referred to as the ‘bullseyes’ artefact (Chua et al. 2022), illustrated in Fig. 5 and 6.
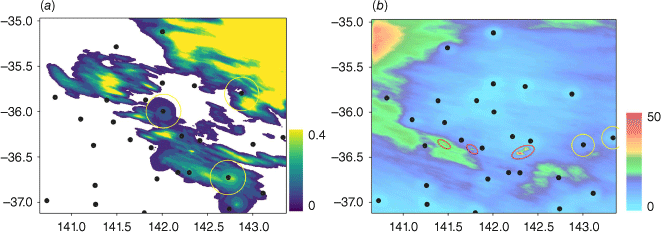
(a) Rainbow QPE merged radar rainfall 15-min data file, ‘95_20230327_034500.prcp-m15.nc’, one of the 96 15-min data files used to determine the quantities and the spatial distribution of the daily rainfall and (b) the accumulated rainfall for the 24 h preceding 09:00 hours on 27 March 2023. ‘Bullseye’ anomalies (yellow circles), located around the contributing Bureau gauges detailed in the metadata (Table 1), dot symbols on the map. Red ellipses in map (b) indicate the wind farm anomalies as displayed in Fig. 7.
3.2. Issues with radar data
One shortcoming evident in this case study of the Rainbow weather radar installation is the anomalies introduced by the presence of wind farms (Fig. 7). On many occasions, the wind turbine artefacts resulting from the interference of the reflected radar signal are not identified by the Rainfields 3 system and subsequently are not removed from the displayed output.
The red ellipses highlight wind farm anomalies interfering with Rainbow radar reflectivity on a rain-free day 6 February 2023. The wind farm locations are: (1) Diapur, two turbines; (2) Kiata, nine turbines; and (3) Murra Wurra, 99 turbines. This is a derivative of http://www.bom.gov.au/products/IDR953.loop.shtml, available under the Creative Commons Attribution Licence 3.0.
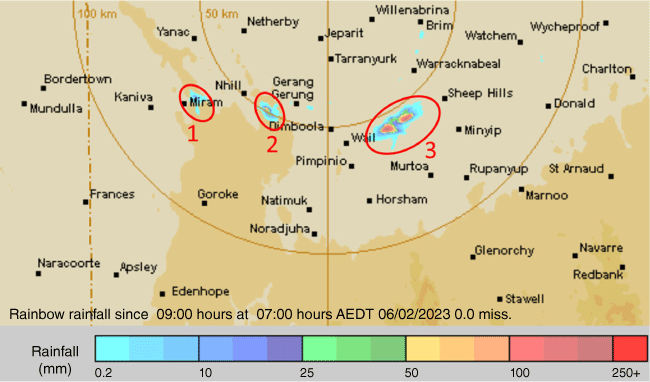
Norin (2015, 2017) discusses the effects of wind farms on the determination of rainfall by weather radar, suggesting that their impact is identifiable as a distinct and highly repeatable signature which can be used to identify and filter out the anomaly caused by the wind turbines. There is a need to be able to classify the anomalous propagation that is caused by wind farms and correctly map the true rainfall pixels quickly and easily.
3.3. Comparison of daily rainfall – Bureau rain gauge network with radar merged rainfall maps
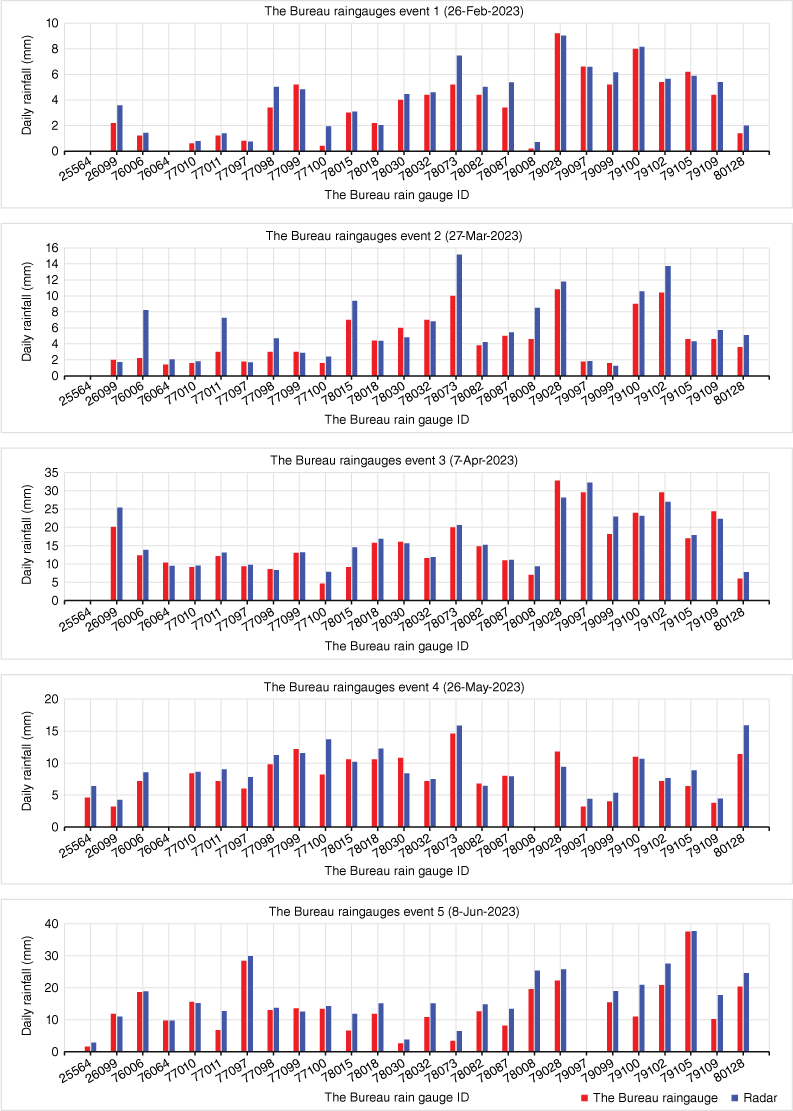
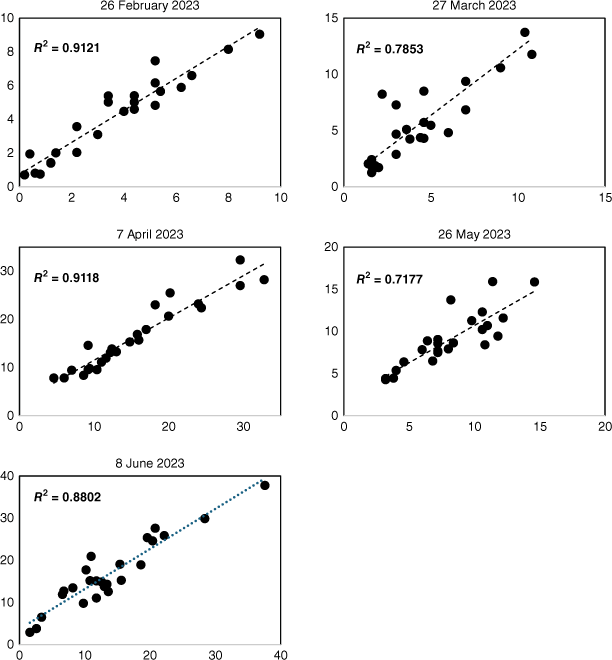
Rainfall data pairs from each of the 26 contributing Bureau rain gauges and the QPE weather radar merged rainfall for the five rainfall events were analysed, with seven outliers removed, leaving a total of 123 data pairs. The results of this analysis are described both in Fig. 8 and Table 2. As expected, there is an overall relationship between Gobs and Robs. As a result of the algorithms employed in the Rainfields 3 processing, each of The Bureau official contributing gauges (as specified in the metadata of the dataset files) is the selected Kriging point for the Kriging interpolation. This is particularly evident in the results for 26 February and 7 April 2023 with Lin’s CCC values of 0.9309 and 0.9454 respectively, indicating substantial concordance between Gobs and Robs. Factors other than the Kriging interpolation that are part of the Rainfields 3 system, such seasonal factors, and non-compensated radar reflectivity interference, are possible contributors to the variability of the Lin’s CCC, range 0.7960–0.9454, for the five rainfall events. The NSE values are a measure of how well Robs represents a radar rain rate accuracy corresponding to the mean of Gobs, using only the average of the observed data. For the five events, values within 0.7092–0.9121, indicate ‘passable’ to ‘very good’ level of performance. The Pearson coefficient, range 0.8472–0.9551, also indicates a strong correlation.
Comparison of daily rainfall measured by The Bureau rain gauge network with determinations of rainfall from the QPE weather radar merged rainfall maps for the five chosen rainfall events.
| Weather radar rainfall v. contributing rain gauges from The Bureau rain gauge network | ||||||
|---|---|---|---|---|---|---|
| 26 February 2023 | 27 March 2023 | 7 April 2023 | 26 May 2023 | 8 June 2023 | ||
| Pearson | 0.9550 | 0.8862 | 0.9549 | 0.8471 | 0.9382 | |
| R2 | 0.9121 | 0.7853 | 0.9118 | 0.7177 | 0.8802 | |
| RMSE | 0.7074 | 1.7773 | 2.0686 | 1.6871 | 2.7852 | |
| NSE | 0.9121 | 0.7853 | 0.9118 | 0.7177 | 0.8802 | |
| Lin’s CCC | 0.9309 | 0.7960 | 0.9454 | 0.8105 | 0.8775 | |
Jackson et al. (2018) refer to an unpublished study conducted by HydroNET in 2015 to validate the accuracy of various rainfall data products in Australia, including calibrated radar rainfall data. There are significant differences in precipitation types, with a distinction being made between stratiform and convective precipitation which consequently affects the reflectivity of the radar signal and therefore how the Rainfields 3 QPE algorithm adjusts the mean field bias using the contributing gauges from The Bureau rain gauge network (Jackson et al. 2018).
The R2 values (Fig. 9) are an indicator of how well the QPE merged radar rainfall observations fit the observed rain gauge data. The study reported R2 values for weather radar merged rainfall data: 0.83 for all events, 0.82 for convective events and 0.9 for stratiform events. The results in Table 2 present a similar range (0.72–0.91) of R2 values.
3.4. Comparison of daily rainfall – Longerenong DATA Farm rain gauge network with radar merged rainfall maps
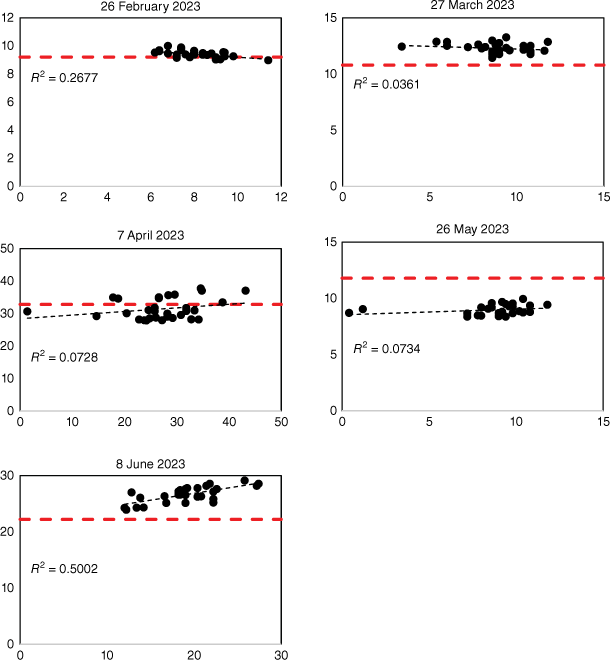
Rainfall data pairs from each of the 33 rain gauges installed at the Longerenong DATA Farm and the QPE weather radar merged rainfall were analysed for each of the five rainfall events, with 14 outliers removed, leaving a total of 151 data pairs. The purpose of this analysis was to illustrate the spatial variability of a dense network of single-point daily rainfall rain gauge measurements with the QPE merged radar rainfall product at the same location. The analysis of this data must consider that the Longerenong DATA Farm rain gauge network only covers a relatively small area of ~5 × 5 km (2500 ha). This privately managed network consists of low-cost tipping bucket rain gauges that do not meet WMO standards for the installation and maintenance of rain gauges as required for The Bureau site rain gauges. As a minimum, the rain gauge manufacturer recommends annual maintenance and checking to ensure that gauges remain accurate. Consequently, the expected levels of accuracy may be somewhat less than Bureau site rain gauges.
The results of the analysis described both in Fig. 10 and Table 3 show no overall statistical relationship between Gobs and Robs. This is particularly evident in the results for Lin’s CCC, with values ranging from −0.0851 to 0.1486, indicating strong discordance between Gobs and Robs for the five rainfall events. The NSE values range of 0.0361–0.5002 indicates unsatisfactory levels of performance. The Pearson coefficients, ranging from −0.5174 to 0.271 for the first four events indicate very small correlations, whereas a value of 0.7072 for the 8 June event indicates a strong correlation. However, Fig. 10 and 11 show a large spread of the residuals, which does not support this conclusion.
Comparison of daily rainfall measured by the Longerenong DATA Farm rain gauge network with determinations of daily rainfall from the QPE merged radar rainfall maps for the five rainfall events.
Comparison of daily rainfall measured by the Longerenong DATA Farm rain gauge network with determinations of daily rainfall from the QPE merged radar rainfall maps for the five rainfall events using linear regression.
| Weather radar rainfall v. Longerenong DATA Farm rain gauge network | ||||||
|---|---|---|---|---|---|---|
| 26 February 2023 | 27 March 2023 | 7 April 2023 | 26 May 2023 | 8 June 2023 | ||
| Pearson | −0.5174 | −0.1900 | 0.2698 | 0.2710 | 0.7072 | |
| R2 | 0.2677 | 0.0361 | 0.0728 | 0.0734 | 0.5002 | |
| RMSE | 0.1980 | 0.4479 | 3.0029 | 0.4277 | 0.9558 | |
| NSE | 0.2677 | 0.0361 | 0.0728 | 0.0734 | 0.5002 | |
| Lin’s CCC | −0.0851 | −0.0196 | 0.1486 | 0.0936 | 0.1008 | |
The other four rainfall events experienced more evenly spread rainfall as implied by the QPE merged radar rainfall observations (Fig. 11). The R2 values (0.0361–0.5002) also indicate that the radar observations are a very poor fit for the observed rain gauge data from the Longerenong DATA Farm rain gauge network.
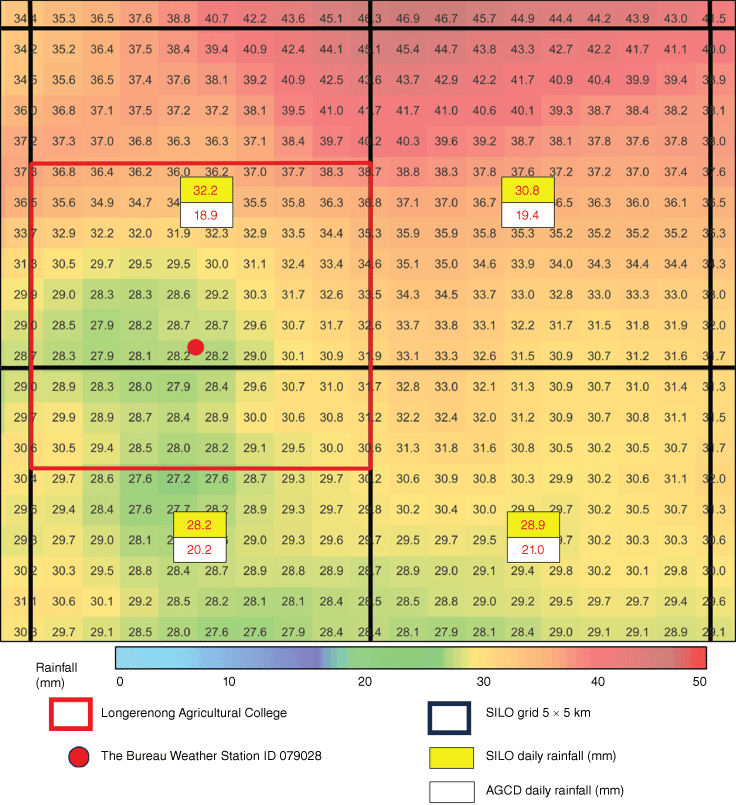
The data in Table 4 compare single-point values at the location of The Bureau Weather Station 79028, for each of the rainfall events chosen for the study. The differences between SILO and AGCD are explained by the source data used in their modelling as they use different datasets and calculation methods (Beesley et al. 2009). Fu et al. (2022) state that the mean annual rainfall difference over the Australian continent (1960–2016) is ~2.6%, and that the differences between SILO and AGCD (e.g. 7 April 2023 in Table 4) can be so large for certain rainfall events in certain locations that one must wrong, and it is likely both are inaccurate.
| Date of rain event | SILO grid cell | AGCD grid cell | 79028 Bureau point | RADAR merged rain | |
|---|---|---|---|---|---|
| 26 February 2023 | 8.6 | 5.3 | 9.2 | 9.0 | |
| 27 March 2023 | 10.3 | 9.5 | 10.8 | 11.8 | |
| 7 April 2023 | 32.2 | 18.9 | 32.8 | 28.2 | |
| 26 May 2023 | 11.6 | 11.2 | 11.8 | 9.4 | |
| 8 June 2023 | 21.6 | 18.4 | 22.2 | 25.8 |
Bold formatting indicates that 7 April 2023 was a significant rainfall event.
4.Discussion
As stated in the Introduction, the purpose of this paper is to explore the use of weather-based radar merged with rain gauge network observations to estimate the amount of rainfall at ground level and provide a map of rainfall at high spatial and temporal resolution at the agricultural field level.
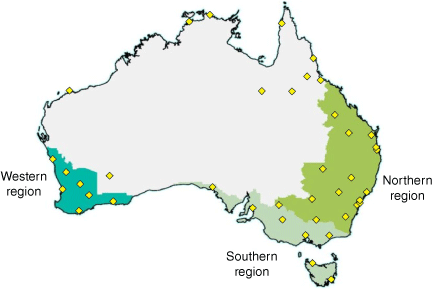
This objective can be achieved using the already existing Rainfields 3 system in areas of Australia that have adequate radar coverage (Fig. 12).
Location of high-resolution Doppler radars (yellow diamonds) in the dryland (rain-fed) cropping regions of Australia. Base map provided courtesy of Grains Research and Development Corporation (2024).
4.1. An alternative to conventional rain gauge installations
Owing to the sparsity of rain gauge sites and the high spatial variability of rainfall at the field level, there is a need by modellers, agronomists and farmers for much improved rainfall data both in density and quality. Grid-based models such as SILO and AGCD are unsatisfactory due to their limited resolution, which can lead to inaccuracies in model outputs. For areas of Australia, the Rainfields 3 QPE merged radar rainfall product provides areal coverage at high resolution and at a significantly reduced cost to the alternative of expanding existing rain gauge networks. Other countries also have similar weather radar installations such as the Operational Program on the Exchange of Weather Radar Information (OPERA) in Europe (Saltikoff et al. 2019) and the Next-Generation Weather Radar (NEXRAD) in the USA (Seo et al. 2011). Ansh Srivastava and Mascaro (2023) studied the spatial frequency analysis of extreme precipitation events with 19 years of merged radar rainfall data generated from the NEXRAD network tested against a network of 204 high-resolution rain gauges in central Arizona, USA, resulting in spatially seamless merged radar rainfall data that addressed the shortcomings from sparse rain gauge measurements.
Even though rain gauge data are point measurements, this is the only source of independent truth available to validate a rainfall event, assuming the gauge meets the WMO standards for the installation and maintenance of rain gauges.
Comparison of sampled areas of coverage for different methods of rainfall estimation is shown in Table 5.
| Method of rainfall estimation | Unit area | Area covered (km2) | |
|---|---|---|---|
| Bureau tipping bucket rain gauge | Collecting funnel – 203 mm in diameter | 3 × 10⁻⁸ | |
| QPE merged radar rainfall product | Pixel resolution 500 × 500 m | 0.25 | |
| SILO and AGCD gridded climate data | Grid tile – 5 × 5 km | 25 | |
| Rainbow weather radar footprint | 256 × 256 km | 65,536 |
In the case study of the Rainbow radar installation, rainfall data from 26 contributing rain gauges (Table 1) were used to merge with the Rainbow weather radar data, resulting in an average spacing of ~50 km between gauges.
4.2. Localised intense rainfall events
Within the region of the case study, changing patterns of rainfall have become evident with an observed increase in localised summer thunderstorm events of intense rainfall over relatively small areas and of short duration (Pepler et al. 2021).
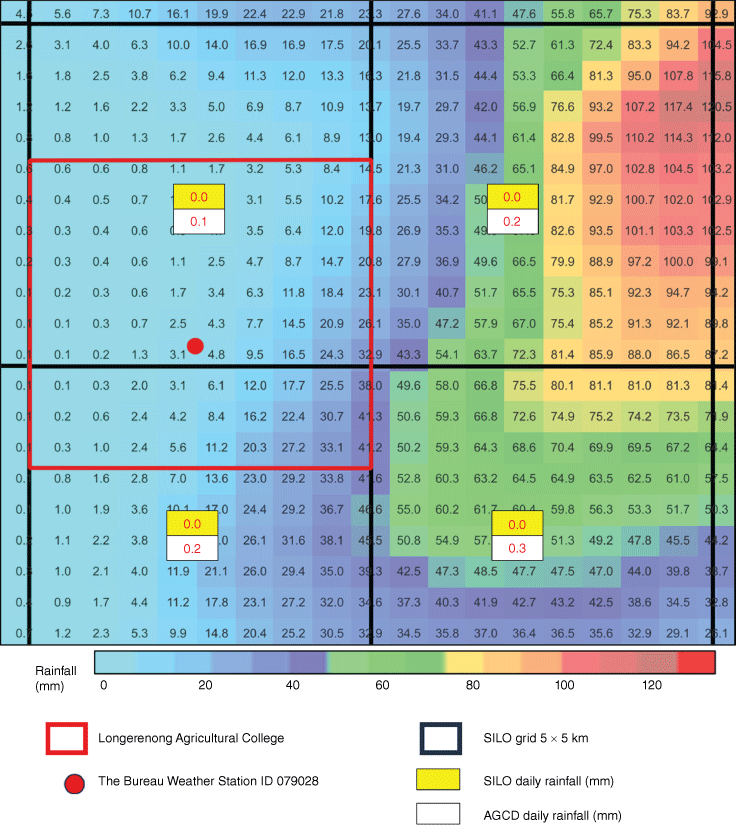
The rainfall event of 7 April 2023 consisted of localised heavy rainfall (most likely convective), with high spatial variability within the Longerenong DATA Farm rain gauge network (Fig. 13, 14). The rain event occurred in the 9 h after midnight with a peak intensity of ~15 mm h–1 in the vicinity of the Longerenong Bureau weather station (79028). Large differences of ~8–13 mm of rainfall were evident in the SILO and AGCD modelled rainfall for this event (Beesley et al. 2009).
Daily rainfall map of QPE merged radar rainfall for the 24 h preceding 09:00 hours on 7 April 2023 with a resolution of 500- × 500-m pixels. To show the comparison highlighted in Table 4, the coincident SILO tile (and the collocated AGCD tile), including The Bureau Longerenong weather station and Longerenong DATA Farm rain gauge network are superimposed on the map.
Map of daily QPE merged radar rainfall from the Rainbow weather radar in 24 h to 09:00 hours on 7 April 2023, with daily rainfall amounts displayed within each 500- × 500-m pixel. The SILO grid is superimposed on the map, displaying the SILO and AGCD modelled rainfall for each 5- × 5-km grid cell.
An example of this localised thunderstorm activity on the evening of 7 January 2022, with the edge of the storm reaching the eastern boundary of the Longerenong DATA Farm, is illustrated in Fig. 15. The official Longerenong Bureau Weather Station, ID 079028, located within the Longerenong Agricultural College (Fig. 15), recorded 0 mm of rainfall on 8 January 2022 (Table 6). The nearest official Bureau rain gauges are Horsham Aerodrome (11.2 km east), which also recorded 0 mm, and Rupanyup (29.9 km west) with 2.8 mm recorded accumulated over 3 days from 8 January 2022.
Map of daily QPE merged radar rainfall from the Rainbow weather radar in 24 h to 09:00 hours on 8 January 2022, with daily rainfall amounts displayed within each 500- × 500-m pixel. The SILO grid is superimposed on the map, displaying the SILO and AGCD modelled rainfall for each 5- × 5-km grid cell.
| Date of rain event | SILO grid cell | AGCD grid cell | 79028 Bureau point | RADAR merged rain | |
|---|---|---|---|---|---|
| 8 January 2022 | 0.0 | 0.1 | 0 | 4.8 |
This is an example of the lack of spatial density of rain gauges missing a significant rainfall event with the majority of rainfall greater than 10 mm as indicated by the QPE merged radar rainfall data. The shortcomings of both gridded rainfall models that rely on input from The Bureau rain gauge network are demonstrated with values of 0.0 and 0.1 mm respectively for the SILO and AGCD grid cells that have The Bureau Longerenong rain gauge located within the grid cell (Table 6). The localised thunderstorm was completely missed by both models; however, the weather radar data were able to indicate the spatial distribution of this rainfall event. As mentioned in the Methods section, the Longerenong DATA Farm has a private network of rain gauges, with five located on the southern end of the eastern boundary. Although these rain gauges do not meet WMO standards, they did indicate rainfall readings between 6 and 16 mm, confirming coverage of the rainfall event.
The cited example above is not an isolated one, with the rural media reporting several localised thunderstorm events of agricultural significance that occurred on 2 and 15 March 2022 in an area west of the town of Warracknabeal, Victoria, covered by the Rainbow radar. A Wimmera farmer who farms west of Warracknabeal reported he had a full moisture profile on parts of his farm after the 2 March event, stating that, ‘We got up to 100 mm on some of the farm overnight, but it varied a lot – very hit and miss’ (Verley 2022). The daily rainfall reading for the nearby official Bureau site Warracknabeal Airport, ID 078018, was 0.2 mm for the preceding 24 h to 09:00 hours on 2 March 2022. The SILO grid value for daily rainfall for that field was 17.4 mm. This illustrates how erroneous point-measured rain gauge and grid-based models are, the QPE merged radar rainfall at the very least gives an indication of the spatial variability at the field scale.
4.3. Measurement of accumulated rainfall using QPE merged radar rainfall data
An illustration of how the QPE merged radar rainfall data can be used to aid farm management decisions, especially in dryland (rain-fed) agriculture, is to generate high-resolution maps of the accumulated rainfall for a field between any two selected dates from the archive. An example is shown in Fig. 16, which depicts the accumulated rainfall and the spatial variability in the 4 months pre-sowing, from January to April 2023.
(a) Map of the accumulated daily rainfall for the Longerenong DATA Farm computed from the QPE merged radar rainfall product archive for the period 1 January to 30 April 2023. The hashed area is a single field, ‘Paddock 8’, showing the resolution of areal spatial distribution of the accumulated rainfall within the field for the time period. (Map data Google Satellite, WMS, see https://mt0.google.com/vt/lyrs=s&x={x}&y={y}&z={z}, accessed 19 February 2024). The blue square indicates the QPE merged radar rainfall pixel displayed in (b) the accumulated rainfall graph.
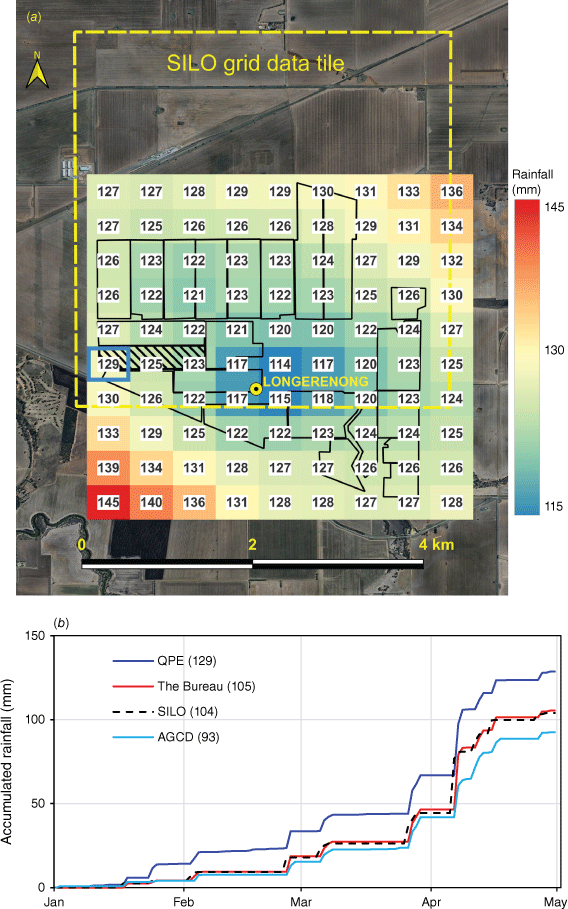
Comparative values of the accumulated rainfall for the period 1 January to 30 April 2023 at the case study site are:
QPE merged radar rainfall readings range from 113.6 to 144.4 mm, with a mean of 125.9 mm and s.d. ±5.6 mm, with the blue square portion (Fig. 16b) of ‘Paddock 8’ = 128.6 mm,
Longerenong Bureau weather station rain gauge readings = 105.4 mm,
SILO tile = 103.9 mm, and
AGCD tile = 92.5 mm.
As noted previously, Fu et al. (2022) compared the SILO and AGCD in their study, showing that both grids could produce significant differences in rainfall amounts at the local scale.
4.4. Improved output from water balance modelling
In the dryland (rain-fed) scenario, the simple water balance equation for the change in soil moisture S stored in the soil profile over time follows:
where R, T, E and D are rainfall, transpiration, evaporation and drainage respectively, all with equivalent units (mm day–1).
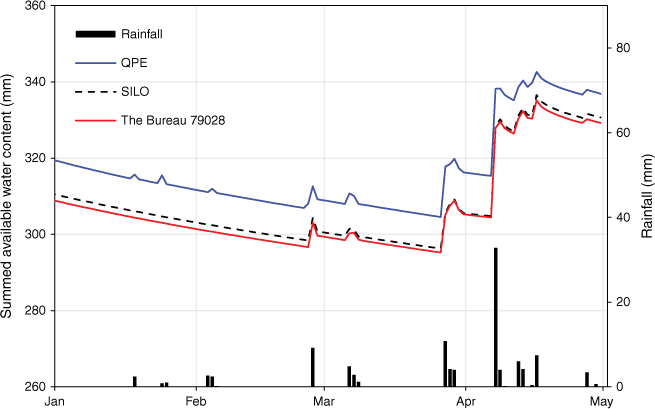
Water balance studies, especially in dryland farming locations, have mainly relied on gridded rainfall data such as SILO for their rainfall variable input. The provision of the higher resolution merged radar rainfall data accounting for the spatial variability of rainfall at field level, results in higher precision output from the models, e.g. the SoilWat module (Probert et al. 1998) in the Agricultural Production Systems sIMulator (APSIM) model (Holzworth et al. 2014; Holzworth et al. 2018) (Fig. 17). This may lead to better management decisions being made from the improved modelling output by using QPE merged radar rainfall data to better represent the spatial variability of rainfall as opposed to using point-based rain gauges or grid-based data.
APSIM modelling of the summed available water content for a soil profile in ‘Paddock 8’ using the SoilWat module with different sources of daily rainfall from QPE, SILO grid and single-point Bureau weather station 70928 rain gauge, to estimate daily rainfall for the time series 1 January to 30 April 2023 inclusive.
5.Conclusions
This case study illustrates the capability of the Rainfields 3 product to generate rainfall maps at high resolution as a much-improved replacement for grid-based models, despite some of the problems alluded to. Also, the use of private rain gauges, either individually or as a network, are unlikely to meet WMO standards and are unlikely to provide accurate and timely information. In particular, for Australian dryland (rain-fed) farmers with coverage of high-resolution Doppler radars (Fig. 12), QPE merged radar rainfall datasets provide the opportunity for soil moisture management at much-improved spatial resolution for much less cost than installing or expanding existing rain gauge networks. The amount of rainfall and spatial distribution estimated from weather radar is an existing resource which is at present is quite underutilised. Ansh Srivastava and Mascaro (2023) noted that the potential of merged radar rainfall has not yet been fully explored, and, although their work was carried out in central Arizona, their insights should apply to any region of the world monitored by weather radars.
The Rainfall 3 QPE merged radar rainfall product, where calibrated rainfall accumulations are blended with Bureau rainfall gauge network observations, provides the highest quality radar QPE product (Seed et al. 2022, p. 24), which is available free of charge from the Australian Unified Radar Archive (AURA) Rainfields 3 dataset on the National Computing Infrastructure (NCI) under a Creative Commons CC4-BY-NC licence. By comparison, the installation costs of rain gauges, their ongoing maintenance, regular inspection and calibration costs to produce reliable rainfall single-point measurements are significant.
Merged radar rainfall offers a practically usable technology that can be used as part of a precision agriculture management strategy analysing temporal and spatial rainfall data to support management decisions based on estimated variability of rainfall at the field level.
It is 60 years since H. T. Ashton referred to the potential of weather radar in estimating rainfall (cited in Seed et al. 2002, p. 1):
No discussion of studies on areal rainfall for hydrometeorological purposes is complete without reference to the potential of radar scanning. Application of radar to the problem of estimating area and intensity of rainfall in a series of observations is only at a rudimentary stage in Australia. The potential value is so great, however, that all improvements, as soon as available, should be applied in the field on a continuing basis. Here we have something so obviously useful that neglect of it is unthinkable
Development and refinement of weather radar based products in Australia (Seed et al. 2002) culminated in the release of Rainfields 3 in 2018 (Seed et al. 2008), having now reached a state of maturity (Seed et al. 2022). Jackson et al. (2018) conclude that calibrated radar rainfall can be a significantly improved rainfall data source for water management activities and models.
In theory, farmers and managers can access the archived data free of charge to understand both the temporal and spatial distribution of rainfall within all of their fields without the expense of installing and maintaining rain gauges, with all radar sites being maintained by Bureau at no cost to the end-users. However, the legacy QPE merged radar rainfall product, accessed from the NCI, requires further software processing to be able to generate the dashboard type output as shown in Fig. 16a.
In Australia, government agencies have embarked on a program to increase the drought resilience of farmers and improve their efficient use of water resources by subsidising the installation of various on-farm IoT devices, including automated tipping bucket rain gauges at a cost of A$1500+ each to make a single-point measurement of rainfall within a field. There has been little recognition that The Bureau weather radar network can conveniently provide areal measurements of rainfall at a resolution of 500 × 500 m for no cost, with coverage of the major grain growing areas of Australia that only have sparse point-based measurements of rainfall from The Bureau rain gauge network (see Fig. 12, 14, 15).
Data availability
QPE merged radar rainfall data are available from the AURA Rainfields 3 dataset on National Computing Infrastructure under a CC4-BY-NC licence (Seed et al. 2022). SILO climate data are freely available under the Creative Commons Attribution 4.0 International (CC BY 4.0) licence. The State of Queensland is the source of this copyright material.
Conflicts of interest
The authors declare that they have no known competing financial interests or personal relationships that could have appeared to influence the work reported in this paper.
Declaration of funding
This work has been supported by the Cooperative Research Centre for High Performance Soils whose activities are funded by the Australian Government’s Cooperative Research Centre Program and by an Australian Government Research Training Program (RTP) Fee-Offset Scholarship through Federation University Australia.
Acknowledgements
The authors gratefully acknowledge the Australian Bureau of Meteorology for the provision of climate data (Australian Bureau of Meteorology 2023, ‘Daily rainfall’, Product ID: IDCJAC0009, see http://www.bom.gov.au/metadata/19115/ANZCW0503900338; http://www.bom.gov.au/climate/data/). Longerenong DATA Farm are acknowledged for access to their dataset (Longerenong College, 2023, IoT sensors).
Author contributions
Peter Weir contributed the conceptualisation, methodology, software programming and writing of R language scripts to process and visualise data, writing of the original draft, investigation and formal analysis. Peter Dahlhaus reviewed and edited the writing, and provided supervision.
References
Agriculture Victoria (2023) Grains and other crops. (Department of Energy, Environment and Climate Action) Available at https://agriculture.vic.gov.au/crops-and-horticulture/grains-pulses-and-cereals/grains-and-other-crops [Verified 12 September 2023]
Anagnostou EN, Krajewski WF (1999) Real-time radar rainfall estimation. Part I: algorithm formulation. Journal of Atmospheric and Oceanic Technology 16(2), 189-197.
| Crossref | Google Scholar |
Ansh Srivastava N, Mascaro G (2023) Improving the utility of weather radar for the spatial frequency analysis of extreme precipitation. Journal of Hydrology 624, 129902.
| Crossref | Google Scholar |
Beesley C, Frost A, Zajaczkowski J (2009) A comparison of the BAWAP and SILO spatially interpolated daily rainfall datasets. In ‘18th World IMACS Congress and MODSIM09 International Congress on Modelling and Simulation’, 13–17 July 2009, Cairns, Qld, Australia. (Eds RS Anderssen, RD Braddock, LTH Newham) pp. 3886–3892. (Modelling and Simulation Society of Australia and New Zealand and International Association for Mathematics and Computers in Simulation) Available at https://mssanz.org.au/modsim09/I13/beesley.pdf
Berndt C, Rabiei E, Haberlandt U (2014) Geostatistical merging of rain gauge and radar data for high temporal resolutions and various station density scenarios. Journal of Hydrology 508, 88-101.
| Crossref | Google Scholar |
Chappell A, Renzullo LJ, Raupach TH, Haylock M (2013) Evaluating geostatistical methods of blending satellite and gauge data to estimate near real-time daily rainfall for Australia. Journal of Hydrology 493, 105-114.
| Crossref | Google Scholar |
Chua Z-W, Kuleshov Y, Watkins A (2020) Evaluation of satellite precipitation estimates over Australia. Remote Sensing 12(4), 678.
| Crossref | Google Scholar |
Chua Z-W, Kuleshov Y, Watkins A, Choy S, Sun Q (2022) A comparison of various correction and blending techniques for creating an improved satellite-gauge rainfall dataset over Australia. Remote Sensing 14, 261.
| Crossref | Google Scholar |
Fu G, Barron O, Charles SP, Donn MJ, Van Niel TG, Hodgson G (2022) Uncertainty of gridded precipitation at local and continent scales: a direct comparison of rainfall from SILO and AWAP in Australia. Asia-Pacific Journal of Atmospheric Sciences 58(4), 471-488.
| Crossref | Google Scholar |
Hines B, Qian G, Tordesillas A (2022) Mapping Australia’s precipitation: harnessing the synergies of multi-satellite remote sensing and gauge network data. GIScience & Remote Sensing 59(1), 2084-2110.
| Crossref | Google Scholar |
Goudenhoofdt E, Delobbe L (2009) Evaluation of radar-gauge merging methods for quantitative precipitation estimates. Hydrology and Earth System Sciences 13(2), 195-203.
| Crossref | Google Scholar |
Grains Research and Development Corporation (2024) Growing regions. (GRDC) Available at https://grdc.com.au/about/our-industry/growing-regions [Verified 24 April 2024]
Hofstra N, Haylock M, New M, Jones P, Frei C (2008) Comparison of six methods for the interpolation of daily, European climate data. Journal of Geophysical Research: Atmospheres 113(D21), D21110.
| Crossref | Google Scholar |
Holzworth DP, Huth NI, deVoil PG, Zurcher EJ, Herrmann NI, McLean G, Chenu K, van Oosterom EJ, Snow V, Murphy C (2014) APSIM – evolution towards a new generation of agricultural systems simulation. Environmental Modelling & Software 62, 327-350.
| Crossref | Google Scholar |
Holzworth D, Huth NI, Fainges J, Brown H, Zurcher E, Cichota R, Verrall S, Herrmann NI, Zheng B, Snow V (2018) APSIM next generation: overcoming challenges in modernising a farming systems model. Environmental Modelling & Software 103, 43-51.
| Crossref | Google Scholar |
Jackson B, Reichard L, Connell R (2018) Real time calibrated radar rainfall data for improved operational water management and WSUD. In ‘10th International Conference on Water Sensitive Urban Design: Creating water sensitive communities (WSUD 2018 & Hydropolis 2018)’, 12–15 February, 2018, Perth, WA, Australia. pp. 202–211. (Engineers Australia: Barton, ACT, Australia) Available at https://search.informit.org/doi/10.3316/informit.495145336250869
Jayaweera L, Wasko C, Nathan R, Johnson F (2023) Non-stationarity in extreme rainfalls across Australia. Journal of Hydrology 624, 129872.
| Crossref | Google Scholar |
Jeffrey SJ, Carter JO, Moodie KB, Beswick AR (2001) Using spatial interpolation to construct a comprehensive archive of Australian climate data. Environmental Modelling & Software 16(4), 309-330.
| Crossref | Google Scholar |
Jones D, Wang W, Fawcett R (2009) High-quality spatial climate data-sets for Australia. Australian Meteorological and Oceanographic Journal 58, 233-248.
| Crossref | Google Scholar |
King AD, Alexander LV, Donat MG (2013) The efficacy of using gridded data to examine extreme rainfall characteristics: a case study for Australia. International Journal of Climatology 33(10), 2376-2387.
| Crossref | Google Scholar |
Lawrence I, Lin K (1989) A concordance correlation coefficient to evaluate reproducibility. Biometrics 45, 255-268.
| Crossref | Google Scholar |
Nanding N, Rico-Ramirez MA (2019) Precipitation measurement with weather radars. In ‘ICT for Smart Water Systems: Measurements and Data Science’. (Eds A Scozzari, S Mounce, D Han, F Soldovieri, D Solomatine) pp. 235–258. (Springer) 10.1007/698_2019_404
Nashwan MS, Shahid S, Chung E-S, Ahmed K, Song YH (2018) Development of climate-based index for hydrologic hazard susceptibility. Sustainability 10(7), 2182.
| Crossref | Google Scholar |
Norin L (2015) A quantitative analysis of the impact of wind turbines on operational Doppler weather radar data. Atmospheric Measurement Techniques 8(2), 593-609.
| Crossref | Google Scholar |
Norin L (2017) Wind turbine impact on operational weather radar I/Q data: characterisation and filtering. Atmospheric Measurement Techniques 10(5), 1739-1753.
| Crossref | Google Scholar |
Pepler AS, Dowdy AJ, Hope P (2021) The differing role of weather systems in southern Australian rainfall between 1979–1996 and 1997–2015. Climate Dynamics 56, 2289-2302.
| Crossref | Google Scholar |
Probert ME, Dimes JP, Keating BA, Dalal RC, Strong WM (1998) APSIM’s water and nitrogen modules and simulation of the dynamics of water and nitrogen in fallow systems. Agricultural Systems 56(1), 1-28.
| Crossref | Google Scholar |
Rauniyar SP, Power SB (2020) The impact of anthropogenic forcing and natural processes on past, present, and future rainfall over Victoria, Australia. Journal of Climate 33(18), 8087-8106.
| Crossref | Google Scholar |
Saltikoff E, Haase G, Delobbe L, Gaussiat N, Martet M, Idziorek D, Leijnse H, Novák P, Lukach M, Stephan K (2019) OPERA the radar project. Atmosphere 10(6), 320.
| Crossref | Google Scholar |
Seed A, Pegram G (2001) Using Kriging to infill gaps in radar data due to ground clutter in real-time. In ‘Proceedings of the Fifth International Symposium on Hydrological Applications of Weather Radar’, 19–22 November 2001, Heian-Kaikan, Kyoto, Japan. pp. 73–78. Available at https://www.researchgate.net/publication/367299344
Seed A, Siriwardena L, Sun X, Jordan P, Elliott J (2002) On the calibration of Australian weather radars. Technical Report 02/7. (Cooperative Research Centre for Catchment Hydrology) Available at https://ewater.org.au/archive/crcch/archive/pubs/pdfs/technical200207.pdf
Seed A, Leahy C, Duthie E, Chumchean S (2008) Rainfields: the Australian Bureau of Meteorology system for quantitative precipitation estimation, and it’s use in hydrological modelling. In ‘Proceedings of Water Down Under 2008: Incorporating 31st Hydrology and Water Resources Symposium and the 4th International Conference on Water Resources and Environment Research’, 14–17 April 2008, Adelaide, SA, Australia. pp. 661–670. (Engineers Australia)
Seed A, Curtis M, Velasco C (2022) AURA – Operational Radar Rainfields 3. (National Computing Infrastructure Australia) [Dataset] 10.25914/DTTK-H476
Seo B-C, Krajewski WF, Kruger A, Domaszczynski P, Smith JA, Steiner M (2011) Radar-rainfall estimation algorithms of Hydro-NEXRAD. Journal of Hydroinformatics 13(2), 277-291.
| Crossref | Google Scholar |
Velasco-Forero CA, Sempere-Torres D, Cassiraga EF, Jaime gómez-Hernández J (2009) A non-parametric automatic blending methodology to estimate rainfall fields from rain gauge and radar data. Advances in Water Resources 32(7), 986-1002.
| Crossref | Google Scholar |
Wimmera Catchment Management Authority (2023) Land. In ‘Wimmera Regional Catchment Strategy’. (Victoria State Government) Available at https://wimmera.rcs.vic.gov.au/themes/land/ [Verified 12 September 2023]
Wimmera Catchment Management Authority (2024) West Wimmera – Region quick stats/Climate. (Wimmera CMA) Available at https://wimmera.rcs.vic.gov.au/local-areas/west-wimmera/ [Verified 7 February 2024]
Wesson SM, Pegram GGS (2006) Improved radar rainfall estimation at ground level. Natural Hazards and Earth System Sciences 6(3), 323-342.
| Crossref | Google Scholar |
Footnotes
1 Australian Bureau of Meteorology website: Climate Data Online – Map search (see http://www.bom.gov.au/climate/data/).