

The influence of genetic and environmental factors on performance of Brahman heifers grazing pastures in northern Australia
E. Charmley A * , G. J. Bishop-Hurley B , M. K. Matthews A , J. Simington A † , C. S. McSweeney B , S. E. Denman B , L. Martinez-Fernandez B , J. Padmanabha B , P. Giacomantonio B and J. Cheung B
A
B
† Deceased October 2024. Contributed to investigation through data curation and investigation and met the definition of authorship.
Handling Editor: Kieren McCosker
Abstract
Between animal variation in performance is a determinant of productivity in the northern Australian beef industry. Understanding factors that contribute to this variation is critical for selection of superior genotypes and optimising the pasture animal interface.
To determine factors that influence performance of cattle grazing tropical pastures through co-ordinated grazing and pen studies.
Within a cohort of 56 yearling heifers, 32 were allocated to an 11-month grazing trial, whereas 24 were grazed, then individually fed hay in pens. At the end of the trial, pasture cattle were ranked according to liveweight (LW) gain and the top- and bottom-ranked animals were allocated to high-performance (HP) or low-performance (LP) groups. Residual feed intake (RFI) of heifers in pens was determined and correlations between pasture and pen performance were estimated. Pasture and diets were characterised using the Botanal method (pasture only) and near-infrared reflectance spectroscopy analysis. Activity on pasture was measured using global positioning system (GPS) collars. Pasture data were divided into dry and wet seasons and the grazing trial was analysed as a factorial, with performance group and season as the two factors.
There were seasonal differences in most measured variables of animal production, behaviour and rumen fermentation consistent with changes in diet quality. Diet selection, activity on pasture and rumen fermentation characteristics did not to differ between LP and HP groups. Differences in RFI of hay-fed heifers were attributed to variation in feed intake. There was a correlation (r2 = 0.5) between performance of heifers in pens and on pasture in the wet season.
Seasonal variations in pasture biomass and nutritive value had an overriding effect on LW change in growing beef cattle, but among-animal variation in LW gain was still apparent. This could not be attributed to any of the measured variables on pasture; however, RFI data suggested a genetic influence on intake, which was supported by estimated breeding values.
Several possible reasons for differences in performance of grazing cattle were ruled out by this research. Methods for measuring intake and efficiency of grazing cattle are required to understand and manage the grazing animal.
Keywords: beef cattle, feed efficiency, grazing behaviour, liveweight gain, nutritive value, pasture, residual feed intake, tropical.
Introduction
The climatic and edaphic conditions of northern Australia are well suited to the production of beef from tropical pastures. Growth rates of cattle of between 100 and 300 kg/head.year typify the variation in productivity, which depends principally on rainfall and land type (Bortolussi et al. 2005). However, individual animal performance varies within a grazing cohort of cattle. For example, in a previous study Charmley et al. (2024) found a 90 kg difference in turn-off weights between the highest- and lowest-performing steers in a group of 89 head over a 2-year grazing study. In a grazing environment, the factors that contribute to this difference are complex and varied, but have been broadly attributed to genetic, environmental and management factors (G × E × M). Under controlled conditions, such as in a feedlot, the environmental and management factors can be highly controlled, and production is more closely aligned to the genotype of the animal. Under grazing conditions, phenotypic expression is influenced by the interplay of environmental and management factors linked to the pasture–animal interface and these are poorly understood. Thus, managing the pasture and the animal for optimum productivity is challenging.
Selection of nutrients from pasture allows the animal to derive a diet of higher nutritive value than the feed on offer (Langlands and Sanson 1976; Thomas et al. 2010). This is particularly true in heterogenous tropical pastures (Topps 1969). It is well known that the selection ‘pressure’ differs according to diet quality, feed availability and possible nutrient drivers for production (Varva and Ganskopp 1998). What is less well understood is the phenotypic variability among animals to select diets of differing nutritive value (Searle et al. 2010; Mulliniks et al. 2016). Charmley et al. (2024) concluded that there was some evidence to suggest that divergence in performance of cattle on tropical pasture was attributed to selection for plant components with improved nutritive value.
The rumen microbiome is highly specialised and characterised by the nature of the diet consumed by the animal. Therefore, rumen fermentation is highly controlled by diet quality, with close relationships between digestibility and volatile fatty acid (VFA) composition, and diet nitrogen (N) and microbial protein synthesis (Bowen et al. 2017). However, the evidence that there may be genetic differences among animals on the same diet in their rumen microbiome is scant. Cantalapiedra-Hijar et al. (2018) concluded that the microbiome was essentially similar in high- and low-residual feed intake (RFI) cattle, although it was acknowledged that specific host phenotypes, such as rumen size and absorption capacity may influence the rumen microbiome and hence efficiency of individuals under standard nutritional and environmental conditions.
Efficiency of utilisation of nutrients can differ within a cohort of individuals and can be measured by the difference between expected and observed feed intake to achieve a given level of performance as RFI. However, this is typically performed under controlled feeding conditions over an extended period (70–84 days) where the diet is held constant (Arthur and Herd 2012). Although this implies a difference in metabolic efficiency, it can also be influenced by difference in gut fill, lean to fat ratio in the carcase, and protein turnover (Kenny et al. 2018). The measurement of voluntary intake and RFI in the grazing animal is fraught with difficulties especially in tropical grazing conditions. Animals selected for RFI under controlled conditions may not be the most efficient under grazing conditions, especially if the diets are different (Lawrence et al. 2012).
In this paper, the growth performance of growing beef heifers was measured on pasture and under controlled hay feeding conditions. The study used a cohort of genetically similar animals with the objective of evaluating the relative behavioural, environmental and genetic influences on performance and intake through a combination of pasture and pen studies. Selected cattle from the grazing trial were evaluated for intake and performance under controlled feeding conditions, with the objective of determining whether RFI and performance in pens were related to performance (as LW gain) on pasture. The null hypothesis assumed that ranking of individuals for performance was the same under controlled feeding conditions and on pasture.
Materials and methods
To test the hypothesis that the performance ranking of growing cattle is the same on pasture or under controlled feeding, Brahman heifers were assessed on pasture and under individual-pen feeding conditions. Cattle were allocated to an 11-month grazing study with two subsets of cattle removed from pasture to measure RFI in two pen feeding trials. The top- and bottom-performing animals in the grazing cohort were ranked according to overall liveweight (LW) gain and allocated post hoc to low-performance (LP) and high-performance (HP) groups. Response variables were separated for wet and dry seasons. Seasons were defined on the basis of greenness of the pasture from direct field observations and a normalised-difference vegetation index generated by remote sensing (Cibo Labs, Point Arkwright, Qld, Australia). The wet season ran from 14 December 2020 to 18 May 2021 and the dry season ran from 19 May 2021 to 16 November 2021. The studies complied with the Australian Code for the Care and Use of Animals for Scientific Purposes (8th Edition 2013) and were approved by the CSIRO Queensland Animal Ethics Committee (AEC Number: 2019-33).
Pasture trial
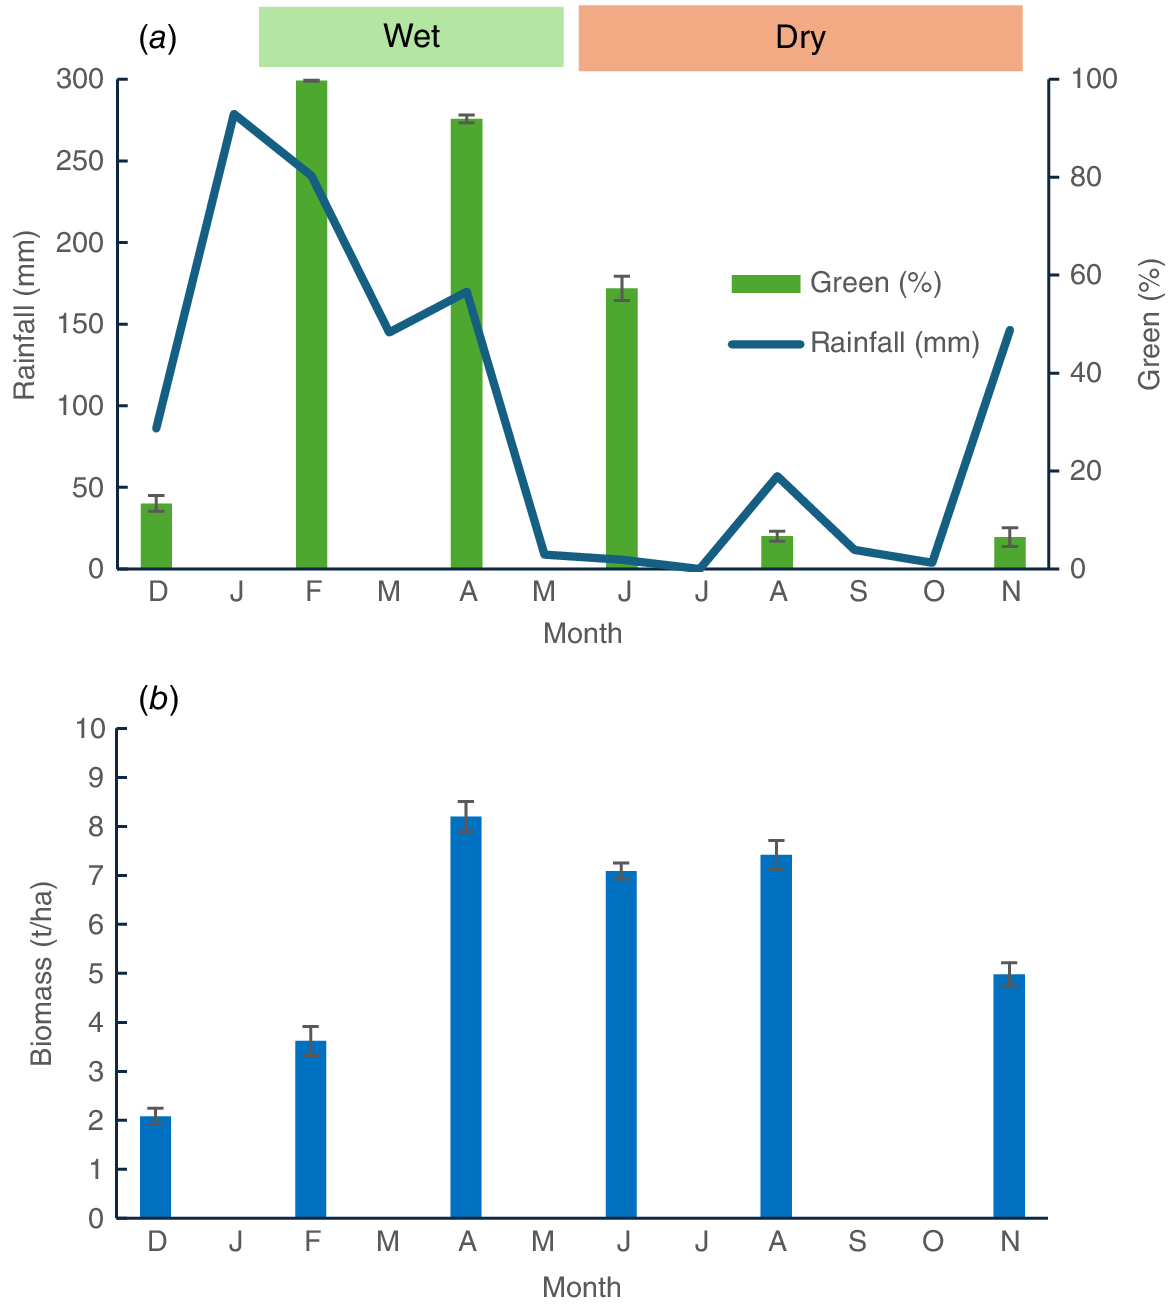
Four adjacent 15.5 ha established paddocks were used for a 11 month grazing study. The study began in December 2020 at the Lansdown Research Station (19°39′S, 146°50′E) located 45 km south of Townsville, Queensland, and concluded in November 2021. All paddocks were on predominantly sodic sandy loams with sporadic clay areas. They supported mixed-species swards including grasses, legumes and weeds. The pasture grasses comprised Indian couch (Bothriochloa pertusa), Queensland bluegrass (Dicanthium sericium) black speargrass (Heteropogon contortus) and sabi grass (Urochloa mosambicensis). The legumes included seca stylo (Stylosanthes scabra) and Desmanthus species. Weed species were dominated by sickepod (Senna obtusifolia), snakeweed (Stachytarpheta spp), sida (Sida acuta) and soft khakiweed (Gomphrena celosioides). From pasture assessments conducted in March 2020, paddocks were found to be similar in biomass (1.8–2.9 t/ha) and the proportion of legume (15.3–20.3%) in the pasture. Each paddock was supplied with water from a trough. The paddocks received 1007 mm rainfall over the study period, with 75% of this falling from December to the end of March (Fig. 1a). Rainfall was 16% higher than average.
(a) Rainfall (mm) and percentagem green material and (b) biomass (t/ha); during the study period.
Detailed measurements of pasture biomass, botanical and chemical composition were taken at 2-monthly intervals on 14 December 20, 2 February 2021, 14 April 2021, 1 June 2021, 3 August 2021 and, 3 November 2021 by using a modified Botanal technique (Tothill et al. 1992). Pasture observations (120 per replicate (paddock)) by using a 0.25 m2 quadrat utilised a grid pattern with approximate 40 m spacing between observations that were georeferenced. At every 10th observation, the quadrat was harvested to within 50 mm ground level and the sample was dried for subsequent near-infrared reflectance spectroscopy (NIRS) analysis. Observations were classified as pasture biomass (1–5), % grass, % legume, % other, % dead, and % bare ground. Five quadrats, spanning the range in observed biomass, were classified, harvested, dried and weighed to provide a relationship between classification score and biomass.
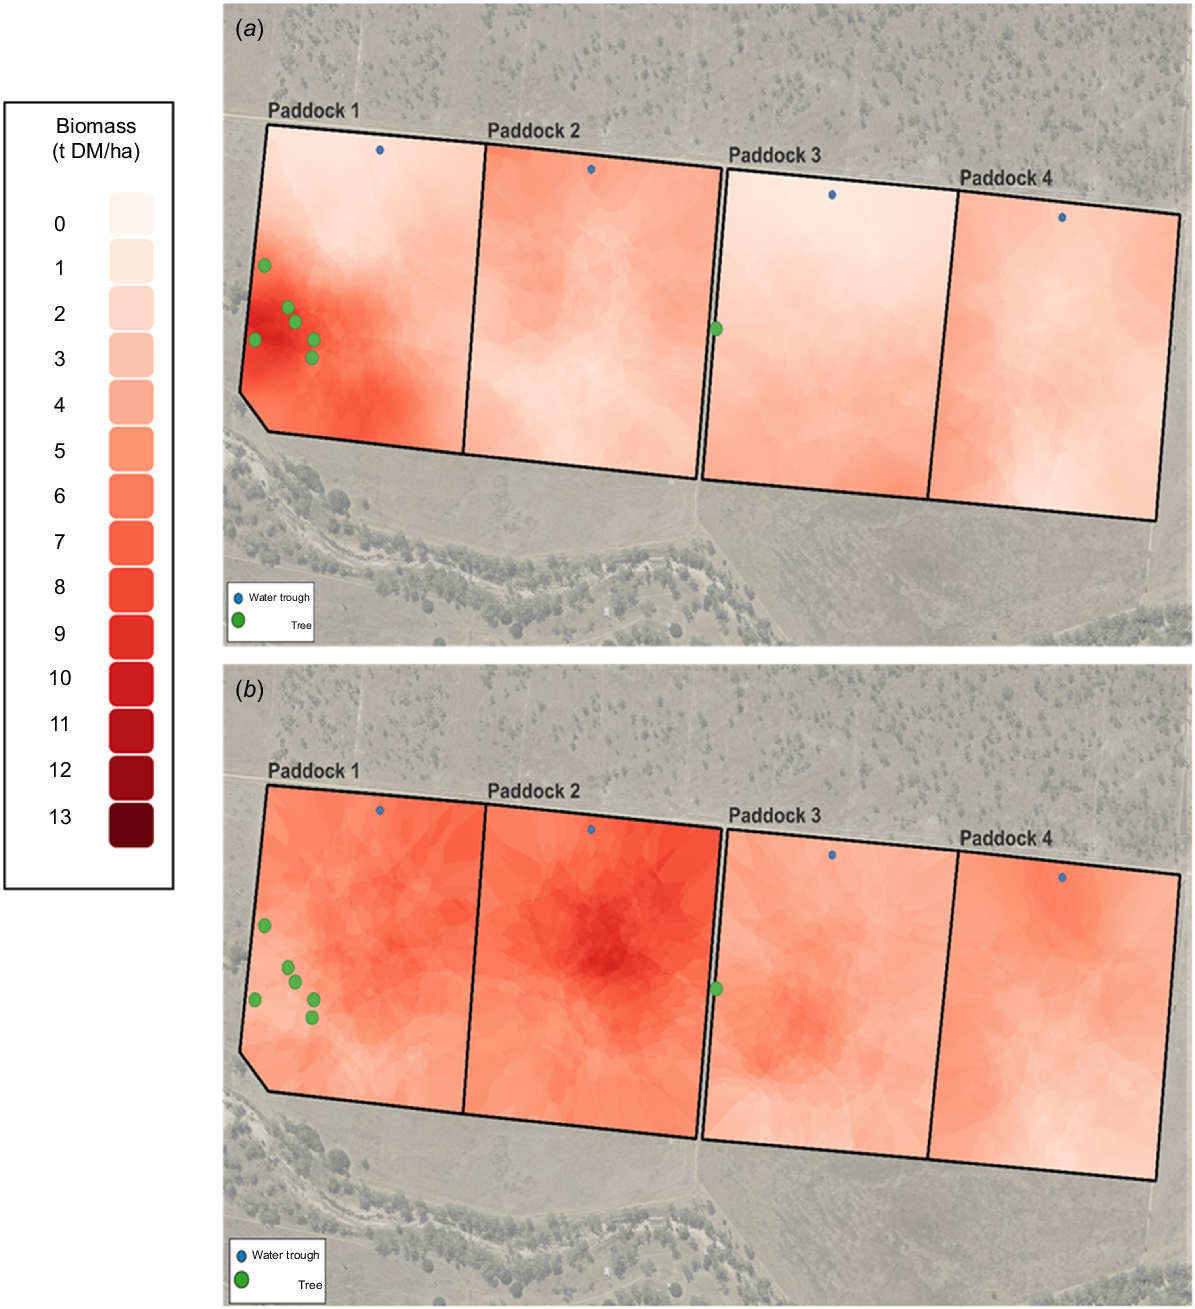
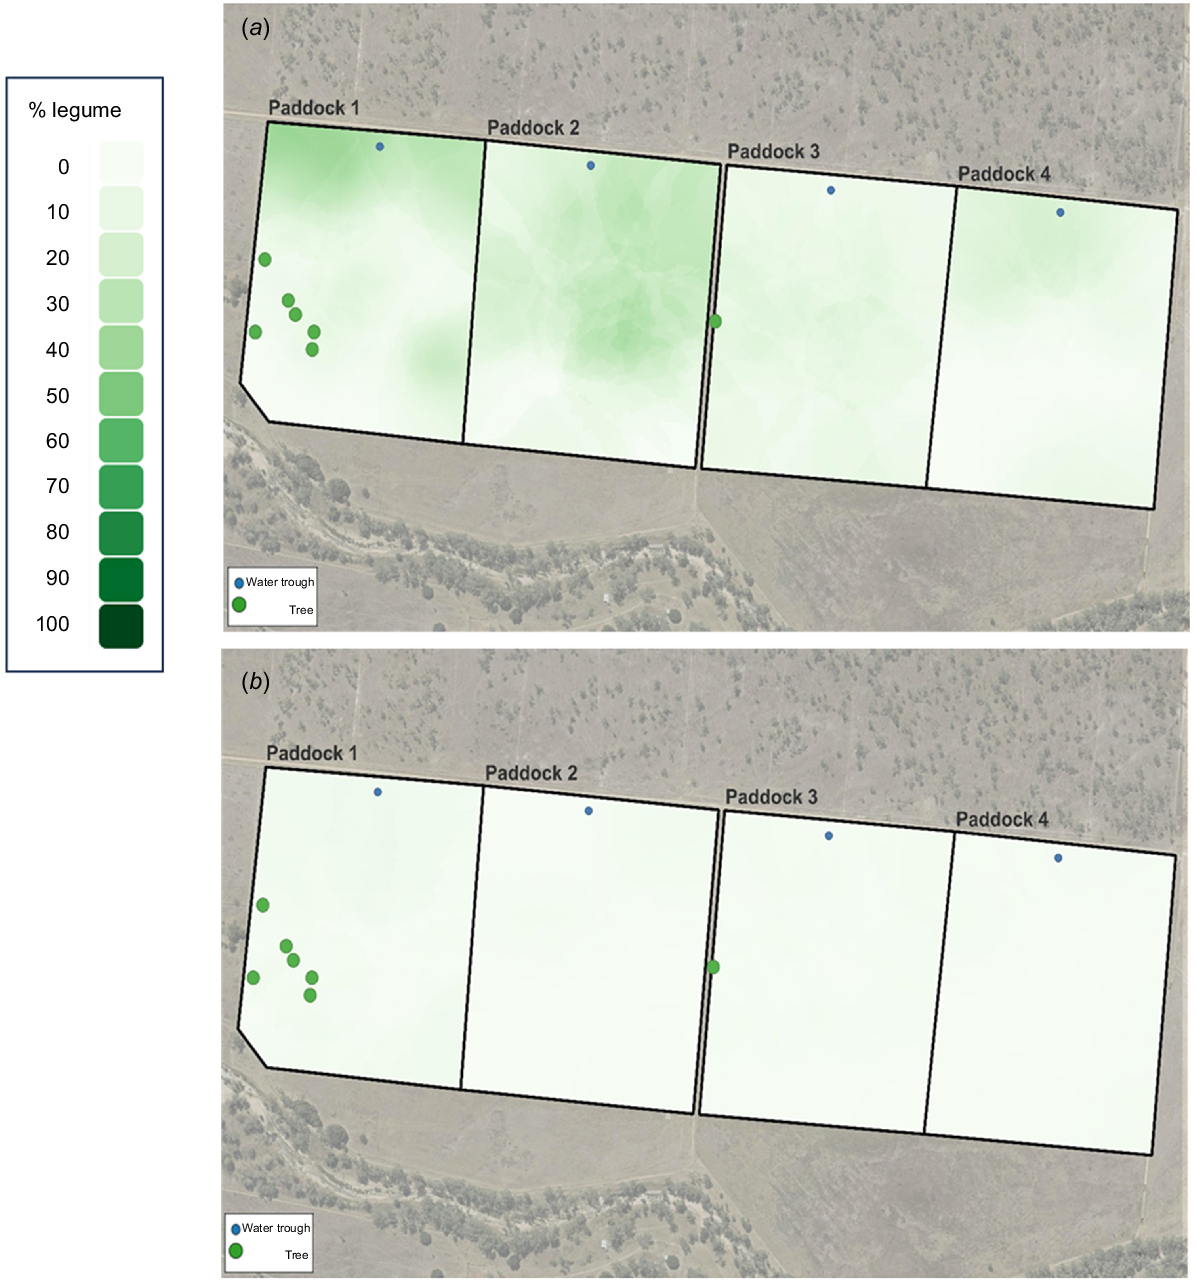
Georeferenced data for biomass and % legume collected on 2 February 2021 and 3 November 2021 were analysed by geostatistical methods by using Q-GIS software (ver. 3.34.3) and interpolated using Kriging (Cressie 1990), to generate an estimated surface from a spatially known set of individual data points within Q-GIS. These dates were chosen to correspond as close as possible to the global positioning system (GPS) collar deployments in February and October.
Fifty-six yearling Brahman heifers were sourced from a Brahman herd enrolled in BREEDPLAN® (BREEDPLAN; une.edu.au), which provided data on individual estimated breeding values (EBVs) for 400- and 600-day weights, with an accuracy in the range of 45–55%. Cattle were transferred to the research station and acclimated on hay for 5 days before being weighed and blocked according to LW, with one animal from each block being allocated to one of four paddocks. All heifers were inoculated against bovine ephemeral fever (Ultravac BEF, Zoetis Australia, Rhodes, NSW, Australia). The grazing trial commenced on 14 December 2020 and continued through to 12 November 2021. Fourteen heifers were allocated to each paddock with an initial LW of 218 ± 22 (s.d.) kg. Heifers were weighed using a centralised walk over animal scale at intervals of between 4 and 6 weeks. On 10 March 2021, three heifers were removed at random from each paddock for net feed efficiency measurements, as described later for the pen trial. These heifers were returned to the paddocks on 16 June 2021 and a further three per paddock were removed for a second pen study on 28 June 2021 and returned 6 October 2021. Consequently, 32 heifers remained on pasture throughout the full 11 months and only data from these animals are used in the analysis of the pasture trial results. On four occasions throughout the trial (1 February 2021, 12 April 2021, 17 May 2021, 30 August 2021), heifers were mustered and rumen samples taken via oral stomach tube, faecal samples via rectal palpation, and blood samples taken via jugular venepuncture (Stifkens et al. 2022). Cattle were mustered by replicate (paddock) and sampled within 1 h of entering yards. Faeces were analysed for diet nutritive value by using faecal near-infrared reflectance spectroscopy (faecal NIRS), by using the method described in detail by Charmley et al. (2024). Rumen contents were analysed for pH, rumen ammonia and VFAs (Stifkens et al. 2022). At the end of the trial, all heifers were condition scored by palpation on a scale of 1–5 (Gaden 2005), hip height was measured, and P8 backfat was measured using a 10 MHz 60 mm linear array probe (HS-2200V, Honda Electronics Co., Erina, NSW, Australia).
Neck collars, fitted with solar powered GPS hardware (Arablouei et al. 2023; Charmley et al. 2024) were fitted to cattle on each of two occasions from 19 February 2021 (wet season) to 25 February 2021 and from 29 September 2021 to 5 October 2021 (dry season). Twelve cattle were fitted with collars in each paddock in the first and second deployments respectively.
Pen trial
On two occasions, from 8 March 2021 to 16 June 2021 and from 28 June 2021 to 6 October 2021, 12 different cattle were used in each of the two pen studies, comprising a 14-day adaptation followed by an 84-day measurement period. In Pen trial 1, one heifer was pregnant and calved during the study and data from that animal were removed from all analyses. On completion of the pen feeding studies, cattle were returned to the grazing trial. Cattle were housed in individual outdoor pens, each 60 m2 in area and equipped with a shade cloth covering 18 m2, a water trough and a wire fenceline feed bunk (4 × 1 m). Pens were constructed from portable metal panels and the floor was a hard pad of road-grade stone and crusher dust covered with soil. A mineral block was provided for each pen (Olssens trace element with copper and cobalt; Olssons, Yennora, NSW, Australia). Manure was removed at the completion of each study. Cattle were adapted to a Rhodes grass hay diet over 2 weeks, then fed ad libitum for the remainder of the pen feeding trials. Hay was provided three times a week (Wednesdays, Fridays and Mondays) and uneaten feed was removed and weighed before fresh hay was given. Voluntary feed intake was determined from the difference between feed offered and refused, adjusted for dry-matter (DM) content, every 2 or 3 days. Feeding level was adjusted on a weekly basis to maintain refusals at between 10% and 15% of feed offered. Cattle were weighed at 2-weekly intervals before feeding and sampled for blood, faeces and rumen fluid on one occasion at the mid-point of each study, as previously described for the grazing trial. Residual feed intake (RFI) was determined according to the method proposed by Lawrence et al. (2012). Residual feed intake was calculated as the difference between observed DM intake (DMI) and expected DMI estimated from LW gain and metabolic LW at the mid-point of the trial (42 days). Liveweight gain was calculated as the regression of LW against time over the 84-day feeding period and mid-point LW0.75 was the predicted LW at 42 days from regression, raised to the power of 0.75.
All pasture and faecal samples were dried at 65°C and ground to pass a 1 mm screen using a Retsch cyclone mill (Retsch GMBH, Hamburg, Germany). Near-infrared absorbance spectroscopy (NIRS) was used to characterise the nutritive value of pasture and the consumed diet as described by Charmley et al. (2024) using the method of Coates and Dixon (2011). Pasture and hay samples were scanned for prediction of N, DM digestibility (DMD, %)), organic-matter digestibility (OMD), acid detergent fibre (ADF), neutral detergent fibre (NDF). Metabolisable energy (ME, MJ/kg DM) was calculated according to the formula given in PISC (2007), as follows:
Crude protein (CP) was calculated as N × 6.25 and haemicellulose as NDF – ADF. Faecal samples were used to estimate diet composition and were scanned for prediction of dietary N, faecal N, ADF, NDF, DMD, OMD, ME and, staple isotope of carbon (δ13C). Percentage non-grass (C3 plants) was estimated from NIRS predictions according to the method of Coates and Dixon (2011).
Rumen samples were analysed for pH, ammonia-N and VFAs according to methods described by Stifkens et al. (2022). Briefly, the pH was determined immediately, and 4 mL of unstrained rumen fluid was preserved in 20% metaphosphoric acid and frozen at −80°C to await analysis of VFA (Gagen et al. 2014) and ammonia-N (Chaney and Marbach 1962).
Plasma samples were analysed for the natural abundance of 15N isotope according to the methods described by Cantalapiedra-Hijar et al. (2015). The protein fraction was isolated by acid precipitation and centrifugation and freeze-dried. The N stable isotopic composition (δ15N) was expressed according to the equation
where R is the N isotope ratio between the heavier isotope and the lighter isotope (15N:14N) for the sample being analysed and the internationally defined standard (atmospheric N2, R standard = 0.0036765) and δ is the delta notation in parts per 1000 (‰).
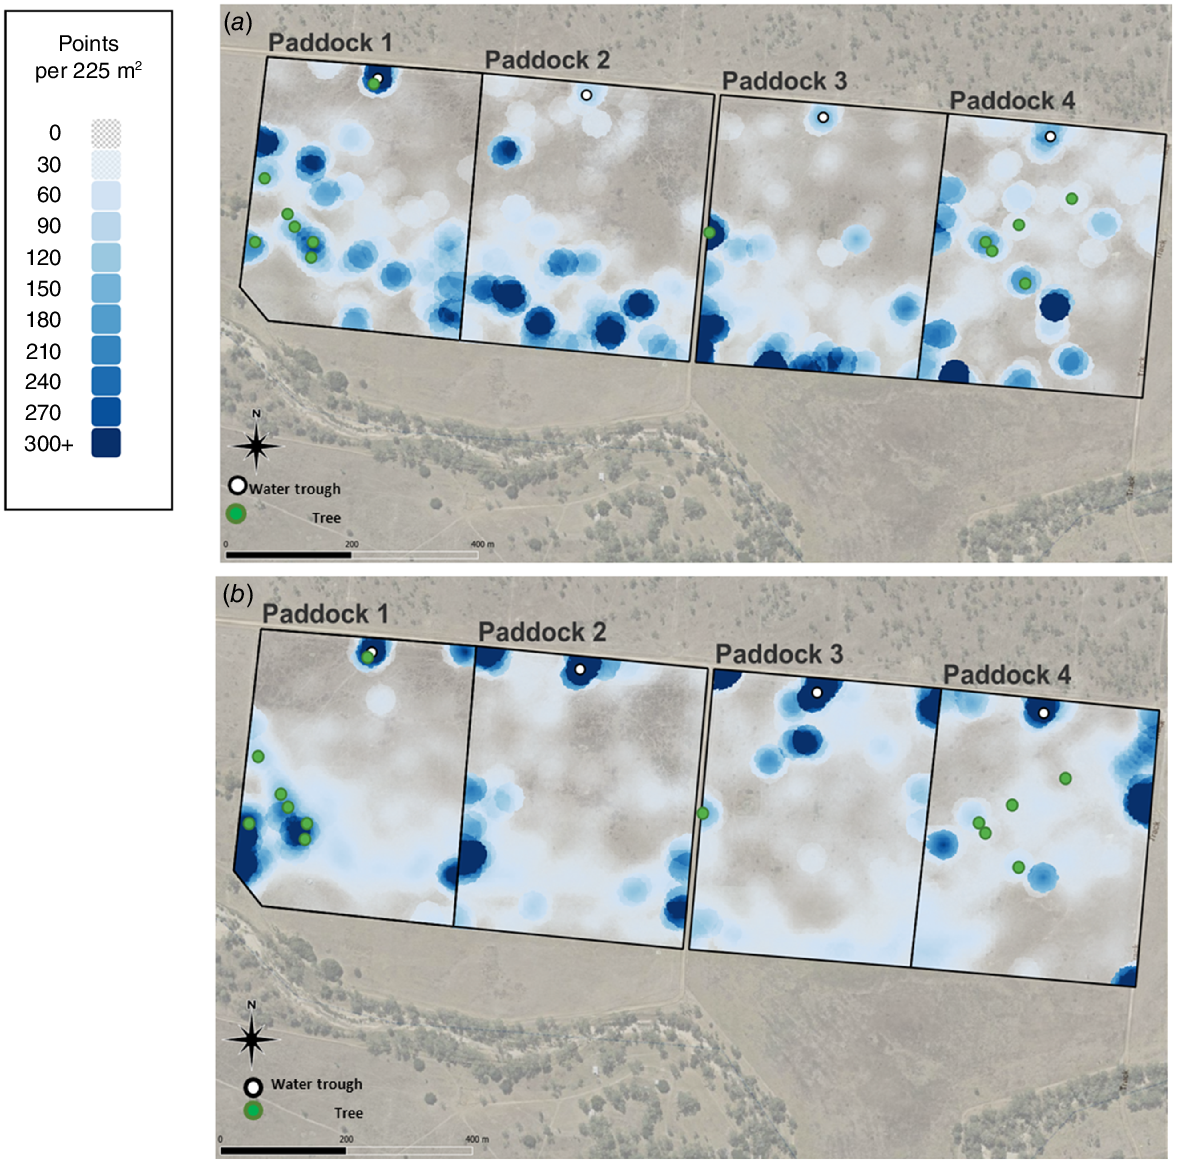
Activity collars were designed and assembled by CSIRO (Arablouei et al. 2023). Details of data collection, filtering and analysis are given in Charmley et al. (2024). Briefly, data were included only when >99% of potential fixes were achieved in any 24 h period and the GPS accuracy was ≥98%. Data were filtered to eliminate points geolocated with less than three satellites and with speeds between GPS fixes of >3.3 m/s. From a total of 48 deployed collars, data were successfully collected from 35 collars in the wet season and 33 in the dry season. However, because heifers were assigned to performance groups at the end of the trial, and accounting for failed collars, it was not possible to balance efficiency group within paddocks for collar data. Collar data were collected on 8 HP and 10 LP heifers in the wet season and 12 HP and 11 LP heifers in the dry season. Coordinates for animal position were selected every 10, 30 and 60 s and used to compute distance travelled over 24 h as well as the hourly distance travelled throughout the day. Spatial representation of cattle location was determined using Q-GIS software to plot animal location within 15 × 15 m cells over 7 days (based on 30 s GPS interval). Cattle density was visualised using Kriging software within Q-GIS (Cressie 1990) and restricted to four cattle per paddock for visual clarity representing both LP and HP heifers (two from each group). Standardised preference indices for biomass and legume percentage quantiles were created for the wet and dry season (Tomkins and O’Reagain 2007).
Evaluations of pasture composition (Botanal) and nutritive value (NIRS) throughout the trial were made to determine the effect of sampling date (wet or dry season) and paddock. Individual Botanal datapoints were averaged by row within paddock, with one site per row harvested for nutrient analysis. Sampling row became the replicate (n = 12) within paddock. Fig. 1a shows the rainfall and percentage greenness across the six sampling dates. Pasture growth lagged rainfall by approximately a month (Fig. 1b). Consequently, on completion of the study, the percentage greenness was used to distinguish two seasons representing periods of wet or dry pasture growth (Fig. 1a). Samples taken in February and April were assigned to the wet season, whereas samples taken in June, August and October were assigned to the dry season. The means of data from sampling dates in the wet and dry seasons were taken as representative of those seasons. Samples taken in December 2020 were considered representative of the preceding dry season and were excluded from the analysis. For animal data, the replicate was the animal nested within paddock and the means of data from sampling dates collected in the wet and dry seasons were deemed representative of those seasons.
The animal data comprising LW gain and diet nutritive value were examined as a 2 × 2 factorial design with two measurement periods (wet vs dry season) and two performance groups of animals (HP, three cattle with highest LW gain per paddock, and LP, three cattle with lowest LW gain per paddock. Other cattle, six to eight depending on removal for pen studies, remained in the paddocks but were not included in the analysis. Prior to deployment to paddocks, cattle were ranked and blocked by LW for assignment to one of four paddocks. All statistical analyses were performed using the GLM package of SAS (SAS Institute, Cary, NC, USA). Treatment effects were compared as the interaction level. Fixed effects were performance group nested within paddock and season. Probability was considered significant at P < 0.05 for all variables. For GPS collar data, statistical analysis was restricted to 20 animals. Unequal representation of animals within paddocks between HP and LP groups precluded comparisons at the interaction level. For daily distance travelled, performance group was removed from the statistical analysis and only the seasonal effect was examined.
Data from each pen trial were analysed independently to characterise the nutrient composition of the diets and the animal response. Multiple regression analysis was used to compute expected DMI according to the equation
where E(y) is the estimated DMI, β0 is the intercept, β1 is the partial regression coefficient on MLW0.75 and β2 is the partial regression coefficient on LW gain. Residual feed intake data from both pen trials were analysed together following standardisation of the diet ME to 10 MJ/kg DM, as suggested by Arthur and Herd (2012). To assess the influence of RFI on production and rumen fermentation characteristics, the two pen trials were combined and animals separated into low- and high-RFI groups. Animals with a negative RFI were assigned to the low-RFI group (n = 11, four from Pen Trial 1) and animals with a high RFI were assigned to the high-RFI group (n = 12, seven from Pen Trial 1). Low RFI is associated with high efficiency and vice versa.
To compare performance of the same cattle in pens and on pasture, LW gain of heifers immediately before they entered pens was compared with their LWG in pens using correlation analysis. For Pen trial 1, LWG on pasture between 14 December 2020 to 8 March 2021 was regressed against LWG in pens between 22 March 2021 and 16 June 2021. For Pen trial 2, a similar comparison was made between pasture LW gain immediately before cattle entered pens (18 May 2021–28 June 2021) and gain in pens (14 July 2021–6 October 2021). Regression analysis was also used to explore the relationship of 400-day and 600-day weight EBVs with LW gain in the wet and dry seasons. The EBVs were provided by the producer who supplied the cattle from their Brahman stud and had an overall accuracy of 45–55%. In the dry season, there was no relationship but the Pearson correlation coefficient for the wet-season LWG was significant.
Results
Pasture trial
The change in biomass throughout the grazing trial is shown in Fig. 1. Biomass was initially low but increased after rainfall in January and February (Fig. 1). Biomass remained above 7 t/ha until August, declining to approximately 5 t/ha at the conclusion of the study. Fig. 2 shows the spatial variation in biomass recorded in the wet (February) and dry (November) seasons. In February, the spatial variation in biomass was between 1 and 9 t/ha and was most pronounced in Paddock 1. In October, the spatial variation was less being between 3 and 8 t/ha, with the higher-biomass areas confined to Paddocks 1 and 2. Legumes were present in all paddocks, but higher percentages were observed in Paddock 1, and especially Paddock 2. There was a marked reduction in percentage legume in all paddocks in October, as compared with February (Fig. 3).
The seasonal effects on pasture composition and nutritive value in the four paddocks are shown in Table 1. Pasture biomass was 0.5 t/ha higher (P < 0.05) in the dry than the wet season and there was a significant (P < 0.001) paddock effect, with biomass being higher in Paddocks 1 and 2, than in Paddocks 3 and 4. The wet season was characterised by greener pastures (P < 0.001) containing less grass but more legumes and other species (P < 0.001) than in the dry season. Indices of diet quality all confirmed higher nutritive value of pasture in the wet than the dry season (P < 0.001). Nitrogen content was 1.7 times greater in the wet season, whereas NDF and ADF were 12% and 27% lower in the wet than the dry season respectively (P < 0.001). Digestibility of DM was approximately 10 percentage units lower in the dry that the wet season (P < 0.001). The only significant paddock effect for diet quality was for DM digestibility that was higher in Paddocks 1 and 2 than in Paddocks 3 and 4 (P < 0.05), although a similar trend was observed for N (P < 0.10).
| Item | Paddock | s.e. | P | ||||||
|---|---|---|---|---|---|---|---|---|---|
| 1 | 2 | 3 | 4 | Season (S) | Paddock (P) | S × P | |||
| Biomass (t/ha) | |||||||||
| Wet season | 6.84 | 6.49 | 5.23 | 5.07 | 0.405 | <0.042 | <0.001 | 0.761 | |
| Dry season | 7.00 | 7.48 | 5.71 | 5.81 | |||||
| Greem material (%) | |||||||||
| Wet season | 96.1 | 94.7 | 96.9 | 96.5 | 1.91 | <0.001 | 0.154 | 0.044 | |
| Dry season | 27.1 | 26.8 | 19.7 | 20.4 | |||||
| Grass (%) | |||||||||
| Wet season | 64.9 | 62.1 | 67.3 | 72.0 | 3.47 | <0.001 | 0.083 | 0.721 | |
| Dry season | 76.0 | 80.6 | 83.4 | 85.0 | |||||
| Legume (%) | |||||||||
| Wet season | 16.5 | 17.2 | 13.7 | 8.33 | 2.42 | <0.001 | 0.097 | 0.398 | |
| Dry season | 4.99 | 5.71 | 7.17 | 3.48 | |||||
| Other (%) | |||||||||
| Wet season | 18.5 | 19.2 | 18.9 | 19.7 | 4.02 | <0.001 | 0.733 | 0.663 | |
| Dry season | 18.9 | 13.7 | 9.43 | 13.3 | |||||
| Nitrogen (% DM) | |||||||||
| Wet season | 1.87 | 1.72 | 1.41 | 1.41 | 0.099 | <0.001 | 0.055 | 0.011 | |
| Dry season | 0.83 | 1.09 | 0.97 | 0.95 | |||||
| DM digestibility (%) | |||||||||
| Wet season | 56.0 | 58.2 | 55.5 | 53.0 | 1.64 | <0.001 | 0.022 | 0.560 | |
| Dry season | 39.4 | 45.2 | 41.1 | 40.8 | |||||
| Neutral detergent fibre (% DM) | |||||||||
| Wet season | 62.1 | 63.1 | 63.9 | 65.3 | 1.20 | <0.001 | 0.344 | 0.363 | |
| Dry season | 73.2 | 70.6 | 72.0 | 72.7 | |||||
| Acid Detergent fibre (% DM) | |||||||||
| Wet season | 35.3 | 36.8 | 38.8 | 38.5 | 1.08 | <0.001 | 0.234 | 0.026 | |
| Dry season | 53.5 | 49.4 | 51.3 | 51.6 | |||||
In Table 2 data are presented to show the effects of performance group (LP vs HP) and season (wet vs dry) on performance and diet composition for those cattle that grazed the paddocks for the full duration of the trial (333 days). Overall LW gain averaged just under 0.5 kg/day, with heifers exiting the trial at mean LW of 369 ± (s.d.) 26.8 kg. Heifers assigned to the HP group exhibited a higher LW gain than those assigned to the LP group, as expected (P < 0.001). Liveweight gain was also influenced by season (P < 0.001) and there was a significant (P < 0.05) interaction between performance group and season largely owing to higher LW gain in the dry season of HP than LP cattle (Table 2). Predicted DM intake using the model of McLennan et al. (2020) tended to be lower for the HP cattle (P = 0.059). We were unable to demonstrate a significant effect of performance group on nutritive value of the diet and percentage non-grass (P > 0.05). Nitrogen and digestibility were significantly (P < 0.001) lower in the dry season than the wet season. The N content of the diet was reduced by 35% in the dry season, whereas digestibility was reduced by 10–12%.
| Item | Low performance | High performance | s.e. | P | |||||
|---|---|---|---|---|---|---|---|---|---|
| Wet | Dry | Wet | Dry | Performance | Season | P × S | |||
| LW gain (kg/day) | 0.73 | 0.14 | 0.76 | 0.25 | 0.019 | <0.001 | <0.001 | 0.041 | |
| DM intake (g/kg LW)A | 28.6 | 22.9 | 28.8 | 20.7 | 0.62 | 0.059 | <0.001 | 0.131 | |
| Diet Nitrogen (% DM) | 2.46 | 1.57 | 2.41 | 1.63 | 0.057 | 0.925 | <0.001 | 0.342 | |
| DM digestibility (%) | 62.6 | 55.4 | 62.8 | 55.5 | 0.62 | 0.854 | <0.001 | 0.878 | |
| OM digestibility (%) | 63.8 | 57.0 | 63.9 | 57.0 | 0.58 | 0.985 | <0.001 | 0.948 | |
| Metabolisable energy (MJ/kg DM) | 9.06 | 7.83 | 9.09 | 7.83 | 0.107 | 0.853 | <0.001 | 0.877 | |
| Non-grass (%) | 8.13 | 25.8 | 8.81 | 25.7 | 2.72 | 0.803 | <0.001 | 0.619 | |
| Distance travelled (km/day)B | |||||||||
| 10 s fix interval | 22.5 | 23.8 | 22.1 | 24.4 | 0.55 | 0.909 | <0.001 | 0.360 | |
| 30 s fix interval | 11.5 | 12.7 | 11.3 | 13.4 | 0.33 | 0.413 | <0.001 | 0.152 | |
| 60 s fix interval | 7.46 | 8.78 | 7.30 | 9.17 | 0.24 | 0.611 | <0.001 | 0.214 | |
Data from 32 heifers grazing throughout the trial.
On completion of the trial, body condition score was higher for HP than LP heifers (P = 0.039), but no differences in P8 backfat or hip height were detected (Table 3).
Estimates of daily distance travelled were derived from GPS data positions taken at 10, 30 and 60 s intervals (Table 2). As the interval between points increased, the distance travelled decreased. There was a significant effect of season on distance travelled (P < 0.001), with cattle travelling further in the dry season than the wet season, but the there was no difference in travel distance between HP and LP heifers (P > 0.05). The time of day influenced activity with increased travel distances between 06.00 hours and 10.00 hours and again between 14.00 hours and 19.00 hours (Fig. 4). PM activity was particularly apparent in the dry season.
Distance travelled (km) each hour of the day for both HP and LP heifers in February (wet season) and October (dry season).
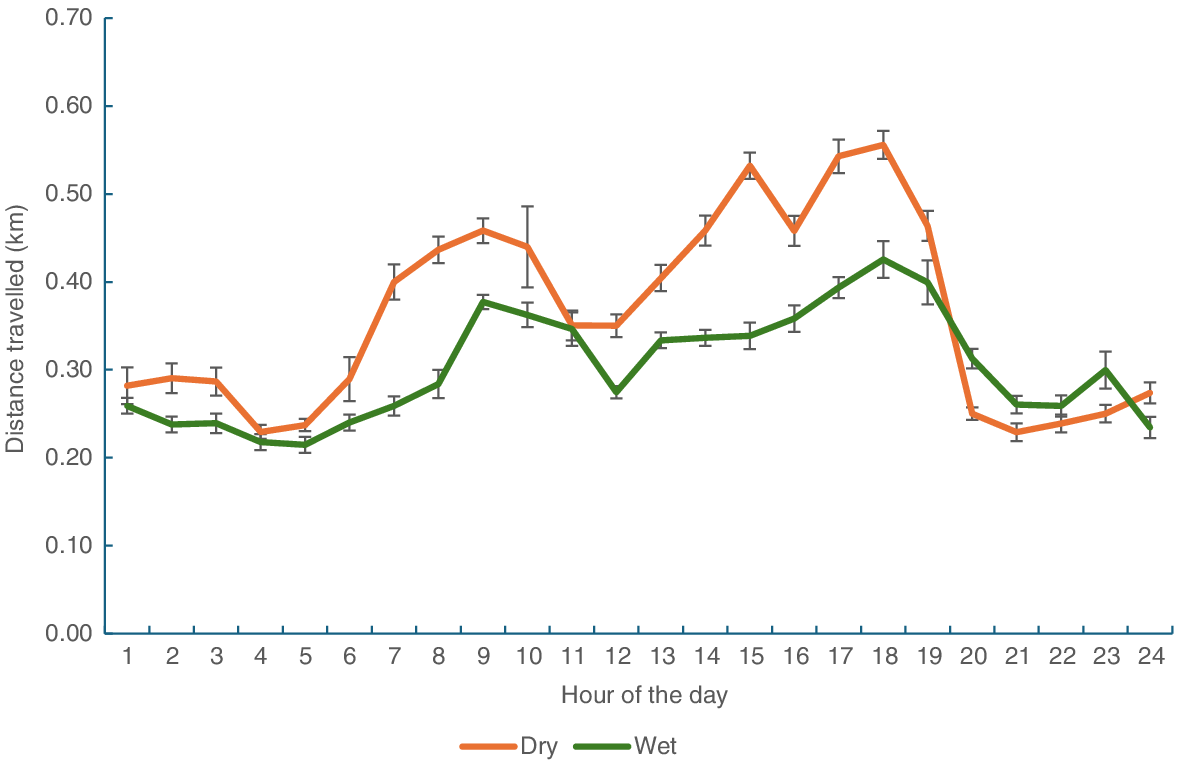
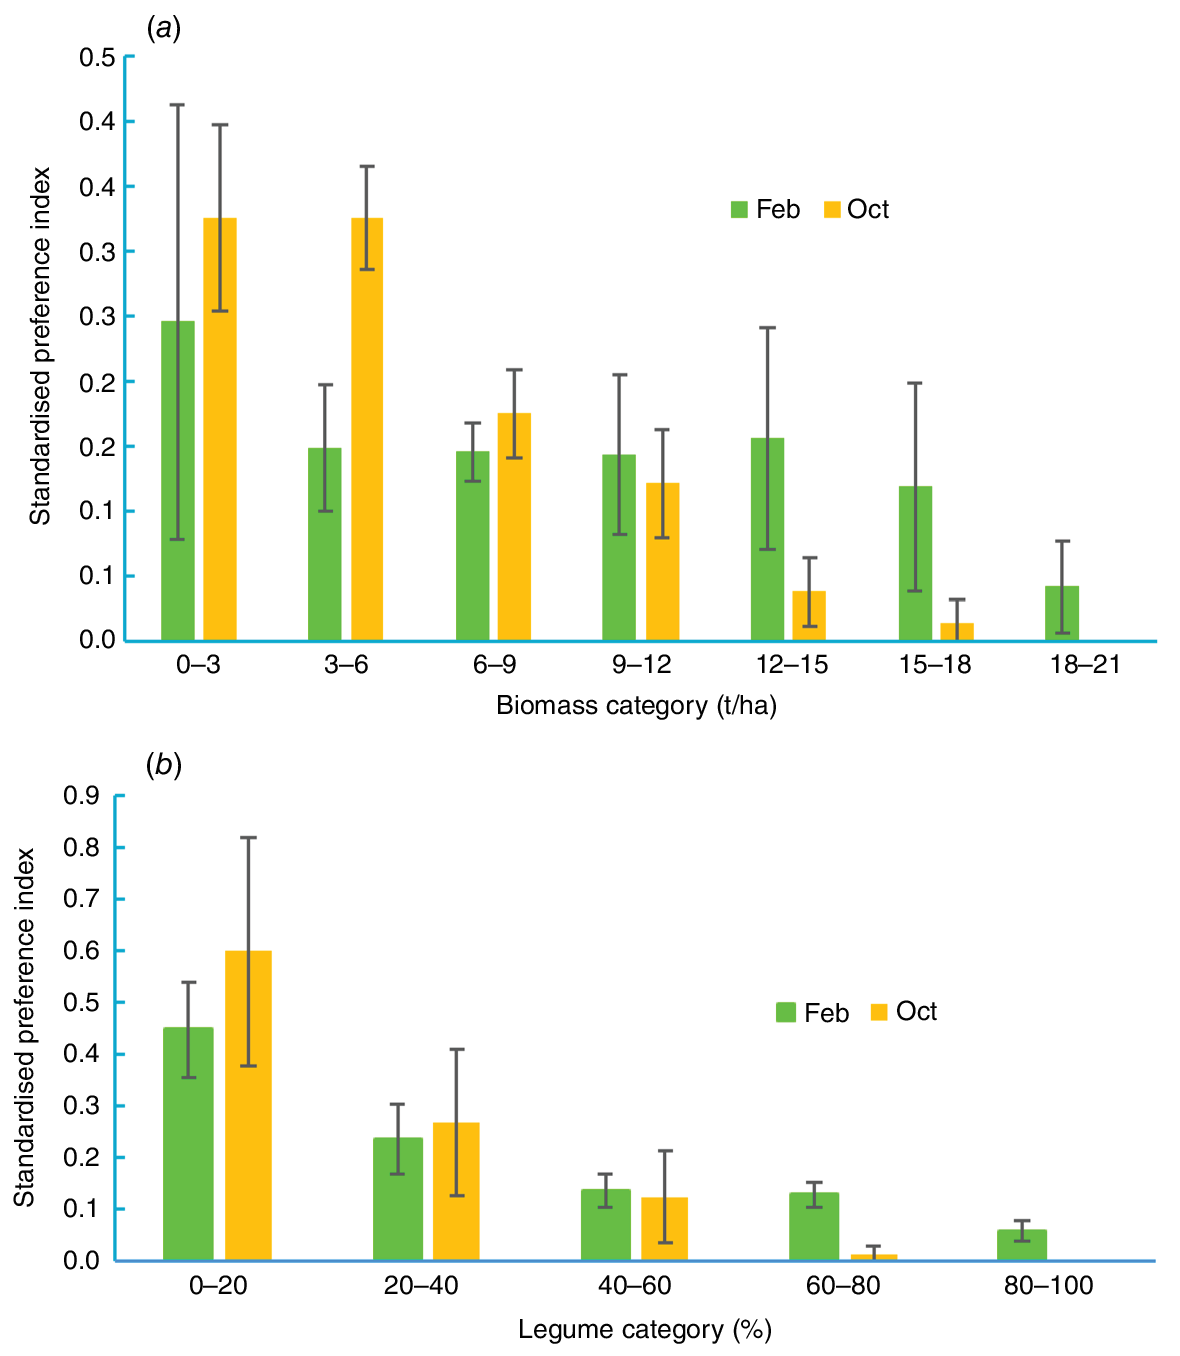
Fig. 5 shows the spatial variation in cattle location within paddocks for both the wet and dry seasons. Visually, there was no apparent effect of performance group on cattle location, so data from four individuals (including both HP and LP heifers) are shown. For all paddocks, there was high heterogeneity in cattle density across paddocks. There were distinct preferences around attractants in the landscape, such as waterpoints, trees and fencelines (Fig. 5). There were also areas in paddocks that cattle avoided completely. The behavioural patterns were quite different between seasons. Standardised preference indices were calculated to determine factors in the landscape that apparently influenced cattle spatial behaviour. In both wet and dry seasons, cattle spent a disproportionate amount of time in areas of low biomass and this was most pronounced in the dry season (Fig. 6a). In both seasons, heifers preferentially selected areas with <20 legume in the pasture (Fig. 6b).
No differences in performance group were detected on rumen fermentation parameters (P > 0.05; Table 4). However, the effect of season was marked. Total rumen VFA concentration averaged 66 mM in the wet season and was reduced by 25% in the dry season (P < 0.001; Table 4). Proportions of acetate and propionate increased in the dry season (P < 0.001), whereas proportions of other VFA declined (P < 0.01). There was an interaction between season and performance group for acetate:propionate ratio (P < 0.05) with wet season acetate:propionate increasing in HP heifers but decreasing in LP heifers (P < 0.05). This was attributed to a trend (P = 0.072) for lower propionate molar % for HP heifers but not LP heifers. Higher dietary N in the wet season resulted in higher faecal N (P < 0.001), rumen ammonia N (P < 0.001) and plasma δ15N than in the dry season. The % non-grass in the diet was higher in the dry season (P < 0.001), even though botanical analysis showed less legume in the paddocks at this time. Non-grass represents all C3 species and includes legumes and weeds. From observation, cattle avoided weeds, and it is assumed that most of the non-grass species consumed were legumes (stylo and desmanthus).
| Item | Low performance | High performance | s.e. | P | |||||
|---|---|---|---|---|---|---|---|---|---|
| Wet | Dry | Wet | Dry | Performance | Season | P × S | |||
| Rumen pH | 6.96 | 7.38 | 6.94 | 7.25 | 0.083 | 0.380 | <0.001 | 0.509 | |
| Rumen ammonia N (mg/dL) | 9.79 | 4.97 | 8.54 | 4.82 | 0.413 | 0.103 | <0.001 | 0.182 | |
| Faecal nitrogen (% DM) | 2.16 | 1.59 | 2.14 | 1.67 | 0.061 | 0.686 | <0.001 | 0.427 | |
| Total VFA (mM) | 63.1 | 49.1 | 65.5 | 52.0 | 3.75 | 0.479 | <0.001 | 0.957 | |
| VFA (molar %) | |||||||||
| Acetate | 71.7 | 74.7 | 72.4 | 74.6 | 0.288 | 0.322 | <0.001 | 0.194 | |
| Propionate | 13.5 | 13.6 | 12.9 | 13.9 | 0.221 | 0.539 | 0.013 | 0.067 | |
| Iso butyrate | 1.32 | 0.792 | 1.26 | 0.717 | 0.051 | 0.188 | <0.001 | 0.917 | |
| Butyrate | 10.7 | 8.96 | 10.8 | 8.96 | 0.352 | 0.891 | <0.001 | 0.895 | |
| Iso valerate | 1.29 | 0.972 | 1.23 | 0.933 | 0.047 | 0.289 | <0.001 | 0.798 | |
| Valerate | 1.07 | 0.680 | 0.973 | 0.632 | 0.065 | 0.263 | <0.001 | 0.689 | |
| Caproate | 0.376 | 0.276 | 0.392 | 0.234 | 0.030 | 0.782 | <0.001 | 0.423 | |
| Acetate:propionate | 5.37 | 5.50 | 5.64 | 5.38 | 0.094 | 0.409 | 0.515 | 0.041 | |
| Plasma δ15N (‰) | 7.73 | 6.84 | 7.73 | 6.90 | 0.141 | 0.830 | <0.001 | 0.863 | |
Data from 32 heifers grazing throughout the trial.
Pen trials
To minimise differences in nutritive value of grazing and pen-fed heifers, the nutritive value of hay was planned to be similar to the nutritive value of the pasture on offer at the time of the pen studies. Thus, the hay fed in Pen trial 2 was of lower nutritive value than hay fed in Pen trial 1. This resulted in cattle having greater intakes and gains in Pen trial 1 than Pen trial 2 (Table 5). Liveweight gain in Pen trial 1 averaged 0.65 kg/day, which was somewhat less than the average LW gain of 0.75 kg/day of their grazing contempories during the wet season. In Pen trial 2, average LW gain was 0.27 kg/day, reflective of the poorer nutritive value of hay, but somewhat higher that the dry-season LW gain of cattle on pasture (0.20 kg/day). Total VFA concentration and molar percentages of VFAs were similar in both pen trials and typical for cattle fed all-roughage diets (Table 6). However, the poorer nutritive value of hay in the second pen trial resulted in apparently higher acetate:propionate ratio. Plasma δ15N was lower in cattle fed the poorer-quality hay (Pen trial 2).
| Item | Pen trial 1 | Pen trial 2 | |
|---|---|---|---|
| Dry-matter intake (kg/day) | 5.93 ± 0.14 | 5.51 ± 0.12 | |
| Dry-matter intake (g/kg LW) | 19.8 ± 0.37 | 14.9 ± 0.30 | |
| Digestible dry-matter intake (kg/day) | 3.63 ± 0.08 | 3.12 ± 0.07 | |
| Metabolisable energy intake (MJ/day) | 52.3 ± 1.22 | 43.6 ± 0.99 | |
| Nitrogen intake (g/day) | 125 ± 3.02 | 99 ± 3.05 | |
| Start LW (kg) | 280 ± 11.1 | 355 ± 6.1 | |
| Mean LW (kg) | 307 ± 11.2 | 369 ± 6.2 | |
| Mean LW0.73 (kg) | 65.4 ± 1.75 | 74.7 ± 0.91 | |
| LW gain regression (kg/day) | 0.65 ± 0.02 | 0.27 ± 0.02 | |
| LW gain difference (kg/day) | 0.65 ± 0.03 | 0.28 ± 0.02 | |
| Feed to gain ratio | 9.1 ± 0.28 | 22.4 ± 2.59 |
| Sample date | Pen trial 1 | Pen trial 2 | |
|---|---|---|---|
| 17 May 2021 | 30 August 2021 | ||
| Dietary N (% DM) | 2.80 ± 0.079 | 2.06 ± 0.084 | |
| Faecal N (% DM) | 1.96 ± 0.074 | 1.47 ± 0.020 | |
| DM digestibility (%) | 61.5 ± 0.41 | 57.5 ± 0.53 | |
| OM digestibility (%) | 62.9 ± 0.41 | 59.1 ± 0.41 | |
| Rumen characteristics | |||
| pH | 6.78 ± 0.079 | 6.97 ± 0.084 | |
| Total VFA (mg/dL) | 64.5 ± 1.99 | 77.6 ± 3.97 | |
| VFA (molar %) | |||
| Acetate | 74.1 ± 0.22 | 76.2 ± 0.29 | |
| Propionate | 14.8 ± 0.046 | 14.1 ± 0.058 | |
| Iso-butyrate | 1.40 ± 0.028 | 1.07 ± 0.078 | |
| Butyrate | 7.23 ± 0.121 | 6.27 ± 0.212 | |
| Iso-valerate | 1.40 ± 0.059 | 1.17 ± 0.074 | |
| Valerate | 0.75 ± 0.024 | 0.86 ± 0.032 | |
| Caproate | 0.34 ± 0.010 | 0.39 ± 0.021 | |
| Acetate:propionate | 5.03 ± 0.075 | 5.44 ± 0.103 | |
| Ammonia N (mg/dL)) | 10.8 ± 0.613 | 4.87 ± 0.057 | |
| Plasma δ15N (‰) | 7.27 ± 0.046 | 5.97 ± 0.089 | |
Fig. 6a shows the relationship between performance on pasture and in pens of only those cattle used in pen studies. Pen trial 1 was conducted predominantly in the wet season and there was a clear Pearson correlation between pasture and pen LW gain (R2 = 0.52). However, this was not the case for Pen trial 2 conducted under dry-season conditions (R2 = 0.13).
Residual feed intake ranged from the most efficient (−0.65 kg/day) to least efficient (+0.55 kg/day), with efficient animals (negative RFI) having a lower DM intake as kg/day (P < 0.01; Table 7). There was no effect of RFI on intake relative to LW, feed:gain ratio, or LW gain (P > 0.05). However, LW gain for heifers before entering pens was higher for low-RFI cattle (P < 0.05). The estimated breeding value for 400-day weights was not different between low- and high-RFI groups. Similarly, there were no differences between groups in diet nutritive value, rumen VFA concentration and molar percentages, pH, rumen ammonia N or plasma δ15N. However, there was trend (P = 0.051) for acetate:propionate ratio to be lower in the low-RFI group.
| Item | Low RFI | High RFI | s.e. | P | |
|---|---|---|---|---|---|
| RFI (kg/day) | −0.23 | +0.17 | 0.051 | <0.001 | |
| DM intake (kg/day) | 5.37 | 5.93 | 0.124 | 0.003 | |
| DM intake (g/kg LW) | 16.8 | 17.4 | 0.838 | 0.623 | |
| Feed to gain ratio | 14.1 | 17.5 | 2.97 | 0.398 | |
| LW gain during pen trials (kg/day) | 0.44 | 0.47 | 0.069 | 0.768 | |
| LW gain before entering pens (kg/day) | 0.68 | 0.54 | 0.044 | 0.026 | |
| 400-day weight estimated breeding value | 23.3 | 24.7 | 1.91 | 0.570 | |
| Faecal N (% DM) | 1.71 | 1.70 | 0.111 | 0.928 | |
| Dietary N (% DM) | 2.22 | 2.54 | 0.156 | 0.138 | |
| DM digestibility (%) | 58.4 | 60.1 | 0.872 | 0.165 | |
| OM digestibility (%) | 59.9 | 61.4 | 0.796 | 0.712 | |
| Rumen characteristics | |||||
| pH | 6.93 | 6.83 | 0.095 | 0.463 | |
| Total VFA (mM) | 81.8 | 77.4 | 4.09 | 0.555 | |
| VFA (molar %) | |||||
| Acetate | 75.7 | 74.7 | 0.411 | 0.072 | |
| Propionate | 14.1 | 14.7 | 0.249 | 0.085 | |
| Iso-butyrate | 1.12 | 1.31 | 0.080 | 0.080 | |
| n-butyrate | 6.71 | 6.75 | 0.250 | 0.907 | |
| Iso-valerate | 1.19 | 1.36 | 0.080 | 0.129 | |
| n-valerate | 0.80 | 0.81 | 0.036 | 0.818 | |
| n-caproate | 0.354 | 0.377 | 0.020 | 0.384 | |
| Acetate:propionate ratio | 5.42 | 5.11 | 0.110 | 0.051 | |
| Ammonia N (mg/dL) | 7.08 | 8.29 | 1.091 | 0.138 | |
| Plasma δ15N (‰) | 6.50 | 6.66 | 0.226 | 0.596 | |
Negative RFI implies high efficiency and positive RFI implies low efficiency.
Discussion
In northern Australia, the seasonal effects on diet and animal performance are important in determining the overall productivity of both the pasture and the animal. Throughout the current trial, heifers performed on average somewhat better than expected for this bioregion (Bortolussi et al. 2005). However, the gains of 145 kg/year observed here can be attained when biomass is non-limiting and the pasture contains appreciable amounts of legume (Coates 1996; Mwangi et al. 2021). The LW gains in the wet season were as expected and averaged 0.74 kg/day, which was more than three times higher than the gains in the dry season. The difference in performance between the top-performing (HP) and bottom-performing (LP) heifers of ~0.05 kg/day was attributed to HP heifers having higher LW gain in the dry season. This observation was different from that observed in a previous trial under similar conditions where top-ranked steers outperformed the low-ranked steers in the wet season rather than the dry season (Charmley et al. 2024). The effect of the interaction between biomass and quality on animal performance is complex; nevertheless, in both trials across a wide range in digestible pasture biomass (0.7–3.7 t/ha), LW gain was between 16% (this trial) and 24% (Charmley et al. 2024) higher for HP cattle.
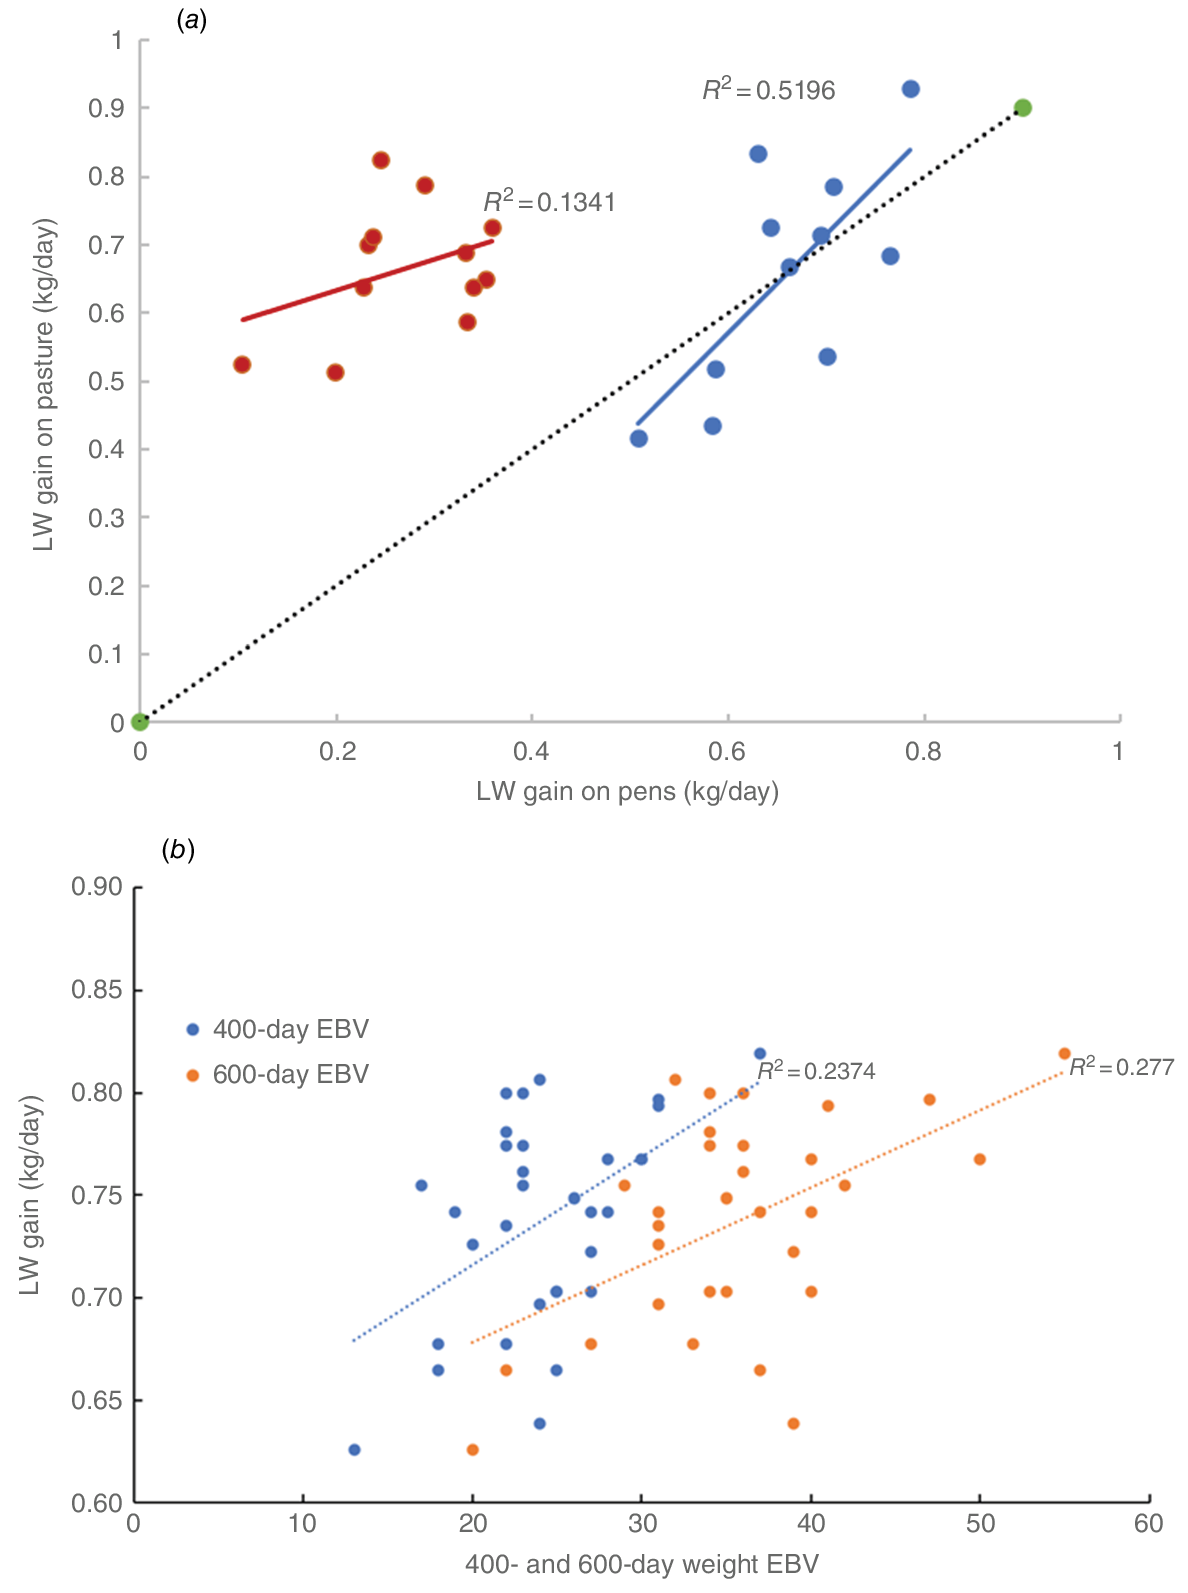
Methods to measure intake on pasture are limited (Charmley et al. 2023). Alkanes were considered as a possible approach, but this method is not suited to long-term measurement over a season. McLennan et al. (2020) developed a model specifically based on northern pasture conditions and this approach suggested that both season and, to a lesser extent, performance influenced intake. The pen trials were designed to further investigate the role of intake on performance under similar dietary conditions, but in the absence of the animals’ grazing selection and behaviour. If there were any relationship between performance in pens and on pasture, a correlation would be expected. For Pen trial 1, when the LW gain of heifers immediately before they entered pens (14 December 2020–8 March 2021) was compared to gains of the same heifers in pens, the correlation (r2) between pasture and pen LW gains was 0.52 (Fig. 7a). For Pen trial 2, a similar comparison between pasture LW gain immediately before cattle entered pens (18 May 2021–28 June 2021) and gain in pens (14 July 2021–6 October 2021) showed a poorer correlation of 0.13 and a large bias. Given the relatively small numbers of cattle used and the variation in diet quality, the dataset has limitations. Nevertheless, the data suggest that for the grazing animal, both environmental factors (e.g. seasonal change in diet availability and quality) and the genetic potential of the animal (as seen in Pen study 1) influence performance.
(a) Relationship between liveweight gain of heifers on pasture and in pens fed hay. The blue data refer to heifers in Pen trial 1 and the red data refer to data in Pen trial 2. LW gain on pasture was measured in the 2 months preceding heifers being moved from pasture to pens. The black line represents unity. (b) Relationship between wet-season LW gain on pasture and 400- and 600-day estimated breeding values.
Pasture and performance
The current trial was unusual in that the pasture biomass was higher in the dry than the wet season. This was attributed to a delayed increase in pasture growth following rain coupled with a low pasture utilisation rate over an 11-month period of higher than average rainfall (1154 vs 881 mm). Notwithstanding the unexpected result for biomass, other variables were typical for wet and dry seasons. The extreme variation in N, digestibility and fibre contents over the grazing period was typical of pastures in the seasonally dry tropics (Ash et al. 1997; Charmley et al. 2024). Dry-season pasture contained more grass and less legume because cattle preferentially selected non-grass (putative legume) over grass in the dry season, thus reducing the proportion of legume in the stranding pasture (Coates 1996). This selectivity was confirmed by the higher non-grass component in faeces in the dry (~25%) than in the wet (~8%) season and has been noted by others (Coates 1996; Tsutsumi et al. 2016). Consequently, the nutritive value of the diet was markedly higher than that of the pasture, and this was especially the case in the dry season.
Cattle are selective grazers and we hypothesised that differences in performance on pasture may be because there is phenotypic variation in selective grazing. For example, Charmley et al. (2024) noted that high-performing cattle selected diets with higher N content and OM digestibility in the wet season, although the differences were quite small and not considered to have a major effect on performance. Although there is little research in this area, Craun (2018), in the Southwest region of the USA, found no evidence for diet selection between low- and high-RFI Brahman-cross heifers by using faecal NIRS. Similarly, Silva et al. (2022) found no selection for legumes over grasses on the basis of faecal C isotope ratios in a western Queensland grazing trial with breeder cows. In the current trial, we were unable to ascribe differences in animal LW gain between LP and HP heifers to differences in diet quality as measured by faecal NIRS. This could simply be a reflection of the small numbers of cattle used in the study (n = 16) and a lack of statistical power; however, the data do support the view of other researchers (Craun 2018; Silva et al. 2022; Charmley et al. 2024) that there is little to no variation among cattle in selection for diets of higher nutritive value.
Grazing behaviour
Approximately 70% of collars operated successfully in each deployment. However, the post hoc assignment of heifers to LP and HP groups restricted the statistical robustness of behavioural data, with just 20 animals suitable for analysis. Furthermore, we had hoped to distinguish grazing form other activities, but the algorithms developed in temperate pastures (Arablouei et al. 2023) were not programmed for the conditions of this trial. McGavin et al. (2018) demonstrated the exponential increase in apparent travel distance as the GPS fix interval decreased. Short fix intervals lead to inflation of the error around fix points, thus artificially inflating the distance travelled. In contrast, long fix intervals fail to accurately account for tortuosity (interpolation error), with true meanderings in walking direction not being accounted for (Schlecht et al. 2004). McGavin et al. (2018) suggested a fix of between 5 and 10 s to be the most accurate representation of true distance travelled, a value in agreement with Schlecht et al. (2004) and Marcus Rowcliffe et al. (2012). In the current study, the 10 s interval resulted in cattle travelling over 20 km in these small (~15 ha) paddocks. These distances were considered unlikely (Charmley et al. 2023). Therefore, in the current trial fix intervals of 30–60 s were assumed to best represent true travelling distance. It was therefore concluded that cattle in this study walked approximately 7–10 km/day. These distances are considerably greater than those recorded previously with longer fix intervals (Russell et al. 2012; Craun 2018). Using the relationships developed by McGavin et al. (2018), it is concluded that at a similar fix interval (60 s), travel distance in grazing beef cattle is typically between 8 and 12 km/day. However, these values will also be affected by paddock size (McGavin et al. 2018) and breed, with Bos indicus genetics being associated with grater activity than taurine cattle (Russell et al. 2012; Craun 2018).
Foraging theory suggests that cattle seek to minimise the energy required to meet their nutritional requirements (Owen-Smith et al. 2010). Thus, it was not surprising that as the nutritive value of the diet declined, the distances travelled by cattle increased because they expended more time sourcing sufficient ME for maintenance and growth. Heifers in the dry season walked an additional 1.75 km in October compared with February (on the basis of 60 s fix interval), with much of this additional activity occurring in the afternoon. Charmley et al. (2024) observed similar travel distance in the early dry season when biomass (5.8 t/ha) was similar to the current results. However, they did note that when biomass dropped below 2 t/ha in the later dry season, travel distance was significantly reduced. As noted by Chacon and Stobbs (1976), it is concluded that when pasture biomass is not limiting, grazing time, and hence travel distance, is influenced by pasture nutritive value; however, when biomass is limiting, cattle will restrict their travel distances. Seasonal variation in travel distances has also been observed in grazing cattle in temperate regions, with activity lower in winter than summer, presumably in response to pasture availability and quality (Russell et al. 2012).
Although a strong seasonal effect on daily distances travelled was apparent, performance group had no effect. A similar result was observed by Craun (2018). We had postulated that differences in performance may have been related to travelling distance. For example, individuals exhibiting greater travel distance may be seeking more nutritious pasture (Hunt et al. 2007). However, our data showed no difference in travel distance between HP and LP cattle. Craun (2018) reached the same conclusion when comparing travel distance of high- and low-FI Angus heifers grazing a 69 ha pasture of warm-season grasses. However, Knight (2016) found that low-RFI breeder cows travelled 0.5 km further than did high-RFI cows.
Rumen fermentation
There were marked differences in rumen fermentation between the wet and dry seasons, but no differences between HP and LP heifers. Total VFA concentration was higher in the wet than the dry season. This response was expected and has been attributed to a more active rumen fermentation driven by increased dietary supply of rumen-degradable N balanced with intake of fermentable carbohydrate (Poppi and McLennan 1995). Acetate:propionate ratios reflect changes in dietary fibre concentration (Nozière et al. 2011). In the dry season, the acetate:propionate ratio was higher in LP heifers than HP heifers. This was consistent with the higher performance typically associated with decreased acetogenesis. However, in the wet season, the opposite effect was observed owing primarily to a higher acetate proportion in HP heifers. Although significant, this small interaction was unlikely to have any meaningful influence on digestion. For instance, pH was consistently above 6.9 and always higher in the dry season. Consistent with a lower N supply to the rumen in the dry season, rumen ammonia-N, iso-acid concentration (indicative of amino acid catabolism), faecal N and blood δ15N were all reduced. Dry-season rumen ammonia-N was considered borderline (<5 mg/dL) for adequate microbial protein synthesis (Satter and Slyter 1974; Bowen et al. 2017).
Cantalapiedra-Hijar et al. (2018) reviewed factors affecting among-animal variation in feed efficiency, some of which, such as N-use efficiency are likely to be more important in grazing animals, particularly under conditions of poor nutrition such as in the dry season of the tropics where dietary N content is typically <0.7% DM (Tothill and Gillies 1992). Silva et al. (2022) used δ15N in tail hairs of reproductive beef cows in western Queensland grazing low-N pastures and showed that animals with low δ15N in the dry season were more efficient than animals with high δ15N, presumably because if increased N-use efficiency. In the current study, where overall N content was >1.5% DM, δ15N in blood was not different between low- and high-growth rate heifers. Silva et al. (2022) concluded that the δ15N method is less useful as an index for feed efficiency in higher-N diets, such as seen in the current study.
Feed efficiency
In the absence of observed nutritional, fermentation or behavioural effects on pasture, the relationship between LW gain and RFI was examined in the pen trial. Negative RFI cattle exhibited lower feed intake and higher pasture growth rate, suggesting that differences in feed efficiency could influence performance. Although RFI ranking on concentrate diets rarely corresponds with ranking on silage or pasture diets (Lawrence et al. 2012; McCann et al. 2014; Kenny et al. 2018), we hoped that feeding hay of similar nutritive value to pasture would minimise the diet-quality effects (Clarke et al. 2009; Durunna et al. 2011). Differences in feed intake, as we observed, are often reputed to account for variation in RFI (Kenny et al. 2018), although in the current trial it may have been compromised by LW, as relative feed intake was not different between low- and high-RFI cattle. The small interaction between season and performance group in rumen VFA ratios suggested an altered rumen microbiome between HP and LP heifers in the dry season. McCann et al. (2014) showed greater abundance of Prevotella in high-RFI Brahman bulls, a finding supported by others (Carberry et al. 2012; Myer et al. 2015). Although the rumen microbiome was not measured in this trial, it is possible that the slight variations in rumen fermentation were reflective of an altered rumen microbiome favouring improved fermentation efficiency in the low-RFI and HP cattle.
It was not possible to directly measure intake on pasture in this trial. McLennan et al. (2020) used a modified version of the PISC (2007) intake model to predict intake of cattle on tropical pastures. Using their model, the predicted intakes for the LP and HP groups, when scaled for LW, tended to be lower for the HP cattle, in agreement with the RFI data from pen studies. However, the quantum of values was considerably higher (~25 g/kg LW) than the measured intakes (~17 g/kg DMI) in pens. Charmley et al. (2023) concluded that equations for estimating pasture were generally unsatisfactory. A reliable method to measure intake on pasture is essential to understanding between-animal variation in performance of grazing animals. The use of on-animal activity sensors to relate grazing behaviours to intake have been developed (Greenwood et al. 2017). However, Charmley et al. (2023) demonstrated that the algorithms must be specific to the grazing environment.
The likelihood that genetics were influencing efficiency of LP and HP heifers, as implied form the RFI data, was supported by the 400- and 600-day LW EBVs. Approximately 25% of the variation in LW gain in the wet season was attributed to 400- and 600-day weight EBVs (Fig. 7b). This effect was not apparent in the dry season, suggesting that genetic differences are masked if nutrition is limiting the animal’s potential for growth.
Conclusions
The results of this research have to be interpreted in relation to the limited number of cattle studied. Thus, it is not possible to conclude unequivocally that certain phenotypic differences were not significant, rather this study was unable to refute the null hypothesis because of low replication. Seasonal variations in pasture biomass and nutritive value have an overriding effect on LW change in growing beef cattle, but within a season, differences still exist among individuals. This study could not demonstrate that some animals selectively grazed herbage of higher nutritive value. In the dry season, LW gains were compromised and no clear relationship between dry-season performance and performance in pens could be discerned. However, in the wet season when diet quality was less restrictive on performance, there was evidence that the higher-performing cattle in pens also performed better on pasture. There was also some evidence that the EBV for 400- and 600-day weight was related to wet-season LW gains, suggesting a genetic component. It is concluded that genetic potential for efficiency on pasture may be modified by the grazing environment.
Data availability
Data used to generate the results in the paper will be shared upon reasonable request to the corresponding author.
Conflicts of interest
Ed Charmley is an Associate Editor of Animal Production Science. To mitigate this potential conflict of interest he had no editor-level access to this manuscript during peer review. The author(s) have no further conflicts of interest to declare.’
Declaration of funding
Funding for this project was provided by Meat and Livestock Australia through the Livestock Productivity Partnership project P.PSH.1000, with co-investment from CSIRO.
Acknowledgements
This paper is dedicated to the memory of Jess Simington, an outstanding colleague who is dearly missed. Technical support and animal husbandry were provided by Elizabeth Hulm, Wayne Flintham, and Steve Austin. Special thanks go to the Lyons family, Wambiana, for sharing data and support with provision of cattle.
References
Arablouei R, Wang L, Currie L, Yates J, Alvarenga FAP, Bishop-Hurley GJ (2023) Animal behavior classification via deep learning on embedded systems. Computers and Electronics in Agriculture 207, 107707.
| Crossref | Google Scholar |
Ash AJ, McIvor JG, Mott JJ, Andrew MH (1997) Building grass castles: integrating ecology and management of Australia’s tropical tallgrass rangelands. The Rangeland Journal 19, 123-14.
| Crossref | Google Scholar |
Bortolussi G, McIvor JG, Hodgkinson JJ, Coffey SG, Holmes CR (2005) The northern Australian beef industry, a snapshot. 3. Annual liveweight gains from pasture based systems. Australian Journal of Experimental Agriculture 45, 1093-1108.
| Crossref | Google Scholar |
Bowen MK, Poppi DP, McLennan SR (2017) Efficiency of rumen microbial protein synthesis in cattle grazing tropical pastures as estimated by a novel technique. Animal Production Science 57, 1702-1712.
| Crossref | Google Scholar |
Cantalapiedra-Hijar G, Ortigues-Marty I, Sepchat B, Agabriel J, Huneau JF, Fouillet H (2015) Diet–animal fractionation of nitrogen stable isotopes reflects the efficiency of nitrogen assimilation in ruminants. British Journal of Nutrition 113, 1158-1169.
| Crossref | Google Scholar | PubMed |
Cantalapiedra-Hijar G, Abo-Ismail M, Carstens GE, Guan LL, Hegarty R, Kenny DA, McGee M, Plastow G, Relling A, Ortigues-Marty I (2018) Review: biological determinants of between-animal variation in feed efficiency of growing beef cattle. Animal 12(S2), s321-s335.
| Crossref | Google Scholar | PubMed |
Carberry CA, Kenny DA, Han S, McCabe MS, Waters SM (2012) Effect of phenotypic residual feed intake and dietary forage content on the rumen microbial community of beef cattle. Applied and Environmental Microbiology 78, 4949-4958.
| Crossref | Google Scholar | PubMed |
Chacon E, Stobbs TH (1976) Influence of progressive defoliation of a grass sward on the eating behaviour of cattle. Australian Journal of Agricultural Research 27, 709-727.
| Crossref | Google Scholar |
Chaney AL, Marbach EP (1962) Modified reagents for determination of urea and ammonia. Clinical Chemistry 8, 130-132.
| Crossref | Google Scholar | PubMed |
Charmley E, Thomas D, Bishop-Hurley GJ (2023) Revisiting tropical pasture intake: what has changed in 50 years? Animal Production Science 63, 1851-1865.
| Crossref | Google Scholar |
Charmley E, Bishop-Hurley GJ, McSweeney CS, Takeuchi R, Martinez-Fernandez G, Denman S (2024) Factors influencing the variability in performance of cattle grazing tropical pasture. Animal Production Science 64, AN24203.
| Crossref | Google Scholar |
Clarke AM, Drennan MJ, McGee M, Kenny DA, Evans RD, Berry DP (2009) Intake, growth and carcass traits in male progeny of sires differing in genetic merit for beef production. Animal 3, 791-801.
| Crossref | Google Scholar | PubMed |
Coates DB (1996) Diet selection by cattle grazing Stylosanthes-grass pastures in the seasonally dry tropics: effect of year, season, stylo species and botanical composition. Australian Journal of Experimental Agriculture 36, 781-789.
| Crossref | Google Scholar |
Coates DB, Dixon RM (2011) Developing robust faecal near infrared spectroscopy calibrations to predict diet dry matter digestibility in cattle consuming tropical forages. Journal of Near Infrared Spectroscopy 19, 507-519.
| Crossref | Google Scholar |
Cressie N (1990) The origins of Kriging. Mathematical Geology 22, 239-252.
| Crossref | Google Scholar |
Durunna ON, Mujibi FDN, Goonewardene L, Okine EK, Basarab JA, Wang Z, Moore SS (2011) Feed efficiency differences and reranking in beef steers fed grower and finisher diets. Journal of Animal Science 89, 158-167.
| Crossref | Google Scholar | PubMed |
Gaden B (2005) Identifying live animal condition scoring systems for the Australian livestock export industry. Final Report, Project LIVE.120. Meat and Livestock Australia, Sydney, NSW, Australia. Available at https://www.mla.com.au/contentassets/c66b3ffdfe0d416f8683daa115518ae1/live.120_final_report.pdf
Gagen EJ, Wang J, Padmanabha J, Liu J, de Carvalho IPC, Liu J, Webb RI, Al Jassim R, Morrison M, Denman SE, McSweeney CS (2014) Investigation of a new acetogen isolated from an enrichment of the tammar wallaby forestomach. BMC Microbiology 14, 314.
| Crossref | Google Scholar |
Greenwood PL, Paull DR, McNally J, Kalinowski T, Ebert D, Little B, Smith DV, Rahman A, Valencia P, Ingham AB, Bishop-Hurley GJ (2017) Use of sensor-determined behaviours to develop algorithms for pasture intake by individual grazing cattle. Crop & Pasture Science 68, 1091-1099.
| Crossref | Google Scholar |
Hunt LP, Petty S, Cowley R, Fisher A, Ash AJ, MacDonald N (2007) Factors affecting the management of cattle grazing distribution in northern Australia: preliminary observations on the effect of paddock size and water points1. The Rangeland Journal 29, 169-179.
| Crossref | Google Scholar |
Kenny DA, Fitzsimons C, Waters SM, McGee M (2018) Invited review: improving feed efficiency of beef cattle – the current state of the art and future challenges. Animal 12, 1815-1826.
| Crossref | Google Scholar | PubMed |
Langlands JP, Sanson J (1976) Factors affecting the nutritive value of the diet and the composition of rumen fluid of grazing sheep and cattle. Australian Journal of Agricultural Research 27, 691-707.
| Crossref | Google Scholar |
Lawrence P, Kenny DA, Earley B, McGee M (2012) Grazed grass herbage intake and performance of beef heifers with predetermined phenotypic residual feed intake classification. Animal 6, 1648-1661.
| Crossref | Google Scholar | PubMed |
Marcus Rowcliffe J, Carbone C, Kays R, Kranstauber B, Jansen PA (2012) Bias in estimating animal travel distance: the effect of sampling frequency. Methods in Ecology and Evolution 3, 653-662.
| Crossref | Google Scholar |
McCann JC, Wiley LM, Forbes TD, Rouquette FM, Tedeschi LO (2014) Relationship between the rumen microbiome and residual feed intake-efficiency of brahman bulls stocked on bermudagrass pastures. PLoS ONE 9, e91864.
| Crossref | Google Scholar |
McGavin SL, Bishop-Hurley GJ, Charmley E, Greenwood PL, Callaghan MJ (2018) Effect of GPS sample interval and paddock size on estimates of distance travelled by grazing cattle in rangeland, Australia. The Rangeland Journal 40, 55-64.
| Crossref | Google Scholar |
McLennan S, McLean I, Paton C (2020) Re-defining the animal unit equivalence (AE) for grazing ruminants and its application for determining forage intake, with particular relevance to the northern Australian grazing industries. Project B.GBP.0036 Final Report. Meat & Livestock Australia, Sydney, NSW, Australia.
Mulliniks JT, Cope ER, McFarlane ZD, Hobbs JD, Waterman RC (2016) Drivers of grazing livestock efficiency: how physiology, metabolism, experience and adaptability influence productivity. Journal of Animal Science 94, 111-119.
| Crossref | Google Scholar |
Mwangi FW, Gardiner CP, Walker G, Hall TJ, Malau-Aduli BS, Kinobe RT, Malau-Aduli AEO (2021) Growth performance and plasma metabolites of grazing beef cattle backgrounded on buffel or buffel-desmanthus mixed pastures. Animals 11, 2355.
| Crossref | Google Scholar |
Myer PR, Smith TPL, Wells JE, Kuehn LA, Freetly HC (2015) Rumen microbiome from steers differing in feed efficiency. PLoS ONE 10, e0129174.
| Crossref | Google Scholar |
Nozière P, Glasser F, Sauvant D (2011) In vivo production and molar percentages of volatile fatty acids in the rumen: a quantitative review by an empirical approach. Animal 5, 403-414.
| Crossref | Google Scholar | PubMed |
Owen-Smith N, Fryxell JM, Merrill EH (2010) Foraging theory upscaled: the behavioural ecology of herbivore movement. Philosophical Transactions of the Royal Society B: Biological Sciences 365, 2267-2278.
| Crossref | Google Scholar |
Poppi DP, McLennan SR (1995) Protein and energy utilization by ruminants at pasture. Journal of Animal Science 73, 278-290.
| Crossref | Google Scholar | PubMed |
Russell ML, Bailey DW, Thomas MG, Witmore BK (2012) Grazing distribution and diet quality of Angus, Brangus, and Brahman cows in the Chihuahuan Desert. Rangeland Ecology & Management 65, 371-381.
| Crossref | Google Scholar |
Satter LD, Slyter LL (1974) Effect of ammonia concentration on rumen microbial protein production in vitro. British Journal of Nutrition 32, 199-208.
| Crossref | Google Scholar | PubMed |
Schlecht E, Hülsebusch C, Mahler F, Becker K (2004) The use of differentially corrected global positioning system to monitor activities of cattle at pasture. Applied Animal Behaviour Science 85, 185-202.
| Crossref | Google Scholar |
Searle KR, Hunt LP, Gordon IJ (2010) Individualistic herds: individual variation in herbivore foraging behavior and application to rangeland management. Applied Animal Behaviour Science 122, 1-12.
| Crossref | Google Scholar |
Silva LFP, Hegarty RS, Meale SJ, Costa DAF, Fletcher MT (2022) Using the natural abundance of nitrogen isotopes to identify cattle with greater efficiency in protein-limiting diets. Animal 16, 100551.
| Crossref | Google Scholar |
Stifkens A, Matthews EM, McSweeney CS, Charmley E (2022) Increasing the proportion of Leucaena leucocephala in hay-fed beef steers reduces methane yield. Animal Production Science 62, 622-632.
| Crossref | Google Scholar |
Thomas DT, Milton JTB, Revell CK, Ewing MA, Dynes RA, Murray K, Lindsay DR (2010) Preference of sheep among annual legumes is more closely related to plant nutritive characteristics as plants mature. Animal Production Science 50, 114-123.
| Crossref | Google Scholar |
Tomkins NW, O’Reagain PJ (2007) Global positioning systems indicate landscape preferences of cattle in the subtropical savannas. Rangeland Journal 29, 217-222.
| Google Scholar |
Topps JH (1969) Nutritional problems of livestock production from semi-arid grasslands in the tropics. Grass and Forage Science 24, 250-257.
| Crossref | Google Scholar |
Tsutsumi M, Takahashi Y, Emoto S, Ito N, Otani I, Matsumoto K (2016) Component-based quantification and prediction of diet selection by cattle grazing on multi-species communities. Grassland Science 62, 12-20.
| Crossref | Google Scholar |
Varva M, Ganskopp D (1998) Grazing behavior in ungulates: current concepts and future challenges. Annals of the Arid Zone 37, 319-335.
| Google Scholar |