Archetypes and change in wildfire risk perceptions, behaviours and intentions among adults in Tasmania, Australia
Sharon L. Campbell A * , Grant J. Williamson
  B , Fay H. Johnston A C and David M. J. S. Bowman
  B
B
A
B
C
Abstract
Anthropogenic climate change globally increases wildfire risk. Understanding how wildfire threats impact community-wide risk perceptions and response options will critically inform resilience education strategies.
To gain an increased understanding of wildfire risk perceptions and self-evacuation intentions among residents in the wildfire-prone state of Tasmania, Australia.
We co-designed survey questions with stakeholders from emergency management, health and community recovery, using a computer-aided telephone interview to survey residents over 18 years of age. Numerical classification analysis, linear regression and descriptive statistics were used to analyse survey data.
We identified four archetypes – the ‘immediate leaver’, ‘prepared stayer’, ‘unprepared leaver’ and ‘informed leaver’, each with distinct sociodemographic characteristics. Key variables were gender, age, location and income, with women most likely to leave and lower-income householders from rural areas most likely to stay. Previous wildfire experience and owning a home were significantly associated with increased preparedness actions. Compared to 2016, we found a significant increase in the proportion of residents intending to leave their property, with rural men least likely and urban women most likely to leave.
Recent education campaigns have likely driven increases in wildfire threat-related self-evacuation, yet the existence of distinct archetypes argues for more tailored messaging and education programs.
Keywords: bushfire, evacuation, preparation, risk, smoke, social geography, social survey, wildfire.
Introduction
Globally elevated wildfire risk to human communities is driven by numerous interacting factors. These include an increasing number of days of extreme heat, extended drought, and longer fire seasons due to a warming climate (Bowman et al. 2020; Intergovernmental Panel on Climate Change 2022), and an increasing expansion of the wildland–urban interface (WUI) regions exacerbating the risk to communities located in these zones (McLennan et al. 2019; Koksal et al. 2020). This risk is driven in part by the past success of suppression of smaller fires in these regions, leading to excessive fuel loads which feed larger fires that defy suppression – a concept described as the ‘wildfire paradox’ (Ingalsbee 2017). In this context, understanding community perceptions of wildfire risk, and how these may influence response options and actions during a wildfire event, are vital to policymakers when planning community education and engagement programs aiming to build resilience and reduce loss of life in a wildfire emergency.
Unlike other fire-prone regions globally, Australia does not have mandatory, government-organised evacuation and relocation policies related to wildfire threat (McLennan et al. 2019), making self-evacuation a widely understood and accepted response. Nationwide community advice is provided through the Australian Fire Danger Rating System (AFDRS), which outlines four levels of wildfire risk rating and an associated set of recommended actions (National Emergency Management Agency 2024). Furthermore, Australian government agencies consider natural disaster mitigation and adaptation actions a ‘shared responsibility’ between individual landowners and authorities (Commonwealth of Australia 2011, 2018), however recent studies highlight the significant challenges associated with this narrative in relation to wildfires (Cooper et al. 2020; McDonald and McCormack 2022). Communities in fire-prone regions of Australia therefore ideally need to have an informed understanding of their risks and options, in order to facilitate safe decision-making under the threat of a wildfire event, especially given the heightened risk of more extreme fire behaviour associated with climate change. In parallel, policymakers need to understand how local community members understand, evaluate and respond to their risks, and how these perceptions have changed over time, in order to provide targeted, timely and relevant information and community messaging.
The current understanding of community perceptions, behaviours, preparedness and response actions associated with wildfire risk is mixed, complex and incomplete, with much still to learn (Ahmed and Ledger 2023). For example, a review of 10 studies by Koksal et al. (2019) found only a small overall correlation between risk perception and risk mitigation actions related to wildfire, with a wide variation between individuals. Howe et al. (2024) recently identified that an individual’s world view more accurately predicts their support for wildfire risk mitigation actions than wildfire experience, while Haghani et al. (2022) identified a major knowledge gap in understanding human behaviour related to wildfires, especially in risk perception.
One method of achieving a more nuanced and comprehensive understanding of community characteristics and response actions related to a wildfire threat is by defining archetypes from the studied population. Originally conceived by Carl Jung, archetypes embody a ‘typical character’ which is universally understood in a social and cultural context (Jung 2014). Examples of commonly understood literary archetypes include the ‘villain’, the ‘victim’ and the ‘scapegoat’. Archetypes are routinely used in market research to summarise demographic categories (Dominici et al. 2016), and this approach has previously been used in studies of human behaviour associated with wildfire both in Australia (Strahan et al. 2018) and the United States (Paveglio et al. 2014) to help understand preparedness levels, decision-making and leave intentions for a community. An understanding of local archetypes may assist in developing policy, communication, and messaging for more targeted intervention approaches.
Also required is understanding how community-wide attitudes to wildfire threat are changing. We would expect that there is heightened awareness of wildfire threats given the combined effect of targeted education campaigns and wide media reporting of global wildfire disasters. To our knowledge, however, there are no published longitudinal studies of changes to community-wide attitudes to wildfire threat and response behaviours.
The aim of this study therefore was to gain an increased understanding of wildfire self-evacuation intentions over time, alongside current perceptions, understanding, and behaviours associated with wildfire risk and threat for residents in the highly wildfire-prone jurisdiction of Tasmania, Australia.
Setting
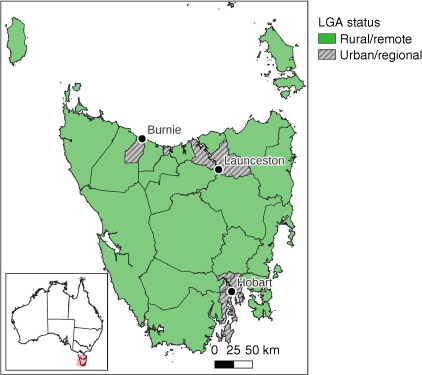
Tasmania is an island state situated off the south coast of Australia, with an estimated population of 571,500 in 2022 (Australian Bureau of Statistics 2022). There are 29 local government areas (LGAs), with the major population centres of Hobart in the south, Launceston in the north and Burnie-Devonport in the northwest comprising the urban regions (see Fig. 1). Tasmania is largely classified as regional and remote (Australian Bureau of Statistics 2011).
Map of Tasmania, Australia, showing urban/regional and rural/remote local government areas and major population centres.
With substantial areas of bushland extending across the state, approximately 98% of Tasmania’s land area is classed as fire-prone (Tasmania Fire Service 2022a). Fire risk is distributed across both urban and regional/remote areas (Campbell et al. 2024). Wildfire is considered to have the highest risk profile of all natural hazards in Tasmania (White et al. 2016), with recent major uncontrolled fires occurring in 2013 (Dunalley-Forcett, Lake Repulse, Giblin River and Bicheno fires), 2016 (North West fires) and 2019 (Gell River, Riveaux Road and Miena fires) (Bowman et al. 2022). Furthermore, and in line with other increasing fire risks globally, Tasmania’s wildfire risk is projected to increase in a warming climate, with likely increases in air temperature and soil dryness, longer warm seasons and earlier season occurrences of dry lightning ignitions, all contributing to greater frequency and intensity of wildfire events (Fox-Hughes et al. 2014; Love et al. 2017; Remenyi et al. 2022).
The 2016 Tasmanian Population Health Survey (TPHS) found that for those living in a location at risk of wildfire, fewer than a third (31.5%) planned to leave immediately when a wildfire was burning near their home (Department of Health and Human Services Tasmania 2016; Campbell et al. 2024), despite this being the primary protective advice from government authorities in a wildfire event (Tasmania Fire Service 2022b). Furthermore, current understanding of wildfire risk perception in Tasmania is relatively limited, with Lucas et al. (2022) finding that residents in the highly fire-prone city of Hobart had concerns appropriate to biophysical risks, but these did not necessarily translate into preparedness actions.
Methods
2023 survey instrument development
Survey questions were developed following a co-design workshop process involving various state agencies and key stakeholders in the disaster preparedness, community recovery and emergency management sector, including the Tasmania Fire Service, Tasmanian State Fire Management Council, Tasmanian Department of Health, Natural Hazards Research Australia, Local Government Association of Tasmania, the local councils and Australian Red Cross. Pilot questions were tested with all workshop attendees and a sample of other relevant parties (for example, Australian Red Cross volunteers), and further refined. Survey questions covered areas of interest to stakeholders including wildfire risk, self-evacuation intentions (including influences on evacuation intentions and preferred evacuation destinations), wildfire preparedness, information sources, understanding of and actions associated with a Catastrophic Fire Danger rating, and actions associated with smoke exposure. For a full list of survey questions, see Supplementary Material S1.
2023 survey methodology
We implemented a computer-aided telephone interview (CATI) survey of Tasmanian residents over 18 years of age. Survey participants were drawn from a research panel and cold calling of publicly available listings, with target responses set at 1500 participants. Quotas were established for age, gender and location to ensure accurate population representation. An incentive was offered to all participants in the form of an opportunity to win a gift voucher. The survey took place from September to November 2023, the austral spring several years after any major wildfires in Tasmania. For questions relating to wildfire knowledge, understanding, perceptions and actions, participants were able to make more than one response choice from a preset list, and given the opportunity to make additional alternative choices.
2016 Tasmanian population health survey
The TPHS is an anonymous, representative, population-based survey conducted every 3 years by the Tasmanian Department of Health. The survey collects data on various sociodemographic variables and health risks, behaviours and outcomes, and for the first time in 2016, data were also collected on wildfire risk and wildfire self-evacuation intentions. Due to resource limitations, the wildfire-related survey questions posed in 2016 have not been repeated in subsequent Tasmanian population health surveys. Therefore, wildfire-related questions included in the 2016 TPHS were repeated in the 2023 survey (see Box 1). Note, the definition of wildfire risk used here (living within 100 metres of bushland larger than 100 m × 100 m) is the one used by the Tasmania Fire Service (Tasmania Fire Service 2022a), and based on research demonstrating that 85% of fatalities occur within 100 m of bushland edge (Blanchi et al. 2014).
For analysis purposes, options (a)–(c) were categorised as ‘leave’, options (d)–(f) were categorised as ‘stay’, and options (g)–(i) were grouped together. Respondents who answered ‘Yes’ to Question A were also asked if they had undertaken any preparedness actions related to wildfires, and if so, what these were. If they had not undertaken preparedness actions, they were asked about the main reasons preparedness actions had not been undertaken.
Data analysis
Archetypes were identified through hierarchical clustering of survey participants who identified as having a home bushfire risk (i.e. answered ‘Yes’ to Question A in Box 1). All analyses were performed in R v4.3.0 (R Core Team 2021). Further information on cluster analysis methodology is found in Supplementary Material S2.
To assess initial associations amongst variables in the 2023 survey, we conducted two correlation calculations using the corrgram package in R (Wright 2021). Two correlation calculations were required as the preparedness status variable was a pure subset of the home wildfire risk variable. The first calculation analysed home wildfire risk, leave intention, age, previous wildfire experience, gender, income and home ownership status (see Supplementary Material S3, Supplementary Fig. S1). The second calculation analysed preparedness, leave intention, age, previous wildfire experience, gender, income and home ownership status (see Supplementary Material S3, Supplementary Fig. S2).
We also used log binomial regression to calculate the association between (i) self-evacuation intention (leave or stay) and selected sociodemographic variables (gender, age, income, resident location, home ownership status, wildfire risk at home, and previous experience with a wildfire), and (ii) preparedness status (yes or no) and selected sociodemographic variables (gender, age, income, resident location, home ownership status, and previous experience with a wildfire). Risk ratios (RR) and 95% confidence intervals (CI) were estimated. The following models were used:
Proportions of respondents to each sociodemographic variable were described, comparing to Tasmanian data where available. Proportions of responses to each major survey question were also described using bar plots (see Supplementary Materials S4–S9, Supplementary Figs S3–S12). Given the previously established strong gender influence on self-evacuation intention decisions in Tasmania (Campbell et al. 2024), further analysis by gender was performed for selected results, including influences on intentions to leave home during a wildfire event, preferred evacuation destinations, sources of information, and actions associated with a Catastrophic Fire Danger rating. Where analysis between 2016 data and 2023 data was possible, these values were compared and analysed by gender and/or region.
Results
Sociodemographic characteristics
The 2023 survey had a total of 1508 respondents, with the majority (95.4%) drawn from a research panel, and the remainder from publicly available listings. The survey had an overall response rate of 32%. Three hundred and nine Tasmanian suburbs were represented from a total of 776 suburbs, with close representation across age and gender for each region using Australian Bureau of Statistics (ABS) population data (Australian Bureau of Statistics 2022). Sociodemographic characteristics of survey participants and comparison against key population data (where available) are listed in Table 1, showing a relative homogeneity between the survey cohort and the Tasmanian population.
| Characteristic | n (%age) | Tasmania (%age) A | |
|---|---|---|---|
| Region | |||
| South | 826 (54.8%) | 50% | |
| North | 403 (26.7%) | 34% | |
| North West | 279 (18.5%) | 16% | |
| Classification | |||
| Urban/regional | 1022 (67.8%) | 65.9% | |
| Rural/remote | 486 (32.2%) | 34.1% | |
| Gender | |||
| Male | 668 (44.3%) | 49% | |
| Female | 829 (55.0%) | 51% | |
| Non-binary | 6 (0.4%) | ||
| Use a different term | 3 (0.2%) | ||
| Prefer not to say | 2 (0.1%) | ||
| Age | |||
| 18–24 years | 94 (6.2%) | 7% | |
| 25–34 years | 202 (13.4%) | 18% | |
| 35–44 years | 281 (18.6%) | 15% | |
| 45–54 years | 289 (19.2%) | 16% | |
| 55–64 years | 277 (18.4%) | 18% | |
| 65+ years | 365 (24.2%) | 26% | |
| Home ownership status | |||
| Own home with a mortgage | 581 (38.5%) | ||
| Own home with no mortgage | 559 (37.1%) | ||
| Rent | 337 (22.3%) | ||
| Other | 20 (1.3%) | ||
| NA/Prefer not to say | 11 (0.8%) | ||
| Household income (before tax) | |||
| Less than $20,000 | 70 (4.6%) | ||
| $20,000 to less than $50,000 | 277 (18.4%) | ||
| $50,000 to less than $100,000 | 383 (25.4%) | ||
| $100,000 to less than $150,000 | 324 (21.5%) | ||
| $150,000 or more | 306 (20.3%) | ||
| Unsure | 60 (4.0%) | ||
| Prefer not to say | 88 (5.8%) | ||
| Have had a direct experience with wildfire | |||
| Yes | 702 (46.6%) | ||
| No | 803 (53.2%) | ||
| Unsure | 3 (0.2%) | ||
Cluster analysis
When asked if their home was in an area at risk of a wildfire in the 2023 survey (see Box 1, Question A), 41.5% (n = 626) of participants responded ‘Yes’ and 57% (n = 860) of participants responded ‘No’. Twenty-two respondents (1.5%) responded ‘Unsure’. A cluster analysis was performed for those that identified as being at risk (i.e. responded ‘Yes’ to Question A). Cluster analysis revealed four distinct clusters or groups (see Fig. 2). Based on survey responses, each group demonstrated clear patterns and reasons for self-evacuation intention, enabling the development and characterisation of four archetypes.
Dendrogram showing node height, calculated by agglomerative clustering with Ward’s distance. Leaf nodes coloured by leave intention, where red = stay, green = leave.
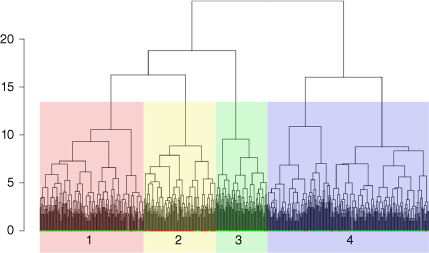
Based on the top five variables by group (see Supplementary Material S2, Supplementary Table S1), and using Fig. 3 below, each group can be characterised to an archetype as follows:
Group 1 (red; n = 167) – the ‘immediate leavers’ strongly tended towards (i) leaving in response to a threat and (ii) being uninfluenced by official warnings or visual cues. Group 1 tended to be female, reside in urban areas and own their own home.
Group 2 (yellow; n = 116) – the ‘prepared stayers’ were (i) ready to stay in response to a threat (ii) prepared for wildfire threat, and (iii) not influenced by official warnings or visual cues. Group 2 tended to be male, rural, older, have less income, own their home, and have greater bushfire experience than other groups.
Group 3 (green; n = 83) – the ‘unprepared leavers’ tended to (i) leave at the threat of a wildfire, (ii) be unprepared, and (iii) have less comprehension of warnings. Group 3 tended to be more urban, younger, have greater income, rent their property, and have less bushfire experience than other groups.
Group 4 (purple; n = 260) – the ‘informed leavers’ tended to (i) leave at the threat of a wildfire, and (ii) be influenced by warnings and advice. Group 4 tended to be female and reside in urban areas.
Proportions of various sociodemographic characteristics for each cluster: (a) gender; (b) location; (c) age category; (d) income category; (e) home ownership status; (f) previous wildfire experience; (g) leave intention; and (h) preparedness actions.
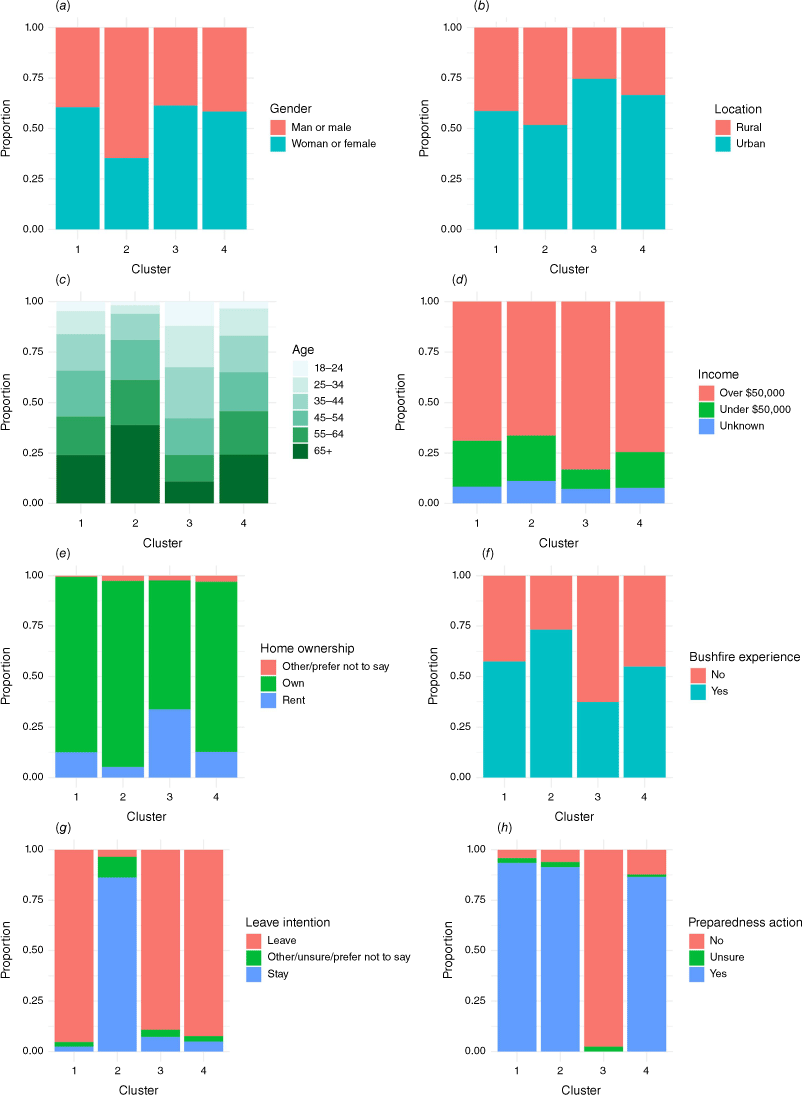
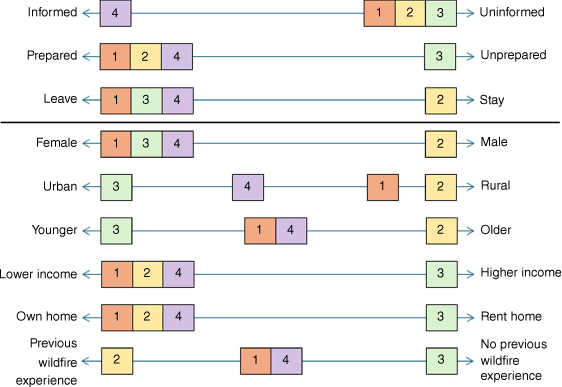
Fig. 3 shows proportions of various sociodemographic characteristics for each group, while Fig. 4 shows how each group compares to other groups across various categories (above the line) and sociodemographic variables (below the line). Significant differences in gender occur between Group 2 and Groups 1, 3 and 4; in home ownership between Group 3 and Groups 1, 2 and 4; and in resident location between Group 2 and Groups 3 and 4 (see Table 2).
Spectrum of responses by archetype across the categories of informed/uninformed, prepared/unprepared and leave/stay above the line, and sociodemographic variables of female/male; urban/rural; younger/older; lower/high income; own/rent home, and no/previous wildfire experience below the line, where 1 = immediate leavers; 2 = prepared stayers; 3 = unprepared leavers; and 4 = informed leavers. Colour codes follow classification of archetypes in Fig. 2.
| Variable | Group 1 | Group 2 | Group 3 | Group 4 | Analysis type and significance | |
|---|---|---|---|---|---|---|
| Gender A | (a) 40% Male | (b) 65% Male | (a) 39% Male | (a) 42% Male | ANOVA P < 0.01, df = 3 | |
| Income | 75% > $50,000 | 74% > $50,000 | 90% > $50,000 | 80% > $50,000 | ANOVA P < 0.05, df = 3 | |
| Home ownership A | (a) 87% Home owner | (a) 92% Home owner | (b) 64% Home owner | (a) 84% Home owner | ANOVA P < 0.01, df = 3 | |
| Urban/Rural B | (ab) 41% Rural | (a) 48% Rural | (b) 25% Rural | (b) 33% Rural | ANOVA P < 0.01, df = 3 | |
| Previous bushfire experience A | (b) 57% bushfire experience | (a) 73% bushfire experience | (c) 37% bushfire experience | (b) 55% bushfire experience | ANOVA P < 0.01, df = 3 | |
| Modal age category | 65+ | 65+ | 35–44 | 65+ | Significantly different age distribution (chi squared P < 0.01, df = 15) |
Regression analysis
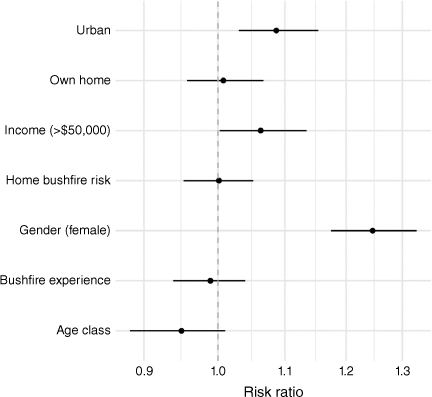
Regression analysis for self-evacuation intention in 2023 demonstrated that women were significantly more likely to leave (RR = 1.25, 95% CI (1.17–1.33)), as were those living in an urban area (RR = 1.09, 95% CI (1.03–1.15)). Those living in a household with an income above $50,000 were also more likely to leave, although this fell marginally outside statistical significance (RR = 1.06, 95% CI (1.00–1.13)) (see Fig. 5 and Supplementary Material S10, Supplementary Table S2). Age, wildfire risk at home, previous wildfire experience and home ownership status were not clearly associated with a leave intention.
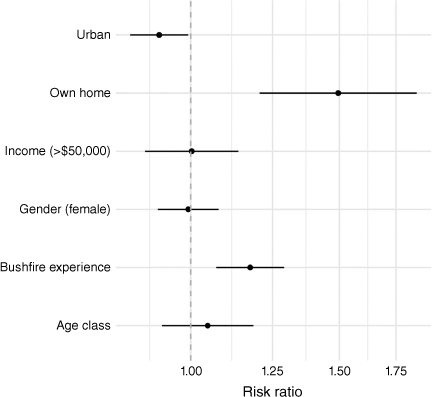
Regression analysis demonstrated that undertaking preparedness actions was significantly associated with previous direct experience with a wildfire (RR = 1.18, 95% CI (1.08–1.28)) as was owning a home as opposed to renting (RR = 1.49, 95% CI (1.22–1.84)). Living in an urban area was significantly and negatively associated with preparedness actions (RR = 0.92, 95% CI (0.86–0.98)). Gender, age and income were not associated with undertaking wildfire preparedness actions (see Fig. 6 and Supplementary Material S11, Supplementary Table S3).
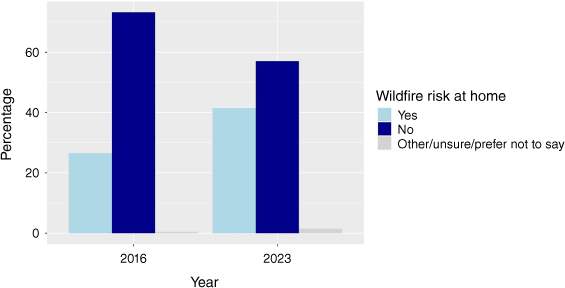
In the 2023 survey, a greater proportion of participants (42%) identified as living in an area at risk of a wildfire than in the 2016 TPHS (29%), with a statistically significant association between year and wildfire risk at home (χ2(1) = 92.4, P < 0.001) (see Supplementary Material S12, Supplementary Table S4 for full results). Fig. 7 shows a comparison between responses from the 2016 TPHS and this 2023 survey.
Self-reported home wildfire risk,A Tasmania, Australia (2016 and 2023).
AHome wildfire risk refers to living within 100 m of bushland larger than about 1 ha (100 m × 100 m).
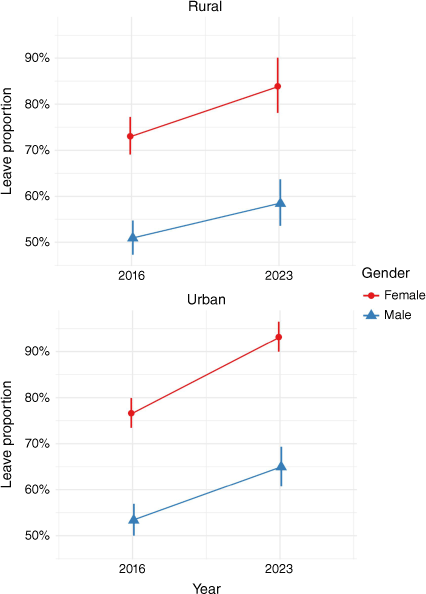
In both 2016 and 2023 surveys, if a participant responded ‘Yes’ to being in an area at risk from wildfire, they were subsequently asked about their leave intentions during a wildfire (see Box 1, Question B). A greater proportion of respondents intended to leave in 2023 than in 2016, with a statistically significant association between year and leave intention (χ2(1) = 41.3, P < 0.001). Fig. 8 shows a comparison between responses for leave intention from the 2016 TPHS and the 2023 survey by gender and location (see Supplementary Material S12, Supplementary Table S5 for full results).
Wildfire leave intention proportion by gender and location, Tasmania, Australia (2016 and 2023).
In both the 2016 and 2023 surveys, if a participant responded to Question B ‘I would not leave’ as their intention, they were subsequently asked about the main reason they would stay (see Box 1, Question C). In both 2016 and 2023, the majority of participants who would not leave responded ‘I think I can protect my home and/or myself’ (72.5%, n = 58 in 2016; 55.2%, n = 16 in 2023) (see Supplementary Material S12, Supplementary Fig. S13 for full results).
Discussion
Our 2023 survey highlights substantial social and geographic variation among adults’ perceptions and their likely responses to wildfire threats across the fire-prone island of Tasmania. Gender and location were significantly associated with leave intention, with women more likely to leave than men, and those residing in urban areas more likely to leave than those in rural areas. Additionally, previous wildfire experience and home ownership were significantly associated with increased wildfire preparedness actions, while residing in an urban location was significantly and negatively associated with preparedness actions. Considering the 2023 survey results collectively, we can identify four distinct archetypes – the ‘immediate leaver’, the ‘prepared stayer’, the ‘unprepared leaver’ and the ‘informed leaver’, each with diverse sociodemographic characteristics with respect to gender, age, income, home ownership, residential location and previous wildfire experience.
Our classification of archetypes relevant to wildfire self-evacuation intention in Tasmania has some similarities with previous studies initiated by the Fires Services Commissioner in Victoria, Australia (Fire Services Commissioner Victoria 2013). The Victorian study identified seven distinct archetypes related to the attitudes and behaviours of people responding to a wildfire threat, five of which loosely match the identified Tasmanian archetypes (see Table 3).
| Victoria | Tasmania | |
|---|---|---|
| Can do defenders | Prepared stayers | |
| Considered defenders | Prepared stayers | |
| Livelihood defenders | Prepared stayers | |
| Threat monitors | Informed leavers | |
| Threat avoiders | Immediate leavers | |
| Unprepared leavers | ||
| Unaware reactorsA | Not identified | |
| Isolated and vulnerableB | Not identified |
Archetypes identified in our study also reflect the changing demographics of Tasmania, with more recent population growth driven by the migration of people in their mid-20s to mid-30s from other Australian states and overseas, who tend to live in predominantly urban locations (State Growth Tasmania 2021). For instance, Group 3, the ‘unprepared leavers’, who tend to be younger, live in urban areas, and are less familiar with the risks and messaging associated with wildfires, may be representative of these newer arrivals to Tasmania.
With reference to Fig. 4 (showing where each group sits on the spectrum of informed/uninformed, prepared/unprepared and leave/stay), ideally residents living in areas at risk of wildfires tend towards the left side of this spectrum, identifying as informed, prepared and choosing to leave their property. An arguably ‘riskier’ approach is to remain on the right side of the spectrum as uninformed, unprepared and choosing to stay. None of the identified archetypes in Tasmania are fully to the right side of the spectrum, while Group 4 are placed fully on the left side, suggesting this group may identify as having the most ideal approach to wildfire safety compared to other groups. This diagram also shows the spread of groups across the spectrum of various sociodemographic variables, highlighting clear opposing factors from Groups 2 and 3, and a less clear differentiation between Groups 1 and 4.
Our results from analyses related to sociodemographic drivers of self-evacuation intention and preparedness actions are congruent with previous studies in Australia, including gender, location and home ownership. With regards to gender, McLennan et al. (2011) found that women were more likely than men to have left their homes during the Victorian ‘Black Saturday’ fires in 2009, noting these findings related to decisions made during the threat of a wildfire rather than self-reported intentions, as were recorded in our survey. In a survey of households in southeast Australia regarding leave intentions and preparedness actions related to wildfires, McLennan et al. (2014) found those residing in an urban setting were most likely to report an intention to leave, compared to those residing in a rural or remote setting, a result aligned with our findings about resident location and intention to leave. Conversely, McLennan et al. (2011) found that location did not influence resident actions with regard to leaving or staying under the threat of a wildfire. These opposing findings may be explained by differing definitions of urban and rural, or the differing contexts of intention to leave versus actual decision to leave. Furthermore, in a survey of residents in Hobart, Tasmania, Paton et al. (2008) found that those having a strong attachment to their home and property were more likely to have undertaken wildfire preparedness actions around their home, as opposed to those that reported a low attachment to their place of residence, a result congruent with our finding that home ownership was associated with preparedness actions (noting preparedness actions included in our survey covered both actions around the home and planning actions such as creating a bushfire survival plan and packing an emergency kit).
We have used the concept of archetypes to discern broad contours of public perception and response to wildfire threat. We accept that further research can refine and provide greater depth to our archetypes, particularly focusing on more intangible sociocultural and value elements and dimensions that affect wildfire and climate change adaptation, such as world views (Ruane 2018) and political orientation (Hazlett and Mildenberger 2020). While the approach of using archetypes has been used in prior wildlife research, we acknowledge that the findings of such studies cannot necessarily be generalised across all fire-prone regions. This is because of the diversity of national and regional-specific legislation, policy and advice messaging for wildfires that shape residents’ preparation and evacuations intentions (McLennan et al. 2019). A fertile area of wildfire disaster risk reduction research is the exploration of behavioural archetypes in contrasting cultural, biophysical and political settings. Such targeted research will help resolve how archetypal behaviours are shaped, and whether there are consistent patterns despite markedly different sociocultural milieu. This knowledge is important for further tailoring of community education and adaptation to the escalating risk of extreme wildfire globally (Cunningham et al. 2024).
Compared to the 2016 TPHS, we found a significant increase in the proportion of Tasmanian residents intending to leave their property at the threat of a wildfire in 2023. To the best of our knowledge, our study is the first to capture and report changes to wildfire self-evacuation intention over time for an Australian jurisdiction. This evidence goes part way towards evaluating the national change in advice messaging in response to a wildfire threat, from ‘prepare, stay and defend or leave early’ (commonly known as ‘stay or go’) which was prevalent during the 2009 Black Saturday bushfires (Teague et al. 2010) to the more recent national advice of ‘leave early’ (Australasian Fire and Emergency Service Authorities Council 2019).
Strengths and limitations of the study
A strength of our 2023 study is the ability to repeat survey questions posed in 2016 using a similar and comparable technique, without encountering the issue of attrition rates common in longitudinal datasets used for natural disaster research (Hudson et al. 2020). However, a vulnerability of this study was the reliance on self-reporting of proximity to bushland wildfire risk. We found that a statistically significantly greater proportion of people reported being within 100 m of a 1 ha (100 m × 100 m) parcel of bushland in 2023 than in 2016. This change may reflect heighted awareness of a wildfire threat, a thought consistent with the statistically significant increase in evacuation intention among rural and urban men and women. Alternatively, this change may be an artefact of differences in sampling design, highlighting the importance of consistency in methods and sample in longitudinal studies (noting given resource constraints, we used different companies, and hence different sampling regimes, to provide representative samples of the Tasmanian population). Additionally, to capture likely systematic changes in resident behaviours, other factors that may have changed must be considered and incorporated into analyses. For instance, data on rates of urban expansion into the wildland urban interface and the legacy effects of major wildfire disasters on perceptions of risk may explain the jump in self-reporting of proximity to flammable bushland.
Limitations of our 2023 study include the lack of engagement with those in the community who do not speak English (as all interviews were conducted in English), and inability to identify those who were at higher risk or had greater vulnerability to the threat of wildfires. This precluded us from directly aligning our findings with those of the Fire Services Commissioner report (Fire Services Commissioner Victoria 2013). Engagement with these priority groups may have resulted in different outcomes or identification of alternative archetypes, however it is worth noting that Campbell et al. (2024) found significant associations between intention to leave and health outcomes. Further research needs to better understand the strength of the relationship between self-reported preparation and evacuation intention and actual behaviour. For example, analysis of road usage patterns in areas before and during catastrophic fire weather could demonstrate if there is a meaningful response to official advice for evacuation.
Policy implications
Our study contributes to the evidence base relevant to wildfire safety-related communications and messaging. Our study highlights the need to consider geographic and sociodemographic variability to identify communities likely to be poorly prepared and unlikely to effectively evacuate when threatened with a wildfire. This enables more targeted wildfire safety campaign messages with greater accuracy and improved resonance to communities. Our study also shows that longitudinal surveys are useful to gauge the understanding of the effectiveness of community fire safety campaigns.
Conclusion
By using an archetype framework, our study helps fire managers understand variability in wildfire preparation and response among residents of a highly fire-prone environment in terms of social and demographic patterns. Such knowledge aids fire managers in tailoring messaging and educational campaigns for those most at risk. Through using repeated survey questions over a 5-year period, we demonstrate clear changes in intention to self-evacuate among broad demographic groups (men/women, urban/rural), suggestive of the differential effectiveness of current generic educational programs and bushfire advice. Further work is required to determine if self-reported proximity to wildfire hazards is accurate, and whether intentions closely match actual behaviour.
Data availability
Data from the 2016 TPHS is available from Public Health Services, Tasmanian Department of Health, contact public.heath@health.tas.gov.au. For more information about the TPHS, visit www.health.tas.gov.au/publications/2022-tasmanian-population-health-survey.
Declaration of funding
Funding for this research was provided through the Natural Disaster Risk Reduction Grant Program fund. The funding body was not involved in data preparation, manuscript development or publication submission. Additional assistance was provided through the Australian Research Council Laureate Fellowship (FL220100099) and the Natural Hazards Research Australis project T2-A5: Bushfire risk at the rural–urban interface. We also acknowledge assistance from the HEAL (Healthy Environments And Lives) National Research Network, which receives funding from the NHMRC Special Initiative in Human Health and Environmental Change (2008937).
Acknowledgements
The authors gratefully acknowledge the various individuals who contributed to and helped shape the survey, including those from Public Health Services (Department of Health), local councils, Tasmania Fire Service and the Australian Red Cross. Thank you to Dr Chloe Lucas (UTAS) for assistance with the funding application. The authors of the various R packages used in this analysis are also gratefully acknowledged.
References
Ahmed I, Ledger K (2023) Lessons from the 2019/2020 ‘Black Summer Bushfires’ in Australia. International Journal of Disaster Risk Reduction 96, 103947.
| Crossref | Google Scholar |
Australasian Fire and Emergency Service Authorities Council (2019) Bushfires and Community Safety. Available at https://www.afac.com.au/insight/doctrine/article/current/bushfires-and-community-safety [accessed 19 January 2024]
Australian Bureau of Statistics (2011) ‘Australian Statistical Geography Standard (ASGS): Volume 5 - Remoteness Structure. Vol. 1270.0.55.005’. Available at www.abs.gov.au/ausstats/abs@.nsf/mf/1270.0.55.005 [accessed 30 September 2018]
Australian Bureau of Statistics (2022) National, state and territory population. Available at https://www.abs.gov.au/statistics/people/population/national-state-and-territory-population/latest-release. [accessed 1 December 2023]
Blanchi R, Leonard J, Haynes K, Opie K, James M, de Oliveira FD (2014) Environmental circumstances surrounding bushfire fatalities in Australia 1901–2011. Environmental Science & Policy 37, 192-203.
| Crossref | Google Scholar |
Bowman DM, Kolden CA, Abatzoglou JT, Johnston FH, van der Werf GR, Flannigan M (2020) Vegetation fires in the Anthropocene. Nature Reviews Earth & Environment 1(10), 500-515.
| Google Scholar |
Bowman DM, Kolden CA, Williamson GJ (2022) Bushfires in Tasmania, Australia: an introduction. Fire 5(2), 33.
| Crossref | Google Scholar |
Campbell SL, Williamson GJ, Johnston FH, Bowman DMJS (2024) Social and health factors influence self-reported evacuation intentions in the wildfire-prone island of Tasmania, Australia. International Journal of Disaster Risk Reduction 111, 104712.
| Crossref | Google Scholar |
Commonwealth of Australia (2011) National Strategy for Disaster Resilience. (Commonwealth of Australia: Canberra) Available at https://nema.gov.au/sites/default/files/national-strategy-disaster-resilience.pdf
Commonwealth of Australia (2018) National Disaster Risk Reduction Framework. (Commonwealth of Australia: Canberra) Available at https://nema.gov.au/sites/default/files/national-disaster-risk-reduction-framework.pdf
Cooper V, Fairbrother P, Elliott G, Walker M, Ch’ng H-Y (2020) Shared responsibility and community engagement: Community narratives of bushfire risk information in Victoria, Australia. Journal of Rural Studies 80, 259-272.
| Crossref | Google Scholar |
Cunningham CX, Williamson GJ, Bowman DMJS (2024) Increasing frequency and intensity of the most extreme wildfires on Earth. Nature Ecology & Evolution 8(8), 1420-1425.
| Crossref | Google Scholar | PubMed |
Dominici G, Tullio V, Siino G, Tani M (2016) Marketing Archetypes: applying Jungian psychology to marketing research. Journal of Organisational Transformation & Social Change 13(2), 109-122.
| Crossref | Google Scholar |
Fire Services Commissioner Victoria (2013) Review of the community response in recent bushfires Emergency Management Victoria. Available at https://files.emv.vic.gov.au/2023-08/Community%20response%20to%20bushfires%20during%202012-13%20fire%20season.pdf [accessed 15 May 2024]
Fox-Hughes P, Harris R, Lee G, Grose M, Bindoff N (2014) Future fire danger climatology for Tasmania, Australia, using a dynamically downscaled regional climate model. International Journal of Wildland Fire 23(3), 309-321.
| Crossref | Google Scholar |
Haghani M, Kuligowski E, Rajabifard A, Kolden CA (2022) The state of wildfire and bushfire science: temporal trends, research divisions and knowledge gaps. Safety Science 153, 105797.
| Crossref | Google Scholar |
Hazlett C, Mildenberger M (2020) Wildfire exposure increases pro-environment voting within Democratic but not Republican areas. American Political Science Review 114(4), 1359-1365.
| Crossref | Google Scholar |
Howe AA, Blomdahl EM, Smith-Eskridge E, Pinto DR, Brunson MW, Howe PD, Huntly NJ, Klain SC (2024) Worldviews more than experience predict Californians’ support for wildfire risk mitigation policies. Environmental Research Letters 19(5), 054025.
| Crossref | Google Scholar |
Hudson P, Thieken AH, Bubeck P (2020) The challenges of longitudinal surveys in the flood risk domain. Journal of Risk Research 23(5), 642-663.
| Crossref | Google Scholar |
Ingalsbee T (2017) Whither the paradigm shift? Large wildland fires and the wildfire paradox offer opportunities for a new paradigm of ecological fire management. International Journal of Wildland Fire 26(7), 557-561.
| Crossref | Google Scholar |
Intergovernmental Panel on Climate Change (2022) Climate Change 2022: Impacts, Adaptation and Vulnerability. In ‘Contribution of Working Group II to the Sixth Assessment Report of the Intergovernmental Panel on Climate Change’. (IPCC: Cambridge, UK and New York, NY, USA) 10.1017/9781009325844.
Koksal K, McLennan J, Every D, Bearman C (2019) Australian wildland-urban interface householders’ wildfire safety preparations: ‘Everyday life’ project priorities and perceptions of wildfire risk. International Journal of Disaster Risk Reduction 33, 142-154.
| Crossref | Google Scholar |
Koksal K, McLennan J, Bearman C (2020) Living with bushfires on the urban-bush interface. The Australian Journal of Emergency Management 35(1), 21-28.
| Google Scholar |
Love PT, Fox-Hughes P, Remenyi TA, Harris RMB, Bindoff N (2017) Impact of climate change on weather related fire risk in the Tasmanian Wilderness World Heritage Area Climate Change and Bushfire Research Initiative. Technical Report. (Antarctic Climate and Ecosystems Cooperative Research Centre: Hobart, Tasmania)
Lucas CH, Williamson GJ, Bowman DMJS (2022) Neighbourhood bushfire hazard, community risk perception and preparedness in peri-urban Hobart, Australia. International Journal of Wildland Fire 31(12), 1129-1143.
| Crossref | Google Scholar |
McDonald J, McCormack PC (2022) Responsibility and Risk-Sharing in Climate Adaptation: a Case Study of Bushfire Risk in Australia. Climate Law 12(2), 128-161.
| Crossref | Google Scholar |
McLennan J, Elliott G, Wright L (2014) Bushfire survival preparations by householders in at-risk areas of south-eastern Australia. The Australian Journal of Emergency Management 29(2), 11-17.
| Google Scholar |
McLennan J, Ryan B, Bearman C, Toh K (2019) Should we leave now? Behavioral factors in evacuation under wildfire threat. Fire Technology 55(2), 487-516.
| Crossref | Google Scholar |
National Emergency Management Agency (2024) Australian Fire Danger Rating System, Australian Government. Available at https://afdrs.com.au/
Paton D, Burgelt PT, Prior T (2008) Living with bushfire risk: social and environmental influences on preparedness. The Australian Journal of Emergency Management 23(3), 41-48.
| Google Scholar |
Paveglio TB, Moseley C, Carroll MS, Williams DR, Davis EJ, Fischer AP (2014) Categorizing the social context of the wildland urban interface: adaptive capacity for wildfire and community “Archetypes”. Forest Science 61(2), 298-310.
| Crossref | Google Scholar |
R Core Team (2021) ‘R: A language and environment for statistical computing.’ (R Foundation for Statistical Computing: Vienna, Austria) Available at www.R-project.org
Ruane S (2018) Using a worldview lens to examine complex policy issues: a historical review of bushfire management in the South West of Australia. Local Environment 23(8), 777-795.
| Crossref | Google Scholar |
State Growth Tasmania (2021) Migration by age. Available at https://profile.id.com.au/tasmania/migration-by-age [accessed 15 May 2024]
Strahan K, Whittaker J, Handmer J (2018) Self-evacuation archetypes in Australian bushfire. International Journal of Disaster Risk Reduction 27, 307-316.
| Crossref | Google Scholar |
Tasmania Fire Service (2022a) Bushfire-Prone Areas. Available at https://www.fire.tas.gov.au/Show?pageId=colBushfireProneAreas [accessed 5 April 2023]
Tasmania Fire Service (2022b) Bushfire Safety Guide. Available at https://bushfire.tas.gov.au/documents/bushfire-survival-plan/download [accessed 14 February 2024]
Teague B, McLeod R, Pascoe S (2010) Final Report 2009 Victorian Bushfires Royal Commission, Victorian Government: Victoria, Australia. Available at http://royalcommission.vic.gov.au/finaldocuments/summary/PF/VBRC_Summary_PF.pdf
Wright K (2021) corrgram: Plot a Correlogram, V1.14 edn. Available at https://CRAN.R-project.org/package=corrgram


