Integrating an urban fire model into an operational wildland fire model to simulate one dimensional wildland–urban interface fires: a parametric study
Dwi M. J. Purnomo A , Yiren Qin B , Maria Theodori A , Maryam Zamanialaei A , Chris Lautenberger C , Arnaud Trouvé B and Michael J. Gollner
  A *
A *
A
B
C
Abstract
Wildland fires that occur near communities, in the wildland–urban interface (WUI), can inflict significant damage to urban structures. Although computational models are vital in wildfires, they often focus solely on wildland landscapes.
We conducted a computational study to investigate WUI fire spread, encompassing both urban and wildland landscapes.
We developed a 1D landscape-scale semi-physical model by integrating a semi-physical urban fire spread model into an Eulerian level set model of wildfire. The model includes ignition and spread through radiation, direct flame contact and ember deposition.
Through a parametric study, we compare the relative change of spread rate from various structural properties and landscape layouts represented by model parameters, highlighting the significant impact of fire-resistant structure materials over surface treatments. Layout configurations play a pivotal role in fire spread, with isolated islands of combustibles effective in reducing spread rate, aligning with existing mitigation strategies.
Despite using a 1D domain and limitations on spatial and temporal variability, our model provides insights into underlying phenomena observed in WUI fires and their mitigation. It offers early-stage development of strategies for managing structure materials and landscape layouts.
Our model and findings provide insights into WUI fire dynamics, paving the way for advanced mitigation strategies.
Keywords: community layout, community resilience, fire, modelling, structure properties, urban, wildfires, wildland–urban interface, WUI.
Introduction
Wildland fires that occur in the wildland–urban interface (WUI) adjacent to communities can result in the loss of human lives and cause extensive damage to urban structures (Radeloff et al. 2005; Caton et al. 2017; Brown et al. 2023). Recent events have underscored the catastrophic impact of WUI fires. In California alone, over the past 5 years, approximately 47,000 structures have been damaged or destroyed and 189 fatalities have been attributed to wildfires (Kramer et al. 2019). These fires have also inflicted substantial financial losses, with insurance claims reaching an astonishing US$7–9 billion in the United States in 2020 (Skowronski et al. 2016; NewsWire 2020). Notably, 82% of homes destroyed by wildfires are situated within designated WUI areas (Kramer et al. 2019), and 28–60% of all fatalities from Australian wildfires under extreme conditions occur within structures (Blanchi et al. 2014). These figures highlight the grave risks posed by WUI fires to the wellbeing and safety of residents. A primary concern today is the rise of extreme fire events, which pose significant challenges to control and frequently exceed suppression capabilities, risks that are further escalating owing to changes in population, land-use and climate (Hammer et al. 2007; Gibbons et al. 2012; Faivre et al. 2018; Brown et al. 2023).
Prediction and risk assessment tools serve as essential foundations for landscape management decision-making (Hakes et al. 2017). Although various tools have been developed for predicting and assessing risks associated with fires in vegetation- or urban-only landscapes (Perry 1998; Zhao 2011), tools that consider both landscapes and their intermix remain limited (Spyratos et al. 2007). The multi-physics nature of the phenomena involved, coupled with the broad spatial and temporal scales at which these events unfold, hinder the comprehensive development of such tools, thereby restricting their utility. Given that prediction and risk assessment tools form a primary approach to landscape-scale fire mitigation, their limited applicability has the potential to significantly diminish mitigation efficacy.
WUI fires have the potential to initiate and propagate through three distinct modes, namely direct flame contact (DFC), radiation and ember transport, each governed by unique underlying physics (Caton et al. 2017). When flames from an approaching wildland fire ignite combustible materials adjacent to structures, such as fences, ornamental vegetation or mulch, the exterior of the structure (e.g. wood siding, windows) can be exposed to significant heating from impinging flames and becomes susceptible to catching fire (Caton et al. 2017). In cases where direct flame contact is impeded, such as when there is sufficient space between vegetation and the structure (e.g. defensible space), fire can still spread via radiation from nearby vegetation fires or adjacent structures that are burning (Caton et al. 2017). Radiant heat emitted by flames increases the temperature of materials on the exterior of a structure, eventually igniting them unless flames are small enough, far enough away, or burn for short enough periods (Cohen and Butler 1998). Radiation was previously considered as the primary mechanism of fire spread in the WUI; however, multiple investigations over the past few decades have found ember transport to be directly or indirectly responsible for the majority of structure losses (Cohen and Butler 1998; Caton et al. 2017; Maranghides et al. 2022). Embers, which break off of flammable vegetation or structural materials, can be lofted far ahead of the main fire front and ignite combustible materials or structures themselves, propagating fires deep into the WUI (Caton et al. 2017; Manzello et al. 2020).
Several models have been developed for post-earthquake fire spread through urban areas. One of the pioneering works in this field was developed by Hamada (1951), who introduced an urban fire model specifically designed for post-earthquake scenarios. The model proposed by Hamada (1951) utilises empirical approaches where the structures affected by the fire are enclosed by ellipses of varying sizes and shapes, depending on factors such as wind speed, structure size, separation distance and home hardening treatment. Another notable contribution in this area was made by Ohgai et al. (2004), who developed a probabilistic cellular automata model to simulate the spread of fire in urban landscapes after an earthquake, taking into account wind dynamics. The model presented in Ohgai et al. (2004) also considers different stages of fire development (early, fully developed and decay) as well as firefighting activities.
To comprehensively understand the dynamics controlling WUI fires, it is crucial to account for fire spread through both wildland and urban landscapes while considering all three modes of fire spread. Although several WUI fire models have been developed to incorporate both wildland and urban landscapes (Spyratos et al. 2007; Mahmoud and Chulahwat 2018; Jiang et al. 2021; Masoudvaziri et al. 2021), none of them fully consider all three modes of fire spread and/or completely couple fire spread between wildland and urban areas. For example, the works of Spyratos et al. (2007) and Jiang et al. (2021) rely on probabilistic cellular automata to spread fire in the WUI but lack a physical interpretation of each fire spread mode, only addressing DFC. Conversely, the model proposed in Masoudvaziri et al. (2021) considers radiation and ember transport but omits DFC and is not coupled to a wildland fire spread model. The probabilistic model described in Mahmoud and Chulahwat (2018) considers all three fire spread modes in urban areas solved using graph theory; however, it treats the wildland landscape merely as an ignition point without accounting for fire spread within that landscape. A common thread between these models is their inability to seamlessly integrate within operational wildland fire models used for fire response or risk analysis. As a result, the practical application of these models to real-world scenarios is still limited.
In this study, we propose a novel WUI fire spread model in one-dimensional (1D) domain that integrates a level set method from an operational wildland fire model with a semi-physical urban fire spread model. The level set method is a computational approach derived from the dynamics of a boundary enclosing a particular region influenced by a velocity field (Osher and Fedkiw 2001). This velocity field is subject to changes over time as a function of multiple factors including position, the geometry of the boundary and external variables such as the underlying physics. The fundamental concept behind this method involves the definition of a smooth function (at least Lipschitz continuous). At the boundary, this function has a value of zero at any given position and time, while having non-zero values elsewhere (Osher and Fedkiw 2001).
The level set method has found applications in various fields, including compressible flow, incompressible flow, multi-phase motion and wildfire modelling (Osher and Fedkiw 2001; Lautenberger 2013). In the context of wildfire modelling, two types of level set methods have been employed: Lagrangian and Eulerian. In the present study, we focus on the Eulerian level set method owing to its superior computational efficiency compared with the Lagrangian counterpart (Lautenberger 2013). Furthermore, the Eulerian method can effectively handle complex phenomena such as ember dynamics, fire merging and crossovers without the need for any specialised treatment (Lautenberger 2013).
Our model comprehensively accounts for the three distinct modes of fire spread found in WUI fires with adjustable physical parameters and enables detailed feedback on the interactions between fires in both wildland and urban areas. We compared our model with an existing post-earthquake urban fire spread model, and subsequently, conducted a parametric study on model parameters, which correlate with structural properties and layout configurations. We assessed the relative change in spread rate and influence of various fire spread modes resulting from different sets of model parameters.
The structure of this manuscript is as follows: the next section outlines the methods, covering the development of the model and scenarios tested. Results are presented in the subsequent section, which is followed by the Discussion section about the fire spread behaviour for different scenarios. Concluding remarks are provided in the final section.
Methods
Overview of the WUI fire model and level set method
We developed a one-dimensional (1D) WUI fire model, which is the initial stage of the development of a more sophisticated 2D model. We adapted ELMFIRE, the model in Lautenberger (2013) that applies the level set method for fire propagation, which in turn is based on Rehm and McDermott (2009). We developed a novel urban fire spread model and integrated it to ELMFIRE.
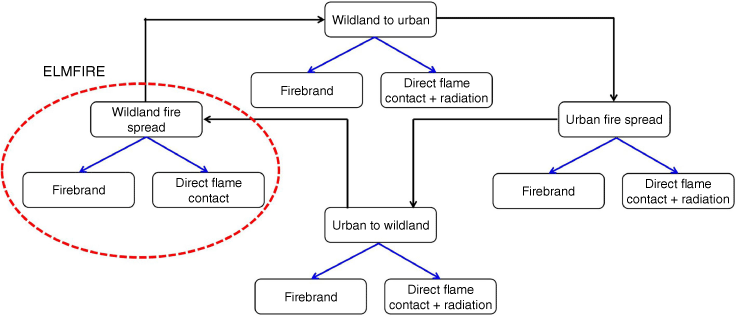
Fig. 1 depicts the core structure of the WUI fire model, encompassing four key elements: wildland fire spread, wildland-to-urban transition, urban fire propagation and urban-to-wildland transition. Each module of the model encompasses three primary modes of fire propagation: DFC, radiation and embers. The wildland fire module is a modification of ELMFIRE in Lautenberger (2013), reconfigured into a 1D version for versatility across various programming platforms, utilising MATLAB. Therefore, the development is focused on the urban fire spread model and its integration with ELMFIRE, the existing wildland fire spread model in Lautenberger (2013). For more detailed development of the wildland fire spread model, refer to Lautenberger (2013).
Schematic of the architecture of the WUI fire model. The model consists of four modules: wildland fire, urban fire, wildland to urban, and urban to wildland. Each part has three modes of fire spread: embers, direct flame contact and radiation.
A brief overview of the level set method that is used as the computational platform for the WUI fire model is presented here. The level set method involves solving a hyperbolic differential equation for the scalar variable, ϕ, detailed in Eqn 1. Here, ϕ represents a smooth function that evaluates to zero at the boundary, while Ux(t) denotes the fire spread rate (ROS). Although Ux(t) is used as a symbol for ROS, we will refer to it as ROS throughout this study, as it is the more familiar term. ELMFIRE assumes that the fire front exclusively propagates perpendicular to itself.
Solving Eqn 1 entails several steps. Initially, the spatial gradient of ϕ, namely , is estimated by using node-centred central differences. A vector operation calculates the spread rate at any given angle, with a super bee flux limiter ensuring solution monotonicity and preventing spurious oscillations. Finally, a second-order Runge–Kutta method is applied to determine ϕ’s value at the subsequent timestep (Rehm and McDermott 2009; Lautenberger 2013). To ensure simulation stability, time-step Δt is limited by implementing the Courant–Friedrichs–Lewy condition.
The initial burning area is set to ϕ = −1, while non-burning areas are assigned ϕ = 1. This distinction, coupled with Eqn 1’s calculation, adjusts ϕ throughout the domain. Consequently, ϕ reaches zero at specific points, signifying the boundary’s presence, representing the fire front in this context. For a comprehensive derivation and formulation of the level set method, refer to Lautenberger (2013).
Urban fire model and integration with ELMFIRE
We developed a novel urban fire spread model that encompasses three primary modes of fire spread: DFC, radiation and ember. Recent studies underscored that convection can play a significant role in wildfire behaviour and impacts (Page and Butler 2017; Fayad et al. 2023). This is particularly relevant for wildland fires, where fine fuels are predominant. However, urban fuels typically exhibit greater thermal mass and are less susceptible to convection. Nevertheless, we account for DFC, which would naturally include both radiation and convection and becomes significant when flames from nearby fires directly encounter features or surfaces, potentially igniting materials like siding or decks, or causing damage to windows. The convection factor is integrated into the model through DFC.
Our model considers wind dynamics and structural properties, including combustible fraction and radiation absorptivity, as influential factors. The wind dynamics in our model are taken from the midflame wind, which is calculated as a function of the wind data measured by instrumentation at approximately 6 m above ground level. The variations of wind dynamics for different altitudes from the ground are not accounted for in the model owing to its complexity and the tremendous computational resources required, especially for landscape-scale models.
Our urban model does not incorporate topography, because although acknowledging the significance of topography in fire modelling, research on its specific influence in urban fire scenarios remains limited. Moderate- and high-density residential areas are generally situated on fairly flat terrains, even at elevated altitudes. In urban fire spread, topography plays a secondary role compared with wind dynamics and structure characteristics (Syphard et al. 2017; Masoudvaziri et al. 2021). For intermix scenarios involving wildland fuel types, we address topography through the wildland fire model rather than the urban fire model.
In our model, DFC originating from a burning structure has a limited impact, which represents the reach of the flame. Heat transferred to cells within the flame reach is determined by the heat release rate and the cell’s relative position to the burning structure, as formulated in Eqn 2. In this equation, q̇c(kW) is the heat from DFC, HRR (kW) is the heat release rate, At (m2) is the area of a cell affected by the flame and Δx2 (m2) is the total cell area. As the model is 1D, At can be simplified as the product of the cell size (Δx) and the distance from the furthest intersection point between the flame reach and the cell edge. The flame reach at the downwind (a, m) and upwind (b, m) directions are formulated as in Eqns 3 and 4, adapted from a correlation in Jiang et al. (2021), which is derived from the empirical model of Hamada (1951). These equations establish flame reach as functions of wind speed (v, m/s) and the structure size (d, m).
Ideally, determining the HRR involves conducting experiments across various scenarios. However, resource constraints led us to rely on alternative methods, such as using computational fluid dynamic models such as the Fire Dynamics Simulator (FDS), to estimate HRR. In Supplementary Table S1, we compiled HRR data from FDS simulations in the literature involving structures of varying sizes and configurations, which were directly incorporated into our model. The estimations of HRR are independent processes prior to the running the model, thus are not executed during the run of the model.
In our model, we incorporated a transient HRR profile (see Supplementary Fig. S1). We assume that the HRR starts at zero on ignition and gradually increases until reaching an assigned peak HRR value. This progression reflects the transition from the early to fully developed stage of a burning structure (Drysdale 2011). Subsequently, the peak HRR remains constant for a defined duration before gradually declining during the decay stage, reaching zero at the end of the structure’s burning lifespan. The HRR values in Supplementary Table S1 correspond to the peak HRR.
In our model, for simplicity, we adopted a point source ignition approach for radiation, where fire spread via radiation depends strongly on the HRR, as indicated in Eqn 5 (Drysdale 2011). The heat flux from radiation (, kW/m2) is determined by the radiation fraction of HRR and the cell’s distance from the burning structure (R, m), for R less than 100 m (Lee 2009). Beyond this distance, radiation is considered to be zero or negligible in the model.
Our urban fire spread model also considers the ember-driven fire spread mechanism, comprising ember generation, transport and ignition. Our model simplifies ember generation and ignition dynamics, with a fixed number of embers generated per time-step and probabilistic cell ignition on ember landing. Our primary focus is elucidating ember transport dynamics within the model.
We employed predefined probability density functions (PDFs) for ember transport, following Sardoy et al. (2008). Specifically, we used a lognormal PDF to model the trajectory of embers, adapted from Sardoy et al. (2008) and formulated as in Eqn 6. The probability of embers landing at x, p(x), depends on its mean value (μ) and variance (σ), which are functions of the wind speed (ν, m/s), the fireline intensity (If, kW/m) and the Froude number (Fr), as shown in Eqns 7 and 8. The Froude number is a function of ν, gravity acceleration (g, m/s2) and the characteristic length of the plume (Lc, m), as presented in Eqn 9. Lc is formulated as shown in Eqn 10, which is a function of If, ambient air density (ρ∞, kg/m3), specific heat of the air (cpg, kJ/kg K), ambient temperature (T∞, K) and g. For a comprehensive derivation and formulation, please refer to Sardoy et al. (2008). Once the landing position is determined, the ember particles move at the applied driving midflame wind speed.
Urban cell-to-cell fire spread is determined by heat transfer through DFC, radiation, or airborne embers from the burning cell. Whereas ember propagation involves ignition probability, DFC and radiation-driven fire spread depend on the heat received and the heat threshold required for structure ignition.
The formulation of heat received by an unburned cell is given in Eqn 11, where q̇t (kW) represents the total heat received, αc (–) represents the fire transfer coefficient through DFC, αr (–) represents the fire transfer coefficient through radiation, and Δx2 (m2) represents the area of the burning structure. αc is determined by the structure’s material and configuration, while αr is the product of αc and the structure’s radiation absorptivity. For simplicity, αc is formulated as shown in Eqn 12, based on the surface area of combustible material within the structure (Sb, m2), the area of vegetation within the same cell (Sv, m2) and the total surface area (St, m2).
Unburned cells ignite when the cumulative heat received from neighbouring cells over a specific time-steps exceeds the critical flux time product (FTP, kJ/m2), as depicted in Eqn 13 (Lee 2009). We assume that a structure ignites when it experiences above-critical heat flux for a certain duration, quantified by FTP, a property of the structure. This simplification aligns with the complexity where combustible materials undergo sequential processes on heat exposure. Each process, including drying, pyrolysis and oxidation, requires a specific duration to complete, necessitating a minimum exposure time for ignition.
To align with the level set method employed by ELMFIRE, Eqn 13 was reformulated. To obtain an equivalent U (in Eqn 1) for the urban fire spread, we assume that U represents the time, Δt, required to ignite a structure with a size of Δx; thus, U(t) = Δx/Δt. As Δt can be formulated as the ratio of FTP with the cumulative heat flux received by the target over a single time step , Eqn 14 shows the formulation of U for urban fire spread in the proposed model.
Supplementary Fig. S2a shows the spread rate (U(t)) development over time for the first cell closest to the ignition point, and Supplementary Fig. S2b represents the second cell. Both cells exhibit higher amplitudes at higher wind speeds. These developments are related to the HRR per unit area, as shown in Supplementary Fig. S2c, d, respectively. The U(t) vs time pattern closely resembles its corresponding HRR vs time pattern, particularly for the first cell. However, for the second cell, the pattern differs slightly between U(t) and HRR owing to the influence of multiple burning cells on the second cell. Additionally, the HRR patterns differ between the first and second cells. The first cell, being the initial ignition point, enters the early stage immediately regardless of wind speed. In contrast, the second cell must wait until ignition before beginning the early stage, which is dependent on wind speed.
For fire spread from wildland to urban areas, the fireline intensity output (If) generated by the wildland component is converted to quantify HRR (Eqn 15) to enable urban fire spread. However, a in Eqn 3 becomes for wildland cells (Jiang et al. 2021). Meanwhile, for fire spread from urban to wildland areas, the wildland cells at the interface undergo a process similar to urban cells but with different parameter values. The original ELMFIRE model is not used for these wildland interface cells; instead, they receive heat from adjacent urban cells and ignite based on Eqns 11–14, deviating from the Rothermel (1972) to Albini (1976) models that are used in ELMFIRE. The detailed list of variables and parameters used in this study is summarised in Table 1.
| Variable and parameters | Symbol | Unit | |
|---|---|---|---|
| Heat release from direct flame contact | q̇c | kW | |
| Radiation heat flux | kW/m2 | ||
| Total heat received | q̇t | kW | |
| Heat release rate | HRR | kW | |
| Flux time product | FTP | kJ/m2 | |
| Fireline intensity | If | kW/m | |
| Time | t | s | |
| Cell size | Δx | m | |
| Time-step | Δt | s | |
| Fire transfer coefficient through DFC | αc | – | |
| Fire transfer coefficient through radiation | αr | – | |
| Wind speed | v | m/s | |
| Structure size | d | m | |
| Upwind flame reach | a | m | |
| Downwind flame reach | b | m | |
| Area engulfed by flame | At | m2 | |
| Radiation distance | R | m | |
| Building surface area in one cell | Sb | m2 | |
| Vegetation surface area in one cell | Sv | m2 | |
| Total surface area in one cell | St | m2 | |
| Probability of embers landing at x | p(x) | – | |
| Mean value of probability | μ | – | |
| Variance of probability | σ | – | |
| Froude number | Fr | – | |
| Gravity acceleration | g | m/s2 | |
| Characteristic length of plume | Lc | m | |
| Ambient air density | ρ∞ | kg/m3 | |
| Specific heat of the air | cpg | kJ/kg K | |
| Ambient temperature | T∞ | K | |
| Level set diffusion rate | U | 1/s | |
| Scalar values for level set method | ϕ | – |
Scenarios for parametric study
We conducted a parametric study (Millington et al. 2009) of the 1D model to evaluate fire spread rate and modes in the WUI region under various landscape configurations. The use of a 1D model instead of a 2D model for these studies also offers better control over influencing parameters and establishes a more direct correlation with observed impacts. We considered various landscape configurations, including both structure characteristics and landscape layout factors. Our analysis involved evaluating the ROS considering ember and non-ember scenarios and assessing different fire modes. With the formulations that comprise our model, various outputs that describe fire behaviour can be solved, including HRR, fireline intensity and incident heat flux. However, owing to the study’s utilisation of a 1D model and its emphasis on parametric analysis, only ROS results are considered herein.
In terms of structure characteristics, we considered a range of values for the combustible fraction αc, representing the structure’s combustible surface area, and for radiation absorptivity αr, related to exterior wall treatments like paint. We also considered varying peak HRR and its duration that relate to fuel load. Regarding landscape layouts, we considered different structure sizes, surrounding defensible space (open space) and hazardous vegetation.
The selection of combustible fraction relied on US structure component data (Henning et al. 2015), focusing on materials like wood and concrete in vulnerable components like roofs, eaves, sidings, fences and porches (Henning et al. 2015; Dossi et al. 2022). We established a combustible fraction range of 0.1–1, where 1 signifies an all-wood exterior structure.
We also considered combustibility variations, like treated versus untreated wood, by integrating them into the FTP parameter, as materials with lower combustibility require a higher heat flux or longer exposure to ignite than more combustible materials. We devised a qualitative combustibility scale from 0.1 to 1, inversely affecting FTP (the baseline value is 10,500 kJ/m2). Materials rated 0.5 require double the FTP of those rated 1, noting the qualitative nature of this approach due to limited quantification in the literature.
For radiation absorptivity, we referenced existing data for common structural surfaces (Li et al. 2021). We created a range from 0.1 to 0.95, encompassing paint colours like grey (0.95) and white (0.89) and materials like limestone (0.33) and red clay brick (0.94) (Li et al. 2021).
The variations of peak HRR and its duration are based on Maranghides and Johnsson (2008), Jiang et al. (2021) and Masoudvaziri et al. (2021). For peak HRR, we varied the values between 100 and 1000 kW/m2, with an interval of 100 kW/m2. For the duration of peak HRR, we used 60, 300, 600, 1800, 3600, 7200, 10,800, 14,400, 18,000 and 36,000 s variations. Although the data presented in Supplementary Table S1, from which these ranges are derived, may contain inaccuracies due to differences in conditions considered in the case studies, these do not compromise the validity of our work. This study is focused on a parametric analysis rather than achieving precise predictions.
Our structure size and separation distance range drew from the 2017 Thomas Fire, a historical WUI fire in California, using Microsoft structure footprint data. A GIS (geographic information system) tool calculated structure sizes and open spaces within the affected area (Fig. 2a). Blue squares in the figure represent various structure size and separation distance combinations within the urban area. Our range spans from 5 to 50 m with 5 m intervals (red dashed square in Fig. 2a). As the choice of cell size has an insignificant effect on the simulations (within 20%, as shown in Supplementary Fig. S3), we selected the cell size for this analysis to be the greatest common divisor of structure size and separation distance of each scenario.
(a) Data on structure size versus separation distance in the urban areas affected by the Thomas Fire in California in 2017, derived from Microsoft structure footprint. Blue squares represent all data points and the red dashed square represents the range of combinations considered in this study. (b) Schematic representation of the configurations of structures, open space and vegetation considered in this study. ‘Intermix’ corresponds to configurations where vegetation and structures intermingle, whereas ‘separated’ corresponds to configurations that separate vegetation-dominant and structure-dominant areas (Crit. dist., critical distance).
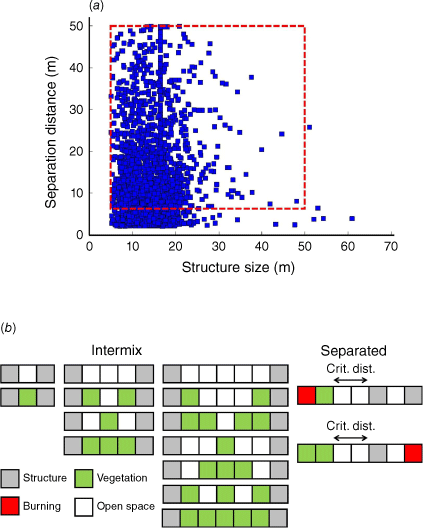
Fig. 2b explores defensible space scenarios. The first row shows structure separation combinations with increasing distance of only fully open space between them. Considering vegetation, more combinations appear (second row and beyond in Fig. 2b), with an odd number of separation cells for landscape repeatability (one, three, five cells).
We also considered fire spread between wildland and urban landscapes, particularly when visibly separated (interface) as shown in the separated case of Fig. 2b (far right). These conditions relate to scenarios where most structures burn in WUI fires (Kramer et al. 2019). This involved assessing the critical distance between urban and wildland landscape for a fire-safe WUI community layout.
Results
We first compared the output of our model with an existing empirical approach for post-earthquake urban fire spread by Hamada (1951), shown in Fig. 3a. Similar fire spread rates across various wind speeds (within 20% difference) without embers are shown. Our model, however, highlights slight changes in spread rate vs wind speed depending on the primary modes of fire propagation: radiation or DFC.
(a) Comparison of the proposed urban fire model and an existing urban fire model of Hamada (1951). (b) Comparison of spread rate between simulation results and reports in historical WUI fires (Bardales 2019). Red diamonds (R) are the reported spread rate, green circles (S) are spread rate resulting from the model and numbers represent the corresponding fire (e.g. R1 means reported spread rate of Cedar fire). Black dotted line is radiation contribution, and blue dotted line is DFC contribution.
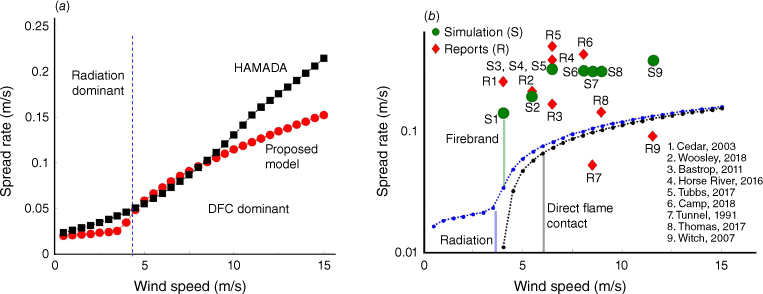
In Fig. 3a, b comparison of the ROS in the model and reported average ROS in historical WUI fires is shown (Bardales 2019). The reported ROS are in the head direction and calculated as the division of distance travelled by the fire, derived from satellite images, by the required time to travel that distance. In Fig. 3b, first, the contributions of radiation and DFC vs wind speed to spread rate in simulations are individually plotted.
As can be seen, radiation and DFC cannot alone be responsible for the reported spread rates through most communities. Instead, ember transport and ignition must also play a role, in many cases a dominant role, agreeing with past investigations (Caton et al. 2017). Incorporating ember dynamics aligns the ROS in our model to a similar order of magnitude with the reported ROS for most fires. To attain this, although parameters for DFC and radiation are based on physical interpretation instead of calibration, ember parameters (ember generation rate and ignition probability by embers) were optimised, though these parameters were subsequently held constant across all simulated fires.
However, the objective of this comparison is to confirm that the simulation of the model provides results within the order magnitude of the reported values, which then will be used to perform parametric studies and investigate the model parameters’ influence on the fire’s ROS. Therefore, the proposed model does not strive for blind predictions; instead, it operates as a simplified 1D model, focusing on relative comparisons rather than precise predictions. This 1D version of the model aims to assess the relative influence of each parameter and their interactions, emphasising the representation of each process with its governing physics, albeit not exact or predictive.
Fig. 4 illustrates a change in ROS, from the baseline scenario, for varying combustible fractions under different wind conditions, without (Fig. 4a) and with (Fig. 4b) ember considerations. The baseline scenario had a combustible fraction of 0.95, combustibility of 1, radiation absorptivity of 0.89, structure size of 10 m and separation distance of 10 m. The change in ROS shows a quadratic correlation with combustible fraction decreasing by up to 50% when the fraction is as low as 0.5, observed in both ember and non-ember scenarios. Approaching the baseline value, improvements are less than 10%, especially with embers. In some cases, ROS increases with slightly lower combustible fractions than the baseline in ember scenarios.
Effects of different combustible fractions on rate of spread (ROS) compared with the baseline scenario (red cross) under different wind conditions: (a) without ember consideration, and (b) with ember consideration.
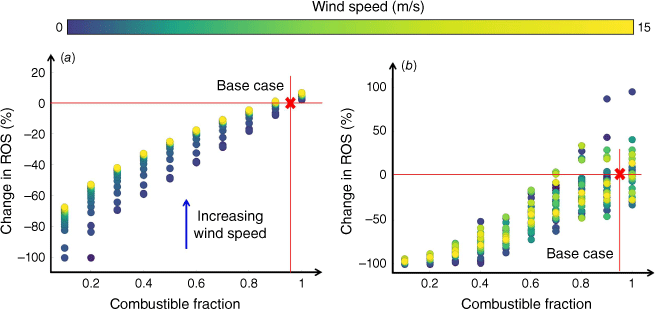
In the absence of embers (Fig. 4a), wind speed negatively impacts change in ROS, with a more pronounced effect at lower combustible fractions. For example, at a 0.2 combustible fraction, changes in ROS vary by 50% across wind speeds, narrowing to 10% at a 0.8 fraction. In scenarios with embers present (Fig. 4b), there is high variability in changes in ROS, and the expected pattern of smaller changes with higher wind speeds is not consistently observed. Lower combustible fractions in scenarios with embers have a narrower range of ROS changes across wind speeds.
The profiles of change in ROS for different combustibility resemble those for combustible fractions (see Supplementary Fig. S4). In both scenarios, combustibility has an inverse quadratic relationship with changes in ROS, but with embers, ROS becomes erratic beyond 0.7 combustibility. The main difference is their impact on change in ROS at varying wind speeds. With embers, combustibility shows a wider range of change in ROS across speeds compared with combustible fractions (Fig. 4b and Supplementary Fig. S4b). In the absence of embers, changes in ROS remain consistent across combustibility levels but decrease with higher combustible fractions.
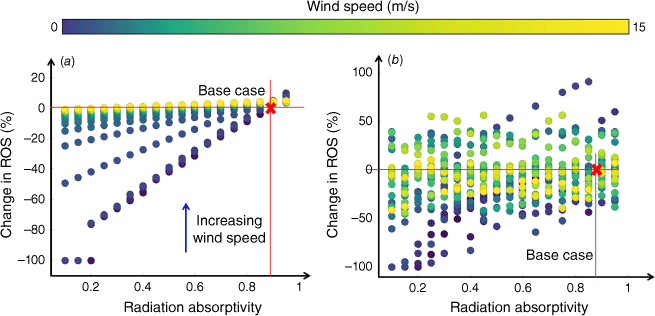
Variation in radiation absorptivity also impacts ROS, with Fig. 5 depicting the impact of radiation absorptivity on ROS from a baseline scenario, with and without ember consideration. Without embers (Fig. 5a), a linear correlation exists between changes in ROS and radiation absorptivity, especially at wind speeds below 2 m/s, with changes of up to 100%. For wind speeds above 2 m/s, the effect of radiation absorptivity is limited to ~20%. With embers (Fig. 5b), radiation absorptivity and changes in ROS are positively correlated, but only when both radiation absorptivity and wind speeds are low.
Effects of different radiation absorptivity on rate of spread (ROS) compared with the baseline scenario (red cross) under different wind conditions: (a) without ember consideration, and (b) with ember consideration.
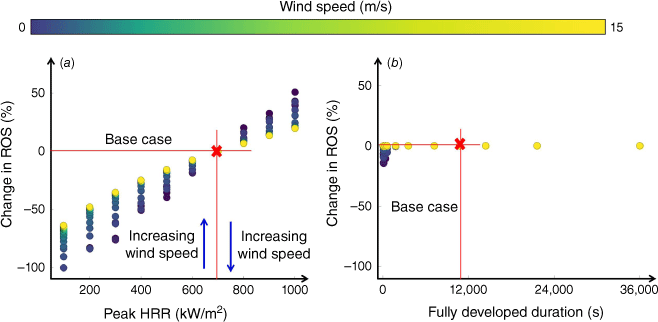
In the absence of embers (Fig. 6), whereas change in ROS for different peak HRR also resembles that for combustible fractions (see Fig. 6a), for different fully developed duration, change in ROS becomes insignificant (see Fig. 6b). The change in ROS falls within a 15% difference for durations of 60–36,000 s. When embers are considered, change in ROS is correlated with neither peak HRR nor fully developed duration (see Supplementary Fig. S5).
Effects of different peak HRR (a), and fully developed duration (b) on rate of spread (ROS) compared with the baseline scenario (red cross) under different wind conditions.
Fire spread rate in the model is also influenced by the separation distance between structures. Fig. 7a illustrates changes in the spread rate for a 10 m structure size at varying separation distances (d) under different wind speeds without embers. At a 5 m separation distance, DFC dominates, leading to a high, linear spread rate profile. At a 20 m separation distance, radiation dominates, resulting in a lower, linear spread rate profile. Intermediate distances blend radiation and DFC, favouring radiation at low wind speeds and DFC at high wind speeds. The transition point is marked in Fig. 7a by a red cross, denoting the critical wind speed. Beyond a 30 m separation distance, fire propagation is halted. From 20 to 30 m, spread depends on meeting specific wind speed thresholds, marked by a green plus symbol indicating the critical wind speed for no spread. It is important to note, especially for these separation distances, that this model is 1D and does not account for all fine-scale dynamics occurring in structure-to-structure fire spread. Therefore, the results should not be applied to individual structure recommendations and instead offer insight when determining likely behaviour among groups of structures.
(a) Fire spread rate versus wind speed (from 0 to 15 m/s) for 10 m structures with varying separation distance (d = 5–30 m). Red crosses mark the transition to DFC-dominant propagation. Green plus signs indicate no spread. (b) Dominant mode of fire propagation for a certain structure size and separation distance pair in no-ember scenario consisting of DFC only spread (red shade), radiation only spread (grey shade), and mixed (blue circles). (c) Configurations of structure size and separation distance to enable no-spread condition for both ember and no-ember scenarios. Red shading represents sustained spread conditions. Green shading represents no-spread conditions when embers are not considered. Grey shading represents no-spread conditions regardless of ember consideration. Blue circles mark the wind speeds that enable no-spread conditions for certain configurations under no-ember scenarios.
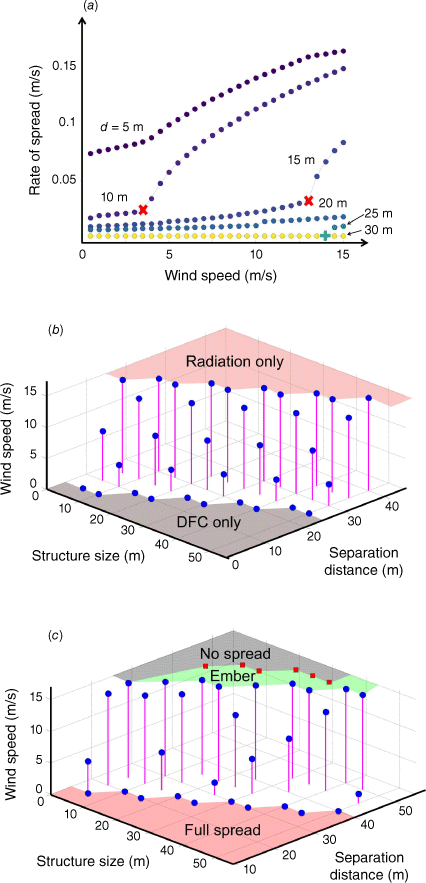
Fig. 7b illustrates fire propagation modes across various structure sizes and separation distances, considering different wind speeds but excluding embers. For DFC-dominant spread, the maximum separation distance (even at 0 m/s wind speed) linearly relates to structure size, approximately half of it, marked in red shading. For radiation-dominant spread (grey shading), even with up to 15 m/s wind speeds, the minimum separation distances are similar to the dimensions of the structure size, with marginal variations observed – be it equal, slightly greater, or slightly smaller. For example, a 20 m wide structure needs a separation distance of at least 25 m to prevent spread to a neighbouring structure, whereas a 30 m wide structure requires a 30 m separation distance. The blue circles indicate the wind speed at which the shift from radiation to DFC dominance occurs, similarly to the red cross in Fig. 7a but accounting for different structure sizes. When ember effects are considered, fire spread in the model is mainly governed by ember dynamics; thus, the critical wind speed profile does not a show specific pattern owing to the uncertain nature of ember-driven propagation.
A closer look at the configurations of structure size and separation distance that do not result in fire propagation is provided in Fig. 7c, considering both ember and non-ember scenarios. Without embers, sustained propagation coincides with critical values for radiation-dominant spread (red shading in Fig. 7b). Beyond these thresholds, specific critical wind speeds (blue circles) determine the non-propagation limits, but show no singular pattern of influence across structure sizes and distances. In cases with substantial separation distances (e.g. 30 m for a 10 m structure), propagation does not occur without embers, even at 15 m/s wind speeds (green shading). However, ember-driven scenarios require more extensive separation distances (grey shading). In scenarios with large structures (e.g. 50 m), achieving non-propagation is challenging, especially with embers.
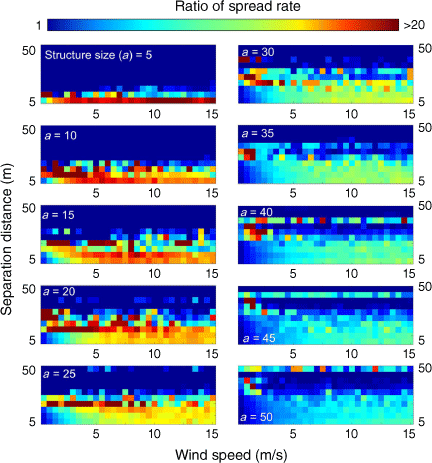
Including embers increases spread rates relative to non-ember scenarios (Fig. 8). Although no clear pattern emerges, the peak spread rate ratio between ember and non-ember spread for various structure sizes corresponds to different separation distances, regardless of wind speed conditions. Specifically, the highest ratio occurs when the separation distance equals the structure size.
Ratio of spread rate between scenarios where embers are considered vs scenarios without ember consideration. Scenarios comprise different structure size (a), and separation distance pairs under different wind speed conditions. A maximum ratio of 20 is considered to ensure clarity.
In scenarios where the separation distance contains combustible vegetation, the spread rate profile exhibits significant variations across varying wind speeds. Fig. 9 depicts spread rate profiles with and without ember considerations for different configurations of structure (grey squares), open space (white squares) and vegetation cells (green squares), where each cell is of 10 m size. Different configurations have different profiles relative to the baseline scenario, comprising two structures separated by one open space cell, forming a grey–white–grey configuration.
(a–c) Spread rate comparisons for different configurations of structure, vegetation and open space under different wind speed conditions without ember consideration. (d) Spread rate comparisons for different vegetation types with equal configurations of structure, vegetation and open space under different wind speed conditions without ember considerations. (e) Spread rate comparisons for different configurations of structure, vegetation and open space under different wind speed conditions with ember considerations.
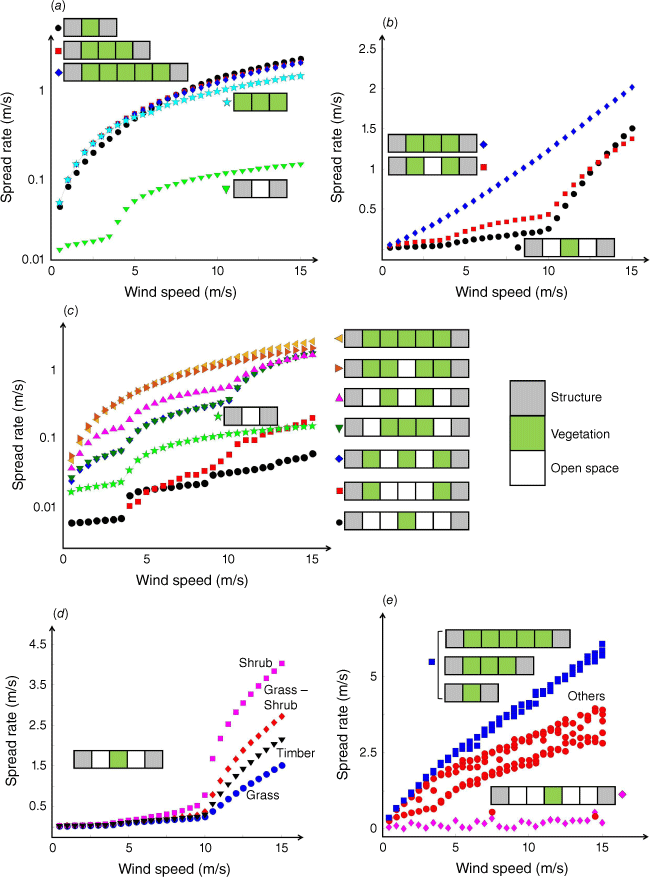
In scenarios devoid of embers, when the separation distance is entirely covered by vegetation (Fig. 9a), the spread rate is significantly higher than the baseline (green triangle), with no critical separation distance for a no-spread condition, even when the separation distance is doubled. Variation in structure separation distance (10, 30, 50 m) has minimal impacts, with spread rate profiles mirroring pure wildland fuel (cyan star). Introducing open space transforms the spread rate profile (Fig. 9b), reducing it significantly. However, for a 30 m separation distance, different open space configurations minimally affect the spread rate profile, displaying a linear pattern with varying slopes based on wind speed (Fig. 9b). For a 50 m separation (Fig. 9c), the spread rate profile is influenced by the quantity and arrangement of open space. With more than three open space cells, the rate is below the baseline; with three or fewer, it surpasses the baseline. The configuration of these cells also matters; alternating combustible and non-combustible cells results in higher rates (row three from the top), whereas clustered open space cells lead to lower rates (row two from the bottom). Different vegetation types impact the spread rate profile even with a constant configuration (Fig. 9d). The maximum spread rate in the model varies from 1 to 4 m/s, primarily at high wind speeds.
In the ember-driven scenario, spread rate profiles from various layouts can be categorised into three clusters (Fig. 9e). The first cluster, where combustible vegetation entirely occupies the separation distance between structures (blue squares), significantly higher spread rates result than the baseline with no vegetation. The second cluster, where layouts have ample open space (magenta diamonds), have lower spread rates than the baseline. Other layouts with some, but not many, open spaces lead to higher spread rates than the baseline but are lower than the first cluster.
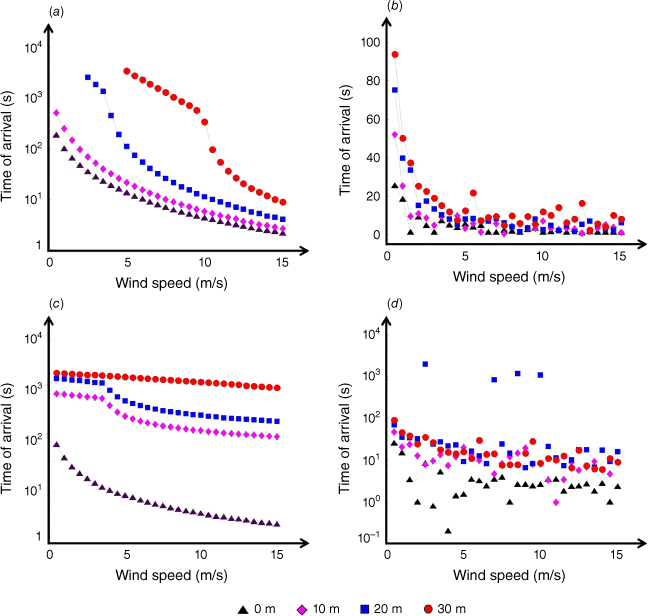
Finally, the time needed for fire to spread between landscapes, both from wildland to urban (Fig. 10a and b) and vice versa (Fig. 10c and d) are shown in Fig. 10. A minimum of 40 m separation is required to prevent interface spread, regardless of ember considerations. Without embers, wildland to urban spread can be halted with approximately 30 m or slightly less separation when wind speeds are low (below 7.5 m/s). For wind speeds under 2.5 m/s, a 20 m separation distance prevents fire spread in the simulation. These critical wind speeds become irrelevant when embers are considered.
Time of arrival of fire at the interface from wildland to urban landscape under different wind speed conditions and four different firebreak distances (0, 10, 20, and 30 m) in no-ember (a), and ember (b) scenarios. Time of arrival of fire at the interface from urban to wildland landscape under different wind speed conditions and four different firebreak distances (0, 10, 20, and 30 m) in no-ember (c), and ember (d) scenarios.
It is important to note that results here are specific to the model simulation and are not necessarily reflective of values in reality, thus, should not be taken as-is in decision-making. As the objective of the present study is a relative comparison of ROS influenced by different structure properties and layouts, the message to be taken is on the existence of limiting factors and the behavioural trend of the fire. For instance, there exist limits for combustible fraction or separation distance that can reduce the ROS, and their values differ when fire is dominated by embers or not. To find these critical values, more comprehensive analyses and modelling should be conducted; verified 2D models with spatial and temporal variability of inputs are of utmost importance.
Discussion
In practice, reducing combustible fraction can be achieved by using fire-resistant materials; thus, choosing fire-resistant materials for the exterior of structures is of critical importance. Opting for less combustible materials in exterior construction – akin to the concept of home-hardening – exhibits a pronounced influence on ROS reduction in the presence of fire hazards. Such a proactive approach diminishes community susceptibility to WUI fires, an effect particularly salient when embers do not constitute the dominant propagation mode. Remarkably, even in scenarios where embers hold prominence, a discernible ROS reduction can still be obtained through a substantial reduction in combustible materials. These findings align with different damage levels caused by different amounts of combustible materials in structures in the event of WUI fires (Dossi et al. 2022). Additionally, regarding structural characteristics, the significance of combustible materials surpasses surface treatments, such as paint colour, which affect radiation absorptivity and become relevant only when wind speeds are below 2.5 m/s – a fairly unlikely occurrence in the context of an actively spreading urban fire.
In the presence of embers, there is a high variability of change in ROS for high values of combustible fraction (Fig. 4b). This phenomenon arises owing to the ascendancy of embers as the primary driver of fire propagation at elevated combustible fractions (Fig. 11a). Under ember-dominant propagation conditions, the considerable uncertainty associated with ember behaviour takes precedence in shaping the change in ROS, resulting in erratic patterns.
Relative contributions of spread from DFC, radiation and embers for different combustible fraction and wind speed (a and b). Relative contributions of spread from DFC, radiation and embers for different radiation absorptivity and wind speed (c and d).
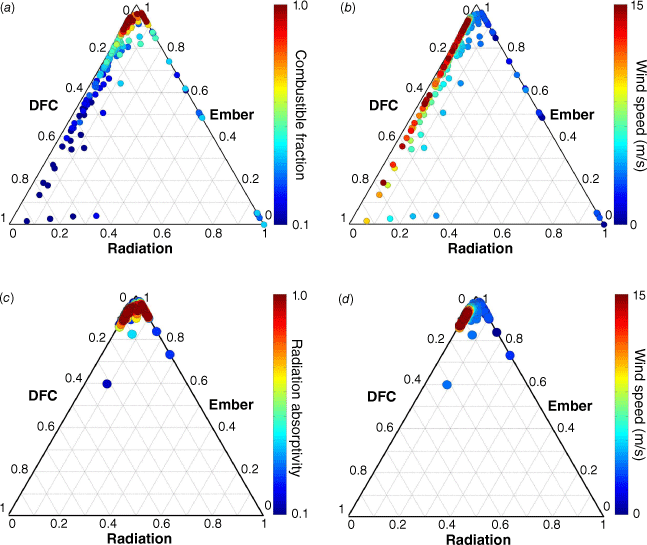
In scenarios characterised by lower combustible fractions, fire spread is guided by a dual dominance of DFC (when wind speed is high) and radiation (when wind speed is low; refer to Fig. 11b and Supplementary Fig. S6). At high wind speeds, DFC becomes dominant as the flames come into contact with adjacent structures, whereas at low wind speeds, DFC is less likely to occur. The contribution of embers to structure ignition is relatively lower owing to the probabilistic nature of ember ignition, which occurs if embers land on a combustible surface. Therefore, the reduction in combustible fraction has a more significant effect on embers compared with DFC or radiation, which are related to heat flux accumulation. Nonetheless, a non-negligible contribution from embers persists (refer to Supplementary Fig. S6), introducing an element of uncertainty into the spread rate in the simulations.
The uncertain effects of radiation absorptivity on change in ROS when embers are considered aligns with embers as the dominant propagation modes across various radiation absorptivity levels (Fig. 11c, d). At low wind speeds, a marginal contribution from radiation surfaces in lieu of DFC contributions (Supplementary Fig. S7), and only under these conditions, changing radiation absorptivity (i.e. performing surface treatment) can affect fire spread, as radiation absorptivity solely influences heat transfer via radiation.
Embers dominate for different values of radiation absorptivity because the parameter is related to surface treatment and thus has little effect on the ignition mechanism by embers. Embers also become the dominant mode of propagation for different peak HRR and fully developed duration (Supplementary Fig. S8), which causes the uncertain effects of these parameters to change in ROS when embers are considered.
In scenarios involving embers, various combinations of structure size and separation distance exhibit a lack of susceptibility to the influence of different wind speeds on the dominant mode of fire propagation. Additionally, they do not yield critical values that enable no-spread conditions at separation distances narrower than the critical threshold. This pattern arises from the dominance of embers as the primary driving force behind WUI fire propagation, whereby separation distance predominantly impacts the potential for ember ignition based on the likelihood of embers landing on combustible materials. Consequently, the trajectory of embers becomes the predominant determinant factor affecting the no-spread conditions.
As the trajectory of embers follows a lognormal probabilistic pattern, even at lower wind speeds, the potential for embers to land at considerable distances from the source remains possible, albeit with low probability as long as it remains above 0.001 (owing to truncation of the PDF in the model). This implies that within the confines of the lognormal distribution for ember trajectories, a scenario can exist where the separation distance remains within the possible range for ember landing, rendering the no-spread condition elusive – even under calm wind conditions. In such instances, the outcome becomes unpredictable, leading to an indeterminate critical wind speed necessary to achieve the no-spread condition, a distinction from the no-ember scenario.
In scenarios where embers are not considered, the potential presence of critical winds leading to no-spread conditions at a specific separation distance indicates that, with sufficiently high wind speeds, the fire can still propagate through DFC and radiation. This underscores the importance of optimising separation distances, even if ember-driven propagation, recognised as the primary cause (Caton et al. 2017), can be effectively mitigated in the future. This becomes particularly important when historical weather data for the region of interest indicate the occurrence of strong wind conditions.
When combustible vegetation occupies the separation distance, an effective approach to mitigate the spread rate is by arranging the combustible cells in close proximity, creating isolated islands of combustibles. This island concept creates defensible space, preventing the fire from advancing further, particularly when the distance between these islands is greater. This is attributed to the reduced ember disposition and lower heat received by DFC and radiation on combustible cells, which is insufficient to propagate the fire. This concept has found practical application in current WUI fire mitigation strategies, where a critical separation distance between combustible elements is mandated (Syphard et al. 2014; Alexandre et al. 2015; Syphard and Keeley 2019). Consequently, our model offer a substantiated physical explanation for these phenomena.
The presence of vegetation between structures leads to an increase in the spread rate, in contrast to scenarios where the separation distance consists of open space (the baseline scenario) in more densely populated communities. This observation aligns with findings from historical WUI fires in California (Kramer et al. 2018, 2019; Herbert and Butsic 2022). These studies revealed that despite the presence of fewer structures, the presence of combustible vegetation intensifies the severity of fires, resulting in greater damage in less densely populated regions. However, as shown in Fig. 9c, different configurations of structures, open spaces and vegetation can either accelerate or decelerate the ROS relative to the baseline.
The recommendations derived from our model align with existing mitigation strategies (Alexandre et al. 2015), while also providing explanations for the underlying phenomena. The findings presented in the present study pave the way for further development and empirical testing of mitigation strategies, an area currently lacking attention (Mockrin et al. 2016). However, it is important to note that the recommendations outlined herein are primarily applicable during the early stages of mitigation strategy formulation and should not be the sole basis for decision-making.
Given that our model operates in 1D and has inherent limitations, such as overlooking spatial and temporal variability in inputs such as wind and structural factors, neglecting topographical considerations for urban fuels and relying on calibrated ember parameter values, it is imperative to view the recommendations as relative comparisons between different scenarios, as per the objective of this study, rather than as definitive or exact values. Hence, although our model offers insights into mitigation strategies, a more comprehensive investigation is warranted to obtain refined outcomes with increased confidence before adopting any recommendations put forth in this study.
Conclusions
We developed a comprehensive 1D model for simulating WUI fires, incorporating fire propagation through direct flame contact, radiation and embers. This model seamlessly integrates with existing operational wildland fire models. Our model was compared with the empirical approach of Hamada (1951), showing differences within 20%, and with historical WUI fire data, with spread rates aligning within the reported values’ order of magnitude.
Through parametric study and extensive analysis, we investigated the relative change of spread rate caused by different structure properties and layout factors. Findings indicate that variations in combustible fractions, peak HRR and combustibility inversely affect spread rate, while radiation absorptivity exhibits a linear effect at low wind speeds and fully developed duration has insignificant effect on spread rate. However, when embers are considered, embers dominate fire propagation, making the effect of these parameters on spread rate uncertain.
We found that the critical separation distance to prevent fire spread varies with structure size. For example, approximately 30 m is needed for a 10 m structure and 35 m for a 20 m structure. However, these values are not definitive, and the model only shows that these approximate values point to more universal limits existing. In the presence of embers, wider separation distances are necessary to limit fire spread. Notably, the presence of vegetation within the separation distance has a substantial impact on spread rate profiles, depending on the number and arrangement of non-combustible cells.
Our model suggests that arranging combustible cells close together to create isolated islands of combustibles, a strategy already implemented in some mitigation efforts (Syphard et al. 2014; Alexandre et al. 2015; Syphard and Keeley 2019), effectively reduces fire spread. Our model also shows that areas with lower structure density experience more severe damage compared with those with denser housing arrangements owing to the increased spread rate when vegetation occupies the separation distance, which aligns with historical WUI fire data from California (Kramer et al. 2018, 2019; Herbert and Butsic 2022), while also providing explanations for the underlying phenomena.
Despite its 1D nature and inherent limitations, including oversights in spatial and temporal variability, and reliance on calibrated ember parameter values, our model provides valuable insights into mitigation strategies and a pathway to potentially optimise mitigation within a community in the future. However, it is essential to interpret the study results as relative comparisons between scenarios rather than definitive values. Thus, further comprehensive investigations are warranted to refine outcomes and increase confidence before implementing recommendations. Nevertheless, the model and insights gathered pave the way for the early-stage development of advanced WUI fire mitigation strategies.
Declaration of funding
This research was funded by the Gordon and Betty Moore Foundation. Additional support was provided by the National Science Foundation (PREEVENTS Grant No. 1854952) and a California Department of Forestry and Fire Protection (CAL FIRE) Forest Health Grant (Agreement No. 8GG21815).
References
Alexandre PM, Mockrin MH, Stewart SI, Hammer RB, Radeloff VC (2015) Rebuilding and new housing development after wildfire. International Journal of Wildland Fire 24, 138-149.
| Crossref | Google Scholar |
Blanchi R, Leonard J, Haynes K, Opie K, James M, Oliveira FDD (2014) Environmental circumstances surrounding bushfire fatalities in Australia 1901–2011. Environmental Science & Policy 37, 192-203.
| Crossref | Google Scholar |
Brown PT, Hanley H, Mahesh A, Reed C, Strenfel SJ, Davis SJ, Kochanski AK, Clements CB (2023) Climate warming increases extreme daily wildfire growth risk in California. Nature 621, 760-766.
| Crossref | Google Scholar | PubMed |
Calzada V, Ramon V, Faivre N, Rego CC, Manuel F, Rodríguez M, Manuel J, Xanthopoulos G (2018) Forest Fires: Sparking firesmart policies in the EU. (Luxembourg: Publications Office of the European Union) 10.2777/181450
Caton SE, Hakes RSP, Gorham DJ, Zhou A, Gollner MJ (2017) Review of pathways for building fire spread in the wildland-urban interface. Part I: exposure conditions. Fire Technology 53, 429-473.
| Crossref | Google Scholar |
Dossi S, Messerschmidt B, Ribeiro LM, Almeida M, Rein G (2022) Relationships between building features and wildfire damage in California, USA and Pedrógão Grande, Portugal. International Journal of Wildland Fire 32, 296-312.
| Crossref | Google Scholar |
Fayad J, Accary G, Morandini F, Chatelon F-J, Rossi L, Marcelli T, Cancellieri D, Cancellieri V, Rahib Y, Morvan D, Meradji S, Pieri A, Duret J-Y, Rossi J-L (2023) Numerical assessment of safe separation distance in the wildland–urban interfaces. Fire 6, 209.
| Crossref | Google Scholar |
Gibbons P, Van Bommel L, Gill AM, Cary GJ, Driscoll DA, Bradstock RA, Knight E, Moritz MA, Stephens SL, Lindenmayer DB (2012) Land management practices associated with house loss in wildfires. PLoS One 7, e29212.
| Crossref | Google Scholar | PubMed |
Hakes RSP, Caton SE, Gorham DJ, Gollner MJ (2017) A review of pathways for building fire spread in the wildland urban interface Part II: response of components and systems and mitigation strategies in the United States. Fire Technology 53, 475-515.
| Crossref | Google Scholar |
Hamada M (1951) On the rate of fire spread, Non-Life Insurance Rating Organization of Japan. Disaster Research 1, 35-44.
| Google Scholar |
Hammer RB, Radeloff VC, Fried JS, Stewart SI (2007) Wildland-urban interface housing growth during the 1990s in California, Oregon, and Washington. International Journal of Wildland Fire 16, 255-265.
| Crossref | Google Scholar |
Henning A, Cox J, and Shew D (2015) CAL FIRE’s Damage Inspection Program: Its Evolution and Implementation. Available at http://www.fltwood.com/perm/nfpa-2016/scripts/sessions/M26.html
Herbert C, Butsic V (2022) Assessing the effectiveness of green landscape buffers to reduce fire severity and limit fire spread in California: case study of golf courses. Fire 5, 44.
| Crossref | Google Scholar |
Jiang W, Wang F, Fang L, Zheng X, Qiao X, Li Z, Meng Q (2021) Modeling of wildland-urban interface fire spread with the heterogeneous cellular automata model. Environmental Modeling & Software 135, 104895.
| Crossref | Google Scholar |
Kramer HA, Mockrin MH, Alexandre PM, Stewart SI, Radeloff VC (2018) Where wildfires destroy buildings in the US relative to the wildland-urban interface and national fire outreach programs. International Journal of Wildland Fire 27, 329-341.
| Crossref | Google Scholar |
Kramer HA, Mockrin MH, Alexandre PM, Radeloff VC (2019) High wildfire damage in interface communities in California. International Journal of Wildland Fire 28, 641-650.
| Crossref | Google Scholar |
Lautenberger 2013 Wildland fire modeling with an Eulerian level set method and automated calibration. Fire Safety Journal 62, 289-298.
| Crossref | Google Scholar |
Li H, Jia H, Zhong K, Zhai Z (John) (2021) Analysis of factors influencing actual absorption of solar energy by building walls. Energy 215, 118988.
| Crossref | Google Scholar |
Mahmoud H, Chulahwat A (2018) Unraveling the complexity of wildland urban interface fires. Scientific Reports 8, 9315.
| Crossref | Google Scholar | PubMed |
Manzello SL, Suzuki S, Gollner MJ, Fernandez-Pello AC (2020) Role of firebrand combustion in large outdoor fire spread. Progress in Energy and Combustion Science 76, 100801.
| Crossref | Google Scholar | PubMed |
Maranghides A, Johnsson EL (2008) ‘Residential structure separation fire experiments.’ NIST TN 1600. (National Institute of Standards and Technology: Gaithersburg, MD) 10.6028/NIST.TN.1600
Maranghides A, Link ED, Hawks S, McDougald J, Quarles SL, Gorham DJ, Nazare S (2022) WUI structure/parcel/community fire hazard mitigation methodology.’ NIST TN 2205. (National Institute of Standards and Technology (U.S.): Gaithersburg, MD) 10.6028/NIST.TN.2205
Masoudvaziri N, Szasdi Bardales F, Keskin OK, Sarreshtehdari A, Sun K, Elhami-Khorasani N (2021) Streamlined wildland-urban interface fire tracing (SWUIFT): modeling wildfire spread in communities. Environmental Modeling & Software 143, 105097.
| Crossref | Google Scholar |
Millington JDA, Wainwright J, Perry GLW, Romero-Calcerrada R, Malamud BD (2009) Modeling Mediterranean landscape succession-disturbance dynamics: a landscape fire-succession model. Environmental Modeling & Software 24, 1196-1208.
| Crossref | Google Scholar |
Mockrin MH, Stewart SI, Radeloff VC, Hammer RB (2016) Recovery and adaptation after wildfire on the Colorado Front Range (2010–12). International Journal of Wildland Fire 25, 1144-1155.
| Crossref | Google Scholar |
NewsWire (2020) RMS estimates that total insured losses from the 2020 western U.S. wildfires will be between US$7bn–US$13bn. Insurance Journal. Available at https://www.insurancejournal.com/services/newswire/2020/12/17/594096.htm
Ohgai A, Gohnai Y, Ikaruga S, Murakami M, Watanabe K (2004) Cellular automata modeling for fire spreading as a tool to aid community-based planning for disaster mitigation. In ‘Recent advances in design and decision support systems in architecture and urban planning’. (Eds JP Van Leeuwen, HJP Timmermans) pp. 193-209. (Springer Netherlands: Dordrecht) 10.1007/1-4020-2409-6_13.
Osher S, Fedkiw RP (2001) Level set methods: an overview and some recent results. Journal of Computational Physics 169, 463-502.
| Crossref | Google Scholar |
Page WG, Butler BW (2017) An empirically based approach to defining wildland firefighter safety and survival zone separation distances. International Journal of Wildland Fire 26, 655-667.
| Crossref | Google Scholar |
Perry GLW (1998) Current approaches to modeling the spread of wildland fire: a review. Progress in Physical Geography: Earth and Environment (2222224510.1177/030913339802200204)
| Google Scholar |
Radeloff VC, Hammer RB, Stewart SI, Fried JS, Holcomb SS, McKeefry JF (2005) The wildland-urban interface in the United States. Ecological Applications 15, 799-805.
| Crossref | Google Scholar |
Rehm RG, McDermott R (2009), ‘Fire-front propagation using the level set method.’ NBS TN 1611. (National Institute of Standards and Technology: Gaithersburg, MD) 10.6028/NIST.TN.1611
Sardoy N, Consalvi JL, Kaiss A, Fernandez-Pello AC, Porterie B (2008) Numerical study of ground-level distribution of firebrands generated by line fires. Combustion and Flame 154, 478-488.
| Crossref | Google Scholar |
Skowronski NS, Haag S, Trimble J, Clark KL, Gallagher MR, Lathrop RG (2016) Structure-level fuel load assessment in the wildland-urban interface: a fusion of airborne laser scanning and spectral remote-sensing methodologies. International Journal of Wildland Fire 25, 547-557.
| Crossref | Google Scholar |
Spyratos V, Bourgeron PS, Ghil M (2007) Development at the wildland-urban interface and the mitigation of forest-fire risk. Proceedings of the National Academy of Sciences 104, 14272-14276.
| Crossref | Google Scholar | PubMed |
Syphard A, Keeley J (2019) Factors associated with structure loss in the 2013–2018 California wildfires. Fire 2, 49.
| Crossref | Google Scholar |
Syphard AD, Brennan TJ, Keeley JE (2014) The role of defensible space for residential structure protection during wildfires. International Journal of Wildland Fire 23, 1165-1175.
| Crossref | Google Scholar |
Syphard AD, Brennan TJ, Keeley JE (2017) The importance of building construction materials relative to other factors affecting structure survival during wildfire. International Journal of Disaster Risk Reduction 21, 140-147.
| Crossref | Google Scholar |
Zhao S (2011) Simulation of mass fire-spread in urban densely built urban areas based on irregular coarse cellular automata. Fire Technology 47, 721-749.
| Crossref | Google Scholar |


