Physics-based modelling of junction fires: parametric study
Ahmad Hassan A * , Gilbert Accary B , Duncan Sutherland C and Khalid Moinuddin AA Institute for Sustainable Industries and Liveable Cities, Victoria University, Melbourne, Vic. 8001, Australia.
B Scientific Research Centre in Engineering, Lebanese University, Museum Square, 1106 Beirut Lebanon.
C School of Science, University of New South Wales, Canberra, ACT 2610, Australia.
International Journal of Wildland Fire 32(3) 336-350 https://doi.org/10.1071/WF22121
Submitted: 30 June 2022 Accepted: 10 February 2023 Published: 2 March 2023
© 2023 The Author(s) (or their employer(s)). Published by CSIRO Publishing on behalf of IAWF. This is an open access article distributed under the Creative Commons Attribution-NonCommercial-NoDerivatives 4.0 International License (CC BY-NC-ND)
Abstract
Background: Junction fires occur when two fire fronts merge. The rate of spread (ROS) and heat release rate (HRR) of the junction increase more quickly than that of each fire front, this effect exacerbated by slopes.
Aims: Numerical modelling of junction fires and an interpretation of their behaviour are given examining the key influencing factors.
Methods: Twenty physics-based simulations of laboratory-scale junction fires were performed for a shrub fuel bed using FIRESTAR3D, varying slope (0°–40°) and junction angles (15°–90°).
Key results: Accelerative and decelerative behaviours were observed for junction angles lower than 45°, but above this, deceleration was absent. The behaviour was firmly related to junction angle evolution, which controlled the flame and interactions between fire fronts. HRR followed similar trends; maximum HRR increased with increasing junction angle. Convection was the primary heat transfer mode in the initial propagation phase. In no-slope cases, radiation was the dominant method of heat transfer, but convection dominated fires on slopes.
Conclusions: The physics-based model provided great insight into junction fire behaviour. The junction angle was critical for determining ROS and fire behaviour.
Implications: The research helped to assess the effects of some topographical parameters in extreme fires. Situational awareness, operational predictions and firefighter safety will consequently improve.
Keywords: bushfire, eruption, fully physical model, high-performance computing, merging fire, multiphysics and multiscale CFD-based model, sloping terrain, unsteady forest fire, zippering effect.
Introduction
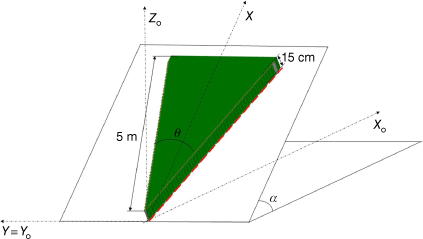
Extreme wildfire behaviour, namely the intersection and merging of wildfire fronts, can have devastating impacts on the wildland–urban interface (WUI), wildlife and forest ecosystems, such as observed during the 2019–20 Australian summer bushfires. Junction fire is an idealisation of the major problem of the intersection of two fire fronts. The rate of spread (ROS) of a junction point is significantly higher than that of a single fire front (Viegas et al. 2012). In Fig. 1, the geometry of vegetation representing a junction fire as well as fundamental parameters considered in this study are represented.
|
The idealisation of the junction fire problem consists of a formulation in which two linear fire fronts intersect, making an angle θ between them and spreading over a uniform fuel bed making an angle α with the horizontal plane. The fire fronts then spread where the junction point advances faster than the propagation of each fire front (Viegas et al. 2012, 2013; Raposo et al. 2018).
According to Raposo et al. (2018), at the start of the merging process, the ROS of a junction point increases very rapidly. Given the very high values of ROS that the junction point can reach, the early stage is considered the acceleration phase. Even on a horizontal fuel bed, ROS can reach very high values. The fire behaviour may be related to fast jumps of the junction point, which is followed by a steady decrease in its displacement velocity over time, which is referred to as the deceleration phase. This process is enhanced by the reduction of the initial angle between the two fire fronts or by the presence of an aligned ground slope or driving wind (Raposo et al. 2018).
One particular example motivated researchers to study junction fires: the fire that occurred in the vicinity of Canberra, Australia, in 2003 when the MacIntyre’s Hut and Bendora fires merged in a junction configuration (Doogan 2003). This merging led to a devastating and intense fire that spawned the first known pyrogenic tornado (McRae et al. 2013).
To reduce this natural hazard and other extreme wildfire events, which are becoming more frequent in many parts of the world, sometimes as a result of human activities or environmental factors, we need a better understanding of merging wildfire behaviour. These phenomena are characterised by extremely large energy accumulation due to feedback between that fire and its environment, leading to extreme behaviour and dramatical acceleration of ROS. Physics-based simulation tools have been developed to gain more insights into the underlying physics of such phenomena and such simulations appear to be a promising approach to understanding extreme fire behaviour (Pastor et al. 2003).
Previous attempts to examine the behaviour of junction fire were mostly experimental, at the laboratory scale (Viegas et al. 2012, 2013; Raposo et al. 2018; Sullivan et al. 2019) with some work at the field scale (Raposo et al. 2018; Filkov et al. 2021). Viegas et al. (2012) conducted a set of non-slope junction fire experiments. The finding of extremely large ROS triggered interest in this phenomenon. Their study was limited to junction angles 10, 20, 30 and 45° with a single type of fuel (dead needles of Pinus pinaster) over a horizontal fuel bed. An analytical model based on an assumed distribution of energy produced by the fire front near the intersection point was proposed. There was a discernible acceleration phase in such conditions at fire ignition, followed by a subsequent deceleration phase after which the fire was extinguished. This appeared similar to counter-eruptive fire behaviour. Note that in counter-eruptive fire, acceleration can be followed by a deceleration phase. The rate of increase of θ with time is generally larger for smaller initial values. With higher initial θ values, the deceleration of fire was limited.
The research was extended to encompass the effect of slope angle and the effect of fuel bed vegetation (Viegas et al. 2013). The maximum values of ROS that were reached were possibly the highest values that have been measured in laboratory experiments in the corresponding fuel bed and slope test conditions. However, ROS evolution and distance to achieve maximum propagation speed did not vary significantly as the vegetation changed and the fire behaviour was the same for all tested fuels. The maximum value of scaled rate of spread R′ increased with slope angle α. With higher slopes, only an acceleration phase was observed; no deceleration phase was observed.
Thomas et al. (2017) conducted some field-scale numerical simulations for junction fire using a coupled fire–atmosphere model, taking advantage of the inclusion of atmospheric dynamics, fire progression and fire–atmosphere interactions using WRF-Fire - the Weather Research and Forecasting model with surface fire model (Coen et al. 2013). The simulations reproduced all qualitative features, albeit no quantitative agreement was found with experiments. The discrepancies were attributed to differences in scale between experiments and simulations. The relationship between the dynamic behaviour of junction fire and fire convective flow induced by the geometry of fire fronts was investigated using the modelled pyro-convective processes in WRF-Fire. The mechanism for the rapid fire spread included the formation of counter-rotating pairs of vertical vortices lying on or ahead of the fire front. There was clearly a relationship between fire front geometry and ROS in the WRF-Fire model output; however, no relationship between local fire front curvature and instantaneous local ROS was found. The underlying empirical model of fire spread used in the WRF-Fire simulations, with no explicit treatment of radiative heat transfer, may contribute to some of the discrepancies observed. Scale is also likely an issue, as larger-scale fires seem to exhibit greater instabilities than observed in smaller-scale experiments and simulations.
Raposo et al. (2018) demonstrated that two phases of evolution (acceleration and deceleration) change with slopes. The scale of fire and type of vegetation did not affect fire behaviour. Radiation was found as the primary driving mechanism only during the last phase of deceleration.
Sullivan et al. (2019) conducted small-scale experiments (maximum fire line length 1.5 m) including wind as a variable within a wind tunnel. In this case, the V-shaped fire fronts were inside a larger rectangular fuel bed. The fire moved forwards into the V-shape, with weak short-lived fronts interaction in no-wind cases. The asymmetry in the pattern of spread of fires outside the V-shape in no-wind cases suggests that there was enough interaction between the two arms to effect fire spread outside the V-shape. However, there was no enhanced ROS over what was expected from geometric considerations.
Filkov et al. (2021) conducted field-scale experiments and developed a method to track fire front propagation using emerging drone technologies for various fire scenarios including merging fire. They found almost constant propagation with an acceleration in the last phase for some cases, in contrast to Viegas et al. (2012, 2013) and Raposo et al. (2018). They assumed that the asymmetry, due to inconsistent wind directions and speeds, could affect the ROS. Igniting multiple fires concurrently may have caused a certain level of interaction between the flames; hence, the propagation dynamics of the merging fires observed in these experiments could be different to independent junction fires.
In this study, the objective is to conduct three-dimensional (3D) physics-based simulations with the validated FIRESTAR3D model (Morvan et al. 2018) (which was also rigorously validated against laboratory-scale junction fire experiments; Hassan et al. 2022) to investigate the details of phases of fire propagation as slope and junction angles change. The study also aims to analyse various important parameters in junction fire propagation behaviour: heat release rate (HRR), mode of heat transfer propagation and flame shape.
FIRSTAR3D (Morvan et al. 2018) is a 3D model developed by a collaboration among Aix-Marseille University, Lebanese University and Toulon University. FIRESTAR3D is based on a multi-phase formulation and solves the conservation equations of the coupled system formed by the vegetation and the surrounding gaseous medium. The model takes into account the vegetation degradation processes, combustion, the interaction between the atmospheric boundary layer and vegetation, and transport in the gaseous phase.
In the present paper, which is the first part of more general research, a numerical set-up on multiple fuel bed slopes without wind was developed with FIRESTAR3D. Previously, model validation and sensitivity studies were carried out (Hassan et al. 2022). The validation was carried out against some of the experiments that were conducted at Coimbra University (Raposo et al. 2018). The description of the numerical set-up along with some numerical sensitivity analyses are available in Hassan et al. (2022); however, an overview is presented in this paper.
Framework of numerical model
A multiphase formulation is the basis of the physics-based modelling that comprises formulating the conservation equations (mass, momentum, energy, etc.) governing the behaviour of the coupled system formed by the vegetation and the surrounding atmosphere inside elementary control volumes including both the solid phase (vegetation) and the gaseous phase. Like a homogenisation step, this first operation results in the introduction of source and sink terms on the right-hand side of the equations, representing the contributions of the interaction terms (exchanges of mass, drag, heat flux, etc.) between the gaseous phase and the vegetation. Full details of FIRESTAR3D are presented in Grishin (1997), Morvan and Dupuy (2004), Morvan et al. (2007, 2009) and Morvan (2011).
The FIRESTAR3D model comprises two parts that are distinctly solved on two grids. The first consists of the equations of a reacting turbulent flow in the gaseous phase composed of a mixture of fresh air with the gaseous products resulting from the degradation of the vegetation (by drying, pyrolysis and heterogeneous combustion). This represents a homogeneous combustion in the flame zone. The second part comprises the equations governing the state and the composition of the vegetation subjected to an intense heat flux coming from the flaming zone. Solving the gaseous-phase model comprises solving conservation equations of mass, momentum, energy (in enthalpy formulation) and chemical species (O2, N2, CO, CO2 and H2O) filtered using an unsteady reynolds averaged navier-stokes approach (TRANS) with Favre average formulation (Faver et al. 1976) or, alternatively, using a large eddy simulation (LES) approach. To account for turbulence, the unsteady LES approach (with the Smagorinsky constant CSGS = 0.07 sub-grid-scale model) was used in the resolution of conservation equations of mass, momentum, energy and chemical species. The temperature dependence of the gas-mixture enthalpy is based on CHEMKIN thermodynamic tables (Kee et al. 1990). A combustion model based on the Eddy Dissipation Concept (Cox 1995; Morvan et al. 1998) is used to evaluate the combustion rate occurring in the gaseous phase. Eventually, as the radiation heat transfer (mainly due to the presence of soot particles in the flame) plays an important role in the propagation of the fire front, the field of soot volume fraction in the gas mixture is computed by solving a transport equation (Moss and Cox 1990; Syed et al. 1991) including a thermophoretic contribution in the convective term and taking into consideration soot oxidation (Nagle and Strickland-Constable 1962).
In the vegetation model, during thermal degradation, the composition of the solid fuel particles representing the vegetation is characterised as a mixture of dry material (the generic term for a mixture of cellulose, hemicellulose and lignin), charcoal, moisture and residual ashes. The model involves solving the equations governing the time evolution of the mass fractions of water, dry material and charcoal. Additionally, the total mass of the solid particle, its volume fraction and its temperature as a function of time are also calculated. The model does not assume a thermodynamic equilibrium between the gas mixture and solid fuel particles for each solid particle. The degradation of the vegetation is governed by three temperature-dependent mechanisms: drying, pyrolysis and charcoal combustion. The pyrolysis process starts once the drying process is completed and charcoal combustion starts once the pyrolysis process is achieved. The constants of the model associated with charcoal combustion (activation energy and pre-exponential factor) were determined empirically from a thermal analysis conducted on various solid fuels samples (Incropera and DeWitt 1996; Grishin 1997).
The interaction between the gaseous and solid phases is taken into account through coupling terms that appear in both parts of the model. The coupling in the momentum and turbulence equations is obtained by adding aerodynamic drag terms. These terms (both source and sink) are proportional to the local average of the velocity magnitude, V (for turbulence destruction), to V2 (for the momentum equation), and to V3 (for turbulence production), and include a drag coefficient (evaluated empirically) multiplied by a reference surface, defined here as the Leaf Area Density. Convective heat transfer between the gas mixture and the solid fuel is based on empirical correlations for the convective transfer coefficient (Incropera and DeWitt 1996). The radiative heat transfer equation is solved (Siegel and Howel 1992) using the soot in the flaming zone and the hot particles in the vegetation layer (embers) (Grishin 1997) as sources of radiation. Finally, mass transfer from the solid phase to the gaseous phase is represented by adding source or sink terms in the mass conservation equations of both phases.
In the second part of the model, a fully implicit finite volume method is used to solve the governing equations in the gaseous phase, in a segregated formulation (Patankar 1980). The FIRESTAR3D model predicts turbulent reacting flows in rectangular domains using a structured but non-uniform staggered mesh. Time discretisation relies on a third-order Euler scheme with a variable time-stepping strategy. To ensure numerical stability, the spatial discretisation of the equations is based on second-order schemes with flux limiters (i.e. the QUICK scheme; Li and Rudman 1995; Versteeg and Malalasekera 2007) for convective terms while diffusion terms are approached by central difference approximation with deferred corrections (Ferziger et al. 2002) to maintain the second-order accuracy in space. The Radiative Transport Equation (RTE) is solved using a Discrete Ordinate Method, consisting in solving the radiation-intensity equation in a finite number of directions (Modest 2003). The RTE accounts for the absorption of radiative intensity by the gas–soot mixture depending on the amounts of combustion products (CO2 and H2O), gas mixture temperature and soot volume fraction (Kaplan et al. 1994). This set of discrete contributions is then integrated using a numerical Gaussian quadrature rule (the S8 method is used; Modest 2003) for the computation of the total irradiance. The set of ordinary differential equations describing the time evolution of solid-fuel state (mass, temperature and composition) are solved separately using a fourth-order Runge–Kutta method. From the implementation point of view, the computation code is parallelised (Accary et al. 2007) and optimised (Accary et al. 2009) using OpenMP directives (operational on shared memory platforms and Intel Xeon Phi coprocessors). Notably, the hydrodynamic module of the code has been extensively validated on several benchmarks of laminar and turbulent natural convection, forced convection and neutrally stratified flow within and above a sparse forest canopy (Accary et al. 2009; Khalifeh et al. 2009).
Experimental junction fires and validation results
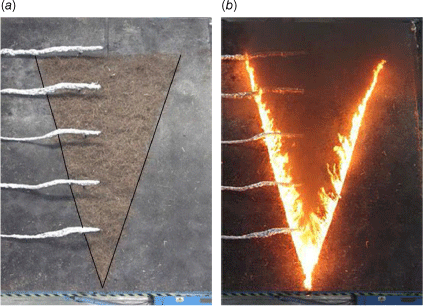
The junction fire experiments used for the model validation study (Hassan et al. 2022) were conducted at the Forest Fire Research Laboratory of Coimbra University, using Canyon Table DE4 (Viegas et al. 2012), which has a working area of 6 × 8 m2 (see Fig. 2). The fuels used were dead pine needles, Erica shrubs and straw. The fuel load was kept constant at 0.6 kg m−2 (Raposo et al. 2018). The experiments were designed to measure ROS with fuel bed slopes ranging from 0 to 40°, as measured from a horizontal plane (the ground). Four different junction angles (20, 30, 40 and 45°) were used with the three different fuel types. The experiments reported by Raposo et al. (2018) provide many experimental measurements; ROS is the main output, along with fire perimeter evolution, junction angle evolution, flow velocity and radiative heat flux. Only five carefully selected experiments (out of 28 experiments) with shrub as vegetative fuel were considered for our validation study.
|
In our simulations, a homogeneous distribution of a single fuel type (Erica shrub) is used with a very low packing ratio (0.784%) and a thickness of 15 cm. The ignition starts along two 5-m-long lines (red dashed line in Fig. 1) making an angle θ between them.
The experimental conditions were replicated in the numerical modelling. Relatively good agreement between the simulations and the experimental measurements conducted by Raposo et al. (2018) was obtained. The average relative error in the ROS was ~26%. Further details about the validation study and comparison with experiments can be found in Hassan et al. (2022).
Modelling methodology
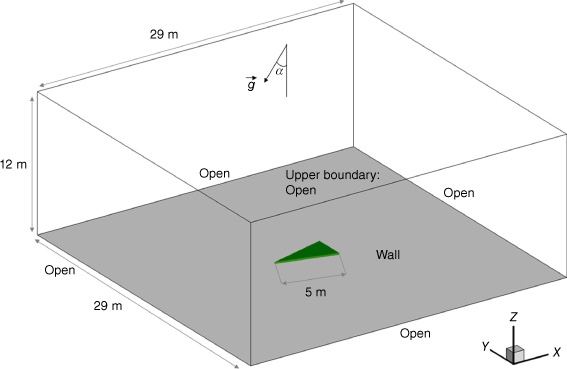
The simulations presented here used thermo-physical properties, domain size, numerical configuration and grid resolutions identical to those used in Hassan et al. (2022). Numerical simulations were carried out using V-shaped vegetation immersed inside a larger computational domain (29 m long, 29 m wide and 12 m high) as shown in Fig. 3 (length and width change with θ). Open boundary conditions (Frangieh et al. 2020) were imposed on all computational domain sides except its bottom where a solid-wall condition was applied. This configuration allows a fire to create its own airflow. The homogeneous fuel bed, of height 0.15 m and with two edges (5 m long), was located 12 m away from lateral boundaries. The fuel moisture content was fixed at 20%.
|
The homogeneous shrub fuel layer had the following main properties: fuel volume fraction αS = 0.00784, surface-to-volume ratio σS = 6900 m−1 and dry material density ρS = 500 kg m−3. Solid-fuel particles were assumed to have a cylindrical shape and to behave as a black body with a drag coefficient CD = 0.42 (Gilliers et al. 2002). A uniform mesh with (Δx, Δy, Δz) = (0.025, 0.025, 0.0125 m) was used for the solid phase, while a non-uniform grid of 160 × 160 × 160 cells was used for the fluid phase over the whole computational domain. Within the vegetation zone, the fluid-phase grid was uniform with (Δx, Δy, Δz) = (0.05, 0.05, 0.025 m) and then it was coarsened gradually toward the open boundaries according to a geometric progression coefficient. Both the solid-phase and the fluid-phase grids were characterised by cells sizes below the extinction length scale (Morvan 2011) within the vegetation. The extinction length scale is  in our case. To avoid false fire extinction, this value should not be exceeded, especially in the case of a radiation-dominated fire. The domain inclination angle to the horizontal earth, α, was specified through the angle of gravitational acceleration to the z coordinate of the computational domain. In such a specified computation domain, gravitational acceleration has two non-zero components: gx = −gsin(α) and gz = −gcos(α), where g = 9.81 m s−2 is acceleration due to gravity.
The minimum and maximum time-step values for the adaptive time-stepping strategy were set at 10−3 and 10−2 s, respectively, to obtain a truncation error of less than 10−3. Finally, global convergence was obtained (at each time step) when the L2-norms of all transport equations residuals reached 10−4 in non-normalised form. The important thermo-physical properties used in these simulations are summarised in Appendix 1.
The fire lines were ignited in the model by activating a burner. A 10-cm wide burner was activated instantaneously (at tignition = 2 s) along entire ignition lines by injecting CO gas at 1600 K from the bottom of the computational domain for 5 s.
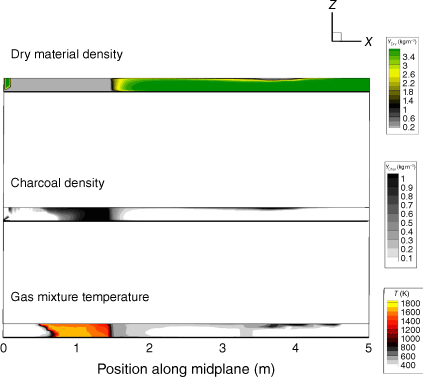
Impactful propagation of junction fires occurs as a very high propagation speed at the top of vegetation and accompanied by jumps of flames. Sometimes in small-scale simulations, like the laboratory-scale experiments in Raposo et al. (2018), fire ignition occurs in an unexpected location in the vegetation zone, making numerical tracking of junction points harder. To mitigate this problem and to avoid false estimation of ROS, a method based on the examination of dry vegetation amount and determination of the so-called pyrolysis front was used. The overall evolution of the fire front during simulations was determined using the distribution of dry material (YDry) given by αsρs for a fixed value of 0.001 kg m−3. This value was selected to represent the fire edge, where the amount of dry material is the smallest, and in direct contact with burning charcoal (flame edge represented in Fig. 4).
|
The junction point was assumed to have coincided with the midplane of the V-shaped form of the vegetation. Overall, the fluctuation in flame length was negligible in comparison with the ROS; accordingly, no differences between the pyrolysis edge and flame leading edge can be seen. To compensate for the dynamic effects and to accurately track the junction point, the edge was defined inside the vegetation at an elevation of 5 cm (four cells).
As the setup was identical to Hassan et al. (2022), there was no compelling reason to repeat the careful grid convergence and validation studies here. A minimal effect (changes in ROS(t) < 0.2 cm s−1) of grid resolution and domain size on junction point propagation was observed in Hassan et al. (2022). Consequently, the domain size and mesh considered allowed us to obtain a solution that is quasi-independent of these parameters as far as global fire behaviour is concerned (ROS, fire intensity, etc.).
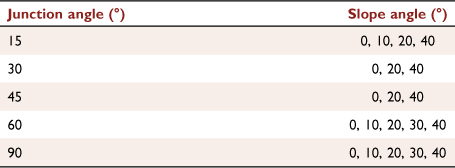
In the current parametric study, the simulated cases are given in Table 1. From here on, the designation of each simulation is according to both angles in the form Sxy where the first number, x, denotes the junction angle (°) and the second number, y, denotes the slope angle (°). For instance, S3020 represents the simulation for junction fire with a junction angle of 30° and slope angle 20°.
|
The fires studied here all spread with dynamic ROS. We omitted 2 s of data (time before ignition). The ROS was obtained from the time derivative of the position of the junction point using a first-order forward difference approximation:  , with a period Δt of 3 s. By computing ROS as a function of time, at the high temporal resolution, it was easy to detect changes between fire propagation phases.
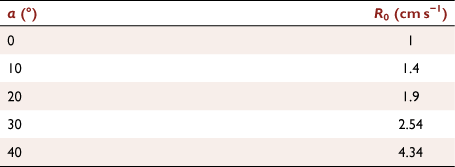
To allow non-dimensional representation, the simulated ROS was scaled by a reference ROS R0 obtained for a single straight fire front spreading in one direction using the same fuel bed and the same conditions, i.e.  . The simulations to determine R0 consisted of burning a 1 × 1 m2 area of fuel, with the same proprieties, igniting a linear fire front from one end. However, it resulted in unrealistically high ROS. Therefore, values of experimental R0 from Raposo et al. (2018) for each slope angle are used, which are given in Table 2. Each experiment is designated by EXP180y where y denotes the slope angle (°).
|
Results and discussions
In this section, firstly, fire fronts at different times deduced from the 3D dry material data are presented for six simulations, as shown in Fig. 5. The isochrones data are also analysed to obtain junction angle changes. The junction point position data are assessed to determine the ROS of the junction point as a function of time. These values are then normalised by R0 listed in Table 2. Flame shape and flow streamlines around the junction fire are illustrated and finally, heat transfer rate and HRR data are presented.
Fire front evolution
Plots of fire spread for some of the simulated cases are shown in Fig. 5. Visual assessment of the junction fire propagation may be conducted using fire perimeter advance. The evolution is assessed using the iso-surface representation of the least amount of dry material (pyrolysis edge). Sample results for three junction angles (for each one two slope angles) are shown in Fig. 5. The time of each contour, expressed in seconds, is indicated near the fire front in each corresponding figure.
Overall evolution
As can be seen in Fig. 5, the behaviour of the fire was quite symmetrical with some minor perturbations. Focusing our attention on the advance of the fire fronts, lateral development can be observed, although the lateral development was relatively slow compared with the longitudinal progression of the junction point. Note that the fire perimeter is the lower edge of each of the black–grey areas. The thickness of this area and the upper line do not represent any sign or have any meaning. This pyrolysis edge is an upper view of the edge of the black spot in the dry-material density (YDry) in Fig. 4.
By analysing the six figures, it is possible to verify that the fire perimeter advance increased with α (for each junction angle) as fire spread was higher along the central axis OX for larger values of α and consequently the adjacent points experienced a stronger advance.
Moreover, it is possible to recognise that the initial angle between the fire fronts played an important role in leading to different spreading conditions. Keeping other parameters fixed, it was observed that for smaller θ, the fire progressed very rapidly at the intersection zone compared with lateral spread. As θ increased, the advance of the junction point occurred less rapidly.
Evolution of junction angle
For smaller initial θ (15° and 30°), the overall spread of fire fronts involves gradual increase of the junction angle, but this increase was not evident in all simulations, particularly those with larger initial θ. In S1500, θ increases progressively to 180° at t − tignition = 20 s. Similarly, in S3000, the junction angle reached 100° at t − tignition = 25 s. However, the increase was slight in S4500. It was almost constant until t − tignition = 30 s. Examining all other non-slope cases (for θ = 60° and 90°), we did not see an increase or change of θ.
The existence of a slight slope helped in maintaining the V-shape at a constant θ, as can be seen in Fig. 5 for cases S1510, S3020 and S4520. Similarly, for slopes of 30 and 40°, θ was almost constant, even for higher initial values.
Experimentally, Raposo et al. (2018) and Viegas et al. (2013) noted that the tendency to achieve a linear fire front (θ = 180°), is more evident and faster for α = 0° than for α = 30° and more evident for smaller initial θ. There were a few exceptions with different types of fuel, but the major observation is that the increase is more evident for lower α and θ. The numerical results showed good agreement with this experimentally observed feature.
Role of slope and propagation phases
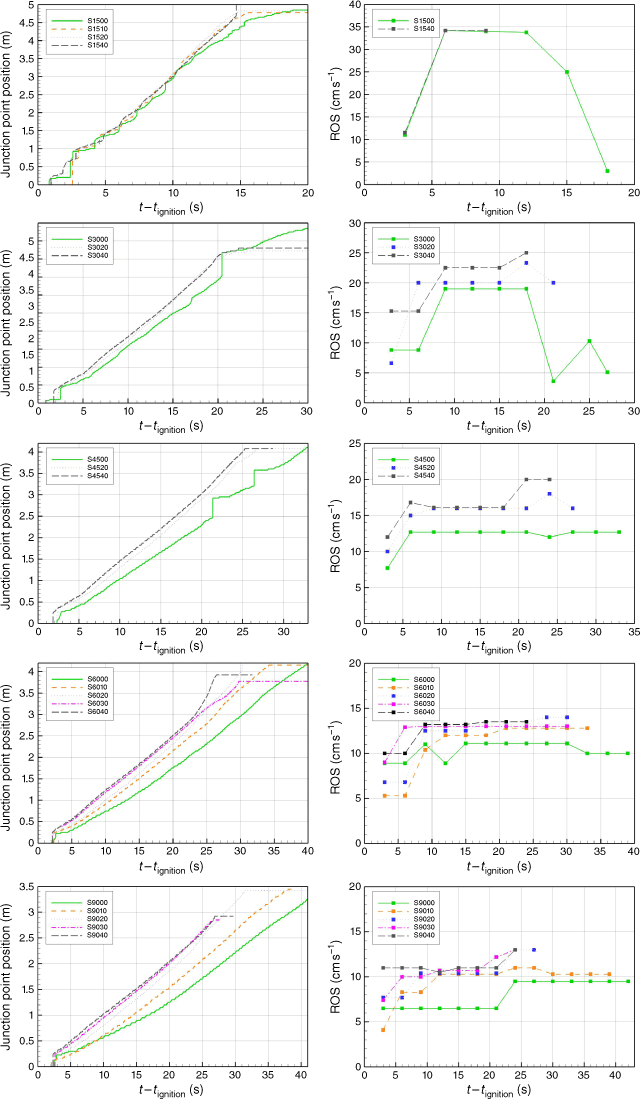
In order to analyse the role of slope, results of junction point position and ROS as a function of time for five values of θ are presented in Fig. 6. For each θ, the results are presented in separate rows where α is varied. The progression of the intersection point is crucial to understand the junction fire behaviour because this is the location where junction fires have the largest effect and maximum ROS is always observed. Note that in Fig. 6 (left column), some vertical jumps are observed shortly after the ignition that are caused by numerical errors and not included in the ROS calculation. In Fig. 6 (right column), ROS results are presented.
|
For the junction angle 15°, the fronts are very close in distance; the maximum distance between them is 1.3 m as seen in Fig. 5a, b. This could account for repetitive fire jumps (Fig. 6) due to the strong interaction between fire fronts. The distinctive characteristic of this junction angle is the absence of a fuel-bed slope effect. All curves followed a similar pattern with nearly the same slope (representing the same ROS). Each curve could be divided into two sections, the first one is with a ROS value 11.5 cm s−1, and the second part is with a ROS value 34.2 cm s−1, which was the highest value estimated in all the study. In the case of α = 0°, the junction point decelerated for t − tignition > 12 s; deceleration was significant, and the minimum ROS reached 3 cm s−1. For θ = 30°, both accelerating and decelerating behaviours were dependent on α (Hassan et al. 2022). As can be seen in Fig. 6, the value of ROS increased with α when θ = 30°.
The junction angle 45° appeared to be the threshold angle in terms of propagation behaviour, where the deceleration phase was absent even in the case with no slope. For this junction angle, the fire propagated steadily for t − tignition > 7 s. For slope angles 20° and 40°, the ROS appeared to be close, with a slight initial acceleration followed by steady propagation. For the no-slope case, despite two large fire jumps, the ROS remained steady for 9 s ≤ t − tignition < 34 s.
For junction angles 60° and 90°, the propagation was monotonically influenced by the change of α with only an initial slight acceleration. For lower slope angles, the propagation continued to accelerate steadily, instead of showing a deceleration later, unlike narrower junction angles.
Effect of junction angle
To provide a better understanding of the junction angle effect, ROS are represented in Fig. 7 in the non-dimensional form. The scaled ROS R′ generally decreases as the junction angle θ increases.

|
The cases that exhibit a significant deceleration phase are those that have undergone a significant increase in junction angle during the propagation (i.e. S1500 and S3000), whereas for the other cases, the junction angle was constant over the burning time and the propagation was either accelerative or steady. The existence of a slight slope or wide initial junction angle led to this single propagation phase, as discussed previously.
In Table 3, the increasing ratios of nominal R′ (value that lasts for the longest time) were the lowest when θ decreased from 90 to 60°. Although the change of R′ followed a non-linear trend for smaller θ, the changes in R′ were higher when θ decreased from 30 to 15°.

|
Flame and streamlines
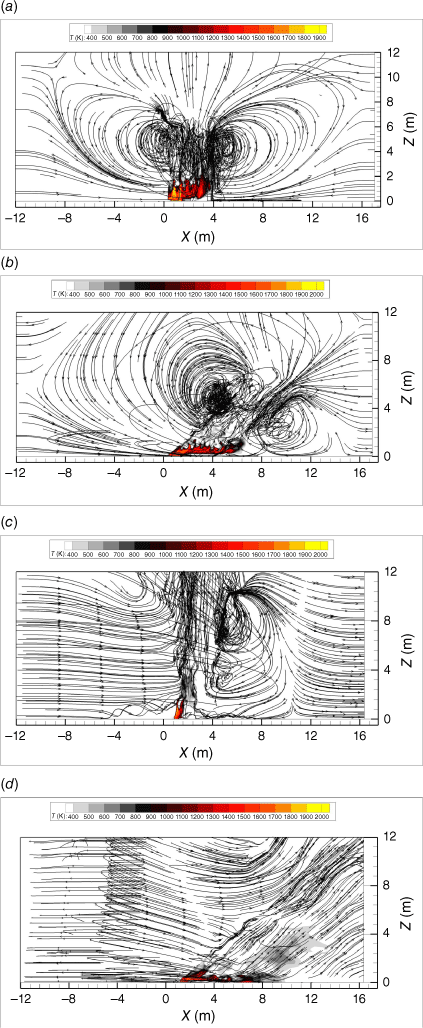
In Fig. 8, a 3D representation of the computational domain shows the streamline at the top slice of the vegetation zone (h = 0.15 m) and the vertical upward streamlines above the burning area. The temperature and the flow fields (streamlines) in the vertical median plane (Y = 0 m) are presented in Fig. 9. We noticed that fresh air was drawn in from the vicinity of the fire front supplying the thermal plume; the streamlines clearly showed the existence of aspiration regions behind and ahead of the fire front with and without slope conditions. There is clear tilt of the flame in Fig. 9b, d to the side of the unburned vegetation; however, this was not the case in Fig. 9a, c. A very high degree of turbulence is observable above the flame zone. The interactions of fire fronts led to this intense turbulence production in and around the fire front.
|
Fig. 10 illustrates the temperature in the vertical median plane (Y = 0 m) of the V-shape (θ = 15°) at different times and for different slope angles. The results show the typical evolution of fire flame. For no-slope, the flame above the junction point seemed to be vertical owing only to the effect of the natural convection flow. The presence of a constant slope caused an inclination of the flame, decreasing its angle with the horizontal surface.

|
In the acceleration phase, the flame depth was larger and spread significantly above the vegetation layer (t − tignition = 6 s). The larger value of ROS increased the flame depth and therefore the amount of fuel that was burning simultaneously.
However, in the deceleration phase (S1500/t − tignition = 13 s), the flame was more coherent and less inclined toward the vegetation. This is the typical flame shape that follows with the decelerating behaviour.
For higher slope cases (S1540/t − tignition = 13 s), the flame was tilted and spread toward the vegetation. This can be seen in Fig. 9b in the streamlines representation. Examining all cases, we noted that the flame depth was decreasing with higher θ, which is an indication of a smaller degree of interaction of fire fronts in those cases, accordingly lower ROS.
Heat transfer mode
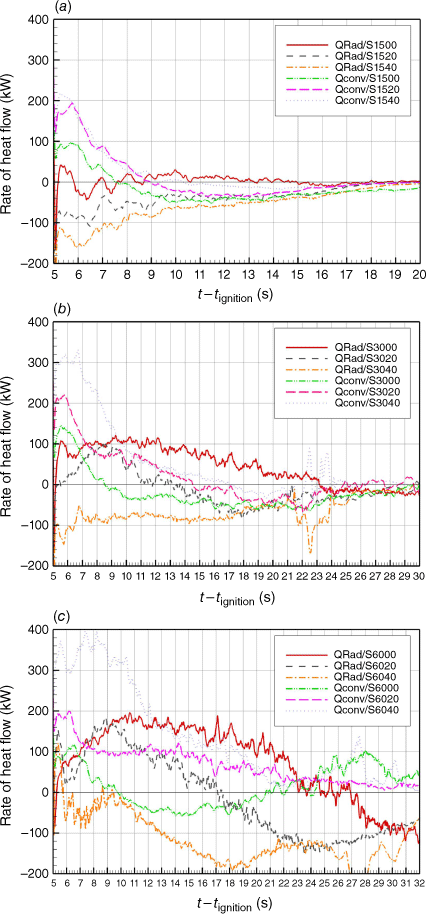
The heat transfer mode was investigated using the rate of heat exchanged by convection and radiation between ambient air and the entire vegetation layer. In the case of positive (respectively negative) heat rate, the fuel receives more (respectively less) energy than it emits.
As shown in Fig. 11, the vegetation received more energy through convection in the first phase of propagation; however, the convective heat transfer rate decreased with time. Nevertheless, for the horizontal fuel bed, at t − tignition = 9 s, the fuel lost more energy by convection than by radiation. The radiative transfer was most intense in no-slope situations, whereas for high slopes, the fuel received more heat by convection than by radiation during the entire simulation. This result can be generalised for all junction angles.
|
Taking into account the different propagations phases, it can be seen that convection decreased with time even in deceleration phases (S1500 and S3000 at t − tignition > 13 s). However, in case S6000, we can see an increase in the convective heat rate for t − tignition > 13 s; this increase for junction angles 45°, 60° and 90° under no-slope condition can be related to the steady propagation (see Fig. 6) in these cases. Similarly, the decrease of convection can be related to the decelerative propagation for cases S1500 and S3000.
HRR
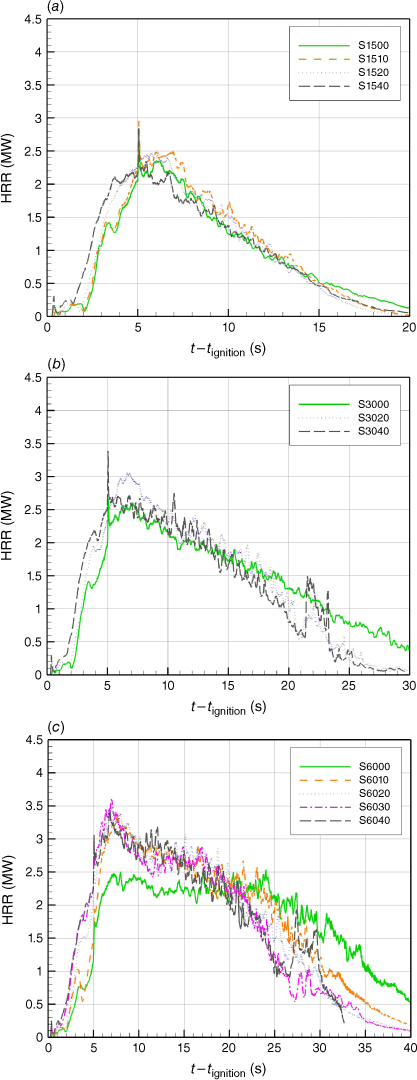
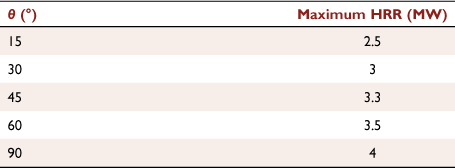
Fig. 12 represents HRR for cases with junction angles 15°, 30° and 60°. The burner is turned off at t − tignition = 5 s. The HRR maximum value for each junction angle occurred usually in simulations with the highest α (40°); however, the trend of HRR appeared to not be significantly influenced by α. It was observed that the maximum HRR was higher for larger θ (see Table 4). This may be related to slower ROS and greater residence time.
|
|
In the cases of junction angles 15° and 30°, the HRR reached its maximum value during the first 5 s, then decreased sharply, reflecting the accelerating behaviour of the fire, except for case S3000, where the HRR decreased slowly, reflecting the reduction of ROS in this case (deceleration phase).
For the other cases, the HRR fluctuated around a certain value near the maximum, then decreased gradually, showing a slower decrease for smaller α (see Fig. 12c). We expected such behaviour owing to the almost steady propagation (only slight initial acceleration) for θ > 45°. Note that the HRR is not affected by the total amount of vegetation (which changes with θ) as the fire fronts have the same length (5 m) for different junction angles.
Conclusion
The modelling of junction fire using a physics-based model to describe the behaviour of two intersecting fire fronts is reported in this study. The parametric study of the main geometrical parameters that govern the behaviour (slope and junction angles) encompassed a wide range of values. In a previous validation study (Hassan et al. 2022), the model predicted the correct order of magnitude of ROS and the correct trends induced by variation of junction and slope angles; hence, the model could be used for a wider range of angles. It was shown that the analysis of the ROS of the junction point was adequate to describe the overall behaviour of junction fire.
In this parametric study, a smaller junction angle induced different propagation behaviours (acceleration or deceleration) as a function of slope angle. However, the angle 45° was found to be the threshold junction angle where no deceleration phase was found. Fire propagation for the higher junction angles accelerated slightly and then appeared to be steady. For the lower junction angles, the deceleration phase was only evident for no-slope conditions, where the junction angle underwent an significant increase, and the propagating flame was less inclined toward the vegetation. The acceleration could be related to the positive convective heat transfer. The vegetation received energy through convection more than radiation in steeper slope cases, whereas the vegetation lost more heat through convection in no-slope conditions; such behaviour was common for most simulated cases. A correlation between the deceleration phase and decreasing convection could be drawn but further investigation is required. Considering the HRR results, the fire released more energy for higher junction angles. No significant effect on HRR due to slope was observed except for the deceleration phase.
This research showed how, in complement to experimental investigations, a detailed physics-based model could help understand the basic physical mechanisms governing the behaviour of extreme wildfires. More work must be carried out to explore this important mode of extreme fire behaviour, especially in wind-driven conditions and non-symmetrical slope and wind orientations. The combined effect of wind and slope on junction fires is also an important topic to be addressed.
In an extension of the present study, the effect of driving wind on the development of junction fire will be studied and the results obtained will be used to provide an interpretation of fire behaviour in real fire cases.
Data availability
The data used to support the findings are included within the article. No new data were generated.
Conflicts of interest
The authors declare no conflicts of interest.
Declaration of funding
This research was partially funded by Australian Research Council grant (DP210102540). The project also received funding from Victoria University.
Acknowledgements
This work was granted access to the high-performance computing resources of Aix-Marseille Université.
References
Accary G, Bessonov O, Fougere D, Meradji S, Morvan D (2007) Optimized parallel approach for 3D modelling of forest fire behaviour. In ‘Parallel Computing Technologies. Vol. 4671’, PaCT 2007. Lecture Notes in Computer Science. (Ed. V Malyshkin) pp. 96–102. (Springer: Berlin, Heidelberg)Accary G, Bessonov O, Fougere D, Gavrilov K, Meradji S, Morvan D (2009) Efficient parallelization of the preconditioned conjugate gradient method. In ‘Parallel Computing Technologies. Vol. 5698’, PaCT 2009. Lecture Notes in Computer Science. (Ed. V Malyshkin) pp. 60–72. (Springer: Berlin, Heidelberg)
Coen JL, Cameron M, Michalakes J, Patton EG, Riggan PJ, Yedinak KM (2013) WRF-Fire: coupled weather–wildland fire modeling with the weather research and forecasting model. Journal of Applied Meteorology and Climatology 52, 16–38.
| WRF-Fire: coupled weather–wildland fire modeling with the weather research and forecasting model.Crossref | GoogleScholarGoogle Scholar |
Cox G (Ed.) (1995) ‘Combustion Fundamentals of Fire.’ (Academic Press)
Doogan M (Ed.) (2003) ‘The Canberra Fire Storm. Inquests and Inquiry into Four Deaths and Four Fires Between 8 and 18 January 2003. Vol. 1.’ (ACT Coroners Court: Canberra)
Faver A, Kovasznay L, Dumas R, Gaviglio J, Coantic M (Eds) (1976) ‘La turbulence en mecanique des fluides.’ (Gauthier-Villars)
Ferziger J, Peric M, Leonard A (2002) ‘Computational Methods for Fluid Dynamics.’ (Springer-Verlag)
Filkov A, Cirulis B, Penman T (2021) Quantifying merging fire behaviour phenomena using unmanned aerial vehicle technology. International Journal of Wildland Fire 30, 197–214.
| Quantifying merging fire behaviour phenomena using unmanned aerial vehicle technology.Crossref | GoogleScholarGoogle Scholar |
Frangieh N, Accary G, Morvan D, Méradji S, Bessonov O (2020) Wildfires front dynamics: 3D structures and intensity at small and large scales. Combustion and Flame 211, 54–67.
| Wildfires front dynamics: 3D structures and intensity at small and large scales.Crossref | GoogleScholarGoogle Scholar |
Gilliers J, Nickling W, King J (2002) Drag coefficient and plant form response to wind speed in three plant species: Burning Bush (Euonymus alatus), Colorado Blue Spruce (Picea pungens glauca.), and Fountain Grass (Pennisetum setaceum). Journal Of Geophysical Research 107, 4760
| Drag coefficient and plant form response to wind speed in three plant species: Burning Bush (Euonymus alatus), Colorado Blue Spruce (Picea pungens glauca.), and Fountain Grass (Pennisetum setaceum).Crossref | GoogleScholarGoogle Scholar |
Grishin AM (1997) ‘Mathematical Modeling of Forest Fires and New Methods of Fighting Them’. (Ed. Albini F) (House of the Tomsk University: Tomsk, Russia)
Hassan A, Accary G, Sutherland D, Meradji S, Moinuddin K (2022) Physics-based modelling of junction fires: Sensitivity and Validation studies. In ‘IX International Conference on Forest Fire Research, 11–18 November 2022, Coimbra, Portugal. Advances in Forest Fire Research’. (Eds D Viegas, L Ribeiro) pp. 315–322. (Coimbra: University of Coimbra)
| Crossref |
Incropera F, DeWitt D (1996) ‘Fundamentals of Heat and Mass Transfer.’ (John Wiley and Sons)
Kaplan CR, Baek SW, Oran ES, Ellzey JL (1994) Dynamics of a strongly radiating unsteady ethylene jet diffusion flame. Combustion and Flame 96, 1–21.
| Dynamics of a strongly radiating unsteady ethylene jet diffusion flame.Crossref | GoogleScholarGoogle Scholar |
Kee RJ, Rupley FM, Miller JA (1990) The Chemkin Thermodynamic Data Base. SAND-87-8215B. (Sandia National Lab: Livermore, CA, USA)
Khalifeh A, Accary G, Meradji S, Scarella G, Morvan D, Kahine K (2009) Three-dimensional numerical simulation of the interaction between natural convection and radiation in a differentially heated cavity in the low Mach number approximation using the discrete ordinates method. In ‘Proceedings of the Fourth International Conference on Thermal Engineering: Theory and Applications’, 12–14 January 2009, Abu Dhabi, UAE. (ICHMT Digital Library). Available at https://books.google.com.lb/books/about/Proceedings_of_the_4th_International_Con.html?id=tFu2nQAACAAJ&redir_esc=y
Li Y, Rudman M (1995) Assessment of higher-order upwind schemes incorporating FCT for convection-dominated problems. Numerical Heat Transfer, Part B: Fundamentals 27, 1–21.
| Assessment of higher-order upwind schemes incorporating FCT for convection-dominated problems.Crossref | GoogleScholarGoogle Scholar |
McRae RHD, Sharples JJ, Wilkes SR, Walker A (2013) An Australian pyro-tornadogenesis event. Natural Hazards 65, 1801–1811.
| An Australian pyro-tornadogenesis event.Crossref | GoogleScholarGoogle Scholar |
Modest M (2003) ‘Radiative Heat Transfer.’ (Academic Press)
Morvan D (2011) Physical phenomena and length scales governing the behaviour of wildfires: a case for physical modelling. Fire Technology 47, 437–460.
| Physical phenomena and length scales governing the behaviour of wildfires: a case for physical modelling.Crossref | GoogleScholarGoogle Scholar |
Morvan D, Dupuy JL (2004) Modeling the propagation of a wildfire through a Mediterranean shrub using a multiphase formulation. Combustion and Flame 138, 199–210.
| Modeling the propagation of a wildfire through a Mediterranean shrub using a multiphase formulation.Crossref | GoogleScholarGoogle Scholar |
Morvan D, Porterie B, Larini M, Loraud JC (1998) Numerical simulation of turbulent diffusion flame in cross flow. Combustion Science and Technology 140, 93–122.
Morvan D, Meradji S, Accary G (2007) Wildfire behavior study in a Mediterranean pine stand using a physically based model. Combustion Science and Technology 180, 230–248.
| Wildfire behavior study in a Mediterranean pine stand using a physically based model.Crossref | GoogleScholarGoogle Scholar |
Morvan D, Méradji S, Accary G (2009) Physical modelling of fire spread in grasslands. Fire Safety Journal 44, 50–61.
| Physical modelling of fire spread in grasslands.Crossref | GoogleScholarGoogle Scholar |
Morvan D, Accary G, Meradji S, Frangieh N, Bessonov O (2018) A 3D physical model to study the behavior of vegetation fires at laboratory scale. Fire Safety Journal 101, 39–52.
| A 3D physical model to study the behavior of vegetation fires at laboratory scale.Crossref | GoogleScholarGoogle Scholar |
Moss J, Cox G (Eds) (1990) ‘Turbulent Diffusion Flames.’ (Academic Press)
Nagle J, Strickland-Constable R (1962) Oxidation of carbon between 1000–2000°C. In ‘Proceedings of the Fifth Conference on Carbon’. pp. 154–164. (Pergamon Press)
Pastor E, Zárate L, Planas E, Arnaldos J (2003) Mathematical models and calculation systems for the study of wildland fire behaviour. Progress in Energy and Combustion Science 29, 139–153.
| Mathematical models and calculation systems for the study of wildland fire behaviour.Crossref | GoogleScholarGoogle Scholar |
Patankar S (Ed.) (1980) ‘Numerical Heat Transfer and Fluid Flow.’ (Hemisphere Publishing: New York)
Raposo JR, Viegas DX, Xie X, Almeida M, Figueiredo AR, Porto L, Sharples J (2018) Analysis of the physical processes associated with junction fires at laboratory and field scales. International Journal of Wildland Fire 27, 52–68.
| Analysis of the physical processes associated with junction fires at laboratory and field scales.Crossref | GoogleScholarGoogle Scholar |
Siegel R, Howel J (Eds) (1992) ‘Thermal Radiation Heat Transfer’, 3rd edn. (Publishing Corporation: Washington D.C.)
Sullivan AL, Swedosh W, Hurley RJ, Sharples JJ, Hilton JE (2019) Investigation of the effects of interactions of intersecting oblique fire lines with and without wind in a combustion wind tunnel. International Journal of Wildland Fire 28, 704–719.
| Investigation of the effects of interactions of intersecting oblique fire lines with and without wind in a combustion wind tunnel.Crossref | GoogleScholarGoogle Scholar |
Syed KJ, Stewart CD, Moss JB (1991) Modelling soot formation and thermal radiation in buoyant turbulent diffusion flames. Symposium (International) on Combustion 23, 1533–1541.
| Modelling soot formation and thermal radiation in buoyant turbulent diffusion flames.Crossref | GoogleScholarGoogle Scholar |
Thomas CM, Sharples JJ, Evans JP (2017) Modelling the dynamic behaviour of junction fires with a coupled atmosphere–fire model. International Journal of Wildland Fire 26, 331–344.
| Modelling the dynamic behaviour of junction fires with a coupled atmosphere–fire model.Crossref | GoogleScholarGoogle Scholar |
Versteeg H, Malalasekera W (2007) ‘An Introduction to Computational Fluid Dynamics, the Finite Volume Method.’ (Prentice Hall)
Viegas D, Raposo J, Figueiredo A (2013) Preliminary analysis of slope and fuel bed effect on jump behavior in forest fires. Procedia Engineering 62, 1032–1039.
| Preliminary analysis of slope and fuel bed effect on jump behavior in forest fires.Crossref | GoogleScholarGoogle Scholar |
Viegas DX, Raposo JR, Davim DA, Rossa CG (2012) Study of the jump fire produced by the interaction of two oblique fire fronts. Part 1. Analytical model and validation with no-slope laboratory experiments. International Journal of Wildland Fire 21, 843–856.
| Study of the jump fire produced by the interaction of two oblique fire fronts. Part 1. Analytical model and validation with no-slope laboratory experiments.Crossref | GoogleScholarGoogle Scholar |
Appendix 1. FIRESTAR3D input parameters
The input parameters listed in Table A1 and used in the simulations are the same as Hassan et al. (2022).

|


