

Transitioning operational satellite grassland curing from MODIS to VIIRS
Danielle Wright A * and Leon Majewski BA
B
International Journal of Wildland Fire 32(10) 1438-1454 https://doi.org/10.1071/WF22227
Submitted: 20 December 2022 Accepted: 15 August 2023 Published: 13 September 2023
Abstract
In Australia, grassland curing (senescence) is an essential component in fire danger calculations. In seven (out of eight) states/territories in Australia, operational curing data are derived from the MapVictoria satellite model. From 2013 to 2023, MapVictoria data have been calculated using MODerate resolution Imaging Spectroradiometer (MODIS) data from the Terra satellite. Terra has exceeded its designed mission lifetime, but the continuation of satellite curing data is crucial for fire agencies to continue fire danger calculations.
The aim of this study was to adjust the MapVictoria model so it could be calculated using a newer satellite sensor system: Visible Infrared Imaging Radiometer Suite (VIIRS).
Data from the VIIRS bands were adjusted to match those of MODIS using timeseries from 2013 to 2020. The adjusted VIIRS bands were used to derive a VIIRS curing model: ‘viirs-mvcuring’.
The viirs–mvcuring model exhibited lower curing estimates than MODIS by up to 2.6% in Northern sites and 1.4% in Southern sites and exhibited lower curing estimates than ground-based curing by 0.1% in Northern sites and 3.5% in Southern sites.
The development of the viirs–mvcuring model has ensured continued availability of satellite curing data.
The transition to VIIRS will provide continued input of curing into fire danger calculations across Australia.
Keywords: AFDRS, Australia, fire danger, grassland curing, MODIS, satellite, spectral band adjustment, VIIRS.
Introduction
In Australia, grassland curing (senescence) has been an integral component of fire spread models (Cheney et al. 1998) and the Grassland Fire Danger Index (GFDI) (Cheney and Sullivan 2008), which was solely used nation-wide for grass fire danger calculations until September 2022. From September 2022 onwards, alongside the GFDI, grassland curing has been an integral component of the Australian Fire Danger Rating System (AFDRS) Fire Behaviour Index (FBI) (Kenny et al. 2019; Matthews et al. 2019; McCoy and Field 2022; AFAC 2023; AFDRS 2023). The importance of grassland curing in fire danger and fire spread calculations is due to the strong effect of curing on fire behaviour in grasslands (McArthur 1966, 1973, 1977a, 1977b; Cheney et al. 1998; Alexander 2008; Wotton et al. 2009; Cruz et al. 2015; Kidnie et al. 2015). Because grasslands cover approximately 75% of the country (Cheney and Sullivan 2008), accurate and timely assessment of grassland curing is critical for fire agencies to estimate fire danger across the landscape.
Since 2013, in six (out of eight) states/territories in Australia – Queensland (QLD), New South Wales (NSW), Australian Capital Territory (ACT), Victoria (VIC), Tasmania (TAS) and South Australia (SA) – operational grassland curing data are derived from two models. The first is a satellite model, named MapVictoria (Martin et al. 2015), and the second is the application of the MapVictoria model in an integrated model named the Victorian Improved Satellite Curing Algorithm (VISCA), combining near real-time MapVictoria satellite data with weekly ground-based observations of curing (Martin et al. 2015). For each of these six states/territories, an online system was developed by the VIC Country Fire Authority to automate the operational workflow of VISCA curing map production (Chen et al. 2019). In 2020, the VISCA model was rewritten by the NSW Rural Fire Service to feed into the AFDRS (pers. comm., N. Cummins, NSW RFS) via a national online system named the Fuel State Editor (FSE) (McCoy and Field 2022). Since the AFDRS and FSE commenced production in September 2022, the operational use of MapVictoria and VISCA has successfully continued for the six states/territories and has also been introduced in the Northern Territory (NT) (pers. comm., N. Chester, Bushfires NT). In Western Australia (WA), operational curing data are derived from a modified version of VISCA and a satellite model named MapC-Landgate (pers. comm., A. Kristina, DFES), which originated from the Map C model developed by Newnham et al. (2010) (Kristina et al. 2018). The MapC-Landgate model was the preferred option for operational use in WA because it had shown to be more representative of the grassland curing cycle in the WA landscape (Kristina et al. 2018).
The satellite component of VISCA, the MapVictoria model, is derived from MODerate resolution Imaging Spectroradiometer (MODIS) satellite data. MapVictoria uses the red (Red), near infrared (NIR) and shortwave infrared (SWIR) wavelengths, corresponding to MODIS bands 1, 2 and 6 respectively (Table 1). For level 2 MODIS products, Bands 1, 2 and 6 have a 250, 250 and 500 m resolution respectively (Vermote and Vermeulen 1999). However, MapVictoria uses the level 3 MOD09A1 surface reflectance product (Martin et al. 2015), which provides reflectance values for all three bands at a 500 m resolution. Grassland curing is therefore calculated for every 500 m pixel across the landscape. When grass is green and healthy, Red surface reflectance estimates are low due to absorption of chlorophyll (Tucker 1979), NIR estimates are high due to cell structure and internal leaf scattering (Knipling 1970) and SWIR estimates are low due to vegetation water content (Ceccato et al. 2002). When grass has cured, surface reflectance estimates are slightly higher in the Red and SWIR, and lower in the NIR. Together, the Red, NIR and SWIR bands calculate MapVictoria by calculating two vegetation indices, the Normalised Difference Vegetation Index (NDVI) and the Global Vegetation Moisture Index (GVMI) (Table 2), which detect changes in vegetation growth and vegetation water content respectively. Appended to the MapVictoria model, the NDVI and GVMI also mask surface water using an adapted approach by Xiao et al. (2005) (Martin et al. 2015).
Like other satellite curing models, the MapVictoria model has known limitations, including the under estimation of curing owing to woody vegetation and secondary grass growth (following a rainfall event) and the over-estimation of curing owing to urban areas, sand dunes, bare soil, undetected waterbodies, landscapes covered by yellow-hued flora (Newnham et al. 2010; Martin et al. 2015), undetected cloud cover and recently burnt areas. Although VISCA can mitigate all limitations, MapVictoria has become a successful operational satellite curing model in Australia. Since 2013, the Bureau of Meteorology (the Bureau) has produced daily MapVictoria curing data for the whole country, using a direct feed of MODIS data from the National Aeronautics and Space Administration (NASA) Earth Observing System (EOS) Terra satellite, which was launched in 1999 (Justice et al. 2002).
| MOD09A1 | VNP09H1 | ||||||
|---|---|---|---|---|---|---|---|
| MODIS | Wavelength | Wavelength | VIIRS | Wavelength | Wavelength | ||
| Spectral region | Band | Range (nm) | Centre (nm) | Band | Range (nm) | Centre (nm) | |
| Red–Red | 1 | 620–670 | 648 | I1 | 600–680 | 640 | |
| Near Infrared–NIR | 2 | 841–876 | 858 | I2 | 846–885 | 865 | |
| Short Wave Infrared–SWIR | 6 | 1628–1652 | 1640 | I3 | 1580–1640 | 1610 | |
Each band, provided at a 500 m resolution, is shown with its corresponding spectral region, range of wavelengths and central wavelength in nanometres (nm).
| Vegetation index/Curing model | Formula | Reference | |
|---|---|---|---|
| NDVI – Normalised Difference Vegetation Index | Rouse et al. (1973) | ||
| GVMI – Global Vegetation Monitoring Index | Ceccato et al. (2002) | ||
| MapVictoria Curing | Map Victoria = 113.80494595 − 88.40734715 NDVI − 67.71205472 GVMI | Martin et al. (2015) |
The MODIS sensor has surpassed its predicted mission lifetime (Benedict et al. 2021). Therefore, the MapVictoria model, feeding into VISCA (as part of the AFDRS), has been adjusted to be calculated from a newer satellite sensor system: Visible Infrared Imaging Radiometer Suite (VIIRS), which was designed to provide observation continuity with MODIS (Justice et al. 2013; Ustin and Middleton 2021) into the 2030s (Ustin and Middleton 2021) and beyond 2040 (Xiong and Butler 2020; Xiong et al. 2020). As a joint mission between NASA and the National Oceanic and Atmospheric Administration (NOAA), the first VIIRS sensor was launched in 2011 aboard the Suomi National Polar-orbiting Partnership (Suomi-NPP) satellite (Sun et al. 2021) and the second was launched aboard NOAA-20 in 2017 (Xiong and Butler 2020). By 2032, VIIRS is expected to be carried aboard five satellites (Moyer et al. 2022).
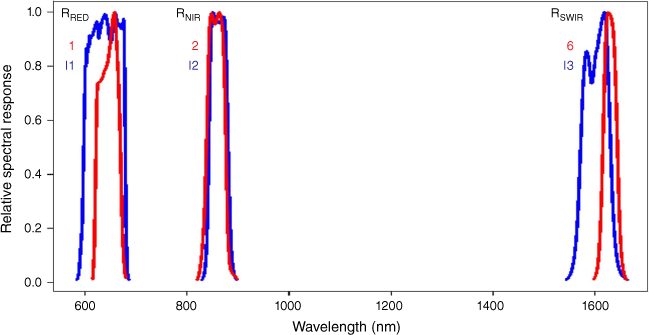
The VIIRS product that matches closely with MOD09A1 is the level 3 VNP09H1 product (Vermote et al. 2017) (Table 1). Data from both MOD09A1 and VNP09H1 are archived as 8-day composite products, comprising the best possible observation for each pixel during an 8-day period, based on high observation coverage, low sensor angle, the absence of clouds or cloud shadow and aerosol loading (Vermote et al. 2015, 2017). The VNP09H1 bands I1, I2, and I3 match closely (but not exactly) with MOD09A1 bands 1, 2 and 6 respectively (Table 1), and both MODIS and VIIRS level 3 products provide each band at a 500 m resolution. Between both sensors, however, the level 3 products are resampled from different spatial resolutions because the 500 m VNP09H1 data are resampled from a 375 m resolution for each band (Vermote et al. 2017). The bands, between sensors, also exhibit differences in their spectral response functions (Fig. 1), and their central wavelengths differ by 8 and 7 nm for the Red and NIR bands respectively and differ by 30 nm for the SWIR band. Therefore, surface reflectance and vegetation index differences are expected between sensors.
Numerous studies have found MODIS and VIIRS to be interchangeable when comparing vegetation indices (Kim et al. 2010; Miura et al. 2013; Vargas et al. 2013; Fan and Liu 2016; Obata et al. 2016; Skakun et al. 2018; Benedict et al. 2021). However, Skakun et al. (2018) reported differences in the MODIS and VIIRS Red and NIR bands, whereby VIIRS values were lower than MODIS in the Red and higher than MODIS in the NIR. Therefore, VIIRS NDVI was found to be higher than MODIS NDVI. Without spectral adjustments of the data from the VIIRS bands, VIIRS will over-estimate NDVI values (Skakun et al. 2018), and depending on the SWIR band, will under-estimate curing and fire danger calculations. This paper presents the calculations of adjusted VIIRS bands and the derivation of an operational VIIRS curing model ‘viirs-mvcuring’ for Australia. From 2023 onwards, for the continuation of grass fire danger calculations across the landscape, the Bureau will continue the daily production of satellite curing data using VIIRS data from Suomi-NPP. The viirs-mvcuring model will soon undergo further amendments to be derived from blended estimates from the Suomi-NPP, NOAA-20 and NOAA-21 satellites.
Methods
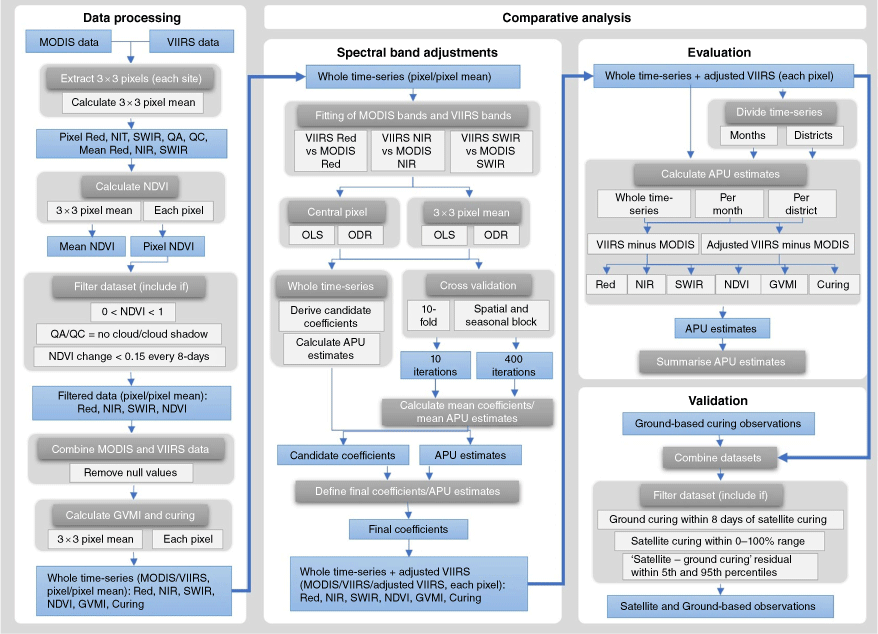
The methods, summarised in Fig. 2, entailed data processing and a comparative analysis. The comparative analysis was conducted for each spectral band, NDVI, GVMI and curing in three stages. The first stage comprised the spectral band adjustments, which entailed the derivation of coefficients for the adjusted VIIRS bands. Using cross-validation (CV) techniques, the spectral band adjustments were completed using the whole timeseries to derive a national VIIRS curing model (viirs-mvcuring) to feed into VISCA and the AFDRS. After the coefficients were derived, the second stage entailed an evaluation between MODIS and VIIRS, before and after the spectral adjustments. This evaluation included spatial and monthly comparisons to identify when and where the VIIRS curing model provides higher or lower estimates of curing, and hence when and where under- or over-estimation can occur for fire danger calculations. The third stage of the analysis entailed the validation of MODIS curing and VIIRS curing against ground-based observations.
Relative spectral response functions of MODIS bands 1, 2 and 6 (in red), and matching VIIRS bands I1, I2, and I3 (in blue).
Workflow of data processing and comparative analysis: (1) spectral band adjustments; (2) evaluation (per month and district); and (3) validation against ground-based observations.
Data processing
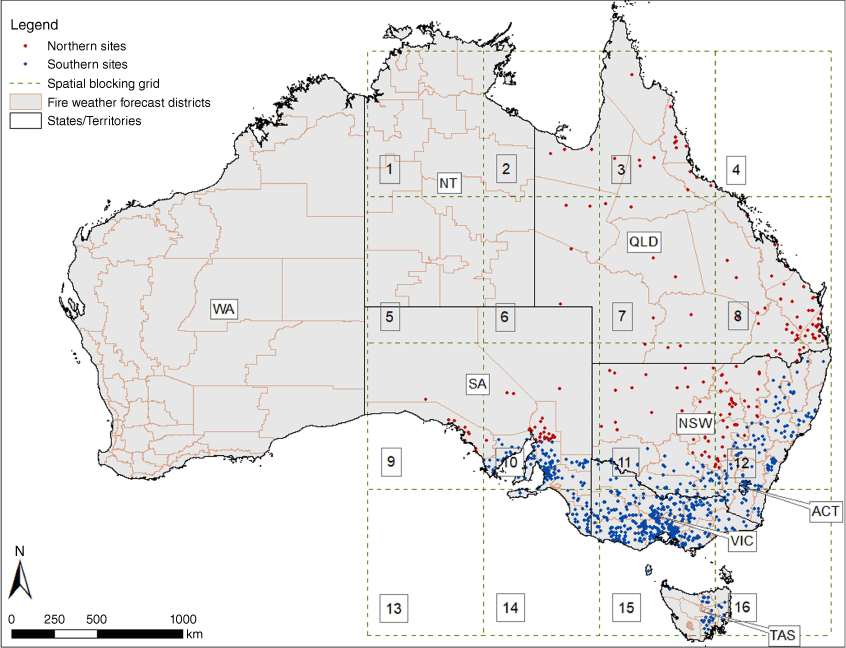
From 24 October 2013 to 30 April 2020, 561 680 observations of MODIS and VIIRS data were extracted from 1109 grassland sites across QLD, NSW, ACT, VIC, TAS and SA (Fig. 3), whereby a 3 × 3 pixel window was centred at each site (AppEEARS Team 2022). Including observations from all pixels of the 3 × 3 pixel windows, the complete dataset comprised 5 055 120 observations from each sensor. The 3 × 3 pixel window was used to compare MODIS/VIIRS correlations between the central pixel and the 3 × 3 pixel average. From each pixel (of the 3 × 3 pixel window), data from the Red and NIR bands (Table 1) were used to calculate NDVI timeseries (Table 2). First, NDVI values outside the 0–1 range were removed. Second, using quality assurance and quality control values, data were removed if pixels were affected by cloud cover and cloud shadow. Finally, after Lovell and Graetz (2001), a datum was removed if NDVI had changed by 0.15 or more within an 8-day period. This was to remove any remaining contamination by cloud and noise in the NDVI timeseries. The MODIS and VIIRS filtered datasets were then combined, MODIS observations were removed if the matching VIIRS observations were missing, and vice versa. Alongside NDVI timeseries, GVMI and curing timeseries were then calculated for each pixel.
Locations of 1109 grassland sites (divided into two groups – Northern and Southern), spatial blocks used for cross validation (numbered 1–16) and boundaries of states/territories and fire weather forecast districts (BOM 2023).
Comparative analysis
Following the filtering process, the filtered subset, denoted as the whole timeseries, comprised 120 400 observations. Using the whole timeseries, a comparative analysis was conducted between sensors using a standard Accuracy, Precision, Uncertainty (APU) analysis (after Vermote and Kotchenova 2008 in Skakun et al. 2018):
The Accuracy (A) is the average bias between estimates:
The Precision (P) is the repeatability of the estimates:
The Uncertainty (U) is the Root Mean Square Error (RMSE):
Spectral band adjustments
The first stage of the comparative analysis entailed the spectral band adjustments, which were essential because of the impact that the spectral bands have on NDVI and GVMI. The NDVI and GVMI estimates are influenced by the spectral contrast between the Red and NIR bands and between the NIR and SWIR bands respectively. This is due to the NIR–Red function in the NDVI formula and the NIR–SWIR function in the GVMI formula (Table 2). Therefore, it was vital to match the VIIRS bands to MODIS as closely as possible. The spectral band adjustments comprised the derivation of coefficients for the adjusted VIIRS bands using data from the whole timeseries. Using two cross-validation (CV) techniques, multiple candidate spectral band adjustment coefficients were derived: (1) using data from the central pixel alone and using the 3 × 3 pixel average; (2) using an orthogonal distance regression and using an ordinary least squares regression; and (3) using the whole timeseries and using the mean from the CV iterations (from the whole timeseries). After Skakun et al. (2018), Runge and Grosse (2019) and Benedict et al. (2021), each CV iteration entailed the fitting of MODIS data against VIIRS data for each matching band to derive coefficients for each band. Out of the two CV techniques, the first was a random 10-fold CV technique. The second was a spatial and seasonal block CV technique (Roberts et al. 2017) to account for possible spatial or seasonal variation in the MODIS/VIIRS comparisons. The reason for the spatial and seasonal block CV is that when a dataset is split at random for a random 10-fold CV, for example, the training and testing data from nearby locations will be dependent. Therefore, the independence of the testing data can be compromised, and the error estimates can be overly optimistic (Roberts et al. 2017). The same challenge applies to the training and testing data extracted from nearby locations from the same time of year. Therefore, for the spatial and seasonal block CV technique, a 4 × 4 block window (Fig. 3) was used to divide the 120 400 observations into 100 random spatial block combinations. This approach allowed all blocks from the block window to be assigned randomly for each combination, regardless of the absence or presence of observations. For example, for one random spatial block combination, the sites were divided as follows:
Training set: Blocks 1, 8, 9, 10, 13, and 15
Testing set: Blocks 2, 3, 4, 5, 6, 7, 11, 12, 14, and 16
The spatial and seasonal block CV was also tested using an 8 × 8 block window (and 200 iterations), which exhibited similar APU estimates (not shown) as the 4 × 4 block window. For each 4 × 4 spatial block combination, which accounts for spatial variation, the observations were then divided by the four seasons of the year to account for seasonal variation. In total, the spatial and seasonal block combinations resulted in 400 CV iterations.
The candidate spectral band adjustment coefficients that marginally exhibited the lowest APU metrics, presented in Wright and Majewski (2022), were derived from the 3 × 3 pixel average, and from the mean of 400 seasonal and spatial block CV iterations, each fitted using an orthogonal distance regression. After Roberts et al. (2017), the final coefficients for each spectral band, handed to the Bureau for operational implementation, were derived from the whole timeseries and from the central pixel, fitted using an orthogonal distance regression. The APU metrics were derived from the mean of 400 seasonal and spatial block CV iterations, also fitted using an orthogonal distance regression. This approach, used to derive the final coefficients and the error estimates, favours prediction quality over perfect accuracy of the APU metrics (Roberts et al. 2017). The final coefficients were placed in the spectral band adjustment expressions as shown below (Eqns 4–6):
where viirsrawRRED, viirsrawRNIR and viirsrawRSWIR represent the VIIRS Red, NIR and SWIR bands respectively, and viirsadjRRED, viirsadjRNIR and viirsadjRSWIR represent the adjusted VIIRS Red, NIR and SWIR bands respectively. The adjusted VIIRS bands were then used to calculate the adjusted VIIRS NDVI, adjusted VIIRS GVMI and adjusted VIIRS curing timeseries.
Evaluation between MODIS and VIIRS
Following the derivation of the adjusted VIIRS band coefficients, the second stage of the comparative analysis was conducted. The second stage entailed the evaluation between sensors (before and after spectral adjustments) for different regions at different times of the year. This analysis was conducted as the fire season, and the progression of grassland curing, occurs throughout northern Australia in winter (June, July, August) and spring and occurs throughout southern Australia in summer and autumn (Luke and McArthur 1978; Barber 1979; Lucas et al. 2007). This evaluation was completed using data from: (1) the whole timeseries; (2) each month of the year; and (3) each state/territory and fire weather forecast district (Fig. 3). The fire weather forecast districts, denoted as districts, are administrative boundaries for Australia used for the determination of the Fire Danger Ratings (FDRs) (BOM 2023). By dividing the grassland sites by district, district-level comparisons of curing were conducted to reveal possible spatial variation in the APU estimates, of which two distinct groups had emerged from the whole timeseries. The southern and southeastern districts exhibited a positive bias of curing (VIIRS curing > MODIS curing) in winter and a negative bias of curing (VIIRS curing < MODIS curing) in the remaining seasons of the year. These districts were grouped as Southern (Fig. 3). The northern and northwestern districts exhibited a negative bias of curing all year round and were grouped as Northern (Fig. 3). The districts and the Northern and Southern groups were not used for the spectral band adjustments, because the VIIRS band coefficients were derived for the development of a national VIIRS curing model, to be utilised anywhere in Australia. The districts were used because each FDR is calculated per district. The evaluation of which districts exhibit higher or lower curing estimates from the VIIRS curing model (viirs-mvcuring) is useful for fire agencies to ensure the continuation of accurate fire danger calculations. Also, although the timing of grassland curing varies between Northern and Southern Australia (Luke and McArthur 1978; Barber 1979; Lucas et al. 2007), the Northern and Southern groups were used to present the overall differences between sensors.
Validation against ground-based observations
Finally, ground-based observations, collected from 1109 grassland sites (Fig. 3) from 24 October 2013 to 30 April 2020, were used to validate curing estimates from both sensors for the Northern sites and Southern sites. The ground-based observations comprise weekly visual assessments of curing, rounded at 10% intervals. Past studies have reported visual assessments to be subjective, with high variability in accuracy (Anderson et al. 2011): they can under- or over-estimate curing by up to 25% (Anderson et al. 2005). To reduce the 25% error and provide consistent and repeatable observations for operational fire danger calculations, ground-based observations are collected by observers and validated by district-based personnel. Observers are provided with a grassland curing guide (CFA 2014a), a grassland curing field card (CFA 2014b) and an online training package (CFA 2014b) (Chen et al. 2019). It should be noted that although the ground-based observations are collected for operational use, some ground-based observations are reported to counteract the under- or over-estimation of curing by satellite. Therefore, the error estimates between ground-based observations and satellite observations are potentially greater than if the ground-based observations have not been collected operationally. Taking this into consideration, 52 212 ground-based observations were matched against the whole timeseries of 120 400 MODIS and VIIRS observations (before and after spectral adjustments). Data were included if: (1) a ground-based observation was present within 8 days (inclusive) of a MODIS and VIIRS observation; (2) a MODIS and VIIRS observation (before and after spectral adjustments) was within the 0–100 curing range; and (3) each ‘satellite curing minus ground-based curing’ residual, for MODIS and VIIRS (before and after adjustments), fell within the 5th and 95th percentiles. This filtering process resulted in 17 122 observations.
Results and discussion
Band comparisons
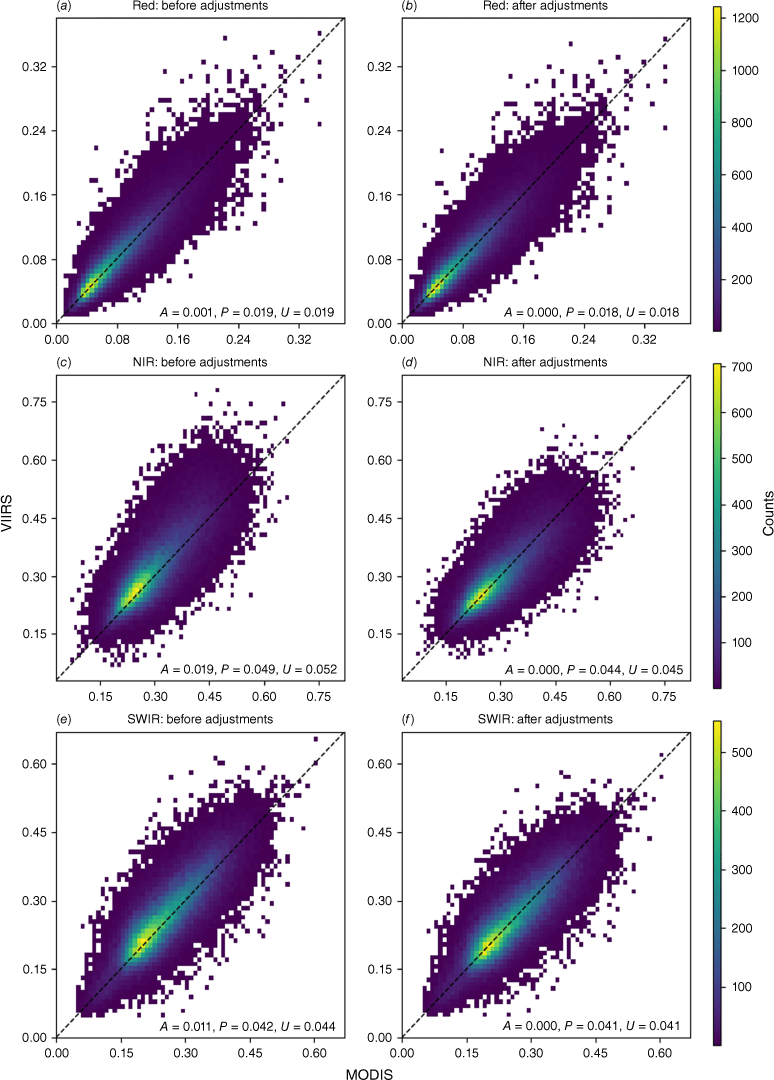
Comparisons of the MODIS and VIIRS bands, before and after the spectral adjustments, are presented in Fig. 4. These comparisons are based on data from the whole timeseries. Despite differences in the spectral response functions between sensors (Fig. 1), the Red band exhibited low APU values before and after the spectral adjustments (Fig. 4a, b). This indicated a close agreement between the two sensors. For the NIR band, the spectral response function also differs between sensors (Fig. 1). However, as vegetation growth changes across the landscape, for example, the changes in surface reflectance are much greater in the NIR spectral region compared with the Red (Knipling 1970). Therefore, although the Red and NIR bands from both sensors detected a change in vegetation growth, the surface reflectance differences between sensors (before and after spectral adjustments) were greater for the NIR band (Fig. 4c, d) than the Red band. Similar findings were reported by Skakun et al. (2018). Next, the NIR and SWIR bands presented a positive bias before spectral adjustments (Fig. 4c, e). The spectral adjustments reduced the NIR and SWIR bias from 0.019 to 0.000 and from 0.011 to 0.000 respectively (Fig. 4d, f). The average bias was reduced, but the precision and RMSE estimates had only shown marginal improvements for all three bands (Fig. 4). Skakun et al. (2018) reported similar findings for the Red and NIR bands. For the NIR band (Fig. 4c, d), the spectral adjustments reduced the RMSE from 0.052 to 0.045 and reduced the precision estimates from 0.049 to 0.044. Although the ambiguity of the RMSE estimates (Willmott and Matsuura 2006) have been taken into consideration, the spectral adjustments reduced the average bias of the VIIRS bands to minimise bias of the NDVI, GVMI and curing estimates.
MODIS/VIIRS correlations (derived from the central pixel and from the whole timeseries of 120 400 observations) for (a) Red: before adjustments, (b) Red: after adjustments, (c) NIR: before adjustments, (d) NIR: after adjustments, (e) SWIR: before adjustments and (f) SWIR: after adjustments. Correlations are summarised by average bias (Accuracy (A)), Precision (P) and RMSE (Uncertainty (U)), derived from the mean of 400 random spatial/seasonal block CV iterations.
NDVI, GVMI and curing comparisons
The MODIS and VIIRS comparisons for NDVI, GVMI and curing are presented in Fig. 5. Like Skakun et al. (2018) and Benedict et al. (2021), VIIRS NDVI was higher than MODIS NDVI before adjustments (Fig. 5a). The positive bias of NDVI was reduced by the spectral band adjustments from 0.014 to 0.003. The GVMI exhibited low APU values before and after the spectral adjustments (Fig. 5c, d), and the GVMI bias was reduced (by the spectral adjustments) from 0.003 to 0.002. Most importantly, for grassland curing (Fig. 5e, f), the spectral adjustments decreased the negative bias from −1.455 to −0.437. That is, before the spectral adjustments, VIIRS curing was found to be lower than MODIS curing by 1.5% (owing to the positive bias of NDVI and GVMI). After the spectral adjustments, the positive bias of NDVI and GVMI was still evident, so VIIRS curing was lower than MODIS curing by 0.4%.
MODIS/VIIRS correlations (derived from the central pixel and from the whole timeseries of 120 400 observations) for (a) NDVI: before adjustments, (b) NDVI: after adjustments, (c) GVMI: before adjustments, (d) GVMI: after adjustments, (e) Curing: before adjustments and (f) Curing: after adjustments. Correlations are summarised by average bias (Accuracy (A)), Precision (P) and RMSE (Uncertainty (U)), derived from the mean of 400 random spatial/seasonal block CV iterations.
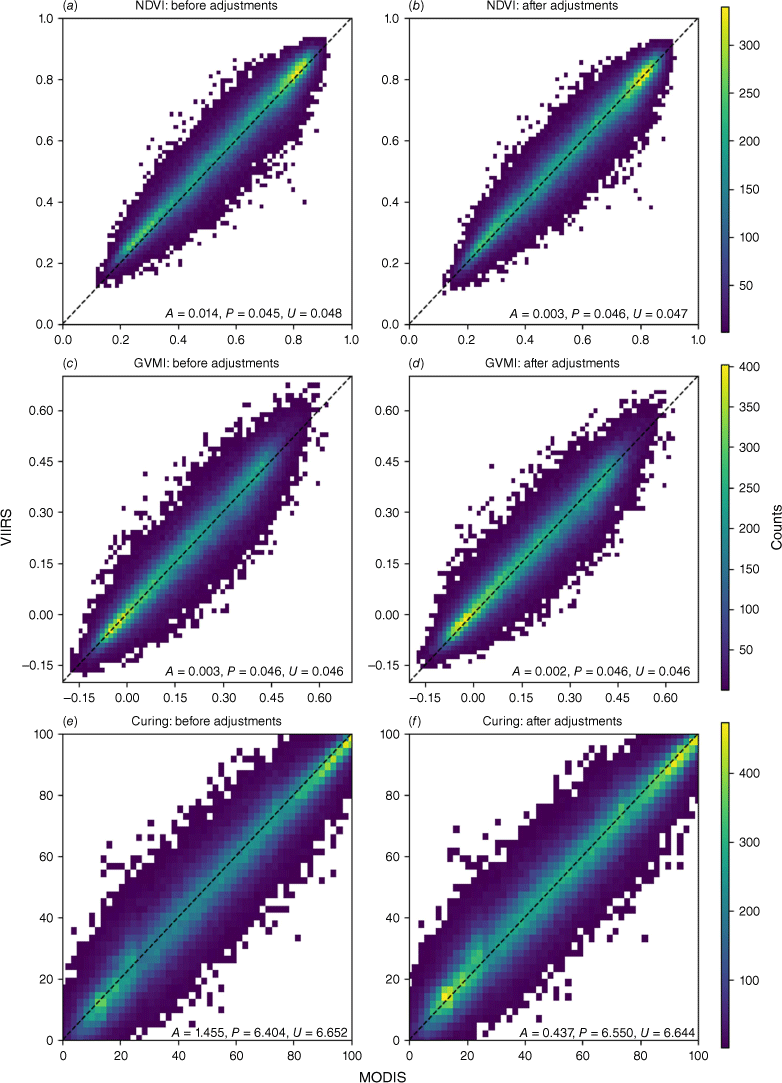
Overall, if any satellite-derived algorithm were applied to a new sensor without adjustments, there would be no guarantee of a continuous satellite product between sensors (Sawyer et al. 2020). If the VIIRS curing model were implemented operationally in Australia without adjustments, the higher VIIRS NIR estimates would present higher NDVI estimates and could actually lower estimates of curing (compared with MODIS). The spectral adjustments have reduced the under-estimation of curing and have allowed for the continuation of accurate satellite curing input into VISCA in the transition from MODIS to VIIRS. By reducing the under-estimation of curing, the spectral adjustments could minimise the under-prediction of the rate of spread in grasslands (in fire spread models) and the under-estimation of GFDI and FBI calculations.
Spatial and monthly variation
The results presented thus far (in Figs 4 and 5) have summarised the overall MODIS/VIIRS comparisons from the whole timeseries. The next results present how these sensor comparisons (before and after spectral adjustments) vary in different regions and at different times of the year. Table 3 summarises the APU metrics, before and after adjustments, for each month of the year and for the Northern sites and Southern sites (Fig. 3). Referring to the average bias (in Table 3), the warm-shaded cells represent a positive bias where VIIRS is higher than MODIS, and the cool-shaded cells represent a negative bias where VIIRS is lower than MODIS. For the precision and RMSE values, dark-shaded cells represent higher values and light-shaded cells represent lower values.
| Before Adjustments | After Adjustments | ||||||||||||||
|---|---|---|---|---|---|---|---|---|---|---|---|---|---|---|---|
| Red | NIR | SWIR | NDVI | GVMI | Curing | Red | NIR | SWIR | NDVI | GVMI | Curing | ||||
| Average bias (Accuracy (A)) | Northern | Jul | 0.003 | 0.014 | 0.012 | 0.010 | −0.002 | −0.701 | 0.001 | 0.004 | 0.001 | 0.005 | 0.005 | −0.750 | |
| Aug | 0.002 | 0.015 | 0.009 | 0.014 | 0.004 | −1.508 | 0.000 | 0.003 | −0.002 | 0.007 | 0.009 | −1.246 | |||
| Sep | −0.001 | 0.011 | 0.004 | 0.021 | 0.009 | −2.480 | −0.003 | −0.002 | −0.009 | 0.012 | 0.014 | −2.027 | |||
| Oct | −0.004 | 0.010 | 0.002 | 0.027 | 0.010 | −3.117 | −0.006 | −0.003 | −0.012 | 0.017 | 0.015 | −2.580 | |||
| Nov | −0.003 | 0.011 | 0.005 | 0.028 | 0.009 | −3.119 | −0.005 | −0.002 | −0.011 | 0.017 | 0.014 | −2.504 | |||
| Dec | 0.000 | 0.014 | 0.010 | 0.023 | 0.005 | −2.402 | −0.003 | 0.000 | −0.006 | 0.012 | 0.010 | −1.704 | |||
| Jan | 0.002 | 0.017 | 0.016 | 0.020 | 0.000 | −1.812 | −0.001 | 0.002 | 0.000 | 0.008 | 0.004 | −0.988 | |||
| Feb | 0.004 | 0.019 | 0.020 | 0.017 | −0.003 | −1.336 | 0.001 | 0.004 | 0.005 | 0.005 | 0.000 | −0.428 | |||
| Mar | 0.002 | 0.014 | 0.013 | 0.016 | 0.000 | −1.459 | −0.001 | 0.001 | −0.001 | 0.006 | 0.004 | −0.780 | |||
| Apr | 0.000 | 0.015 | 0.010 | 0.020 | 0.003 | −1.968 | −0.001 | 0.002 | −0.003 | 0.011 | 0.008 | −1.534 | |||
| May | 0.000 | 0.014 | 0.008 | 0.022 | 0.007 | −2.357 | −0.002 | 0.004 | −0.004 | 0.015 | 0.013 | −2.201 | |||
| Jun | 0.002 | 0.015 | 0.013 | 0.016 | 0.000 | −1.422 | 0.001 | 0.006 | 0.002 | 0.012 | 0.007 | −1.491 | |||
| Southern | Jul | 0.005 | 0.029 | 0.023 | 0.000 | −0.013 | 0.943 | 0.004 | 0.006 | 0.014 | −0.012 | −0.019 | 2.336 | ||
| Aug | 0.003 | 0.026 | 0.014 | 0.006 | 0.000 | −0.535 | 0.002 | −0.001 | 0.005 | −0.006 | −0.009 | 1.127 | |||
| Sep | 0.000 | 0.024 | 0.004 | 0.013 | 0.014 | −2.127 | −0.001 | −0.006 | −0.005 | 0.001 | 0.004 | −0.351 | |||
| Oct | 0.000 | 0.027 | 0.003 | 0.017 | 0.019 | −2.780 | −0.001 | −0.002 | −0.006 | 0.004 | 0.009 | −0.950 | |||
| Nov | −0.001 | 0.020 | 0.002 | 0.020 | 0.018 | −2.994 | −0.002 | −0.003 | −0.009 | 0.007 | 0.012 | −1.442 | |||
| Dec | 0.001 | 0.015 | 0.007 | 0.016 | 0.007 | −1.869 | −0.001 | −0.003 | −0.006 | 0.002 | 0.006 | −0.580 | |||
| Jan | 0.001 | 0.014 | 0.011 | 0.015 | 0.002 | −1.440 | −0.001 | −0.002 | −0.003 | 0.002 | 0.004 | −0.421 | |||
| Feb | 0.001 | 0.011 | 0.011 | 0.013 | −0.001 | −1.097 | −0.001 | −0.003 | −0.003 | 0.002 | 0.002 | −0.328 | |||
| Mar | 0.001 | 0.015 | 0.011 | 0.014 | 0.002 | −1.392 | 0.000 | 0.001 | −0.001 | 0.005 | 0.005 | −0.790 | |||
| Apr | 0.001 | 0.016 | 0.011 | 0.012 | 0.001 | −1.132 | 0.000 | 0.000 | −0.001 | 0.003 | 0.002 | −0.426 | |||
| May | 0.003 | 0.023 | 0.019 | 0.011 | −0.007 | −0.515 | 0.002 | 0.006 | 0.009 | 0.002 | −0.008 | 0.367 | |||
| Jun | 0.004 | 0.023 | 0.022 | 0.003 | −0.015 | 0.800 | 0.003 | 0.004 | 0.013 | −0.007 | −0.018 | 1.827 | |||
| Precision (P) | Northern | Jul | 0.014 | 0.035 | 0.034 | 0.047 | 0.046 | 6.628 | 0.014 | 0.032 | 0.033 | 0.048 | 0.046 | 6.740 | |
| Aug | 0.015 | 0.038 | 0.034 | 0.048 | 0.044 | 6.645 | 0.015 | 0.034 | 0.033 | 0.049 | 0.044 | 6.732 | |||
| Sep | 0.016 | 0.035 | 0.035 | 0.043 | 0.041 | 6.020 | 0.016 | 0.032 | 0.033 | 0.044 | 0.040 | 6.113 | |||
| Oct | 0.021 | 0.042 | 0.043 | 0.042 | 0.041 | 5.890 | 0.021 | 0.037 | 0.041 | 0.043 | 0.040 | 5.954 | |||
| Nov | 0.027 | 0.046 | 0.052 | 0.041 | 0.035 | 5.261 | 0.026 | 0.042 | 0.050 | 0.043 | 0.036 | 5.546 | |||
| Dec | 0.029 | 0.050 | 0.058 | 0.042 | 0.037 | 5.542 | 0.028 | 0.045 | 0.055 | 0.045 | 0.038 | 5.930 | |||
| Jan | 0.027 | 0.048 | 0.055 | 0.044 | 0.036 | 5.671 | 0.027 | 0.044 | 0.053 | 0.046 | 0.037 | 5.965 | |||
| Feb | 0.023 | 0.042 | 0.046 | 0.047 | 0.039 | 6.286 | 0.023 | 0.039 | 0.044 | 0.048 | 0.039 | 6.382 | |||
| Mar | 0.019 | 0.036 | 0.038 | 0.041 | 0.035 | 5.483 | 0.018 | 0.034 | 0.036 | 0.042 | 0.035 | 5.620 | |||
| Apr | 0.018 | 0.038 | 0.038 | 0.042 | 0.039 | 5.820 | 0.018 | 0.034 | 0.037 | 0.044 | 0.039 | 5.981 | |||
| May | 0.016 | 0.034 | 0.036 | 0.043 | 0.040 | 5.881 | 0.016 | 0.030 | 0.035 | 0.043 | 0.040 | 5.912 | |||
| Jun | 0.017 | 0.036 | 0.038 | 0.046 | 0.044 | 6.429 | 0.016 | 0.032 | 0.037 | 0.047 | 0.044 | 6.552 | |||
| Southern | Jul | 0.013 | 0.057 | 0.040 | 0.050 | 0.053 | 7.158 | 0.013 | 0.051 | 0.038 | 0.051 | 0.053 | 7.171 | ||
| Aug | 0.012 | 0.060 | 0.037 | 0.047 | 0.050 | 6.808 | 0.012 | 0.055 | 0.035 | 0.047 | 0.049 | 6.799 | |||
| Sep | 0.012 | 0.060 | 0.035 | 0.046 | 0.047 | 6.738 | 0.012 | 0.054 | 0.033 | 0.046 | 0.046 | 6.722 | |||
| Oct | 0.016 | 0.064 | 0.039 | 0.047 | 0.049 | 7.013 | 0.015 | 0.057 | 0.038 | 0.048 | 0.048 | 7.044 | |||
| Nov | 0.021 | 0.058 | 0.046 | 0.048 | 0.049 | 6.961 | 0.021 | 0.052 | 0.044 | 0.049 | 0.048 | 7.089 | |||
| Dec | 0.025 | 0.052 | 0.051 | 0.047 | 0.045 | 6.601 | 0.025 | 0.048 | 0.049 | 0.049 | 0.045 | 6.773 | |||
| Jan | 0.023 | 0.044 | 0.050 | 0.042 | 0.043 | 6.050 | 0.023 | 0.041 | 0.048 | 0.044 | 0.043 | 6.212 | |||
| Feb | 0.021 | 0.041 | 0.046 | 0.044 | 0.043 | 6.204 | 0.021 | 0.038 | 0.045 | 0.045 | 0.043 | 6.346 | |||
| Mar | 0.017 | 0.040 | 0.042 | 0.044 | 0.045 | 6.287 | 0.017 | 0.037 | 0.040 | 0.044 | 0.044 | 6.324 | |||
| Apr | 0.015 | 0.042 | 0.040 | 0.045 | 0.047 | 6.510 | 0.014 | 0.038 | 0.038 | 0.046 | 0.048 | 6.613 | |||
| May | 0.015 | 0.050 | 0.044 | 0.049 | 0.054 | 7.114 | 0.014 | 0.045 | 0.042 | 0.049 | 0.054 | 7.241 | |||
| Jun | 0.013 | 0.053 | 0.040 | 0.052 | 0.053 | 7.272 | 0.013 | 0.048 | 0.039 | 0.052 | 0.054 | 7.337 | |||
| RMSE (Uncertainty (U)) | Northern | Jul | 0.015 | 0.038 | 0.036 | 0.048 | 0.046 | 6.663 | 0.014 | 0.032 | 0.033 | 0.048 | 0.046 | 6.779 | |
| Aug | 0.015 | 0.041 | 0.036 | 0.050 | 0.045 | 6.812 | 0.015 | 0.034 | 0.033 | 0.049 | 0.044 | 6.844 | |||
| Sep | 0.016 | 0.036 | 0.035 | 0.048 | 0.042 | 6.509 | 0.016 | 0.032 | 0.035 | 0.046 | 0.042 | 6.438 | |||
| Oct | 0.021 | 0.043 | 0.043 | 0.050 | 0.042 | 6.661 | 0.022 | 0.037 | 0.043 | 0.046 | 0.043 | 6.487 | |||
| Nov | 0.027 | 0.047 | 0.053 | 0.050 | 0.037 | 6.115 | 0.027 | 0.042 | 0.051 | 0.046 | 0.039 | 6.084 | |||
| Dec | 0.029 | 0.052 | 0.058 | 0.048 | 0.037 | 6.038 | 0.028 | 0.045 | 0.056 | 0.046 | 0.039 | 6.167 | |||
| Jan | 0.027 | 0.051 | 0.058 | 0.048 | 0.036 | 5.951 | 0.027 | 0.044 | 0.053 | 0.046 | 0.037 | 6.044 | |||
| Feb | 0.023 | 0.046 | 0.050 | 0.050 | 0.039 | 6.424 | 0.023 | 0.039 | 0.045 | 0.048 | 0.039 | 6.394 | |||
| Mar | 0.019 | 0.039 | 0.040 | 0.044 | 0.035 | 5.672 | 0.018 | 0.034 | 0.036 | 0.042 | 0.036 | 5.672 | |||
| Apr | 0.018 | 0.041 | 0.039 | 0.047 | 0.039 | 6.142 | 0.018 | 0.034 | 0.037 | 0.045 | 0.040 | 6.172 | |||
| May | 0.016 | 0.037 | 0.037 | 0.048 | 0.041 | 6.334 | 0.016 | 0.030 | 0.035 | 0.046 | 0.042 | 6.307 | |||
| Jun | 0.017 | 0.039 | 0.041 | 0.049 | 0.044 | 6.583 | 0.016 | 0.033 | 0.037 | 0.049 | 0.045 | 6.718 | |||
| Southern | Jul | 0.014 | 0.064 | 0.046 | 0.050 | 0.054 | 7.219 | 0.014 | 0.052 | 0.041 | 0.052 | 0.056 | 7.542 | ||
| Aug | 0.013 | 0.065 | 0.039 | 0.047 | 0.050 | 6.828 | 0.012 | 0.055 | 0.035 | 0.048 | 0.050 | 6.891 | |||
| Sep | 0.012 | 0.065 | 0.035 | 0.048 | 0.049 | 7.065 | 0.012 | 0.054 | 0.034 | 0.046 | 0.046 | 6.730 | |||
| Oct | 0.016 | 0.069 | 0.039 | 0.050 | 0.053 | 7.543 | 0.015 | 0.057 | 0.038 | 0.048 | 0.049 | 7.107 | |||
| Nov | 0.021 | 0.061 | 0.046 | 0.052 | 0.052 | 7.577 | 0.021 | 0.052 | 0.045 | 0.050 | 0.050 | 7.234 | |||
| Dec | 0.025 | 0.055 | 0.051 | 0.050 | 0.045 | 6.861 | 0.025 | 0.048 | 0.049 | 0.049 | 0.045 | 6.797 | |||
| Jan | 0.023 | 0.046 | 0.051 | 0.045 | 0.043 | 6.219 | 0.023 | 0.041 | 0.048 | 0.044 | 0.043 | 6.225 | |||
| Feb | 0.021 | 0.043 | 0.048 | 0.046 | 0.043 | 6.300 | 0.021 | 0.038 | 0.045 | 0.045 | 0.043 | 6.354 | |||
| Mar | 0.017 | 0.042 | 0.043 | 0.046 | 0.045 | 6.439 | 0.017 | 0.037 | 0.040 | 0.044 | 0.045 | 6.373 | |||
| Apr | 0.015 | 0.045 | 0.041 | 0.046 | 0.048 | 6.607 | 0.014 | 0.038 | 0.038 | 0.046 | 0.048 | 6.626 | |||
| May | 0.015 | 0.056 | 0.048 | 0.050 | 0.054 | 7.132 | 0.015 | 0.046 | 0.043 | 0.049 | 0.055 | 7.250 | |||
| Jun | 0.014 | 0.058 | 0.046 | 0.052 | 0.055 | 7.315 | 0.013 | 0.048 | 0.041 | 0.053 | 0.057 | 7.561 | |||
Correlations are summarised by APU metrics calculated separately for Northern sites and Southern sites and each month, derived from 120 400 observations from the central pixel of each site.
For average bias (accuracy (A)), the red-shaded cells represent a positive bias where VIIRS is higher than MODIS. The blue-shaded cells represent a negative bias where VIIRS is lower than MODIS. For precision (P) and RMSE (uncertainty (U)), higher values are shaded dark red, lower values are shaded light red.
Spatial and monthly comparisons for each band
Before adjustments and for both the Northern and Southern sites, the Red band exhibited the closest agreement between sensors (compared with the NIR and SWIR bands), with a bias close to zero and small precision and RMSE values all year round (Table 3). On the other hand, the NIR band exhibited greater error, with stronger positive bias and higher precision and RMSE values, particularly at the Southern sites from May to December (Table 3). During this timeframe (May to December) at the Southern sites, winter crops undergo germination, growth, curing and harvest (DPI 2023). The NIR band’s sensitivity to these changes (from germination to harvest) has therefore shown to differ between sensors. Like the NIR, the SWIR band had also shown a positive bias, most prominent at the Southern sites in winter (June, July, August). At the Southern sites in spring (September, October, November), during the onset of curing, unlike the NIR, the bias of the SWIR band dropped close to zero. This suggested that as grassland curing commenced each year, the changes in vegetation water content, which affects the SWIR estimates (Ceccato et al. 2002), were captured closely by both sensors. However, in winter, the higher VIIRS SWIR estimates indicated that the VIIRS SWIR band detected less vegetation water content than MODIS.
After the spectral adjustments, for the Northern and Southern sites, all three bands ended up with a negative bias in spring and a mostly positive bias in winter. During the spring months, the lower VIIRS Red and SWIR estimates, compared with MODIS, resulted in the detection of higher chlorophyll and vegetation water content (respectively), indicating lower levels of curing (from VIIRS). Conversely, the negative bias of the adjusted NIR band indicated higher sensitivity to the breakdown of cell walls (Knipling 1970; Gao 1996) compared with MODIS, suggesting higher levels of curing (from VIIRS). Overall, the adjusted VIIRS bands exhibited either positive or negative bias at different times of the year, which varied between Northern and Southern sites. The bias was reduced for all three bands in most cases. However, the monthly and spatial variation had prevented the adjustments from reducing the average bias entirely.
Spatial and monthly comparisons for NDVI, GVMI and curing
Before and after the spectral adjustments, the error estimates (precision and RMSE), for NDVI, GVMI and curing, remained low throughout the year across all sites. Both precision and RMSE are error estimates based on the sum of squared errors (see Eqns 2 and 3), which do not describe average error alone (Willmott and Matsuura 2005). The RMSE, specifically, has been reported as an ambiguous error metric (Willmott and Matsuura 2005) and is sensitive to outliers (Chai and Draxler 2014), which would remain apparent before and after the spectral adjustments. Consequently, minimal improvement of the precision and RMSE estimates were observed after adjustments (Table 3). The average bias, on the other hand, exhibited variation for NDVI, GVMI and curing between Northern and Southern sites and among months. This was partially due to the multiple combinations of the Red, NIR and SWIR bands, which amplified the noise.
For the Northern sites, before and after adjustments, VIIRS NDVI and GVMI were mostly higher than MODIS all year round. This indicated that at the Northern sites, VIIRS detected higher vegetation growth and higher vegetation water content than MODIS. As a result, VIIRS curing was found to be lower than MODIS curing all year round at the Northern sites (Fig. 3), resulting in lower fire danger calculations. This was evident (in Table 3) before the spectral adjustments and is still evident, althoughnot as prominently after the adjustments (with the greatest bias in curing) in October, dropping from −3.1% (before adjustments) to −2.6% (after adjustments).
For the Southern sites, the bias of NDVI and GVMI (and hence curing) varied between winter and the warmer months (September to May). In the winter months, a positive bias of curing was evident before and after adjustments owing to a negative bias of GVMI before adjustments and a negative bias of NDVI and GVMI after adjustments. This suggests that at times of the year when vegetation growth and vegetation water content are at their highest levels (in other words, when NDVI and GVMI have reached their peaks), MODIS detects higher vegetation growth and higher vegetation water content than VIIRS. In the warmer months (September to May), both NDVI and GVMI exhibited a positive bias before and after adjustments. This means that at moderate to lower NDVI and GVMI values, and therefore at moderate to lower levels of vegetation growth and vegetation water content, VIIRS detects higher vegetation growth and vegetation water content than MODIS. Although higher vegetation growth and higher vegetation water content imply lower curing, VIIRS curing was found to be lower than MODIS curing. Like the Northern sites, the negative bias of curing was not as prominent after the adjustments.
For the Southern sites, curing input is most valuable during the warmer months. In November, for example, the fire season has already commenced, and grassland curing is increasing. For this month (November), Table 3 has shown that VIIRS curing (before adjustments) was lower than MODIS by 3%. For FBI calculations, each pixel across Australia containing vegetation is classified as a vegetation type (Kenny et al. 2019; Matthews et al. 2019; Matthews 2022; AFDRS 2023). For a single pixel, classified as ‘grassland’, the 3% drop in curing could reduce the predicted rate of spread (Cheney et al. 1998) and could lower the FBI value for that pixel (Matthews et al. 2019). For each pixel, specific thresholds of the FBI values are applied to assign the following FDR levels: ‘No Rating’; ‘Moderate’; ‘High’; ‘Extreme’; and ‘Catastrophic’ (BOM 2022; Matthews 2022). Therefore, for a single pixel, if the FBI value is just above a specific threshold, the 3% curing drop could lower the FDR level. For each district, the overall FDR is an area-based rating and is determined by calculating the highest FDR level that occurs for at least 10% of the pixels across the district (BOM 2022). If 90% of the district’s pixels comprise the ‘Moderate’ level and 10% comprise the ‘High’ level, and if the ‘High’ level pixels are all ‘grassland’ and are affected by the 3% drop in curing, then the affected pixels could be reduced to ‘Moderate’. In this scenario, the 3% drop in curing could therefore reduce the overall FDR (for the whole district) from ‘High’ to ‘Moderate’. The spectral adjustments have reduced the (November) 3% curing drop to 1.4% (Table 3); therefore, they have also reduced the likelihood of the under-estimation of the FDR. Although the likelihood of this scenario has been decreased, the negative bias of VIIRS curing is still apparent and can be minimised by the VISCA model.
Comparisons against ground-based observations
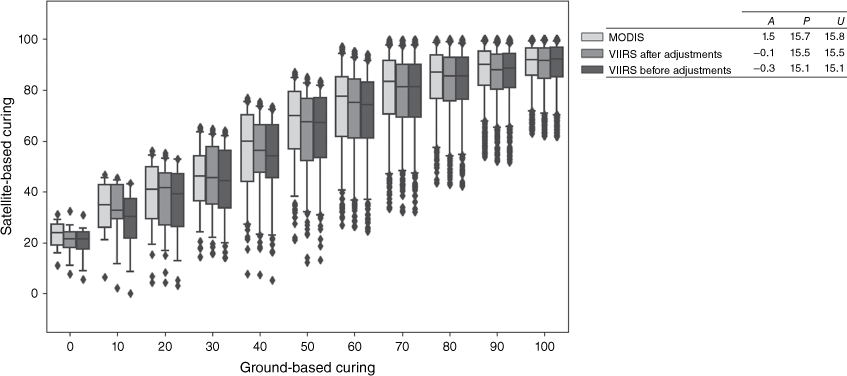
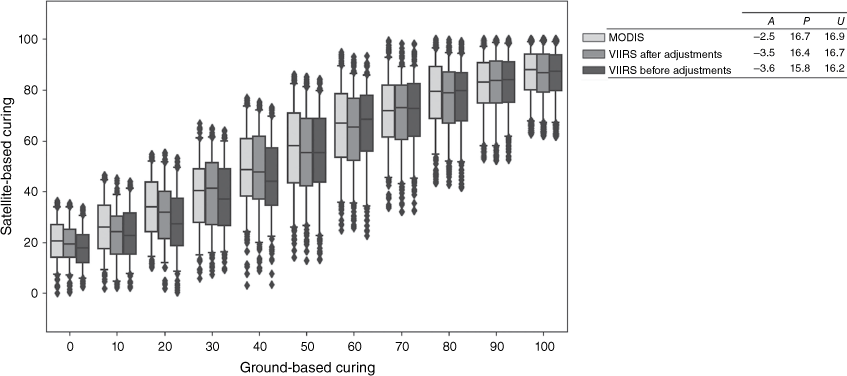
The MODIS and VIIRS observations (before and after adjustments) were compared against (visually assessed) ground-based observations for the Northern (Fig. 6) and Southern sites (Fig. 7). The APU estimates (presented in Figs 6 and 7) are each based on the assumption that ground-based observations exhibit 0% error. However, visual assessments are subjective so the error of the ground-based observations cannot be accurately determined. For both Northern and Southern sites, the RMSE and precision estimates exhibited little variation between MODIS and VIIRS observations, before and after adjustments. For the Northern sites, MODIS curing observations were higher than the ground-based observations by 1.5% (Fig. 6). VIIRS curing observations were lower than ground-based observations by 0.3% before adjustments and by 0.1% after adjustments. For the Southern sites (Fig. 7), all satellite observations, on average, were lower than the ground-based observations by up to 3.6% (for VIIRS observations before adjustments). Overall, like previous satellite and ground-based curing comparisons (Newnham et al. 2010; Martin et al. 2015), the satellite curing observations at the Northern and Southern sites have shown to over-estimate curing at low curing levels and under-estimate curing at high curing levels for both MODIS and VIIRS. Since the MODIS MapVictoria model was implemented operationally in 2013, the under- and over-estimation of MODIS curing has been reduced by VISCA, which will continue for VIIRS.
Northern sites: satellite-based curing (from the central pixel) versus ground-based curing for every 10% interval. Boxplots are presented with quartiles (box), median values (central line), 5% outer percentiles (whiskers) and outliers (points). Each boxplot and APU metric is derived from a subset of 3600 observations (selected at random) extracted from 17 122 observations, collected from all months of the year (from 2013 to 2020).
Southern sites: satellite-based curing (from the central pixel) versus ground-based curing for every 10% interval. Boxplots are presented with quartiles (box), median values (central line), 5% outer percentiles (whiskers) and outliers (points). Each boxplot and APU metric is derived from a subset of 3600 observations (selected at random) extracted from 17 122 observations, collected from all months of the year excluding June and July (from 2013 to 2020).
Conclusion
The development of the viirs-mvcuring model was not intended to outperform the MapVictoria model but to provide a continuation of satellite curing data, with minimal change, from MODIS to VIIRS. Following the spectral band adjustments for VIIRS, the VIIRS satellite curing feed will continue grassland curing input for the AFDRS and, specifically for fire spread models, for GFDI and FBI calculations and the determination of the FDRs. Owing to differences in the bands’ spectral response functions (Fig. 1), surface reflectance differences were evident between MODIS and VIIRS. The average bias for the NIR and SWIR bands, specifically, fluctuated throughout the year (Table 3), preventing the spectral adjustments from removing all bias entirely. After the spectral adjustments, VIIRS NDVI and GVMI were mostly higher than MODIS, except for the winter months in the Southern sites, when curing input is not critical. At critical times of the year in the Northern and Southern sites, the positive bias of NDVI and GVMI (Table 3) indicated that VIIRS estimated higher vegetation growth and higher vegetation water content than MODIS, resulting in lower estimates of curing. In the Northern sites, VIIRS curing was lower than MODIS by up to 3.1% before adjustments and up to 2.6% after adjustments (in October). In the Southern sites, VIIRS curing was lower than MODIS by up to 3.0% before adjustments and up to 1.4% after adjustments (in November). Compared with the ground-based observations, the adjusted VIIRS curing was lower than ground-based curing by 0.1% at Northern sites (Fig. 6) and 3.5% at Southern sites (Fig. 7). The marginal improvements of the negative bias of curing have reduced the under-prediction of the rate of spread in fire spread models and reduced the under-estimation of fire danger calculations. The VISCA model, in the AFDRS, will therefore continue to provide accurate information for: the determination of fire suppression difficulty; fire preparedness; the declaration of the fire danger period (at a district level); the declaration of total fire bans; and community warnings.
From 2023 onwards, viirs-mvcuring data will feed into VISCA (in the AFDRS) from the Suomi-NPP satellite. To improve spatial and temporal coverage, the viirs-mvcuring model will undergo further amendments to be derived from blended estimates from the Suomi-NPP, NOAA-20 and NOAA-21 satellites. Finally, the grassland curing product continues to be an essential component in fire danger calculations. The transition to VIIRS has ensured its continued availability for fire agencies to use operationally across Australia.
Acknowledgements
The authors thank Musa Kilinc, Thomas Duff, Rachel Bessell (VIC Country Fire Authority), Agnes Kristina (WA Department of Fire and Emergency Services), Paul Fox-Hughes, Christopher Griffin (Bureau of Meteorology) and the anonymous reviewer for their invaluable comments. The authors also thank all field observers from the following agencies for the collection of ground-based observations: Queensland Fire and Emergency Services; NSW Rural Fire Service; ACT Rural Fire Service; ACT Parks and Conservation Service; ACT Emergency Services Agency; Tasmania Fire Service; Tasmania Parks and Wildlife Service; SA Country Fire Service; SA Department of Environment, Water and Natural Resources; and VIC Country Fire Authority. The authors also acknowledge WA Department of Fire and Emergency Services, Bushfires NT and NSW Rural Fire Service for ongoing support. Finally, for many years of commitment to operational satellite curing assessment, the authors acknowledge the late Dr Ian Grant from the Bureau of Meteorology.
References
AFAC (2023) ‘Australasian Fire and Emergency Service Authorities Council (AFAC) Initiatives.’ (Australian Fire Danger Rating System) Available at https://www.afac.com.au/initiative/afdrs/afdrs-faqs [accessed 15 May 2023]
AFDRS (2023) Australian Fire Danger Rating System (AFDRS). Available at https://afdrs.com.au/ [accessed 15 May 2023]
Anderson SAJ, Anderson WR, Hollis JJ, Botha EJ (2011) A simple method for field-based grassland curing assessment. International Journal of Wildland Fire 20, 804-814.
| Crossref | Google Scholar |
AppEEARS Team (2022) Application for Extracting and Exploring Analysis Ready Samples (AppEEARS) Ver 34 NASA EOSDIS Land Processes Distributed Active Archive Center (LP DAAC) USGS/Earth Resources Observation and Science (EROS) Center Sioux Falls South Dakota USA. Available at https://appeears.earthdatacloud.nasa.gov[accessed June 8 2022]
Benedict TD, Brown JF, Boyte SP, Howard DM, Fuchs BA, Wardlow BD, Tadesse T, Evenson KA (2021) Exploring VIIRS continuity with MODIS in an expedited capability for monitoring drought related vegetation conditions. Remote Sensing 13, 1210.
| Crossref | Google Scholar |
BOM (2022) Australian Bureau of Meteorology (BOM) Fire Weather Service level Specification, Season 2022-2023. Available at http://www.bom.gov.au/weather-services/fire-weather-centre/fire-weather-services/documents/Fire_Weather_Service_level_Specification.pdf [accessed June 5 2023]
BOM (2023) Australian Bureau of Meteorology (BOM) Fire Weather Districts, Spatial Dataset. Available at http://www.bom.gov.au/metadata/catalogue/19115/ANZCW0503900003 [Accessed 23 May 2023]
Ceccato P, Gobron N, Flasse S, Pinty B, Tarantola S (2002) Designing a spectral index to estimate vegetation water content from remote sensing data: Part 1: Theoretical approach. Remote Sensing of Environment 82(2–3), 188-197.
| Crossref | Google Scholar |
CFA (2014b) ‘CFA Online Administration – Grassland Curing.’ (Country Fire Authority: Vic., Australia) Available at www.cfa.vic.gov.au/grass [Accessed 8 June 2023]
Chai T, Draxler RR (2014) Root Mean Square Error (RMSE) or Mean Absolute Error (MAE)? – Arguments against avoiding RMSE in the literature. Geoscientific Model Development 7, 1247-1250.
| Crossref | Google Scholar |
Chen A, Wright D, Bessell R, Nichols D, Slijepcevic A (2019) Development of a National Approach of Grassland Curing Assessment. In ‘Proceedings for the 6th International Fire Behaviour and Fuels Conference’, 29 April–3 May 2019, Sydney, Australia. (International Association of Wildland Fire: Missoula, MT, USA)
Cheney NP, Gould JS, Catchpole WR (1998) Prediction of fire spread in grassland. International Journal of Wildland Fire 8, 1-13.
| Crossref | Google Scholar |
Cruz MG, Gould JS, Kidnie S, Bessell R, Nichols D, Slijepcevic A (2015) Effects of curing on grassfires: II. Effect of grass senescence on the rate of fire spread. International Journal of Wildland Fire 24, 838-848.
| Crossref | Google Scholar |
DPI (2023) Department of Primary Industries. Agriculture – Winter crops. Available at https://www.dpi.nsw.gov.au/agriculture/broadacre-crops/winter-crops [Accessed 19 June 2023]
Fan X, Liu Y (2016) A global study of NDVI difference among moderate resolution satellite sensors. ISPRS Journal of Photogrammetry and Remote Sensing 121, 177-191.
| Crossref | Google Scholar |
Gao B-c (1996) NDWI—A Normalized Difference Water Index for remote sensing of vegetation liquid water from space. Remote Sensing of Environment 58, 257-266.
| Crossref | Google Scholar |
Justice CO, Townshend JRG, Vermote EF, Masuoka E, Wolfe RE, Saleous N, Roy DP, Morisette JT (2002) An overview of MODIS Land data processing and product status. Remote Sensing of Environment 83(1–2), 3-15.
| Crossref | Google Scholar |
Justice CO, Román MO, Csiszar I, Vermote E, Wolfe R, Hook SJ, Friedl M, Wang Z, Schaaf C, Miura T, Tschudi M, Riggs G, Hall DK, Lyapustin A, Devadiga S, Davidson C, Masuoka E (2013) Land and cryosphere products from Suomi NPP VIIRS: overview and status. Journal of Geophysical Research: Atmospheres 118, 9753-9762.
| Crossref | Google Scholar |
Kenny B, Matthews S, Grootemaat S, Hollis J, Sauvage S, Fox-Hughes P (2019) Australian Fire Danger Rating System Research Prototype: National fuel map. In ‘Proceedings for the 6th International Fire Behaviour and Fuels Conference’, 29 April–3 May 2019, Sydney, Australia. (International Association of Wildland Fire: Missoula, MT, USA)
Kidnie S, Cruz MG, Gould J, Nichols D, Anderson W, Bessell R (2015) Effects of curing on grassfires: I. Fuel dynamics in a senescing grassland. International Journal of Wildland Fire 24, 828-837.
| Crossref | Google Scholar |
Kim Y, Huete A, Miura T, Jiang Z (2010) Spectral compatibility of vegetation indices across sensors: band decomposition analysis with Hyperion data. Journal of Applied Remote Sensing 4(1), 043520.
| Crossref | Google Scholar |
Knipling EB (1970) Physical and physiological basis for the reflectance of visible and near-infrared radiation from vegetation. Remote Sensing of Environment 1(3), 155-159.
| Crossref | Google Scholar |
Lovell JL, Graetz RD (2001) Filtering pathfinder AVHRR land NDVI data for Australia. International Journal of Remote Sensing 22, 2649-2654.
| Crossref | Google Scholar |
Martin D, Chen T, Nichols D, Bessell R, Kidnie S, Alexander J (2015) Integrating ground and satellite-based observations to determine the degree of grassland curing. International Journal of Wildland Fire 24, 329-339.
| Crossref | Google Scholar |
McCoy L, Field D (2022) Lessons from NSW RFS trial of the Australian Fire Danger Rating System. Australian Journal of Emergency Management 37(4), 55-58.
| Crossref | Google Scholar |
Miura T, Turner JP, Huete AR (2013) Spectral compatibility of the NDVI across VIIRS MODIS and AVHRR: an analysis of atmospheric effects using EO-1 Hyperion. IEEE Transactions on Geoscience and Remote Sensing 51(3), 1349-1359.
| Crossref | Google Scholar |
Moyer D, Angal A, Ji Q, McIntire J, Xiong X (2022) JPSS-2 VIIRS Pre-launch reflective solar band testing and performance. Remote Sensing 14(24), 6353.
| Crossref | Google Scholar |
Obata K, Miura T, Yoshioka H, Huete AR, Vargas M (2016) Spectral cross-calibration of VIIRS enhanced vegetation index with MODIS: a case study using year-long global data. Remote Sensing 8(1), 34.
| Crossref | Google Scholar |
Roberts DR, Bahn V, Ciuti S, Boyce MS, Elith J, Guillera-Arroita G, Hauenstein S, Lahoz-Monfort JJ, Schröder B, Thuiller W, Warton DI, Wintle BA, Hartig F, Dormann CF (2017) Cross-validation strategies for data with temporal spatial hierarchical or phylogenetic structure. Ecography 40, 913-929.
| Crossref | Google Scholar |
Roger JC, Vermote EF, Devadiga S, Ray JP (2017) Suomi-NPP VIIRS Surface Reflectance User’s Guide V1 Re-processing (NASA Land SIPS). Available at https://lpdaac.usgs.gov/documents/124/VNP09_User_Guide_V1.6.pdf [accessed on 15 December 2022]
Runge A, Grosse G (2019) Comparing spectral characteristics of Landsat-8 and Sentinel-2 same-day data for Arctic-Boreal regions. Remote Sensing 11(14), 1730.
| Crossref | Google Scholar |
Santamaria-Artigas A, Vermote EF, Franch B, Roger JC, Skakun S (2021) Evaluation of the AVHRR surface reflectance long term data record between 1984 and 2011. International Journal of Applied Earth Observation and Geoinformation 98, 102317 ISSN 1569-8432.
| Crossref | Google Scholar |
Sawyer V, Levy RC, Mattoo S, Cureton G, Shi Y, Remer LA (2020) Continuing the MODIS dark target aerosol time series with VIIRS. Remote Sensing 12(2), 308.
| Crossref | Google Scholar |
Skakun S, Justice CO, Vermote E, Roger JC (2018) Transitioning from MODIS to VIIRS: an analysis of inter-consistency of NDVI data sets for agricultural monitoring. International Journal of Remote Sensing 39(4), 971-992.
| Crossref | Google Scholar |
Sun J, Xiong X, Lei N, Li S, Twedt K, Angal A (2021) Ten years of SNPP VIIRS reflective solar bands on-orbit calibration and performance. Remote Sensing 13(15), 2944.
| Crossref | Google Scholar |
Tucker CJ (1979) Red and photographic infrared linear combinations for monitoring vegetation. Remote Sensing of Environment 8, 127-150.
| Crossref | Google Scholar |
Ustin SL, Middleton EM (2021) Current and near-term advances in Earth observation for ecological applications. Ecological Processes 10, 1.
| Crossref | Google Scholar |
Vargas M, Miura T, Shabanov N, Kato A (2013) An initial assessment of Suomi NPP VIIRS vegetation index EDR. Journal of Geophysical Research: Atmospheres 118, 12,301-12,316.
| Crossref | Google Scholar |
Vermote EF, Kotchenova S (2008) Atmospheric correction for the monitoring of land surfaces. Journal of Geophysical Research: Atmospheres 113, D23S90.
| Crossref | Google Scholar |
Vermote EF, Roger JC, Ray JP (2015) MODIS Surface Reflectance User’s Guide Collection 6. Available at https://modis-landgsfcnasagov/pdf/MOD09_UserGuide_v14pdf [accessed 15 December 2022]
Willmott CJ, Matsuura K (2005) Advantages of the Mean Absolute Error (MAE) over the Root Mean Square Error (RMSE) in assessing average model performance. Climate Research 30, 79-82.
| Crossref | Google Scholar |
Willmott CJ, Matsuura K (2006) On the use of dimensioned measures of error to evaluate the performance of spatial interpolators. International Journal of Geographical Information Science 20(1), 89-102.
| Crossref | Google Scholar |
Wright D, Majewski L (2022) Transitioning satellite grassland curing from MODIS to VIIRS. In ‘Proceedings of AFAC 2022 Conference’, Adelaide, Australia, August 2022. Available at https://www.afac.com.au/insight/technology/article/conference-proceedings [accessed 20 December 2022]
Xiao X, Boles S, Liu J, Zhuang D, Frolking S, Li C, Salas W, Moore B (2005) Mapping paddy rice agriculture in Southern China using multitemporal MODIS images. Remote Sensing of Environment 95(4), 480-492.
| Crossref | Google Scholar |
Xiong X, Butler JJ (2020) MODIS and VIIRS calibration history and future outlook. Remote Sensing 12, 2523.
| Crossref | Google Scholar |
Xiong X, Angal A, Chang T, Chiang K, Lei N, Li Y, Sun J, Twedt K, Wu A (2020) MODIS and VIIRS calibration and characterization in support of producing long-term high-quality data products. Remote Sensing 12(19), 3167.
| Crossref | Google Scholar |