A laboratory-scale simulation framework for analysing wildfire hydrologic and water quality effects
Carli P. Brucker A B C * , Ben Livneh A B , Claire E. Butler D and Fernando L. Rosario-Ortiz A E
A
B
C
D
E
Abstract
Wildfires can significantly impact water quality and supply. However logistical difficulties and high variability in in situ data collection have limited previous analyses.
We simulated wildfire and rainfall effects at varying terrain slopes in a controlled setting to isolate driver-response relationships.
Custom-designed laboratory-scale burn and rainfall simulators were applied to 154 soil samples, measuring subsequent runoff and constituent responses. Simulated conditions included low, moderate, and high burn intensities (~100–600°C); 10-, 200-, and 1000-year storm events (~14–51 mm/h); and 10–29° terrain slopes.
Simulators can control key drivers, with burn intensities highly correlated (R2 = 0.64) with heat treatment durations. Increasing burn intensity treatments generally saw significant (α = 0.05) increases in responses, with runoff and sedimentation increasing by ~30–70% with each intensity increment. Carbon and nitrogen peaked at moderate intensities (~250°C), however, with concentrations ~200–250% of unburned samples.
Distinct responses at each burn intensity indicate nuanced changes in soil physical and chemical composition with increased heating, exacerbating driving mechanisms of runoff and sedimentation while reducing carbon and nitrogen through volatilisation.
This work furthers our understanding of interactions between complex geographic features and the mosaic of burn intensities which exist in wildfire-affected landscapes.
Keywords: Colorado, experiment, Fraser Experimental Forest, hydrology, laboratory-scale, precipitation, simulation, water quality, water treatment, wildfire.
Introduction
Wildfires have increased in size and severity over the past several decades (Marlon et al. 2009; Spracklen et al. 2009; Edenhofer et al. 2015; Sommerfeld et al. 2018). These hazards can alter hydrologic mechanisms and exacerbate flood risks (Brogan et al. 2017), as well as degrade stream water quality, resulting in severe implications for downstream systems (Bladon et al. 2014; Hohner et al. 2019a). However, quantification of these effects is lacking due to challenges in in situ sampling in burned areas, e.g. unstable terrain and road closures, as well as the limited availability of pre-burn data (Writer et al. 2014; Murphy et al. 2015; Hohner et al. 2019a). Attribution of responses is additionally hindered by high spatial and temporal variability of conditions and complex driver interactions in natural environments (Murphy et al. 2015; Hohner et al. 2019b). Wildfire and rainfall simulation experiments strive to isolate and quantify driver-response relationships through precise control and minimised variability in simulated environments (Robichaud 2005; Cancelo-González et al. 2012; Cotrufo et al. 2016; Kampf et al. 2016; Hohner et al. 2019b; Wilkerson and Rosario‐Ortiz 2021). However, simulations of natural mechanisms are often oversimplified due to limitations in the variety and capacity of incorporated drivers and geophysical conditions (Brucker et al. 2022). In this study, we developed a novel laboratory-scale wildfire and rainfall simulation experiment, attempting a unique representation of post-fire environments by incorporating variable intensities and ranges of burn severity, rainfall intensity, and terrain slope. These mechanisms were simulated at three to four intervals each, with hydrologic (runoff and infiltration) and water quality (sediment, dissolved organic matter (DOM), turbidity, and nitrogen) responses measured across each combination.
In wildfire-affected settings, water quality and supply hazards are created by burn mechanisms’ complex interactions with soil and vegetation (Doerr et al. 2006; Hohner et al. 2019a; Rhoades et al. 2019b). Increases in sediment, DOM, turbidity, and metals (Robichaud 2005; Bladon et al. 2014; Jian et al. 2018; Hohner et al. 2019a; Rhoades et al. 2019a) hinder water treatment processes (Writer et al. 2014; Murphy et al. 2015; Raseman et al. 2017; Becker et al. 2018; Hohner et al. 2019a) and elevated sediment and nutrient concentrations cause reservoir filling (Moody and Martin 2009a) and disrupt freshwater ecosystems (Spencer et al. 2003; Bladon et al. 2014). Runoff rates 5–870 times greater than pre-fire levels are often driven by hydrophobic soil layers created by combustion and heating mechanisms, as well as reduced ground cover (Bladon et al. 2014). These high flows, combined with combusted surface materials and vegetation loss, can drive increased erosion and sedimentation rates up to ~1500 times (Smith et al. 2011) and turbidities up to ~2000 times pre-disturbance levels (Becker et al. 2018). DOM, nutrients, and metals are also released during combustion and often transported downstream at higher rates than pre-fire levels, exacerbated by solutes leached from high sediment loads (Abraham et al. 2017; Cawley et al. 2017; Hohner et al. 2019a).
To facilitate attribution of these effects to drivers, laboratory-scale wildfire and rainfall simulations precisely control and quantify factors, which often oversimplify representations of highly variable natural environments in the process (Brucker et al. 2022). Where natural processes involve interactions of numerous drivers with wide ranges, previous simulation studies analysed only one or two drivers and intensity increments (Blank et al. 1994; Robichaud and Hungerford 2000; Busse et al. 2010; Stoof et al. 2010; Cancelo-González et al. 2013; Badía-Villas et al. 2014; Wieting et al. 2017). Typically, either burn or rainfall mechanisms were simulated, using propane torches (Kral et al. 2015), heat lamps (Wieting et al. 2017), litter burning (Busse et al. 2010), and muffle furnaces (Hohner et al. 2019b), or nozzle-based (Cancelo-González et al. 2013) and drip-based (Hester et al. 1997) precipitation equipment. Other key processes were either naturally applied (e.g. in situ samples collected from wildfire-affected areas (Wang et al. 2015)) or excluded (e.g. samples analysed using leaching instead of simulating precipitation mechanisms (Hohner et al. 2019b)). Cancelo-González et al. (2013) and Keesstra et al. (2014) are key exceptions that incorporated both burn and rainfall mechanisms. However, in these studies and others, the few driver increments tested limited analyses to binary assessments (e.g. ‘burned’ vs ‘unburned’) (Brucker et al. 2022), lacking more granular information on the effects of varying burn intensities. Finally, analysis of just one or two geophysical drivers is common (Klopatek et al. 1988; Blank et al. 1994; Badía-Villas et al. 2014; Keesstra et al. 2014), including types of vegetation (Blank et al. 1994) and burned detritus (Klopatek et al. 1988), as well as soil moisture (Busse et al. 2010), rock content (Stoof et al. 2011), and aggregate sizes (Keesstra et al. 2014). These factors are much more numerous and varied in natural environments and can greatly influence hydrologic and water quality driving mechanisms (Ebel et al. 2012; Murphy et al. 2015; Cotrufo et al. 2016).
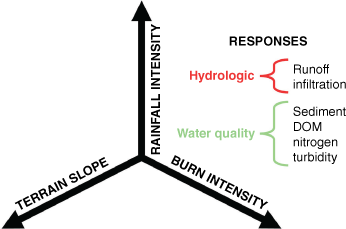
This laboratory-scale wildfire and rainfall simulation experiment attempts to represent complex post-wildfire environments by simulating three key mechanisms and topographic features: (1) burning; (2) rainfall; and (3) terrain slope (Brucker 2023). Each driver was tested at three to four intensity increments reflective of natural settings, with responses in runoff, infiltration, sediment, DOM, turbidity, and nitrogen observed at each driver-intensity combination (Fig. 1). To quantify burn effects both independently and in the context of system interactions, our unique design incorporated numerous testing increments compared to previous wildfire simulators (Stoof et al. 2011; Cancelo-González et al. 2013; Badía-Villas et al. 2014; Keesstra et al. 2014; Wieting et al. 2017) and was the first to simulate varying terrain slopes (Cancelo-González et al. 2013; Kibet et al. 2014). While previous studies analysed either sediment (Roundy et al. 1978; Knight et al. 1983; Emmerich and Cox 1992; Marcos et al. 2000; Keesstra et al. 2014) or solutes (Cancelo-González et al. 2013) in simulated runoff, observations of both provided insights into hydrologic and erosional influences on solute response. This manuscript describes the design, construction, and evaluation of laboratory-scale wildfire and rainfall simulators, providing insights into nuanced driver interactions and their effects on hydrologic and water quality responses.
Materials and methods
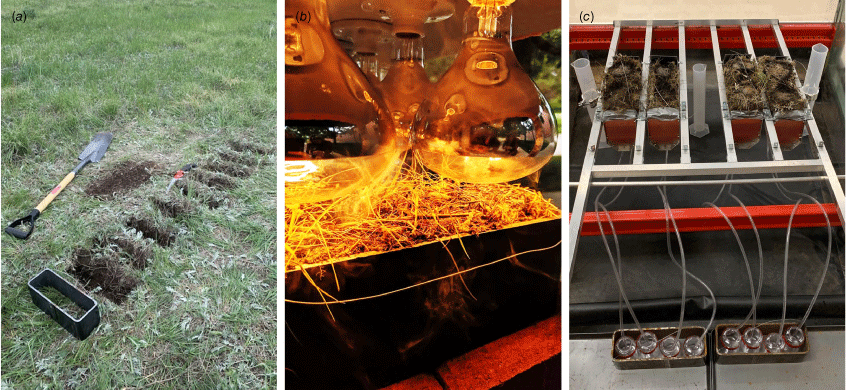
This experiment was constructed to observe hydrologic and water quality responses within a 3D experimental matrix of burn intensity, rainfall intensity, and terrain slope at four, three, and three different intensity increments, respectively, (Table 1). Soil samples were first excavated from a site in Colorado (Fig. 2a), then burn and rainfall treatments applied using custom-designed heat lamp (Fig. 2b) and nozzle-based (Fig. 2c) mechanisms. A target of eight replicate soil samples were designated for testing at each combination of driver increments. This relatively large number of replicates, compared to the two to five typical across studies reviewed by Brucker et al. (2022), aided in characterising and minimising variability-related uncertainty in response trends. Soil and vegetation characteristics were held as consistent as possible between samples to further isolate effects from the three key drivers. In addition to the main experimental matrix, the effects of two sequential rainfall events with a ~24-h drying period in between were tested on 27 additional soil samples, following similar methods as Keesstra et al. (2014).
| Burn intensity (°C) | Rainfall intensity (mm/h) | Terrain slope (°) | |||
|---|---|---|---|---|---|
| Low (14.3) | Moderate (26.3) | High (50.8) | |||
| Unburned (NA) | 8 replicates | 8 replicates | 8 replicates | 10 | |
| 8 replicates | 8 replicates | 8 replicates | 20 | ||
| 8 replicates | 8 replicates | 8 replicates | 30 | ||
| Low (100–200) | 8 replicates | 8 replicates | 8 replicates | 10 | |
| 8 replicates | 8 replicates | 8 replicates | 20 | ||
| 8 replicates | 8 replicates | 8 replicates | 30 | ||
| Moderate (200–350) | 8 replicates | 8 replicates | 8 replicates | 10 | |
| 8 replicates | 8 replicates | 8 replicates | 20 | ||
| 8 replicates | 8 replicates | 8 replicates | 30 | ||
| High (350–600) | 8 replicates | 8 replicates | 8 replicates | 10 | |
| 8 replicates | 8 replicates | 8 replicates | 20 | ||
| 8 replicates | 8 replicates | 8 replicates | 30 | ||
Matrix of all combinations of driving factors (burn severities, rainfall intensities, and terrain slopes) where up to eight replicate samples were tested. Note: the exact terrain slopes tested were 9.8°, 19.8°, and 29.4° – rounded up to whole numbers for the table.
The steps involved in the simulation experiment process. (a) Excavating soil samples, (b) heating in the wildfire simulator, and (c) applying precipitation in the rainfall simulator (water quality analyses not pictured). Photos courtesy of Carli Brucker.
Responses from the tested soil samples were observed over time and across drivers. Runoff and percolation (i.e. liquid drainage through the soil samples) were collected as frequently as every 2 min to capture changing hydrologic and water quality responses. Each soil sample’s water balance equation was then rearranged to calculate change in storage and infiltration, assuming no losses occurred:
and
where ΔS is change in storage, P is precipitation applied, R is collected runoff, D is drainage or collected percolation, ET is evapotranspiration (assumed to be negligible), and I is infiltration. These variables were all measured in units of mm. Collected runoff was then measured for turbidity in nephelometric turbidity units (ntu), total suspended solids (TSS) in units of mg, total dissolved nitrogen (TDN) in units of mg/L, and dissolved organic carbon (DOC) in units of mg/L, measured as a proxy to estimate DOM. Testing more than two increments per driver provided more granular insights into subsequent response shapes, e.g. linear vs polynomial, with statistical methods used to assess the influence of each driver.
Study area and soil sample collection
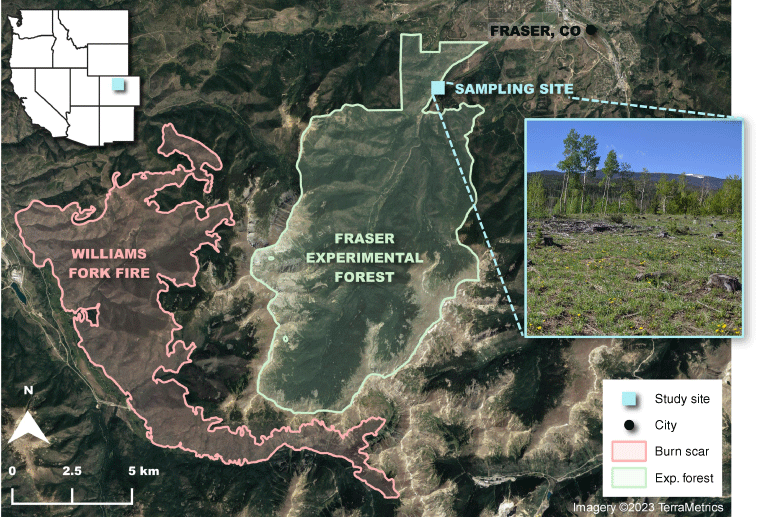
The Fraser Experimental Forest (FEF) was selected as this study’s sampling site due to a nearby burn scar (Fig. 3) and information provided by previous wildfire research (Lawrence 2020). The FEF is a 93-km2 US Forest Service outdoor research laboratory, with the St. Louis Creek its main drainage (Alexander and Watkins 1977). Vegetation regimes are primarily subalpine forests and alpine tundra typical to the central Rocky Mountains, including Engelmann spruce, subalpine fir, and lodgepole pines (Rhoades et al. 2017). The elevation ranges from 2680 to 3900 m and soils are mostly skeletal, sandy loam (Alstatt and Miles 1983). The climate is generally humid and cool with an annual precipitation average of 74 cm, nearly two-thirds of which is in the form of snow (Essery et al. 2009). In 2020, the Williams Fork fire affected 52 km2 of the Arapaho National Forest several miles southwest of the FEF, burning at a moderate to high intensity. High probability of post-wildfire debris flow was projected for large areas of the burn scar (Staley and Kean 2020). However, post-fire water quality data was unavailable to use for comparison purposes in this study.
Map with the Fraser Experimental Forest overlaid in green and the Williams Fork fire burn scar overlaid in red. A blue square marker indicates the coordinates of our sampling location, with an inset image of the site. A map of the sampling location in the U.S. West is included in the top-left corner. Photo courtesy of Carli Brucker.
At a relatively level plot within this site, soil samples were carefully excavated to preserve natural soil structure and vegetation. Samples were securely fitted into 31 × 10 × 10 cm steel sampling containers. For more information of the design, see Supplementary Material A. Following methods from the US Department of Agriculture (USDA) (Hemenway, USDA NRCS South Dakota 2017), vegetation was first trimmed to a manageable height (<~30 cm). Sample outlines were then cut with a spade, lifted from the ground, and the sides shaved down to sampling container dimensions, allowing for minimal compression during insertion. The top ~3 cm of soil was left above the top of the containers, minimising fall-through and edge gaps from shrinkage after drying and transportation.
To maximise uniformity of soil and vegetation characteristics, all samples were collected from within a ~15-m diameter. Soil from this area was characterised as loamy sand, or a composition of ~5% gravel, ~82% sand, ~10% silt, and ~3% clay. This was determined through grain size distribution and hydrometer analyses, following methods by Das and Sobhan (2010) and USDA Particle-Size Classifications (García-Gaines and Frankenstein 2015). Once returned to the lab, samples were covered in plastic and their water content routinely measured to maintain consistent soil moisture prior to testing, lightly spraying samples with water when humidity levels were notably low.
Wildfire simulator design and procedure
The wildfire simulator apparatus was designed to simulate natural heating and combustion mechanisms at a range of intensities, while allowing for repeatable and quantitative burn treatments. Following Cancelo-González et al. (2013) and Klopatek et al. (1988), high-wattage heat lamps were used to heat soil surfaces and subsurfaces (~3 cm below the surface) to temperatures reflective of natural wildfires, or ~100–600°C and ~25–550°C, respectively (Chandler et al. 1983; Wieting et al. 2017; Jian et al. 2018). This method also captured combustive and ‘top-down’ heating mechanisms often neglected in simulation experiments, e.g. muffle furnaces (Brucker et al. 2022). Controlled by the duration of heating applied, burn intensity was precisely measured using soil heating profiles from thermocouple measurements, similar to methods in Busse et al. (2010).
While high intensity wildfires can reach temperatures greater than ~2200°C (Shahlaee et al. 1991), the simulated surface temperatures captured most wildfire-driven soil and water chemistry effects (Chandler et al. 1983; Wieting et al. 2017; Jian et al. 2018). Hogue and Inglett (2012) and Hohner et al. (2019b) both showed peak nitrogen and carbon production at temperatures less than ~225–550°C, with marginal loads at higher temperatures due to volatilisation. Simulated hydrologic effects were more limited, however, as some changes in soil physical characteristics only occur at extreme temperatures, e.g. the destruction of clay at ~800°C (Neary et al. 2005). However, soil subsurface temperatures did capture wildfire-driven vegetative root destruction, which is a key driver of erosion and sedimentation. Temperatures lethal for roots, or >60°C (Busse et al. 2005), were achieved in the subsurface for most low and all moderate and high intensity burns, with medians of 63, 95, and 202°C, respectively. Additionally, ashy combustion residues produced during simulations had chemical compositions similar to natural fires (Hogue and Inglett 2012).
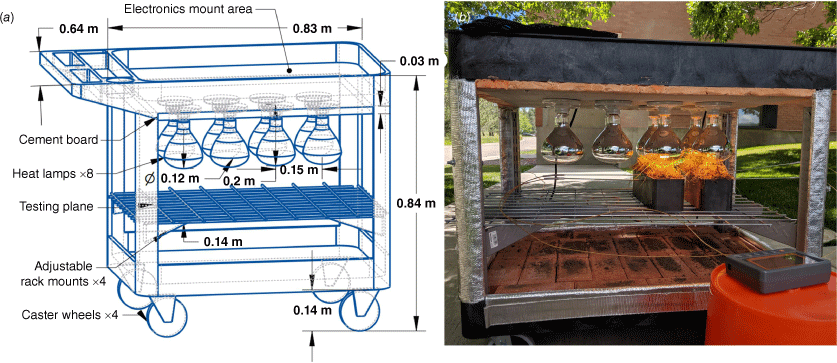
Heat lamps were affixed to a cart apparatus (Fig. 4), facilitating transportation and burning of multiple soil samples simultaneously. Eight Philips Infrared 375-Watt Heat Lamps with ~13 cm diameters, similar to those used by Cancelo-González et al. (2013), were affixed to a 0.6 × 1.2 × 0.9 m cart made with a non-conductive material, or high-density polyethylene. Though this material provided a good structure for electrical components, its low melting point, or ~125°C (Wei et al. 2010), required fire-resistant cement board to be laid in between the cart and heat lamps. Heat-reflective cloth and fire-resistant spray covered remaining exposed areas. Prior to burn simulations, samples were positioned ~3 cm below the heat lamps using an adjustable metal rack, with aluminium windscreens wrapped around to mitigate wind effects. Two thermocouples were inserted into each sample’s surface (underneath a heat lamp and in the centre of the sample) with two more at the same lateral positions ~3 cm below. K-type thermocouples, capable of temperature measurements ranging from ~95 to 1260°C (Park 2010), recorded temperature profiles at 5-s intervals to Gain Express AZ 4-Channel SD data loggers.
(a) Schematic of the wildfire simulator design, including structural components and dimensions. (b) The constructed wildfire simulator applying heat to two soil samples with thermocouples inserted into their sides. Photo courtesy of Carli Brucker.
The wildfire simulation procedure applied heating to soil samples for durations necessary to achieve target burn intensities, recording the soil heating profiles produced. Burn intensity was characterised using both a temperature-based and temperature-time (degree hours) scale (Table 2; Supplementary material A). After switching on the data loggers, heat lamps were applied to samples until temperatures associated with desired burn intensities were achieved at the hottest areas of soil surfaces. The lamps were then switched off, while the data loggers continued recording until surfaces returned to near-ambient temperatures, typically ~1–1.5 h from the start of the simulation. Experiments were scheduled for days with no freezing weather, precipitation, or high winds to maximise consistency in ambient climate.
| Burn severity | Surface temperature characterisation (°C) | Degree hour characterisation (°C-h) | Mean heating duration (min) | |
|---|---|---|---|---|
| Low | 100–200 | 8–39 | 2.2 | |
| Moderate | 200–350 | 39–110 | 3.7 | |
| High | 350–600 | 110–993 | 8.1 |
Burn intensity levels used in this study, characterised using a temperature-based scale and degree hours, and the mean heating duration to achieve each intensity during wildfire simulation.
Rainfall simulator design and procedure
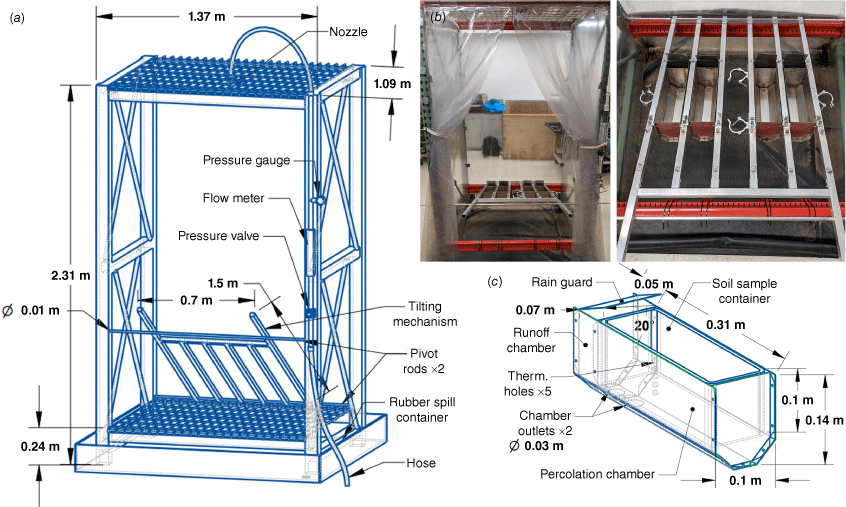
The rainfall simulator was designed to simulate natural rainfall mechanisms at a wide range of intensities by producing similar droplet sizes, kinetic energies, and distributions. Based on experimental designs used in Cancelo-González et al. (2013) and Kibet et al. (2014), rainfall was generated by nozzles which produced a range of precipitation intensities common in the FEF (Fig. 5). These nozzles were affixed at the top of a tall (2.3 m) steel frame, providing sufficient height for even rainfall distribution and adequate fall time to achieve natural droplet kinetic energies. FullJet nozzles (Spraying Systems Co., Bloomingdale, IL, United States) with conical, downward spray were used. These nozzles are rated to produce natural droplet sizes (~0.5–4 mm (Ulbrich 1983)) and kinetic energies (~0.1–28 J/m2 mm (Yonter and Houndonougbo 2022)) when operated at appropriate pressures and heights. As shown in Table 3, nozzle sizes HH-4.3W (small), HH-8W (medium), and HH-20W (large) were selected, achieving average 14.4, 26.4, and 51.3 mm/h intensities, respectively, which roughly corresponded to historical average 10-, 200-, and 1000-year 2-h rainfall events within the FEF (Precipitation Frequency Data Server 2017). The frame height used here was similar to previous studies testing the same nozzles, which reported kinetic energies comparable to ~90% of natural droplets (Yonter and Houndonougbo 2022) and was sufficient for producing even spatial distributions, despite the nozzles’ conical spray. Assessment of rainfall distribution, selection of nozzles’ optimal operating pressures (Table 3), and interpolated precipitation estimates for each soil sample is discussed further in the section ‘Rainfall simulator calibration’.
(a) Schematic of the rainfall simulator design including structural component dimensions and plumbing features. (b) Front view of the rainfall simulator and a top-down view of the tilting mechanism inside, with custom funnels put in place. (c) A similar schematic for the custom funnels, shown with an inserted soil sampling container. Photos courtesy of Carli Brucker.
| Rainfall level | Nozzle size | Return intensity (year) | Median rainfall intensity (mm/h) | Optimal operating pressure (kPa) | Average flow rates (L/m) | |
|---|---|---|---|---|---|---|
| Low | HH-4.3W | 10 | 14.4 | 69 | 1.5 | |
| Moderate | HH-8W | 200 | 26.4 | 62 | 1.9 | |
| High | HH-20W | 1000 | 51.3 | 62 | 6.8 |
Rainfall intensity levels and their associated FullJet nozzles, as well as return intervals for the FEF, median rainfall intensities produced, optimal operating pressures (or those which produced the lowest rainfall spatial variability (Tossell et al. 1987; Kibet et al. 2014; Yonter and Houndonougbo 2022)), and average system flow rates produced.
The simulator plumbing and structural features, including a tilting mechanism and interfacing custom funnels, were designed to facilitate the application of rainfall to soil samples held at 9.3, 19.8, and 29.4° terrain slopes. These slopes were identified as common low, medium, and high terrain slopes in the FEF, respectively, through a frequency analysis performed on a digital elevation model (not shown). As shown in Fig. 5a, a flexible hose attached to the lab sink supplied nozzles with a consistent flow of tap water, with a pressure gauge, pressure valve, flow meter, and ball valve installed inline similar to Kibet et al. (2014). While previous studies have used pump systems to regulate flow (Keesstra et al. 2014; Kibet et al. 2014), the lab sink supplied sufficient and consistent pressures and flow rates to the system (Kibet et al. 2014). Additionally, tap water quality had no significant discrepancies from typical rainfall in the FEF, with a pH of ~7 and DOC and TDN concentrations of 1.1 and 0.1 mg/L, respectively. The simulator frame had a 1.2-m × 1.1-m lateral testing plane, with clear plastic covering the sides and an industrial-grade rubber spill container underneath to drain excess rainfall. Affixed within the testing plane, a 0.7-m × 1.0-m aluminium tilting mechanism held samples at varying terrain slopes (Fig. 5b), interfaced using custom soil sample funnels designed to capture and separate hydrologic responses (Fig. 5c). Graduated cylinders affixed at all four sides of the tilting rack measured simulated precipitation. For further discussion of tilting mechanism and custom funnel design, see Supplementary material A.
The rainfall simulation procedure applied specific precipitation intensities to samples set at varying terrain slopes for 2-h events, capturing resulting runoff and percolation. Following Wieting et al. (2017), petroleum jelly and duct tape were used to seal gaps in soil samples, avoiding precipitation running through interfaces between samples, containers, and funnels. The simulation began by opening the inline flow valve, then adjusting the pressure valve to the nozzle’s operating pressure. Water pressure was periodically checked and adjusted as needed throughout the run to maintain consistency. Percolation and runoff were collected in 1000-mL and 300-mL plastic bottles, respectively, with full bottles switched for empty ones as needed. Runoff from one of four samples in each rainfall simulation was collected in smaller aliquots (60 mL) at 2-min intervals for the first 10 min after runoff initiation, then 5-min intervals for the next 10 min, then every subsequent 10 min. Runoff and percolation samples were then weighed, with runoff frozen for later water quality analysis.
Water quality analysis
Runoff samples were analysed in a lab to assess levels of sediment, turbidity, and dissolved constituents. Turbidity was first assessed using a Hach 2100N Turbidimeter, following the US Environmental Protection Agency Method 180.1 (O’Dell 1993; Hatch Corporation 2014). TSS was then measured following the Total Suspended Solids Method 2540 D (APHA 2012), using a vacuum pump and 0.7 µm glass filters. A Shimadzu TOC-V/TN Analyser then measured DOC in filtered liquids by sparging samples with high-purity air, removing inorganic carbon, then determining the non-purgeable organic carbon (Shimadzu Corporation 2001). TDN was measured similarly. More detailed water quality analysis methods are in Supplementary material A.
Statistical analysis
Hydrologic and water quality measurements were assessed for significant changes and trends across burn intensity, rainfall intensity, and terrain slope increments using statistical analyses. Ratios of responses over runoff and precipitation values were first calculated to assess changes independent of varying rainfall intensity or hydrologic mechanisms. Runoff ratios, a unitless metric, were calculated by dividing generated runoff in mm by the precipitation applied to each sample in mm. Suspended sediment concentrations (SSC) were calculated in units of mg/mm by dividing TSS in mg by total runoff in mm. A one-way ANOVA test was performed for each driver-response comparison to assess for significant changes across driver increments, with pairwise t-tests used to assess significance between specific increments. Linear regressions and R-squared values evaluated the linearity of responses. A significance level of α = 0.05 was used for all tests, where applicable.
Results
Validation of the wildfire simulator’s ability to emulate natural burn mechanisms at a range of intensities with repeatable, quantifiable burn treatments is presented first. Next, rainfall distribution tests results are shown, discussing their use in selecting operating settings for the rainfall simulator, as well as validating the simulator’s height and creating more accurate precipitation intensity estimates. Finally, key runoff, sediment, and solute responses from soil samples tested in the experimental matrix are presented.
Wildfire simulator calibration
The duration of heat lamp treatments on soil samples proved to be an effective mechanism to control varying burn intensity applications. As shown in Fig. 6, heating durations were highly linearly related (R2 = 0.64) to peak temperatures achieved, the metric used to quantify burn intensity in this study. Heating durations required to achieve low, moderate, and high burn intensities ranged from ~1–3, 3–6, and 6–10 min, respectively, with mean durations of 2.2, 3.7, and 8.1 min. Due to their influence on soil heating rates (Klopatek et al. 1988; Reardon et al. 2007; Busse et al. 2010; Stoof et al. 2011), we attempted to maintain consistent antecedent soil moistures and ambient temperatures during burn simulations. However, variability still existed in these factors, with values ranging from ~0 to 13% volumetric water content and 17–34°C, respectively. Thus, samples tested at high (greater the median, or 2.7%) soil moisture levels and extreme (outside the interquartile range, or 26–30) ambient temperatures were excluded from the heating duration-burn intensity analysis to isolate this relationship.
(a) Time-temperature curves from two thermocouples placed at the soil surface (solid line) and 3 cm below the soil surface (dashed, red line) during a high burn intensity simulation. Dashed lines show the time when peak temperatures were achieved, or 620 and 552°C for the surface and subsurface, respectively, and the grey area represents the area under the surface temperature curve integrated to calculate degree hours. (b) Comparison of peak temperatures to heat treatment durations for samples burned with low (i.e. less than the sample median) initial soil moisture and at moderate (i.e. inner quartile range of samples) ambient temperatures, with a black line indicating best linear fit (R2 = 0.64). Durations required to achieve low, moderate, and high burn intensities are indicated by dashed lines, placed at the points of intersection of target temperatures and the best fit line. Different intensities are represented by different colours, as well as text descriptions of approximate durations.
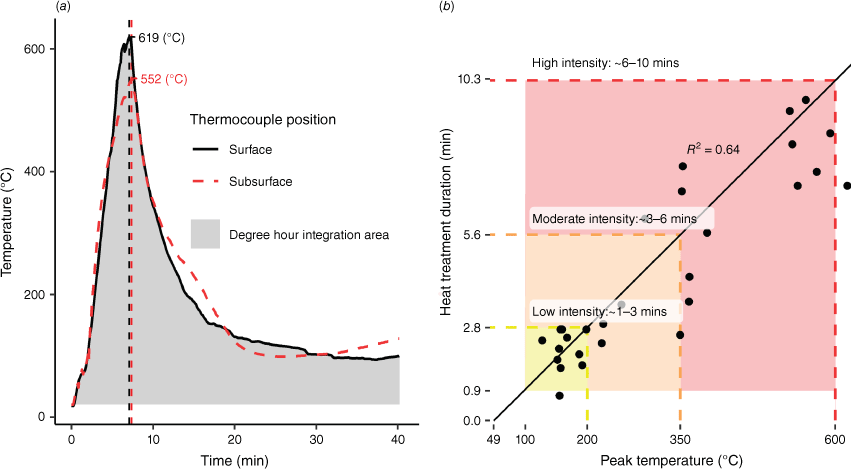
Time-temperature curves from the thermocouple measurements showed surface temperatures as high as ~600°C were achieved, capturing the full range of wildfire effects as discussed in the section ‘Wildfire simulator design and procedure’. Higher values were likely limited by heat loss in the space between heat lamps and soil surfaces, though temperatures were still notably higher than those in previous studies that used similar burning techniques (Klopatek et al. 1988; Cancelo-González et al. 2013). Subsurface heating profiles showed a delayed and muted response to heating, similar to previous studies (Stoof et al. 2011; Cancelo-González et al. 2013), with temperatures necessary for root destruction achieved in most cases (median values of ~63–202°C).
Rainfall simulator calibration
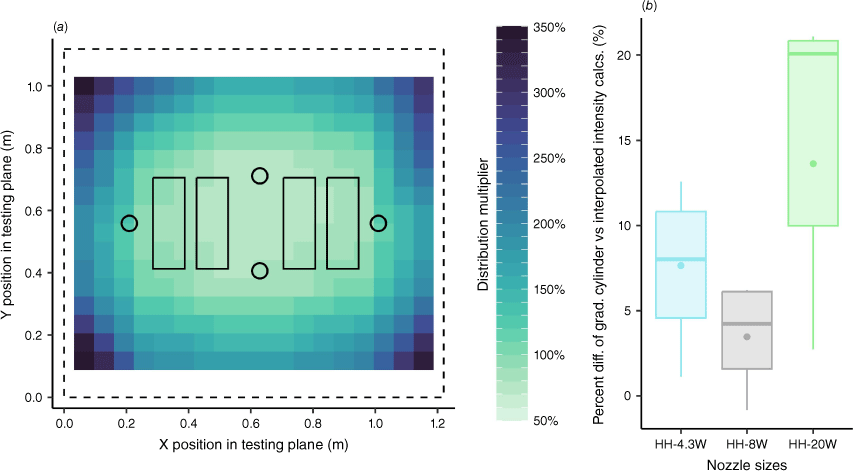
Rainfall distribution tests informed the selection of optimal nozzle operating pressures and allowed for spatially interpolated estimates of precipitation applied to each soil sample. Optimal pressures were selected based on the lowest spatial variance produced for each nozzle, using interpolated distribution maps (Fig. 7a). Pressure of 62 kPa produced the lowest variability for both the HH-8W and HH-20W nozzles, with coefficients of variation (standard deviation/mean) of 0.0071 and 0.0137, respectively. Pressure of 69 kPa produced the lowest variability for the HH-4.3W nozzle, with a coefficient of variation of 0.0069. Though these coefficients of variation were all satisfactorily low, the HH-20W nozzle produced more spatially-variable precipitation than the smaller sizes. Thus, interpolated rainfall estimates were the most different from graduated cylinder measurements for high rainfall intensities, or up to a 20% (Fig. 7b). Interpolated estimates for moderate and low rainfall intensities were different from graduated cylinder measurements by as much as 7% and 11%, respectively.
(a) Interpolated schematic of rainfall distribution across the footprint of the rainfall simulator for the HH-20W nozzle as an example, normalised by average graduated cylinder measurements to allow for localised estimates of precipitation applied to each sample. The dashed line represents the full extent of the testing plane. (b) Percent differences of graduated cylinder rainfall intensity estimates from values interpolated from distribution maps for each nozzle size.
Simulation experiment responses
Results from the 154 soil samples tested generally showed monotonic increases in runoff ratio, SSC, and turbidity with increasing burn intensity, while both DOC and TDN showed inverse ‘U’ shaped trends with increasing intensities. This is consistent with previous studies which have observed overall increases in runoff rates, sediment loads, and nutrient concentrations after burning, as well as distinct differences in effects at varying burn intensities (Smith et al. 2011; Bladon et al. 2014; Rust et al. 2018). Specifically, high intensity fires have been shown to produce much greater responses in runoff and water quality constituents than low intensity burns (Robichaud and Waldrop 1994; Moody and Martin 2001a; Rhoades et al. 2011). Additionally, Hohner et al. (2019b) observed a peak in DOM concentration at moderate burn intensities, with lower concentrations at low and high burn intensities – similar to trends observed in this study.
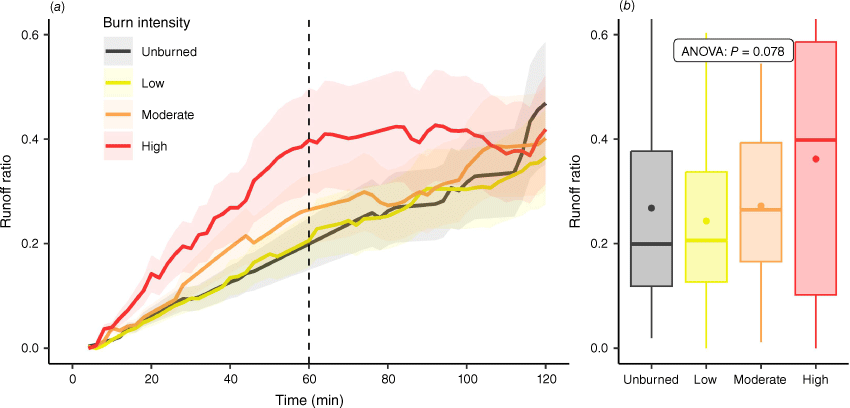
Runoff ratios during the first hour of rainfall simulations increased monotonically with increasing burn intensities (Fig. 8b). Values for high burn intensity samples were significantly higher (α = 0.05) and almost twice the median of low burn intensity samples, with moderately burned sample values generally falling somewhere in between these. This was likely due to increased soil hydrophobicity with greater heating levels, created by the redistribution of organic materials and waxes, as well as smaller, combusted particles filling in lower soil pores (Robichaud and Hungerford 2000; Badía-Villas et al. 2014). As shown in Fig. 8a, runoff ratios grew most rapidly over time for high burn intensity samples for the first 60 min of rainfall simulations, then levelled off. Similar to reports of ‘flashy’ runoff in fire-affected areas in previous studies (Bladon et al. 2014), this may be due to initial hydrophobic properties in burned soils deteriorating later in the simulation. A similar effect, though more muted, was observed in moderately burned samples, whereas unburned and low burn intensity samples showed more consistent increases in runoff ratios throughout the 2 h rainfall treatments. For all burn intensities, however, little to no runoff was produced by samples tested at the lowest rainfall intensity and terrain slope settings, even after precipitation events lasting 4+ h. The smaller amounts of precipitation produced by low intensity rainfall may have been stored by accumulated ash (or vegetation in unburned samples), whereas this storage capacity was likely reached more rapidly at the higher intensities (Ebel et al. 2012). At the lowest terrain slope, runoff generation was likely limited due to insufficient droplet kinetic energy. Due to the lack of runoff produced, few replicates were tested at these settings, as time and resources were limited.
(a) Time-series plot of median runoff ratio, beginning when runoff was first produced and ending at the completion of the 2-h simulated rainfall event. Coloured lines represent burn severities, with shaded regions indicating inner quartile ranges. A dashed line shows the 60-min mark. (b) Box plots of runoff ratios calculated for the first 60 min of rainfall simulations. An ANOVA P-value of 0.078 indicated that each burn intensity group was not significantly different from all other groups (α = 0.05). However, a t-test between the high and low burn intensity groups had a P-value of 0.01, indicating that the high burn intensity group was significantly higher.
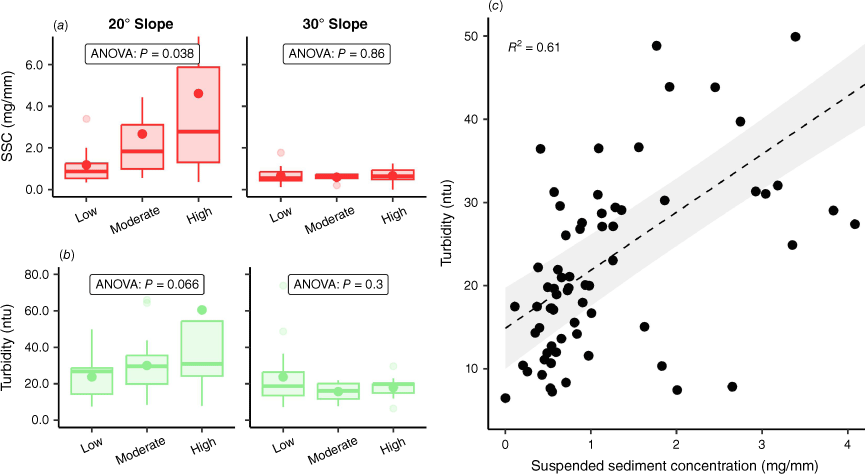
At a 20° slope angle, SSC and turbidity increased monotonically from low to high burn intensities characterised by degree hours. This is consistent with previous studies which show greater soil structural degradation and ash accumulation following more severe wildfires, which when combined with higher runoff rates, drive increased sediment transportation and mobilisation in streams (Johansen et al. 2001; Smith et al. 2011; Becker et al. 2018). As shown in Fig. 9a, SCC showed significant increases with each increasing burn intensity level (ANOVA P-value of 0.038). Turbidity values also increased with burn intensity (Fig. 9b), with values at high intensities significantly greater than low intensities (t-test P-value of 0.033). For both SSC and turbidity, median values at high burn intensities were twice those at low intensities. The similarity of responses between these two water quality measurements made sense due to their close linear correlation, or R2 = 0.61 (Fig. 9c). This was likely due to the mobilisation of smaller post-burn particles contributing to higher turbidities, with variability in the relationship caused by larger post-burn particles settling more quickly (Bright and Mager 2020). At a 30° slope angle, little to no sedimentation was generated for all samples, though this was likely due to experimental limitations as discussed in the section ‘Experimental Limitations’ of the Discussion.
(a) Boxplots of SSC from low to high burn intensities characterised by degree hours, at 20° and 30° terrain slopes. (b) Similar boxplots, but for turbidity. ANOVA P-values displayed indicate that burn intensity groups are not all significantly different. (c) Turbidity plotted against SSC for all burned samples. The dashed line represents the best linear fit of data (R2 = 0.61), with the greyed-out area representing the confidence interval (level = 0.95).
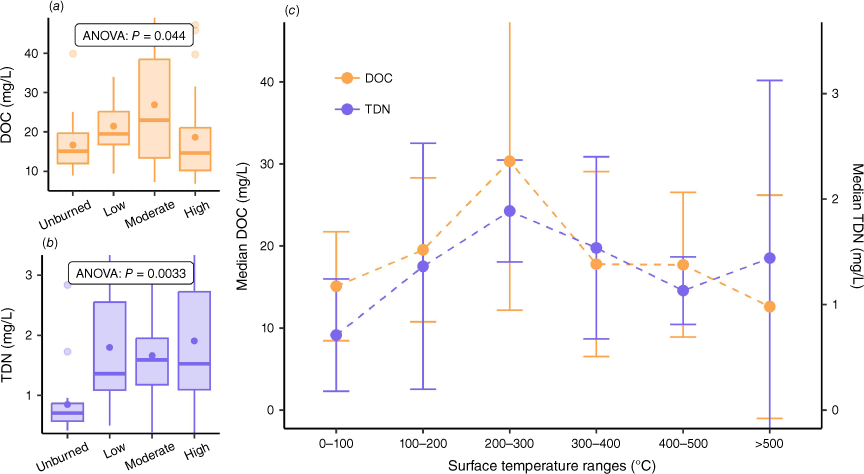
As shown in Fig. 10a, b, both DOC and TDN increased incrementally from unburned to moderate burn intensity groups, peaked at 200–300°C, then decreased from moderate to high burn intensities. Median concentrations at moderate intensities were 44% and 112% higher than unburned samples, respectively, and 65 and 15% higher than high burn intensity samples. ANOVA P-values of 0.044 and 0.003 for DOC and TDN, respectively, meant the observed inverse ‘U’ shaped trends were significant (α = 0.05). Similar to findings in Hohner et al. (2019b), this was likely due to low to moderate temperatures (i.e. below ~350°C) releasing carbon and nitrogen, then more extreme temperatures (~350–600°C) volatilising constituents. For additional discussions of simulated responses, including results from sequential rainfall applications, see Supplementary material B.
(a) Boxplot of DOC concentrations with increasing burn intensity levels, showing an ANOVA test P-value of 0.044. (b) A similar boxplot for TDN concentrations, with an ANOVA P-value of 0.003. (c) Median DOC and TDN values binned into increasing surface temperature ranges. Error bars show medians plus and minus one standard deviation.
Discussion
Calibration and validation testing results from the simulators confirmed their ability to generate controlled, replicate intensities at ranges capturing key mechanisms and wide variability in post-wildfire environments. The controlled setting of the experiment additionally allowed for isolation of factors and provided key insights into independent and joint interactions of drivers with responses. However, anomalous responses also revealed experimental limitations, contributing uncertainty to results.
Experiment validation
The wildfire simulator achieved temperature ranges and combustion processes important in natural burn mechanisms and the rainfall simulator emulated the mechanics of natural precipitation. This representation of important natural characteristics increased the applicability of simulated results to real-world settings, while the control and repeatability of burn and rainfall treatments facilitated attribution of responses to drivers. The wildfire simulator’s driving mechanism (duration of heating applied) was strongly correlated with peak temperature, allowing for control over burn intensity achieved for each sample. Spatially heterogeneous combustion residue also reflected variable burn patterns in natural settings, resulting in complex flow paths interrupted by a mosaic of less-disturbed vegetation and soil. The rainfall simulator achieved rainfall intensities typical for the FEF with droplet size and kinetic energies targeting natural ranges. The mechanics of naturally occurring splash erosion, as well as its role in sediment transportation, was subsequently at least partially captured. Detailed quantification of precipitation distribution, as well as control over its timing, additionally allowed for application of specific precipitation amounts.
Key insights
The simulated hydrologic and water quality responses highlight the distinct impacts of specific burn intensities on soil physical and chemical properties. Where most previous studies have focused on hydrologic and water quality differences between ‘burned’ and ‘unburned’ settings (Smith et al. 2011), the more granular burn treatments in this study revealed nuanced differences between intensities. Evident from observed responses, higher temperatures generally appeared to exacerbate driving mechanisms of runoff, sediment, nutrients: soil structural degradation, release of carbon and nutrients, and increased hydrophobicity of lower soil layers. Runoff ratios increased linearly with increasing burn intensity, suggesting that greater melting and redistribution of waxes and organic material at higher temperatures induced greater soil water repellency (Robichaud and Hungerford 2000; Badía-Villas et al. 2014). Sedimentation similarly increased with increasing burn intensities, potentially a result of greater soil and vegetation combustion loosening top layers of soil and depositing greater amounts of ash (Shahlaee et al. 1991; Lane et al. 2006; Larsen and MacDonald 2007; Moody and Martin 2009a). The highest turbidities were also observed at high burn intensities, likely due to similar mechanics (Hohner et al. 2016; Becker et al. 2018).
DOC and TDN, however, exhibited peak responses at moderate burn intensities. From low to moderate burn intensities, increases in DOC and TDN were likely due to their release from combusted soil, as well as increased solubility from heating effects. At more extreme temperatures and heating durations, DOC and TDN were likely volatilised, leading to a reduction in their concentration at high burn intensities. This reinforced findings from Hohner et al. (2019b), where concentrations of DOM similarly peaked at moderate burn temperatures.
High variability in runoff, sediment, and turbidity observations reinforces the complex influence of hydrologic and erosional mechanisms in post-fire responses. A wide range of runoff and sedimentation responses have been observed across previous studies, from little to no change up to 870 and 1500 times pre-fire levels, respectively (Moody and Martin 2001b; Smith et al. 2011; Bladon et al. 2014). This is typically attributed to different vegetation and soil characteristics producing variable ash deposition and soil hydrophobicity patterns, which subsequently drive key splash erosion, precipitation storage, and streamlet connectivity mechanisms (Balfour and Woods 2008; Kampf et al. 2016; Ebel and Moody 2017; Larson-Nash et al. 2018; Stavi 2019). As soil, vegetation, burn, and precipitation characteristics were kept consistent across replicate samples, variable combustion patterns and flow paths in this study seemed to be the result of vegetation coverage patterns and soil geometry. These minimal differences between samples were enough to produce highly variable runoff and sedimentation response, highlighting the significant effects of even small differences in hydrologic mechanisms.
Experimental limitations
Inconsistencies in sample testing methods, pooling and unintended flow paths in the rainfall simulator setup, and differences in simulated drivers from the natural environment contributed uncertainty to results, evident from anomalous responses. Where lower sediment response from unburned samples was expected (Moody and Martin 2009b), median SSC was 26% greater for unburned than burned samples – potentially due to greater disturbance via additional handling of burned samples. While unburned samples were never removed from the lab, burned samples were disturbed during transportation to an outdoor testing area, exposed to light winds, and inserted with thermocouples which disturbed soil structure. Significant mass loss as high as 15% occurred during this step, some of which may be attributed to volatilisation of vegetation and soils, but also due to soil loss from greater handling and disturbance.
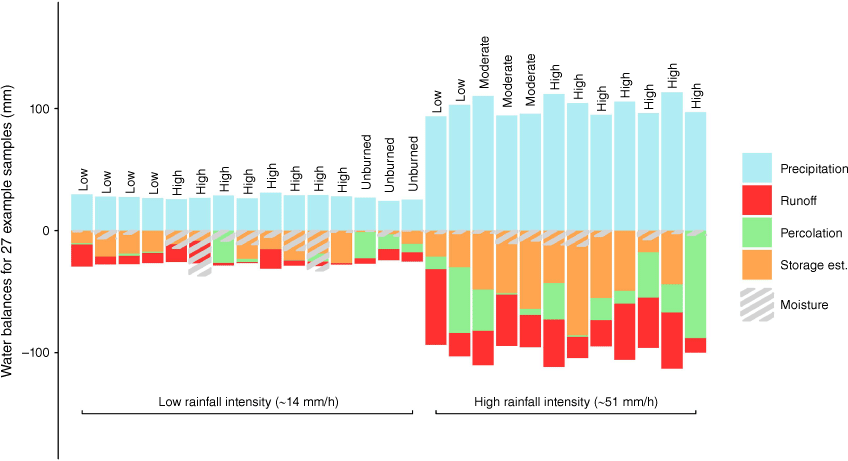
Differences between estimated water storage and change in soil moisture may be suggestive of trapped water and unaccounted flow paths in the system. As shown in Fig. 11, storage estimates were calculated for a subset of samples assuming a closed water balance with no losses. However, these values were largely different from storage estimated from changes in soil moisture in each sample, with a median ~15-mm difference across samples. Water may have been trapped in the custom funnels, blocked by sediment in the tubing system, or flowed laterally over the sides of samples. Sediment trapping was also evident from a 44% decrease in median TSS from the 20° to 30° slope angle, potentially due to increased sediment settling in the corners of the custom funnels at higher angles.
A composite bar graph of water budget components for several soil samples, showing water applied to samples through precipitation, as well as subsequent runoff, percolation, and estimated storage in units of mm (coloured bars). Overlaid is the change in soil moisture, which should approximate estimated storage (grey hatches).
Responses also lacked the full range of natural variability due to dissimilarities in the simulated system from natural settings. The small scale of the soil samples limited observable hydrologic and sedimentation processes which occur in wildfire-affected basins. On hillslope and basin-scales, burn effects can greatly enhance fluvial erosion, i.e. the formation of rills and gullies that expand channel networks, due to loss of vegetative ground and canopy cover and root structure (Kampf et al. 2016; Robichaud et al. 2016; Larson-Nash et al. 2018). Though these larger-scale erosional processes greatly contribute to post-wildfire sedimentation rates, they were not represented in the small samples tested due to lack of streamlet connectivity and insufficient sample length. Only diffusive sedimentation driven by rain splash and accumulated ash and burned soils occurred at the small-scale, as well as hydrologic effects caused by increased soil water repellency. Additionally, while the tap water used to simulate precipitation was generally similar to local rainfall in terms of DOC, TDN, and pH levels, other important water quality characteristics were not assessed. Water temperature, alkalinity, and turbidity, for example, can impact suspended sediment, organic matter, and nutrient levels (Downing et al. 2012; Kerr et al. 2021), and differences in these characteristics may have altered runoff transportation mechanisms as compared to natural settings. Experimental limitations are discussed further in Supplementary material C.
Conclusion
The experimental framework and design in this study captured key mechanisms associated with wildfire, rainfall, and terrain slope drivers, deriving insights about their effects on hydrologic and water quality responses. The simulation equipment precisely controlled driver intensities, allowing for repeatable and quantifiable treatments at ranges representative of natural settings. Future researchers may be able to leverage this study’s experimental design and validation testing to optimise components for their own simulation studies. Additionally, the distinct effects of varying burn intensity increments were uniquely highlighted in this study. Simulated responses generally showed significant increases with greater burn intensities, similar to findings in previous studies. However, while runoff and SSC increased monotonically with increasing burn intensity, DOM and TDN peaked at moderate burn severities, likely due to volatilisation at higher temperatures.
This research provides further understanding of wildfire-affected environments as complex systems with a multitude of interacting processes and high spatial variability. Natural systems have highly varying vegetation regimes, terrain, soil types, and climates, across different regions and timespans. This study highlights how wildfires interact with each of these in different ways, combusting and intensifying to produce distinct impacts. Our findings emphasise the need for assessing an area beyond ‘burned’ and ‘unburned’ categories, instead analysing the mosaic of burn intensities and their effects on core hydrologic mechanisms. These contributions to the field of wildfire effects on water quality and supply can ultimately inform water managers’ preparation and mitigation efforts, which will become increasingly important in the coming years.
Data availability
The data that support this study are available in Zenodo at 10.5281/zenodo.7799976 (Brucker et al. 2023).
Declaration of funding
This work is supported by funding through the US Environmental Protection Agency; the Cooperative Institute for Research in Environmental Sciences (CIRES) Graduate Student Research Award, part of the NOAA Cooperative Agreement with CIRES, Grant # NA17OAR4320101; the 2020 CIRES Innovative Research Program; and the Western Water Assessment NOAA Grant # NA21OAR4310309, ‘Western Water Assessment: Building Resilience to Compound Hazards in the Inter-Mountain West’. These supporting sources had involvement in neither the preparation of data and manuscript, nor the decision to publish this manuscript.
Acknowledgements
The authors acknowledge the contributions of Cole Pragides, Abbey Turner, Rollin Jones, Yuexuan Meng, Alex Brunson, and Casey Bangs in their assistance in collecting soil samples, performing lab simulations, and completing water quality analyses. We also acknowledge the contributions of Stefan Petersen and Paul Wilkerson in advising and troubleshooting the water quality analyses. Finally, we acknowledge the contributions of Aaron Heldmyer and Ariel Retuta in designing and constructing the initial rainfall simulator frame and plumbing system. This manuscript forms part of Carli Brucker’s 2023 PhD thesis.
References
Abraham J, Dowling K, Florentine S (2017) Risk of post-fire metal mobilization into surface water resources: a review. Science of The Total Environment 599–600, 1740-1755.
| Crossref | Google Scholar | PubMed |
Alstatt D, Miles RL (1983) ‘Soil survey of Grand County area, Colorado.’ (The Service) Available at https://scholar.google.com/scholar_lookup?title=Soil+survey+of+Grand+County+area%2C+Colorado&author=Alstatt%2C+David&publication_year=1983
Badía-Villas D, González-Pérez JA, Aznar JM, Arjona-Gracia B, Martí-Dalmau C (2014) Changes in water repellency, aggregation and organic matter of a mollic horizon burned in laboratory: soil depth affected by fire. Geoderma 213, 400-407.
| Crossref | Google Scholar |
Balfour V, Woods S (2008) Causes of variability in the effects of vegetative ash on post-fire runoff and erosion. AGU Fall Meeting Abstracts 11, H11C-0778.
| Google Scholar |
Becker WC, Hohner A, Rosario‐Ortiz F, DeWolfe J (2018) Preparing for wildfires and extreme weather: plant design and operation recommendations. Journal: American Water Works Association 110, 32-40.
| Crossref | Google Scholar |
Bladon KD, Emelko MB, Silins U, Stone M (2014) Wildfire and the future of water supply. Environmental Science & Technology 48, 8936-8943.
| Crossref | Google Scholar | PubMed |
Blank RR, Allen F, Young JA (1994) Extractable anions in soils following wildfire in a sagebrush-grass community. Soil Science Society of America Journal 58, 564-570.
| Crossref | Google Scholar |
Bright CE, Mager SM (2020) A national-scale study of spatial variability in the relationship between turbidity and suspended sediment concentration and sediment properties. River Research and Applications 36, 1449-1459.
| Crossref | Google Scholar |
Brogan DJ, Nelson PA, MacDonald LH (2017) Reconstructing extreme post-wildfire floods: a comparison of convective and mesoscale events. Earth Surface Processes and Landforms 42, 2505-2522.
| Crossref | Google Scholar |
Brucker CP (2023) ‘Assessment of Basin Vulnerability to Post-Wildfire Hydrologic and Water Quality Effects Through a Multi-Scale Framework.’ (University of Colorado Boulder: Boulder, CO, USA) Available at https://scholar.colorado.edu/concern/graduate_thesis_or_dissertations/cv43nz221
Brucker CP, Livneh B, Minear JT, Rosario-Ortiz FL (2022) A review of simulation experiment techniques used to analyze wildfire effects on water quality and supply. Environmental Science: Processes & Impacts 24, 1110-1132.
| Crossref | Google Scholar | PubMed |
Brucker C, Livneh B, Butler C, Rosario-Ortiz F (2023) A laboratory-scale simulation framework for analyzing wildfire hydrologic and water quality effects. 10.5281/zenodo.7799976
Busse MD, Hubbert KR, Fiddler GO, Shestak CJ, Powers RF, Busse MD, Hubbert KR, Fiddler GO, Shestak CJ, Powers RF (2005) Lethal soil temperatures during burning of masticated forest residues. International Journal of Wildland Fire 14, 267-276.
| Crossref | Google Scholar |
Busse MD, Shestak CJ, Hubbert KR, Knapp EE (2010) Soil physical properties regulate lethal heating during burning of woody residues. Soil Science Society of America Journal 74, 947-955.
| Crossref | Google Scholar |
Cancelo-González J, Barros N, Rial-Rivas ME, Díaz-Fierros F (2012) Assessment of the impact of soil heating on soil cations using the degree-hours method. Spanish Journal of Soil Science 2, 32-41.
| Crossref | Google Scholar |
Cancelo-González J, Rial-Rivas ME, Díaz-Fierros F (2013) Effects of fire on cation content in water: a laboratory simulation study. International Journal of Wildland Fire 22, 667-680.
| Crossref | Google Scholar |
Cawley KM, Hohner AK, Podgorski DC, Cooper WT, Korak JA, Rosario-Ortiz FL (2017) Molecular and spectroscopic characterization of water extractable organic matter from thermally altered soils reveal insight into disinfection byproduct precursors. Environmental Science & Technology 51, 771-779.
| Crossref | Google Scholar | PubMed |
Cotrufo MF, Boot CM, Kampf S, Nelson PA, Brogan DJ, Covino T, Haddix ML, MacDonald LH, Rathburn S, Ryan‐Bukett S, Schmeer S, Hall E (2016) Redistribution of pyrogenic carbon from hillslopes to stream corridors following a large montane wildfire. Global Biogeochemical Cycles 30, 1348-1355.
| Crossref | Google Scholar |
Doerr SH, Shakesby RA, Blake WH, Chafer CJ, Humphreys GS, Wallbrink PJ (2006) Effects of differing wildfire severities on soil wettability and implications for hydrological response. Journal of Hydrology 319, 295-311.
| Crossref | Google Scholar |
Downing BD, Pellerin BA, Bergamaschi BA, Saraceno JF, Kraus TEC (2012) Seeing the light: the effects of particles, dissolved materials, and temperature on in situ measurements of DOM fluorescence in rivers and streams. Limnology and Oceanography: Methods 10, 767-775.
| Crossref | Google Scholar |
Ebel BA, Moody JA (2017) Synthesis of soil-hydraulic properties and infiltration timescales in wildfire-affected soils. Hydrological Processes 31, 324-340.
| Crossref | Google Scholar |
Ebel BA, Moody JA, Martin DA (2012) Hydrologic conditions controlling runoff generation immediately after wildfire. Water Resources Research 48, W03529.
| Crossref | Google Scholar |
Emmerich WE, Cox JR (1992) Hydrologic characteristics immediately after seasonal burning on introduced and native grasslands. Rangeland Ecology & Management/Journal of Range Management Archives 45, 476-479.
| Google Scholar |
Essery R, Rutter N, Pomeroy J, Baxter R, Stähli M, Gustafsson D, Barr A, Bartlett P, Elder K (2009) SNOWMIP2: an evaluation of forest snow process simulations. Bulletin of the American Meteorological Society 90, 1120-1136.
| Crossref | Google Scholar |
García-Gaines RA, Frankenstein S (2015) USCS and the USDA Soil Classification System: Development of a mapping scheme. Report. (Cold Regions Research and Engineering Laboratory (U.S.)) Available at https://erdc-library.erdc.dren.mil/jspui/handle/11681/5485
Hemenway J, USDA NRCS South Dakota (2017) Rainfall Simulator: How to Properly Collect and Store Large Soil Samples. Available at https://www.youtube.com/watch?v=f4zZvdEEUJQ&t=157s
Hester JW, Thurow TL, Taylor CA (1997) Hydrologic characteristics of vegetation types as affected by prescribed burning. Journal of Range Management 50, 199-204.
| Google Scholar |
Hogue BA, Inglett PW (2012) Nutrient release from combustion residues of two contrasting herbaceous vegetation types. Science of The Total Environment 431, 9-19.
| Crossref | Google Scholar | PubMed |
Hohner AK, Cawley K, Oropeza J, Summers RS, Rosario-Ortiz FL (2016) Drinking water treatment response following a Colorado wildfire. Water Research 105, 187-198.
| Crossref | Google Scholar | PubMed |
Hohner AK, Rhoades CC, Wilkerson P, Rosario-Ortiz FL (2019a) Wildfires alter forest watersheds and threaten drinking water quality. Accounts of Chemical Research 52, 1234-1244.
| Crossref | Google Scholar | PubMed |
Hohner AK, Summers RS, Rosario‐Ortiz FL (2019b) Laboratory simulation of postfire effects on conventional drinking water treatment and disinfection byproduct formation. AWWA Water Science 1, e1155.
| Crossref | Google Scholar |
Jian M, Berli M, Ghezzehei TA (2018) Soil structural degradation during low-severity burns. Geophysical Research Letters 45, 5553-5561.
| Crossref | Google Scholar |
Johansen MP, Hakonson TE, Breshears DD (2001) Post-fire runoff and erosion from rainfall simulation: contrasting forests with shrublands and grasslands. Hydrological Processes 15, 2953-2965.
| Crossref | Google Scholar |
Kampf SK, Brogan DJ, Schmeer S, MacDonald LH, Nelson PA (2016) How do geomorphic effects of rainfall vary with storm type and spatial scale in a post-fire landscape. Geomorphology 273, 39-51.
| Crossref | Google Scholar |
Keesstra SD, Maroulis J, Argaman E, Voogt A, Wittenberg L (2014) Effects of controlled fire on hydrology and erosion under simulated rainfall. Cuadernos de Investigación Geográfica 40, 269-294.
| Crossref | Google Scholar |
Kerr DE, Brown PJ, Grey A, Kelleher BP (2021) The influence of organic alkalinity on the carbonate system in coastal waters. Marine Chemistry 237, 104050.
| Crossref | Google Scholar |
Kibet LC, Saporito LS, Allen AL, May EB, Kleinman PJ, Hashem FM, Bryant RB (2014) A protocol for conducting rainfall simulation to study soil runoff. Journal of Visualized Experiments 86, e51664.
| Crossref | Google Scholar | PubMed |
Klopatek CC, Debano LF, Klopatek JM (1988) Effects of simulated fire on vesicular-arbuscular mycorrhizae in pinyon-juniper woodland soil. Plant and Soil 109, 245-249.
| Crossref | Google Scholar |
Knight RW, Blackburn WH, Scifres CJ (1983) Infiltration rates and sediment production following herbicide/fire brush treatments. Journal of Range Management 36, 154-157.
| Crossref | Google Scholar |
Kral KC, Limb RF, Hovick TJ, McGranahan DA, Field AL, O’Brien PL (2015) Simulating grassland prescribed fires using experimental approaches. Fire Ecology 11, 34-44.
| Crossref | Google Scholar |
Lane PNJ, Sheridan GJ, Noske PJ (2006) Changes in sediment loads and discharge from small mountain catchments following wildfire in south eastern Australia. Journal of Hydrology 331, 495-510.
| Crossref | Google Scholar |
Larsen IJ, MacDonald LH (2007) Predicting postfire sediment yields at the hillslope scale: testing RUSLE and Disturbed WEPP. Water Resources Research 43, W11412.
| Crossref | Google Scholar |
Larson-Nash SS, Robichaud PR, Pierson FB, Moffet CA, Williams CJ, Spaeth KE, Brown RE, Lewis SA (2018) Recovery of small-scale infiltration and erosion after wildfires. Journal of Hydrology and Hydromechanics 66, 261-270.
| Crossref | Google Scholar |
Lawrence RL (2020) ‘Addressing constraints to restoration of highly disturbed ecosystems affected by cheatgrass invasion and slash pile burning’. Text. (Colorado State University: CO, USA) Available at https://mountainscholar.org/handle/10217/232551
Marcos E, Tarrega R, Luis-Calabuig E (2000) Comparative analysis of Runo and sediment yield with a rainfall simulator after experimental fire. Arid Soil Research and Rehabilitation 14, 293-307.
| Crossref | Google Scholar |
Marlon JR, Bartlein PJ, Walsh MK, Harrison SP, Brown KJ, Edwards ME, Higuera PE, Power MJ, Anderson RS, Briles C, Brunelle A, Carcaillet C, Daniels M, Hu FS, Lavoie M, Long C, Minckley T, Richard PJ, Scott AC, Shafer DS, Tinner W, Umbanhowar CE, Jr, Whitlock C (2009) Wildfire responses to abrupt climate change in North America. Proceedings of the National Academy of Sciences 106, 2519-2524.
| Crossref | Google Scholar | PubMed |
Moody JA, Martin DA (2001a) Post-fire, rainfall intensity–peak discharge relations for three mountainous watersheds in the western USA. Hydrological Processes 15, 2981-2993.
| Crossref | Google Scholar |
Moody JA, Martin DA (2001b) Initial hydrologic and geomorphic response following a wildfire in the Colorado Front Range. Earth Surface Processes and Landforms 26, 1049-1070.
| Crossref | Google Scholar |
Moody JA, Martin DA (2009a) Synthesis of sediment yields after wildland fire in different rainfall regimes in the western United States. International Journal of Wildland Fire 18, 96-115.
| Crossref | Google Scholar |
Moody JA, Martin DA (2009b) Synthesis of sediment yields after wildland fire in different rainfall regimes in the western United States. International Journal of Wildland Fire 18, 96-115.
| Crossref | Google Scholar |
Murphy SF, Writer JH, McCleskey RB, Martin DA (2015) The role of precipitation type, intensity, and spatial distribution in source water quality after wildfire. Environmental Research Letters 10, 084007.
| Crossref | Google Scholar |
Neary DG, Ryan KC, DeBano LF (2005) ‘Wildland fire in ecosystems: effects of fire on soils and water’. RMRS-GTR-42-V4. (U.S. Department of Agriculture, Forest Service, Rocky Mountain Research Station: Ft. Collins, CO) 10.2737/RMRS-GTR-42-V4
Park RM (2010) Thermocouple fundamentals. Course Tech, Temp 2–1. (Marlin Manufacturing Corporation) Available at https://www.aschome.com/administrator/images/support/pdf/1347065903.pdf
Precipitation Frequency Data Server (2017) NOAA’s National Weather Service Hydrometeorological Design Studies Center. Available at https://hdsc.nws.noaa.gov/hdsc/pfds/
Raseman WJ, Kasprzyk JR, Rosario-Ortiz FL, Stewart JR, Livneh B (2017) Emerging investigators series: a critical review of decision support systems for water treatment: making the case for incorporating climate change and climate extremes. Environmental Science: Water Research & Technology 3, 18-36.
| Crossref | Google Scholar |
Reardon J, Hungerford R, Ryan K (2007) Factors affecting sustained smouldering in organic soils from pocosin and pond pine woodland wetlands. International Journal of Wildland Fire 16, 107-118.
| Crossref | Google Scholar |
Rhoades CC, Entwistle D, Butler D (2011) The influence of wildfire extent and severity on streamwater chemistry, sediment and temperature following the Hayman Fire, Colorado. International Journal of Wildland Fire 20, 430-442.
| Crossref | Google Scholar |
Rhoades CC, Hubbard RM, Elder K (2017) A decade of streamwater nitrogen and forest dynamics after a mountain pine beetle outbreak at the Fraser Experimental Forest, Colorado. Ecosystems 20, 380-392.
| Crossref | Google Scholar |
Rhoades CC, Chow AT, Covino TP, Fegel TS, Pierson DN, Rhea AE (2019a) The legacy of a severe wildfire on stream nitrogen and carbon in headwater catchments. Ecosystems 22, 643-657.
| Crossref | Google Scholar |
Rhoades CC, Nunes JP, Silins U, Doerr SH, Rhoades CC, Nunes JP, Silins U, Doerr SH (2019b) The influence of wildfire on water quality and watershed processes: new insights and remaining challenges. International Journal of Wildland Fire 28, 721-725.
| Crossref | Google Scholar |
Robichaud PR (2005) Measurement of post-fire hillslope erosion to evaluate and model rehabilitation treatment effectiveness and recovery. International Journal of Wildland Fire 14, 475-485.
| Crossref | Google Scholar |
Robichaud PR, Hungerford RD (2000) Water repellency by laboratory burning of four northern Rocky Mountain forest soils. Journal of Hydrology 231–232, 207-219.
| Crossref | Google Scholar |
Robichaud PR, Waldrop TA (1994) A comparison of surface runoff and sediment yields from low- and high-severity site preparation burns. JAWRA Journal of the American Water Resources Association 30, 27-34.
| Crossref | Google Scholar |
Robichaud PR, Wagenbrenner JW, Pierson FB, Spaeth KE, Ashmun LE, Moffet CA (2016) Infiltration and interrill erosion rates after a wildfire in western Montana, USA. CATENA 142, 77-88.
| Crossref | Google Scholar |
Roundy BA, Blackburn WH, Eckert RE (1978) Influence of prescribed burning on infiltration and sediment production in the Pinyon-Juniper Woodland, Nevada. Journal of Range Management 31, 250-253.
| Google Scholar |
Rust AJ, Hogue TS, Saxe S, McCray J, Rust AJ, Hogue TS, Saxe S, McCray J (2018) Post-fire water-quality response in the western United States. International Journal of Wildland Fire 27, 203-216.
| Crossref | Google Scholar |
Shahlaee AK, Nutter WL, Burroughs ER, Morris LA (1991) Runoff and sediment production from burned forest sites in the Georgia Piedmont. JAWRA Journal of the American Water Resources Association 27, 485-493.
| Crossref | Google Scholar |
Smith HG, Sheridan GJ, Lane PNJ, Nyman P, Haydon S (2011) Wildfire effects on water quality in forest catchments: a review with implications for water supply. Journal of Hydrology 396, 170-192.
| Crossref | Google Scholar |
Sommerfeld A, Senf C, Buma B, D’Amato AW, Després T, Díaz-Hormazábal I, Fraver S, Frelich LE, Gutiérrez ÁG, Hart SJ, Harvey BJ, He HS, Hlásny T, Holz A, Kitzberger T, Kulakowski D, Lindenmayer D, Mori AS, Müller J, Paritsis J, Perry GLW, Stephens SL, Svoboda M, Turner MG, Veblen TT, Seidl R (2018) Patterns and drivers of recent disturbances across the temperate forest biome. Nature Communications 9, 4355.
| Crossref | Google Scholar | PubMed |
Spencer CN, Gabel KO, Hauer FR (2003) Wildfire effects on stream food webs and nutrient dynamics in Glacier National Park, USA. Forest Ecology and Management 178, 141-153.
| Crossref | Google Scholar |
Spracklen DV, Mickley LJ, Logan JA, Hudman RC, Yevich R, Flannigan MD, Westerling AL (2009) Impacts of climate change from 2000 to 2050 on wildfire activity and carbonaceous aerosol concentrations in the western United States. Journal of Geophysical Research: Atmospheres 114, D20301.
| Crossref | Google Scholar |
Staley DM, Kean JW (2020) Emergency Assessment of Post-Fire Debris-Flow Hazards. USGS Landslide Hazards Program Williams Fork (Arapaho and Roosevelt National Forests, CO) Available at https://landslides.usgs.gov/hazards/postfire_debrisflow/detail.php?objectid=298
Stavi I (2019) Wildfires in grasslands and shrublands: a review of impacts on vegetation, soil, hydrology, and geomorphology. Water 11, 1042.
| Crossref | Google Scholar |
Stoof CR, Wesseling JG, Ritsema CJ (2010) Effects of fire and ash on soil water retention. Geoderma 159, 276-285.
| Crossref | Google Scholar |
Stoof CR, De Kort A, Bishop TFA, Moore D, Wesseling JG, Ritsema CJ (2011) How rock fragments and moisture affect soil temperatures during fire. Soil Science Society of America Journal 75, 1133-1143.
| Crossref | Google Scholar |
Tossell R, Dickinson W, Rudra R, Wall G (1987) A portable rainfall simulator. Canadian Agricultural Engineering 29, 155-162.
| Google Scholar |
Ulbrich CW (1983) Natural variations in the analytical form of the raindrop size distribution. Journal of Applied Meteorology and Climatology 22, 1764-1775.
| Crossref | Google Scholar |
Wang J-J, Dahlgren RA, Erşan MS, Karanfil T, Chow AT (2015) Wildfire altering terrestrial precursors of disinfection byproducts in forest detritus. Environmental Science & Technology 49, 5921-5929.
| Crossref | Google Scholar | PubMed |
Wei H, Thompson R, Park C, Chen P (2010) Surface tension of high density polyethylene (HDPE) in supercritical nitrogen: effect of polymer crystallization. Colloids and Surfaces A: Physicochemical and Engineering Aspects 354, 347-352.
| Crossref | Google Scholar |
Wieting C, Ebel BA, Singha K (2017) Quantifying the effects of wildfire on changes in soil properties by surface burning of soils from the Boulder Creek Critical Zone Observatory. Journal of Hydrology: Regional Studies 13, 43-57.
| Crossref | Google Scholar |
Wilkerson PJ, Rosario‐Ortiz FL (2021) Impact of simulated wildfire on disinfection byproduct formation potential. AWWA Water Science 3, e1217.
| Crossref | Google Scholar |
Writer JH, Hohner A, Oropeza J, Schmidt A, Cawley KM, Rosario-Ortiz FL (2014) Water treatment implications after the High Park Wildfire, Colorado. Journal - American Water Works Association 106, E189-E199.
| Crossref | Google Scholar |
Yonter G, Houndonougbo HM (2022) Comparison of different fulljet nozzles used in laboratory type rain simulator in terms of some rainfall characteristics. Ege Üniversitesi Ziraat Fakültesi Dergisi 59, 33-41.
| Crossref | Google Scholar |


