Laboratory benchmark of low-cost portable gas and particle analysers at the source of smouldering wildfires
Wuquan Cui A , Simona Dossi
  A and Guillermo Rein
  A *
A *
A
Abstract
Smouldering wildfires emit large amounts of carbon, toxic gases and particulate matter (PM), posing health and environmental hazards. It is challenging to conduct field measurements on wildfire emissions, and available instruments are limited by high cost and low mobility.
Here, we contribute to solving this challenge by studying three commercial low-cost and portable air quality analysers (KANE101, SDS011 and FLOW) and comparing them with research-grade instruments (FTIR, PM Cascade Impactor and DustTrak).
A series of laboratory experiments on peat smouldering were conducted including the stages of ignition, spread and burnout to provide conditions of emission measurements near the source.
The gas analyser KANE101 accurately measured CO2 and allowed calculation of modified combustion efficiency (MCE). The FLOW air pollution sensor was found unsuitable for PM measurements near fire sources because of its narrow range. FLOW captured the variation of volatile organic compounds (VOCs), but measurements did not correlate well with NO2 measurements. The SDS011 PM sensor responded well in measuring PM10 in this study.
KANE101 and SDS011 can be used in the field after calibration to measure CO2/CO and PM.
This work provides a better understanding of how low-cost and portable emission sensors can be of use for wildfire measurements in the field.
Keywords: air quality, analysers, health, particulate matter, peat fire emissions, peatland, pollution, smouldering, toxic gases, wildfire.
Introduction
Smouldering wildfires have been identified as the primary contributors to regional haze episodes, in which the release of gases and particles has been observed to have severe and extensive effects on human health (Koplitz et al. 2016; Hu et al. 2018). For example, the 1997 haze crisis in southeast Asia involved an extensive area of approximately 45 600 km2 of peatland burning for months, resulting in unparalleled haze pollution affecting a population of approximately 100 million individuals across five nations (Heil and Goldammer 2001). In addition to smouldering peat fires, post-flame residue burning associated with nearly all wildland fires plays a significant role in the deterioration of air quality (Rein and Huang 2021). Fig. 1 shows smouldering transition from flaming behind the flame front as the source of smoke spreading to urban areas in a wildfire situation. Unlike flaming wildfires, which generate strongly buoyant plumes characterised by dark smoke containing abundant soot, smouldering wildfires emit less buoyant plumes with light smoke that remains at low altitudes while traversing long distances (Hu et al. 2018). During the process of smoke dispersion, the concentrations of emitted pollutants are highest at the fire source and gradually decrease with distance as a result of air entrainment. While ambient measurements in affected urban areas primarily address the impact on residents’ health, the challenges and importance of measuring emissions at the fire source require attention for a comprehensive understanding of the adverse effects caused by wildfires. This article focuses on emission measurement at the source of smouldering wildfires, highlighting peatland fires as a representative example.
Watercolour (painted for this article by artist Cecily Liu) demonstrating the spread of wildfire smoke from wildland to urban areas. Residue smouldering becomes the main source of smoke after the flaming front moves away. The concentration of smoke is high near the fire source and decreases with distance because of air entrainment.

Peatlands cover nearly 3% of the Earth’s land surface and store more than 25% of terrestrial carbon (Yu 2012). They have critical roles in supporting the Earth ecosystem and preserving carbon pools formed over centuries to millennia, but are now under additional threats of wildfire owing to human activities and climate change (Page et al. 2011; Turetsky et al. 2014; Walker et al. 2019). Peatland fires are dominated by smouldering combustion, the slow low-temperature and flameless burning of porous fuels, which leads to the largest fires on Earth in terms of fuel consumption (Rein 2013). This type of wildfire can persist for months when the peat is dry, and is very difficult to suppress (Lin et al. 2020; Santoso et al. 2021).
The emission gases from peatland wildfires are a complex mixture of more than 90 detectable gas species (Stockwell et al. 2016), including carbon dioxide (CO2), carbon monoxide (CO), methane (CH4), ammonia (NH3) and toxic gases such as some volatile organic compounds (VOCs), nitric oxide (NOx) and hydrogen cyanide (HCN). Their carbon emissions create a positive feedback to climate change (Page et al. 2002), and in addition, some emitted gases have direct impact on human health: for example, some VOCs have been classified as carcinogenic to humans (Muraleedharan et al. 2000; George et al. 2016). Another important pollutant from peatland wildfires is particulate matter (PM), featuring in high concentrations that constitute substantial health risks to local populations (Kiely et al. 2020), predominantly to the respiratory and cardiovascular systems (Burnett et al. 2018). Previous research showed that smouldering peatland wildfires emit a substantial amount of fine (aerodynamic diameter ≤2.5 µm) and ultrafine (aerodynamic diameter ≤0.1 µm) particles than forest fires, which can reach deeper parts of the human respiratory system (Emmanuel 2000; Hu et al. 2019a).
The adverse effects of peatland wildfire emissions on human health, the local environment and economy, and climate have increasingly raised concerns over the past decade (Reid et al. 2005; Turetsky et al. 2011; Rein and Huang 2021). Fig. 2 summarises the information from 27 literature reports of the past 20 years of studying peatland wildfire emissions in the laboratory or field. Studies with field measurements quantifying peatland wildfire emissions are scarce in this emerging topic, mainly because of challenging situations in the field and the limitations of instruments in cost and mobility. Field experiments measure emissions directly, so they provide the most representative data but unfortunately also have a higher level of uncertainty; laboratory experiments provide higher certainty in terms of variables controlled to study fundamental understanding and test hypotheses formulated from field observations (Christensen et al. 2018). Both field and laboratory studies in peat fires are vital in understanding wildfires.
Alluvial diagram summarising the instruments used in 27 reviewed literature studies of emissions from peat fires. The measurement of gases only includes the most commonly reported gases. The defintions of abbreviations for instruments are: LAFTIR, land-based FTIR spectroscopy; OP-FTIR, open-path FTIR spectroscopy; IR, IR-based gas measurement system; NDIR, non-dispersive IR detector; LAS, laser absorption spectroscopy; PTR-MS, proton transfer reaction mass spectroscopy; CLA, chemiluminescence analyser; GC-FID, gas chromatograph with flame ionisation detector; ECS, electrochemical sensor; WAS, whole air sampling (air sampled in the field and analysed in the lab); LS (DustTrak), light-scattering-based device DustTrak; LSS, light scattering sensor; SMPS, scanning mobility particle sizer.
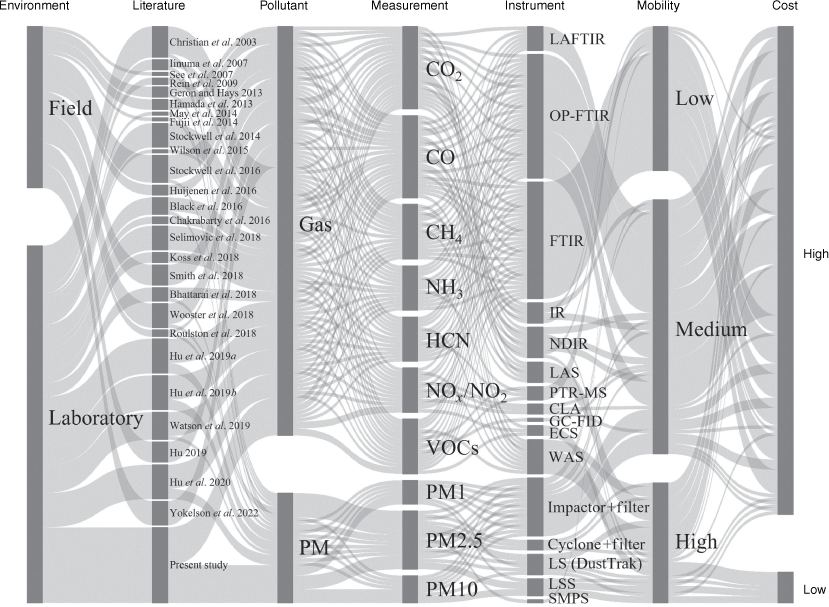
We define low-cost devices to be within the range of general smartphone cost (<£600), high-mobility devices as able to be hand-held, medium mobility as portable in the field although requiring more effort (e.g. bigger power supply and more components compared with handheld devices), and low-mobility instruments as requiring set-ups in the laboratory and not practical to be used in the field because of fragility and necessary extra systems. Fig. 2 shows the higher accuracy and reliability research grade instruments used in laboratory studies are always of substantially higher cost and mostly of low or medium mobility.
The following studies of laboratory peat fire emissions are part of Fig. 2. From review of these studies, Fourier-transform infrared (FTIR) spectroscopy is the most commonly used technique for measuring gas emissions (Hu et al. 2019a, 2019b; Watson et al. 2019; Hu et al. 2020). The basic principle of FTIR spectroscopy uses IR radiation passing through the sampling gas to produce spectrums that show unique molecular absorptions and transmissions (Smith 2013). Comparing the infrared spectrums measured in experiments with the reference spectrums of gases under the same conditions of temperature and pressure, the concentrations of gases can be obtained. Some laboratory studies use open-path FTIR spectroscopy (OP-FTIR), which operates on the same principle as FTIR but is designed for field measurements (Christian et al. 2003; Stockwell et al. 2014; Selimovic et al. 2018). IR or NDIR (non-dispersive IR)-based gas measurement devices are often used and adequate accuracy was reported after calibration in measuring CO2 and CO only (Iinuma et al. 2007; Rein et al. 2009; Geron and Hays 2013; Wilson et al. 2015; Black et al. 2016; Chakrabarty et al. 2016; Bhattarai et al. 2018). There are some more specialised instruments and techniques applied in peat fire emission measurements for the gas species VOCs, HCN, NH3, and NOx/NO: for example, proton transfer reaction mass spectroscopy (PTR-MS) (Christian et al. 2003; Koss et al. 2018), chemiluminescence analysers (CLAs) (Black et al. 2016; Bhattarai et al. 2018; Watson et al. 2019) and gas chromatographs with flame ionisation detector (GC-FID) (Black et al. 2016). In laboratory PM emission studies, filter-based and signal-based instruments are dominant, for example, filter-based PM cyclones or impactors (Christian et al. 2003; Iinuma et al. 2007; May et al. 2014; Black et al. 2016; Hu et al. 2019a, 2019b, 2020), the light scattering device DustTrak (Watson et al. 2019) and scanning mobility particle sizers (SMPSs) (Bhattarai et al. 2018).
For field gas emission measurements of peat fires, the FTIR-based spectroscopy field version (for example, OP-FTIR or land-based FTIR spectroscopy (LAFTIR)) is a commonly used research-grade instrument that can measure a great variety of emission gases simultaneously (Stockwell et al. 2016; Smith et al. 2018; Wooster et al. 2018; Hu 2019). There are IR-based and laser-absorption-based gas analysers developed for field measurements that are portable but measure a smaller variety of gases by focusing on the most abundant, CO2 and CO (Geron and Hays 2013; Huijnen et al. 2016; Roulston et al. 2018; Wooster et al. 2018). Whole air sampling (WAS) is also a commonly used method of field measurement consisting of sampling air into bags in the field before analysing it in the lab (Hamada et al. 2013; Yokelson et al. 2022). For field particle emission measurements, filter-based measurements using PM impactors or cyclones are conducted most often, which can provide mass concentrations and allow chemical and physical analysis of the particles later in the lab (See et al. 2007; Geron and Hays 2013; Fujii et al. 2014; Stockwell et al. 2016). In recent years, light-scattering-based devices (for example, DustTrak from TSI) have been in the field, measuring the real-time mass concentration of particles (Roulston et al. 2018; Wooster et al. 2018), but they are relatively expensive. With the development of sensor technology, we are observing an increased utilisation of air quality sensors in people’s daily lives for health monitoring; however, no study has been conducted to demonstrate the reliability of low-cost sensors in measuring wildfire smoke. It is also critical to develop cost-effective air quality sensors for higher spatial and temporal measurements, and to be used for peat fire detection, validating remote sensing models and estimating the health risks for residents or firefighters.
In this research, three low-cost portable air quality sensors that are representative of similar sensors on the market were evaluated in controlled laboratory conditions in measuring peat fire emissions against research grade and calibrated instruments (FTIR, PM Cascade Impactor and DustTrak). The objectives of this study contribute towards the development of air quality diagnostics for field wildfire measurements.
Method
Peat sample preparation
In this experimental study, Irish horticultural peat, which is commercially available from Bord na Mona Horticulture Ltd., was used owing to its long-term sample uniformity and supply consistency, essential in controlled laboratory studies. The elemental analysis of this peat showed the C/H/N fractions to be 50.21 ± 1.36/5.14 ± 0.18/1.65 ± 0.82% (on dry basis) and the inorganic content was 5.1 ± 0.6%. Samples were prepared at 100% moisture content (mass of water over mass of dry peat), which represents field conditions (Usup et al. 2004). The methods of sample preparation and moisture verification have been described in previous works (Hu et al. 2019b; Christensen et al. 2020). The bulk density of peat samples with 100% moisture content was 288.1 kg m−3 ± 1.2%.
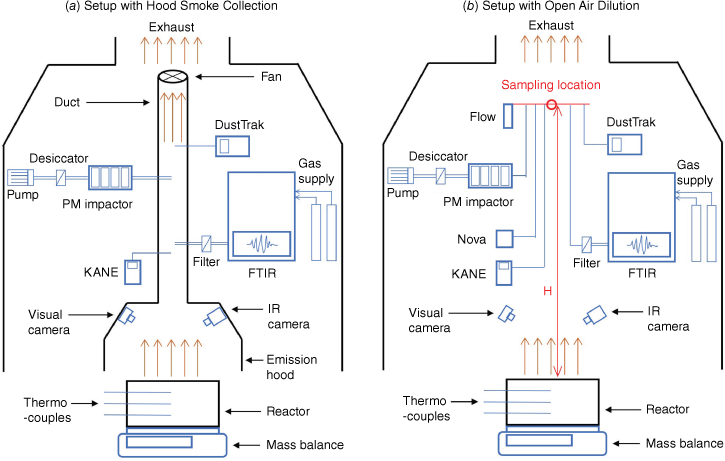
Peat samples deposited in an open-top reactor with internal dimensions of 20 × 20 × 10 cm (built from mineral fibre boards) were ignited using a helical ignition coil (length 18 cm, diameter 1 cm) mounted on one side board (5 cm from the top surface) following the reactor and ignitor design of previous research (Huang et al. 2016; Hu et al. 2019a). At the ignition stage, the ignition coil had a constant power supply of 100 W, and it was turned off when the sample had 10% mass loss (Cui et al. 2022). To monitor smouldering dynamics, a mass balance (Mettler Toledo, resolution 0.01 g) was used to record real time mass loss; 12 thermocouples (K-type) were inserted into the reactor to measure the soil temperature profile (three rows and four columns); A Gopro and a FLIR infrared camera were installed to record the visual and infrared signature of the experiments (shown in Fig. 3).
Emission measurement devices
Devices used to measure the gas and particle emissions in this study are shown in Fig. 3. The basic specifications of these devices are presented in Table 1 and their photos are shown in Fig. 4. Three low-cost sensors – KANE101, SDS011 and FLOW – were evaluated against research-grade reference instruments (FTIR, PM Cascade Impactor and DustTrak).
| Approximate cost (in 2021 UK£) | Dimensions (cm) | Power supply | Data logging | Measurement | Range | ||
|---|---|---|---|---|---|---|---|
| FTIR | 62 000 | 60 × 50 × 100 | Cable to power (100–240 V AC) | Software | CO2, CO, CH4, NH3, C2H2, C2H4, C2H6, C3H6, C3H8, C4H10, CH3OH, CH2O, NO, NO2, HCN, CH3COOH, CH4O, CH2O2, HCl, SO2 | Depends on spectral range | |
| PM Cascade Impactor | 15 000 | 8 × 8 × 20 | Cable to power (110–230 V AC) | By hand | PM1, PM2.5, PM10 | <1 mg/stage, depends on the aerosol | |
| DustTrak | 9000 | 13 × 12 × 32 | Rechargeable battery | On-board memory | PM1, PM2.5, PM10 | 1–1.5 × 10⁵ µg m−3 | |
| KANE101 | 500 | 9 × 5 × 20 | Rechargeable battery | By hand | CO2 | 200–4000 ppm | |
| CO | 0–1000 ppm | ||||||
| FLOW | 200 | 4 × 2 × 9 | Rechargeable battery | Wireless | PM1 | 0–200 µg m−3 | |
| PM2.5 | |||||||
| PM10 | |||||||
| VOCs | 0–10 ppm | ||||||
| NO2 | 0–0.3 ppm | ||||||
| SDS011 | 12 | 7 × 2 × 7 | USB to external source | Built-in SD card | PM2.5 | 0–1000 µg m−3 | |
| PM10 | 0–2000 µg m−3 |
Photos of the devices used in this study: (a) Thermo Scientific Nicolet iG50 FTIR spectrometer; (b) Dekati four-stage PM Cascade Impactor; (c) TSI DustTrak handheld aerosol monitor; (d) KANE101 indoor air quality analyser; (e) Plume Labs FLOW air pollution sensor; (f) Nova SDS011 PM sensor. The sizes of all devices are listed in Table 1.
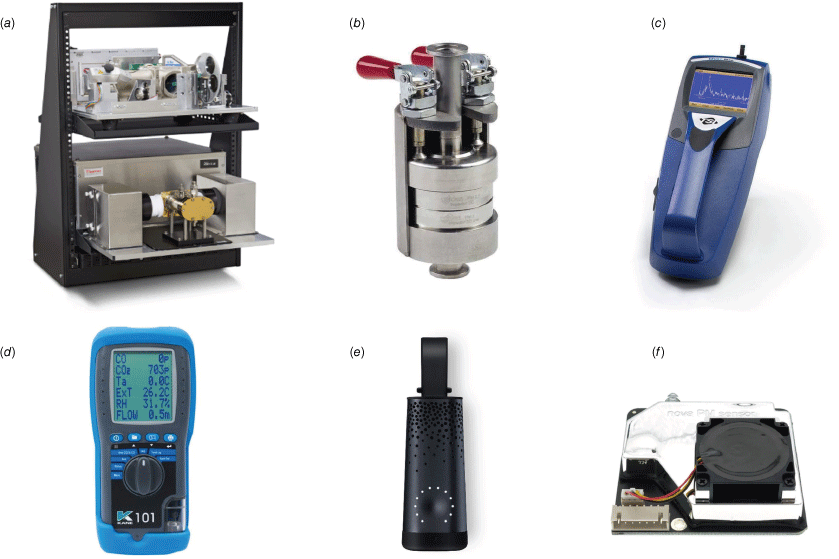
An FTIR spectrometer (Thermo Scientific Nicolet iG50) was used as the reference instrument for gas emissions. This instrument was calibrated and used in previous peat fire emission studies (Hu et al. 2019a, 2019b, 2020) to record the real-time concentrations of ~20 gas species. Before and after each experiment, the FTIR system was purged thoroughly with pure nitrogen. When measuring the concentrations of gases, all ducts of the FTIR system were heated to 100°C to avoid gas condensation (Hu et al. 2019a).
There were two reference devices for particle measurements in the experiments representing two commonly used principles: the gravimetric method and the optical method. The Dekati four-stage PM cascade impactor (gravimetric method) was used to collect size-fractionated particles (aerodynamic diameter ≤ 1 µm, 1 µm ≤ aerodynamic diameter ≤ 2.5 µm, 2.5 µm ≤ aerodynamic diameter ≤ 10 µm, aerodynamic diameter ≥ 10 µm) onto filters in each of the stages of the cascade impactor, which was also used in previous peat fire particle measurements (Hu et al. 2019a, 2019b). The sampling flow rate was set to 0.0005 m3 s−1 ± 5.0% by adjusting the pump set-up, leading to an accuracy of ±2.8% for the particle sizes. The sampling duration was 10 min each time, and in each experiment, sampling was conducted five times, one at ignition stage (at the time of 5% mass loss), and four at steady stage (at 20, 40, 60 and 80% mass loss). The filters were weighed immediately after sampling using a Sartorius balance (resolution 0.01 mg). Amounts of PM1 (aerodynamic diameter ≤ 1 µm), PM2.5 (aerodynamic diameter ≤ 2.5 µm) and PM10 (aerodynamic diameter ≤ 10 µm) were calculated from the measured mass gain of filters at each stage of the impactor.
The other reference device for particle measurements was the DustTrak aerosol monitor (optical method), which can provide real-time mass fraction concentrations including PM1, PM2.5 and PM10. This device has been used in laboratory studies on particle emissions of peat fires (Watson et al. 2019) and smouldering and flaming fuels (Garg et al. 2022). This light-scattering laser photometer has a portable version that can be used in field measurements with a high aerosol concentration range up to 150 mg m−3. Owing to the protocol of factory calibration using coarser particles than particles emitted by biomass burning, this device was calibrated again in experiments for peat fire particles using a gravimetric method (Wang et al. 2009; Wooster et al. 2018). The sampling flow rate of DustTrak in experiments was set to 3 L min−1 with a data recording frequency of 1 Hz.
A KANE101 portable gas analyser measuring the concentration of CO2 and CO (the two most abundant gas species emitted by peat fires) was evaluated in experiments using the data obtained by FTIR. The CO2 measurement uses an NDIR sensor and CO measurement an electrochemical sensor. This device has a reported accuracy of ±10% and resolution of 1 ppm for both CO2 and CO after calibration, and has a wide range up to 5000 ppm for CO2 and 1000 ppm for CO. The version of KANE101 in our assessment can measure real-time CO2 and CO concentrations, but can not record data. In each experiment, measurement values were recorded by hand five times at the same mass loss intervals described above.
A FLOW portable air quality monitor from Plume Labs was assessed in experiments. This device can measure real-time concentrations of PM1, PM2.5, PM10, NO2 and VOCs, and can update the air quality index via a smartphone app in real time. The measurement ranges are 0–200 µg m−3 for PM, 0–300 ppb for NO2 and 0–10 ppm for VOCs. This device is representative of similar commercial air pollution sensors developed in recent years for monitoring personal exposure to air pollution, and is popular in citizen science projects mapping the air pollution of urban areas (Tan and Smith 2021).
An SDS011 particle sensor (Arduino-based) that can measure real-time concentrations of PM2.5 and PM10 was studied in experiments. This PM sensor containing a small fan and a fine laser beam for light scattering is an improved version of similar sensors on the market. It can provide real-time readings (frequency of 1 Hz) of environmental particle concentration, and has a relatively larger range of 0–1000 µg m−3 for PM2.5 and 0–2000 µg m−3 for PM10.
Experimental set-up
There were two experimental set-ups, hood smoke collection and open air dilution, used in this study. The experimental set-up with hood smoke collection shown in Fig. 3a was used in previous research studying transient gas and particle emissions of peat fires (Hu et al. 2019a, 2019b). In this set-up, an emission hood connected with a duct to an adjustable fan collects smoke produced by a controlled peat fire. The set-up was calibrated previously (Hu et al. 2019a) to set the duct flow rate to 2 m s−1 and the skirt free height (the distance between the hood and the reactor) to 2 cm. This allows the smoke produced to be completely collected in the hood and well mixed in the duct, while the impact of the experimental set-up on fire dynamics is reduced to a minimum. A preliminary experiment was conducted using this set-up with all six devices measuring emissions inside the duct to test their ranges and capacities. The results indicated that the PM concentration in the set-up of hood smoke collection was higher than the measurement range of FLOW and SDS011. Then, three experiments were conducted (Experiments 1, 2 and 3) with this set-up using FTIR, PM Impactor, DustTrak and KANE for emission measurements. The other experimental set-up with open air dilution shown in Fig. 3b did not use the emission hood to collect emission gases and particles. The smoke released by smouldering peat was naturally diluted inside the combustion fume hood (1.2 × 1.2 × 3 m) connected to the exhaust. The average velocity across the section of the fume hood is 0.6 m s−1. A metal structure was built to lift the inlet of all devices to the same sampling height (H). Two sampling heights, 1.5 and 2 m, were chosen in experiments, and two experiments were done at each sampling height (Experiments 4 and 5 at 1.5 m, and 6 and 7 at 2 m). Experiments were conducted in a fairly stable ambient conditions with temperature at 21.4 ± 1.5°C and relative humidity at 33.3 ± 4.5%.
Results and discussion
Smouldering dynamics and emissions
Fig. 5 illustrates the evolution of fire dynamics and emissions in Experiment 1. Four fire evolution stages were defined with reference to mass loss progression: (I) ignition stage (0–10% mass loss); (II) growth stage (10–20% mass loss); (III) steady stage (20–80% mass loss); and (IV) burnout stage (from 80% mass loss until the end). This method of dividing fire evolution into stages agrees with observation and emission measurements. Previous work also revealed that fire emissions are correlated with fire dynamics (Hu et al. 2019a). Defining different stages of fire evolution using the mass loss progression can facilitate the calculation and comparisons of various experimental results (Cui 2022).
Example of evolution of mass loss rate, normalised mass, CO2 and CO concentrations (measured by FTIR), calculated emission ratio (ER) and modified combustion efficiency, PM2.5 concentration (measured by DustTrak) from the results of Experiment 1. Vertical dashed lines indicate the fire development stages: (I) ignition stage, (II) growth stage, (III) steady stage, (IV) burnout stage.
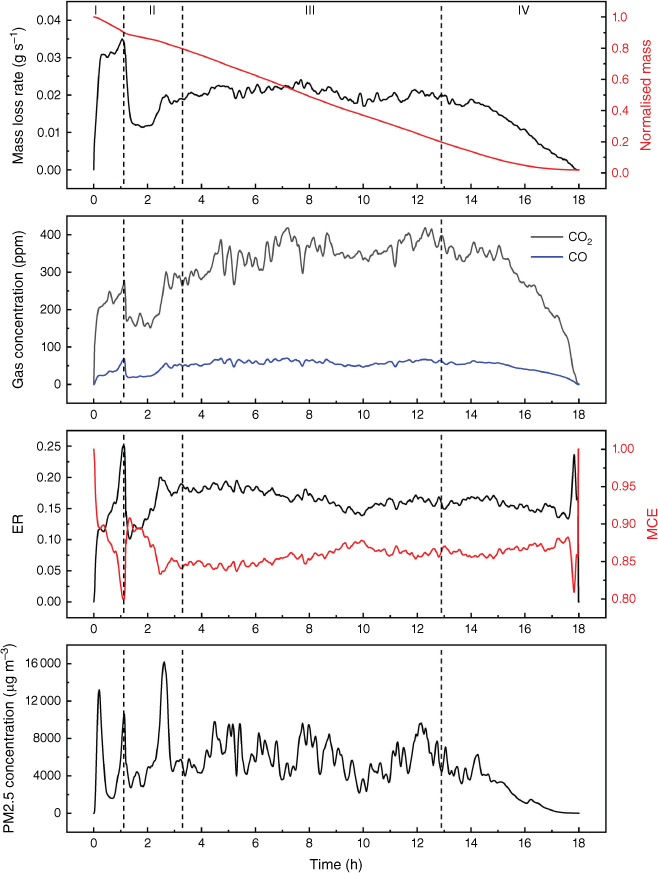
The emission ratio (ER) and modified combustion efficiency (MCE) are two important characteristics in emission studies to determine combustion regimes (Bertschi et al. 2003; Rein et al. 2009; Akagi et al. 2011). The methods of calculation are shown in Eqns 1 and 2, where ΔCO2 and ΔCO are the excess concentration of CO2 and CO. Previous research revealed that the MCE threshold for smouldering is 0.75–0.85, and flaming is above 0.9 (Stockwell et al. 2016). The average MCE at steady stage in the present study was 0.85 ± 0.01.
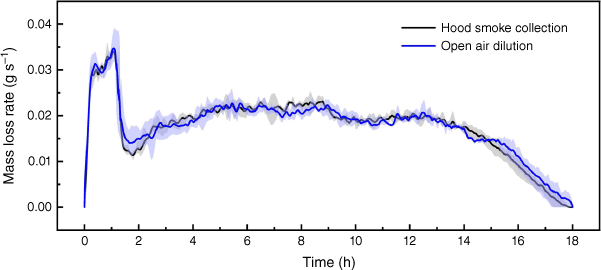
Fig. 6 shows the difference in experimental set-up did not have an obvious influence on the fire dynamics. All repeats of experiments in the two experimental set-ups finished in ~18 h. The average mass loss rate at steady stage was 1.24 ± 0.10 g min−1 in set-up (a) and 1.21 ± 0.11 g min−1 in set-up (b) (Fig. 3). Agreement in fire dynamics can help confirm the fire emissions are comparable.
Performance of FLOW and SDS011 for PM measurements
The standard factory calibration for DustTrak uses Arizona road dust, which is coarser than particles emitted by biomass burning, so it is important to recalibrate the device for different particles in experiments using a gravimetric method. Fig. 7 shows the derivation of the linear recalibration factor for the PM concentration data of DustTrak. The derived recalibration factors for the mass concentration of PM10 and PM2.5 measured by DustTrak are 0.368 ± 0.036 and 0.364 ± 0.036. These factors are the first reported recalibration factors for DustTrak in a controlled laboratory environment measuring peat fire emissions. These factors are lower than the recalibration factor of 0.5 ± 0.01 derived in a field peat fire study (Wooster et al. 2018), and very close to the recalibration factor of 0.37 for wood smoke measured in laboratory conditions (Kingham et al. 2006). The difference may stem from the difference in burning fuel or environmental uncertainties, and it would be valuable for future studies to compare these.
Derivation of the recalibration factor for the DustTrak data in measuring mass concentration of (a) PM10 and (b) PM2.5 in peat fire emissions.
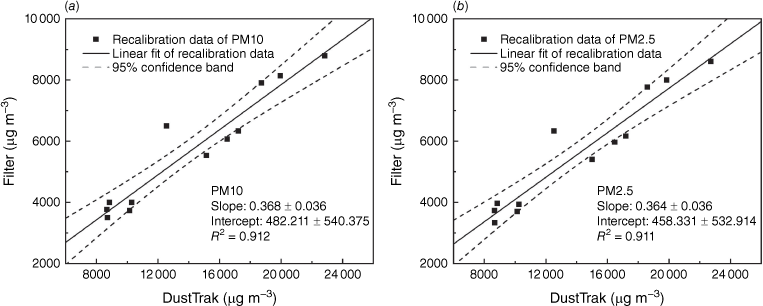
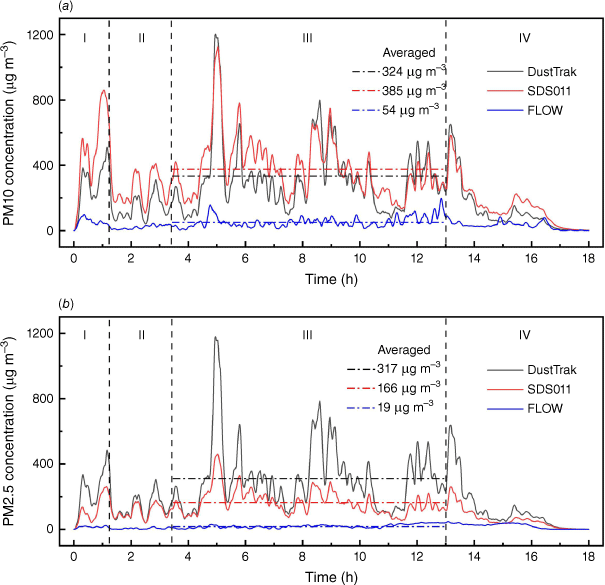
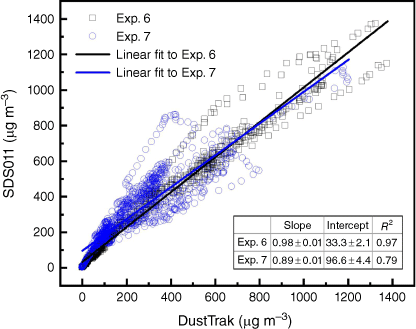
Fig. 8 shows the particle measurements from three different devices (DustTrak, SDS011 and FLOW) in one experiment (Exp. 7). The manufacturers of SDS011 or FLOW do not report the detailed factory calibration process and the accuracy of measurement for different particle size range, so the data obtained are directly compared with the calibrated results of the reference instrument. Comparing with the reference device DustTrak, SDS011 captured the variation of data at all stages of fire evolution and responded relatively well in PM10 measurement, whereas the PM2.5 measurement at steady stage was nearly 50% lower than the reference. This was because of the limited capability of SDS011 to differentiate between particle sizes and the lack of calibration. Fig. 9 shows the high correlation (R2 ϵ [0.79, 0.97]) between the PM10 measurements of SDS011 and DustTrak. The mean absolute error (MAE) and root-mean-squared error (RMSE) of PM10 measurements are 39.8 and 60.2 µg m−3 for Experiment 6, and 92.1 and 117.5 µg m−3 for Experiment 7 with 18 h measurements for each experiment.
Comparisons of PM measurement results from different devices in one experiment (Exp. 7): (a, b) show the results of PM10 and PM2.5 measurements respectively. The dash-dot lines in both figures indicate the averaged values at the steady stage. Vertical dashed lines indicate the fire development stages: (I) ignition stage, (II) growth stage, (III) steady stage, (IV) burnout stage.
Scatter plots of the readings of SDS011 against the readings of the reference device DustTrak in Exps 6 and 7 sampling at the height of 2 m with open air dilution.
The average PM concentration measured by FLOW was outside its range (200 µg m−3), but the data did not show a cut-off. This device was not designed for PM concentrations as high as those wildfire emits, and can only be used for air pollution away from the fire. SDS011 showed cut-off at the range limits of PM10 at 2000 and PM2.5 at 1000 µg m−3, so it is more reliable for use to measure wildfire smoke with calibration and noting the range limits.
The results of PM mass concentration depend on many factors, including the scale of burning and the distance of measurement. Reporting the in-plume measurement near the fire source can help quantify the emission factor of particles, whereas out-of-plume results can help study the health impact of peatland wildfires. The choice of PM measurement ranges in peatland wildfire field studies needs to consider the objective. World Health Organization (WHO) global air quality guidelines state that exposure to 24 h concentrations of PM10 exceeding 50 µg m−3 and PM2.5 exceeding 25 µg m−3 can have negative health outcomes for humans (WHO 2006). A measurement range of up to 100–500 µg m−3 covering the range in the WHO guidelines by most of the air quality analysers similar to FLOW in the consumer market is suitable to monitor ambient PM exposure resulting from emissions in urban environments like transportation, but not suitable for measurement of peatland wildfire emissions. A previous field study conducted in Sumatra, Indonesia, during a peatland wildfire showed the mass concentration of PM2.5 in the plume 100 m from the fire source was 1600 ± 400 µg m−3, and ~60 km downwind from the fire source was 600 ± 420 µg m−3 (See et al. 2007). Another field measurement on peatland wildfire in Sumatra with in-plume measurement showed the PM2.5 concentration was as high as 7120 ± 3620 µg m−3 (Fujii et al. 2014). To the best of our knowledge, there are no low-cost PM sensors on the market that can measure PM concentrations higher than 2000 µg m−3 (range limit of SDS011). Dilutors, which are widely used in laboratory research, were not used in the present study because the focus of this study is to evaluate devices for field use, and dilutors reduce the portability of devices for fieldwork.
At completion of the experiments, two DustTrak devices failed to function owing to fine particle contamination of the optic system, whereas the SDS011 continued working effectively. This indicates that compatibility with measurement conditions should be considered when choosing devices for long-term field monitoring. Sophisticated instruments have higher maintenance costs and require more technical support, whereas low-cost sensors with promising data accuracy can fulfil the demands of extensive spatial and temporal field monitoring.
Performance of KANE101 and FLOW for gas measurements
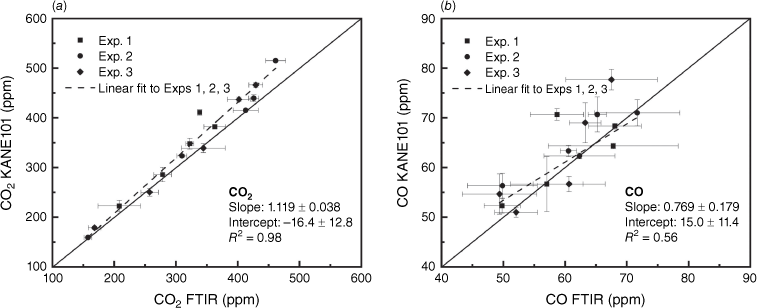
Fig. 10 shows the high linear correlation (R2 = 0.98) between KANE101 and FTIR measurements of the CO2 concentration, and moderate correlation (R2 = 0.56) for CO concentration. The MAE and RMSE are 21.19 and 28.88 ppm for CO2 measurement, and 4.01 and 5.30 ppm for CO measurement, which are all within the accuracy (±10%) reported by the manufacturer. The MCE at the steady stage calculated with KANE101 is 0.8549 ± 0.0147, which is very close to the value of 0.8542 ± 0.0125 obtained by FTIR (nearly 10 h steady stage measurement and three experiments). In general, KANE101 performed very well in measuring the concentrations of CO2 and CO.
Scatter plots of the readings of KANE101 against the readings of the reference FTIR instrument in Exps 1, 2, and 3 sampling with hood smoke collection in measuring (a) CO2 and (b) CO. The error bars represent the correlated standard deviation.
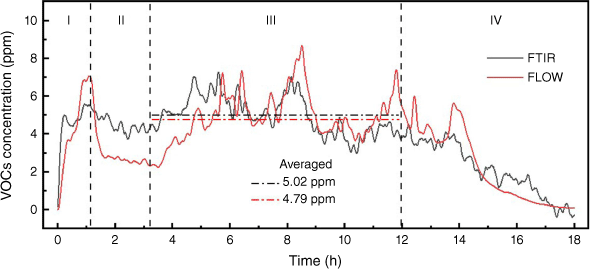
The measurement of VOCs and NO2 by FLOW were evaluated using the data from FTIR. There are a diverse number of gases in the category of VOCs. The VOCs gases that FLOW measures are unfortunately not reported by its manufacturer. The VOCs concentration obtained by our FTIR measurement is the sum of the concentrations of acetylene, ethylene, propylene, propane, methanol, butane, formaldehyde, acetaldehyde and formic acid and is calibrated. Some VOCs species in small amounts reported in previous peat fire studies (Blake et al. 2009; George et al. 2016) include chloromethane and benzene, but these were not part of the FTIR measurement because of a lack of calibration. The comparison of FTIR and FLOW in Fig. 11 indicates that FLOW underestimated the concentration of VOCs at steady stage. In terms of NO2, FLOW showed a value of 0 at steady stage, while FTIR averaged 0.6 ppm, which indicates that the NO2 sensor in FLOW is not sensitive enough for this application.
Statistical analysis for measurement comparisons
Based on assessment of the air quality analysers in previous sections, further statistical analyses were conducted for a more in-depth investigation of the differences in measurements. The Bland–Altman analysis compares two measuring devices by plotting the differences between their measurements against their mean. In this method, if the differences are random and evenly distributed around zero, and the limits of agreement (LOA) are narrow enough, then the two devices are considered to have good agreement. This method helps to identify any systematic differences or outliers and provides insight into the level of agreement between two devices.
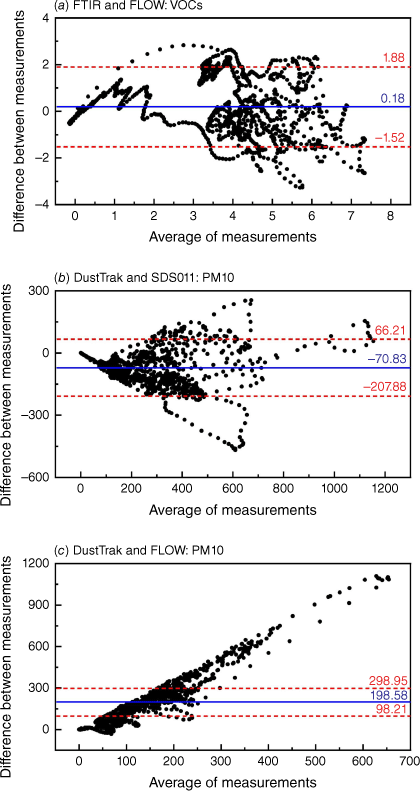
Fig. 12 shows the average measurement of the two devices plotted against the difference in measurements between them for FTIR and FLOW in measuring VOCs, DustTrak and SDS011 in measuring PM10, and DustTrak and FLOW in measuring PM10. The distribution of the differences and the LOA shows that FTIR and FLOW have relatively good agreement. DustTrak and SDS011 do not have evenly distributed differences but most of the data points are within the 95% intervals, which indicates that SDS011 can be calibrated to the specific type of smoke that it measures. DustTrak and FLOW do not have evenly distributed differences and the results show that the difference increases with the average measurement, confirming the limitation of measurement ranges.
Bland–Altman plots for the average measurements of the two devices considered (x-axis) against the difference in measurements between the two devices (y-axis). The continuous blue line indicates the average difference in measurements while the two red dotted lines show the 95% confidence interval limits, or LOA, for the average difference. The comparisons of (a) FTIR and FLOW in VOCs measurement, (b) DustTrak and SDS011 in PM10 measurements, and (c) DustTrak and FLOW in PM10 measurements are presented.
T-tests are a type of statistical hypothesis testing that quantitatively assesses a specific hypothesis regarding two datasets. The paired t-test is used to compare the means of two related samples, assuming the difference between the paired observations follows a normal distribution. Here, we apply it to compare measurements from the same experiments and pollutant by different gas analysers; the null hypothesis is that the true population mean difference between the two measurements is zero, and the alternative hypothesis that the true difference is greater than zero.
The paired t-test equation is given in Eqn 3; the difference between measurements was calculated using the mean of the difference (x̅d), the standard deviation the difference (sd), the hypothesised population mean difference (μd) and the sample size (n). The test analyses whether the mean difference is significantly different from zero using a t-distribution. The 95% confidence interval provides the range of values within which we are 95% confident that the true population mean difference between the two related samples lies; it is calculated with Eqn 4.
The P value is a measure of the strength of evidence against the null hypothesis, by representing the probability of observing a difference as large as or larger than the one observed in the data, assuming the null hypothesis is true. The lower the P value, the stronger the evidence against the null hypothesis; we define a threshold P-value of 0.05 under which the null hypothesis is rejected.
Table 2 shows the results of the paired t-tests to compare the measurements of analysers and reference instruments. The null hypothesis was rejected for all apparatus compared; the P values are always below the threshold of 0.05, indicating that the true population mean difference between the two pieces of apparatus compared is not equal to 0. These results indicate that although the air quality analysers KANE101, SDS011 and FLOW had factory calibration, they still need specific calibration for smouldering peat fires before being used in the field.
| Gas analyser and measurements taken | t | P value | 95% CI | x̅d | d.f. | |
|---|---|---|---|---|---|---|
| FTIR and KANE101: CO | −3.433 | 0.00404 | −31.726, −7.327 | −19.527 | 14 | |
| FTIR and KANE101: CO2 | −2.25 | 0.041 | −5.3400, −0.128 | −2.734 | 14 | |
| FTIR and FLOW: VOCs | 4.728 | 2.56 × 10⁻⁶ | 0.103, 0.250 | 0.176 | 1080 | |
| DustTrak and SDS011: PM2.5 | 28.756 | 2.20 × 10⁻¹⁶ | 100.751, 115.508 | 108.13 | 1080 | |
| DustTrak and SDS011: PM10 | −24.841 | 2.20 × 10⁻¹⁶ | −76.428, −65.238 | −70.833 | 1080 |
Calculating emission factors
A convenient way of quantifying emissions from wildfires is calculating emission factors. The emission factor (EF) is the ratio of the mass of a pollutant emitted per unit mass of fuel consumed. Previous works have discussed different methods to calculate emission factors in peat fires (Hu et al. 2019a). The most commonly used method in atmospheric science and remote sensing is the carbon balance method. This approach, particularly useful in the field, assumes emissions containing carbon are all measured, and the EF of species i calculated by using carbon balance method (EFb(i)) is given by Eqn 5.
where Fc is the carbon fraction in mass of the fuel, Mi is the molar mass of species i, ni is the number of moles of species i, and nt is the total number of moles of carbon emitted.
In the field, it is nearly impossible to measure real-time fuel consumption, but in laboratory studies, the real-time mass loss rate can be obtained along with gas concentrations. A method using mass loss data in laboratory experiments to calculate emission factors can be applied to validate the calculation of carbon balance method. The EF of species i calculated by using mass loss method (EFm(i)) is given by Eqn 6 (Hu et al. 2019a).
where ρi is the density of species i, ci(t) is the real-time concentration of species i (background concentrations were subtracted), V̇ is the volumetric flow rate inside the duct (0.035 m3 s−1 ± 2.5% for our rig), ṁ(t) is the real-time mass loss rate of the wet peat sample, and MC is the sample moisture content by dry mass.
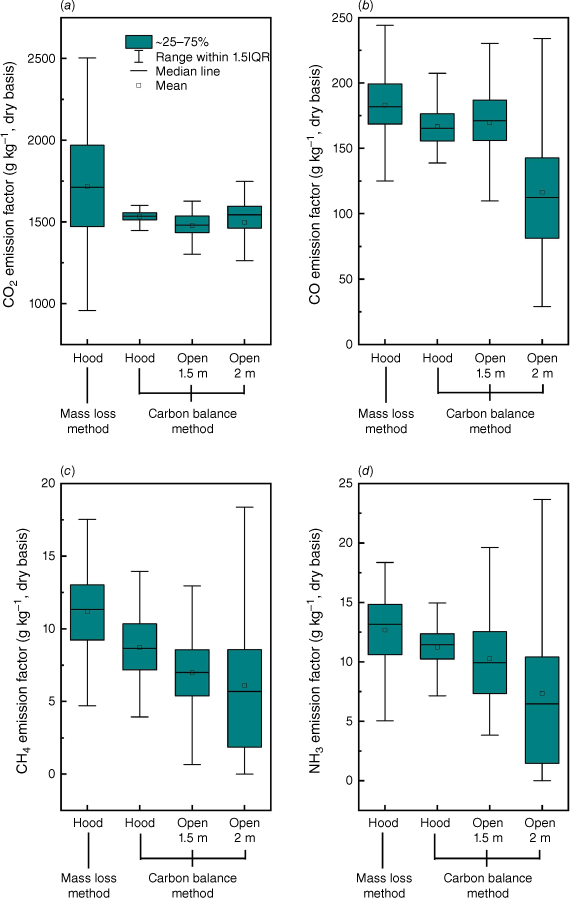
Fig. 13 shows the comparisons of EF results for the four most abundant species (CO2, CO, CH4, NH3). It was found that in general the carbon balance method underestimated the EFs of CO2, CO, CH4 and NH3 by 10.6, 8.9, 22.1 and 11.4% compared with the mass loss method, which is different to findings in previous work (Hu et al. 2019a). The uncertainty in EF quantification in field measurements is unavoidable (Smith 2013) because the calculation is highly dependent on the result of combustion efficiency and emission ratios of measured gases, the estimation of the fuel carbon content (Fc) and environmental conditions (e.g. wind conditions). Therefore, it is necessary to also conduct controlled laboratory experiments to compare the results from field measurement to improve the estimation of EF.
Comparisons of emission factors of (a) CO2, (b) CO, (c) CH4 and (d) NH3 at steady stage calculated by different methods in different experimental set-ups. EF calculated with hood smoke collection, averaged results of Exps 1, 2 and 3. EF calculated with open air dilution at sampling height of 1.5 m, averaged results of Exps 3 and 4. EF calculated with open air dilution at sampling height of 2 m, averaged results of Exps 5 and 6.
Conclusions
In this work, we studied the suitability and accuracy of three commercially available air quality sensors, KANE101, SDS011 and FLOW, for smouldering fire emissions. We conducted controlled laboratory-scale experiments measuring particulate matter and gas emissions from smouldering peat. Sensors were evaluated against research-grade reference instruments (FTIR, PM Cascade Impactor and DustTrak).
KANE101 gave accurate CO2 concentration measurements and allowed calculation of the MCE, and thus can be used in field measurement after calibration. The readings from SDS011 correlate well with the readings from DurstTrak in PM10 measurements, and SDS011 can be calibrated for field use. The average experimental PM concentration was outside the range of FLOW (200 µg m−3). FLOW is not suitable for field-scale wildfire PM concentrations; field studies of peatland wildfire episodes in Indonesia have measured PM2.5 concentrations as high as 1600 µg m−3 (See et al. 2007) and 7120 µg m−3 (Fujii et al. 2014). Compared with the sum of selected relevant VOCs concentrations measured by the reference FTIR instrument, FLOW underestimated the concentration of VOCs. Furthermore, the FLOW NO2 sensor did not detect NO2 in heavy smoke and high particle concentration conditions. The performance of all low-cost portable gas and particle analysers needs to be assessed in the laboratory before application to wildfire smoke measurements.
The EF was calculated with two methods. By calculating the EF for CO2, CO, CH4, NH3, we found that the carbon balance method underestimated the EF compared with the mass loss method. It is very important to conduct this study for the research purpose of quantifying emissions from wildfires, and for the general application of monitoring people’s health. This work provides a better understanding of how low-cost and portable emission sensors can be of use for wildfire measurements in the field.


