

Comparing geostationary and polar-orbiting satellite sensor estimates of Fire Radiative Power (FRP) during the Black Summer Fires (2019–2020) in south-eastern Australia
Konstantinos Chatzopoulos-Vouzoglanis A * , Karin J. Reinke A B , Mariela Soto-Berelov A B , Chermelle Engel A B and Simon D. Jones A B
A STEM College, RMIT University, Melbourne, Vic. 3000, Australia.
B SmartSat Cooperative Research Centre, Adelaide, SA 5000, Australia.
International Journal of Wildland Fire 31(6) 572-585 https://doi.org/10.1071/WF21144
Submitted: 22 October 2021 Accepted: 31 March 2022 Published: 11 May 2022
© 2022 The Author(s) (or their employer(s)). Published by CSIRO Publishing on behalf of IAWF. This is an open access article distributed under the Creative Commons Attribution-NonCommercial-NoDerivatives 4.0 International License (CC BY-NC-ND)
Abstract
Background: We compared estimates of Fire Radiative Power (FRP) from sensors onboard geostationary Himawari-8 (BRIGHT_AHI) and polar-orbiting TERRA/AQUA (MOD14/MYD14) satellites during the 2019/2020 Black Summer Fires in South-Eastern Australia.
Aim/methods: Analysis was performed on a pixel, bioregion, and wildfire event basis to assess the utility of the new BRIGHT_AHI FRP product.
Key results: Results show a high agreement between the products (r = 0.74, P < 0.01) on a pixel level, with BRIGHT_AHI generally underestimating FRP compared to MOD14/MYD14. Regional spatiotemporal trends were captured in more detail by BRIGHT_AHI due to its higher temporal resolution, with MOD14/MYD14 systematically underestimating the total and sub-diurnal FRP values. Nevertheless, both datasets captured similar fire ignition and spread patterns for the study region. On the event level, the correlation between the datasets was moderate (r = 0.49, r = 0.67), when considering different temporal constraints for hotspot matching.
Conclusions: The results of this study indicate that BRIGHT_AHI approximates the well-established MOD14/MYD14 product during concurrent observations, while revealing additional temporal information for FRP trends.
Implications: This gives confidence in the reliability of BRIGHT_AHI FRP estimates, opening the way for a denser observation record (10-min intervals) that will provide new opportunities for fire activity reporting, some of which are presented here.
Keywords: Black Summer Fires, BRIGHT, fire intensity, Fire Radiative Power, geostationary, Himawari-8, intercomparison, MOD14/MYD14, MODIS.
Introduction
During the 2019–2020 southern hemisphere summer, south-eastern Australia experienced prolonged drought, dry fuel accumulation, and extremely high temperatures creating fire-favouring conditions (Fryirs et al. 2021). Multiple fires ignited across south-eastern Australia, eventually leading to major fires that were collectively termed the Black Summer Fires, burning almost 12.6 million ha of land, including 8 million ha of natural vegetation (Wintle et al. 2020; Godfree et al. 2021). Despite the long history of extreme wildfires in Australia, the Black Summer Fires were devastating for the already stressed ecosystems and unparalleled in terms of intensity, spatial and temporal scales (Wintle et al. 2020). It is estimated that 76 plant families were affected by the fires, while 498 out of the 816 vascular plant species lost more than 75% of the area they occupy (Godfree et al. 2021). In addition, 33 human lives were lost, thousands of houses burned down, while over 1 billion animals were estimated to have been killed (Filkov et al. 2020).
Satellite earth observations allow wildfires to be observed and studied through their various stages; from ignition to impact on the landscape. The orbital characteristics of satellite sensors influence how often, and with what level of detail, fire activity can be observed and recorded. Most commonly used datasets are captured by polar-orbiting satellites in a Low Earth Orbit (LEO), which allows them to revisit almost any spot on the earth’s surface from two times a day (e.g. TERRA/MODIS) to a few times a month (e.g. Sentinel-2 MSI). Recently, data from satellites on a Geostationary Orbit (GEO) are also being used as they offer multiple observations per hour but for a constant area, that often corresponds to a full-disk view of the earth (e.g. Himawari-8/AHI). Fire hotspot detection and identification (Wickramasinghe et al. 2020; Engel et al. 2021a; Giglio et al. 2021), fire intensity estimation (CB Engel, SD Jones, KJ Reinke unpubl. data; Xu et al. 2017, 2021), burned area estimation (Giglio et al. 2018; Roy et al. 2019), and fire severity assessment metrics (Gibson et al. 2020) are among the applications that highlight the importance and opportunities that these observations offer.
Fire activity and hotspot detection capabilities using GEO and LEO satellites have been studied through LEO-vs-LEO (Fu et al. 2020) and LEO-vs-GEO product intercomparisons (Engel et al. 2021b), comparing errors of omission and commission and FRP retrieval capabilities. Generally, MOD14/MYD14 have been shown to detect more fire hotspots than GEO satellite products when given the same observation opportunities (e.g. clear line-of-sight, appropriate satellite and sensor location over the fire), and especially when these fires are burning with low intensity (Xu et al. 2017, 2021; Engel et al. 2021b). When products that implement the Fire Thermal Anomaly (FTA) algorithm (Wooster et al. 2015) derived from the GOES-16 geostationary satellite over the Americas are compared to MOD14/MYD14 (Xu et al. 2021), they report 68% omission and 12% commissions errors. The omission error is mainly attributed to undetected low-intensity fires which, when excluded from the assessment, reduce the omission error to 37% (Xu et al. 2021). Similarly, the adapted FTA algorithm product for Himawari-8’s Advanced Himawari Imager (AHI) reported a 66% omission error and an 8% commission error in comparison to MOD14/MYD14, across East Asia and Australia and different land covers for June 2015 (Xu et al. 2017).
A recently developed algorithm for the AHI data, the Biogeographical Region and Individual Geostationary HHMMSS Threshold (BRIGHT) (Engel et al. 2021b), uses a different approach to fire detection compared to FTA. Its latest version has slightly reduced omission and commission errors for Australia, reporting 54 and 5% respectively, when compared to MOD14/MYD14 from April 2019 to March 2020 (Engel et al. 2021a). This error is again attributed to lower intensity fires being missed due to the lower spatial resolution of the GEO products, but differs from previous studies as the study period was considerably longer, capturing an entire year of observations across the whole of Australia. Engel et al. (2021a) also showed that the agreement between the two datasets in terms of probability of fire detection increases with increasing minimum fire intensity throughout a fire event.
One particularly important element of attributing and measuring fire intensity and activity is Fire Radiative Power (FRP). This corresponds to the upwelling energy emitted by a fire and is used to inform combustion completeness, burning biomass emissions, severity, and impact of wildfire (Wooster et al. 2003, 2005; Freeborn et al. 2014b; Li et al. 2019; Shen et al. 2021). A detailed diurnal estimation of FRP can be integrated to compute the Fire Radiative Energy (FRE) of a fire and alongside other satellite sensor derived variables (e.g. Aerosol Optical Depth) used to make an alternative biome specific emission estimation without the need of certain assumptions and hard to acquire variables, such as fuel density and consumption rates (Ichoku and Kaufman 2005; Ichoku and Ellison 2014; Nguyen and Wooster 2020). Xu et al. (2017) compared GEO FRP estimates with established products, such as MOD14/MYD14, for different parts of the world and land covers. They found that more recent GEO sensors such as H8-AHI can provide FRP estimations more reliably than older platforms such as FY-2 and MTSAT. AHI showcased an almost perfect correlation with MOD14/MYD14 (R2 = 0.98) on a per-fire level across East Asia and Australia for June 2015, where per-fire refers to a cluster of spatially-adjacent and near-simultaneous fire pixels.
Currently, few studies have moved past the detection error comparison and intercompared FRP derived from GEO and LEO sensors (e.g. Xu et al. 2017, 2021). These studies compare aggregations of FRP estimations from each sensor that correspond to specific fire event/clusters or 0.5° grid aggregations. Nevertheless, conclusions from these studies are limited as they cover 1 and 2 months respectively, while focusing on large-area spatial patterns.
This study intercompares the BRIGHT_AHI FRP product (CB Engel, SD Jones, KJ Reinke unpubl. data) to MOD14/MYD14 during the extreme Black Summer Fires event in south-eastern Australia (November 2019–March 2020). The two FRP products are compared through different temporal and spatial constraints to explore the agreement in concurrent hotspot FRP estimations (per pixel) and diurnal FRP variations in bio-regional and seasonal settings.
Methods
Data
The FRP Level 2 MODIS products (1 km spatial resolution) MOD14 from the TERRA and MYD14 from AQUA satellites (Thermal Anomalies/Fire) were accessed. MOD14/MYD14 is included in the latest MODIS data releases and remains unchanged between Collection 6 and 6.1. Nevertheless, a small percentage of pixels (~0.1%) have changed cloud cover status due to improvements in the processing of the relevant spectral channels (Giglio et al. 2021). The FRP calculation is based on the methodology proposed by Wooster et al. (2003), which utilises the MIR channel centred at 4 μm and is heavily dependent on the accurate characterisation of the identified hotspot’s background MIR radiance (Giglio et al. 2016). In addition to the typical image granule format (HDF), NASA’s Fire Energetics and Emissions Research (FEER) website offers Collection 6 data in tables (ASCII) including the coordinates, timestamp and variables for each hotspot (FEER 2021). The FEER data was used in this study.
To reduce known errors in hotspot detection and FRP intercomparison, MOD14/MYD14 data were limited to narrower than the full scan angle, as this is known to affect the detection and retrieval capabilities with the increasing pixel size towards the scan edge (Freeborn et al. 2014a; Roberts et al. 2015; Xu et al. 2017, 2021; Engel et al. 2021a, 2021b). For comparison and consistency with the existing literature purposes, MOD14/MYD14 hotspots were filtered to those retrieved from pixels with a scan angle between 0 and 30°, which results in a maximum increment of the MOD14/MYD14 pixels by 1.7-times compared to their size at nadir.
BRIGHT_AHI FRP estimations derived from Himawari-8 imagery were also collected. Himawari-8 sits in a geostationary orbit (140.7°E) and through the Advanced Himawari Imager (AHI) sensor, provides data for the whole disk in 10-min intervals in 16 spectral bands of varying spatial resolutions from 500 m to 2 km IFOV. The BRIGHT_AHI hotspot detection algorithm (Engel et al. 2021a, 2021b) provides FRP estimations at hotspot locations at ~2 km spatial resolution. The same algorithm as MOD14/MYD14 (Wooster et al. 2003) is used for this step (CB Engel, SD Jones, KJ Reinke unpubl. data), utilising the Middle Infrared spectral band from AHI (MIR at 3.9 μm) to derive the FRP values at hotspot locations.
Study area and duration
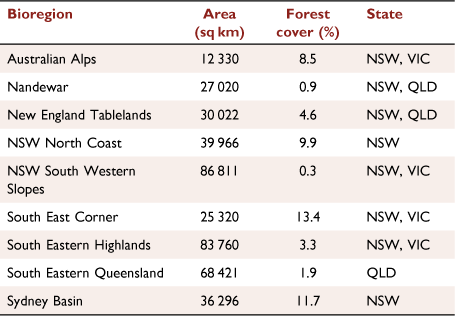
The study was conducted across south-eastern Australia, specifically along forested areas impacted by the Black Summer Fires during Southern Hemisphere summer (2019–2020). Nine biogeographical regions (or bioregions) as defined by the Interim Biogeographic Regionalisation for Australia (IBRA) framework that were affected by the Black Summer Fires were selected as the study area for the period between 1st November 2019 and 31st March 2020 (Fig. 1). IBRA is a commonly used segmentation of the continent into regions of similar biophysical characteristics (DAWE 2000). The analysis was conducted across multiple spatial scales: the entire study area, for each bioregion, for individual wildfire events/clusters and on a pixel level. At the bioregion scale, the analysis includes only the NSW North Coast, Sydney Basin and South East Corner bioregions as they have the highest forest cover and highest fire activity according to the two datasets (Table 1).

|
|
Intercomparison of BRIGHT_AHI and MOD14/MYD14 FRP values
The first level of comparison between BRIGHT_AHI and MOD14/MYD14 was performed on the entire study area by grouping the hotspots (pixel centroids) using spatial and temporal proximity constraints. The bioregion level stratification was used to spatially group the hotspots, while a temporal separation was implemented using discrete calendar months. For each bioregion and calendar month, diurnal cycle plots were created using the total number of hotspots, along with the averaged and summed (integrated) FRP estimations per hour (local time) as an appropriate visualisation tool that would uncover the general trends.
An additional level of fire-hotspot spatial grouping was achieved through the spatiotemporal clustering of the BRIGHT_AHI fire pixels into superclusters as reported in Ramsey et al. (2021) based on the work by Lizundia-Loiola et al. (2020). A supercluster refers to a group of spatially (within a 3.6 km radius) and temporally (2-h window) connected fire pixel centroids that are assumed to represent a single fire event from ignition to suppression. The superclusters were used to further intercompare BRIGHT_AHI and MOD14/MYD14 using their FRP estimates for the spatial extent and duration of specific events. Two different approaches were examined, one integrating and comparing all hotspots from both datasets in a supercluster’s footprint and duration, and a second including only concurrent hotspots from both datasets that were observed within 10 min of each other.
Grid alignment between BRIGHT_AHI and MOD14/MYD14
The comparison of two products with different spatial resolutions usually requires some grid reprojection for the measurements to correspond to the same area and location on the earth’s surface. The differences are more prominent when the products are derived from sensors with different orbits, scan angles and point spread functions. As such, MOD14/MYD14 pixels were aggregated to match the lower spatial resolution grid of BRIGHT_AHI (~2 km2) and from hereon will be referred to as MD14_agg. A modification of the superellipse model (also known as Lamé Curve or Oval – Gridgeman 1970) was used to define the neighbourhood of each BRIGHT_AHI pixel centroid, to approximate the elongated rectangular pixels of the sensor (1). Any concurrent MOD14/MYD14 pixel centroids that were located inside the superellipse were summed to provide a single aggregated FRP value for the area. The temporal threshold used to define concurrent spatiotemporal matches between the two datasets was ±10 min.
The superellipse neighbourhood was given by the inequality:
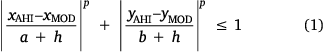
Where x and y are the coordinates of the BRIGHT_AHI and MOD14/MYD14 pixel centroids, a and b are the values of the major and minor axis of the superellipse that approximate the BRIGHT_AHI pixel axes lengths within the study region, and p is the curvature coefficient of the model. The p = 1 represents a rhombus, p = 2 represents a normal ellipse and p → ∞ approximates a rectangle. The h was used as a buffer constant that increased the size of the superellipse by half a MOD14/MYD14 pixel to account for pixel area (but not centroid) overlap and was set to 0.005 decimal degrees.
Intercomparison of BRIGHT_AHI and MD14_agg spread patterns and FRP values
The association of the matched hotspots was examined through their correlation using Pearson’s correlation coefficient (r), as the two products are estimations of the same variable and therefore their relationship is expected to be linear. Following the work by Xu et al. (2017, 2021), the best-fit linear model that passes through the origin was also calculated for the log-transformed data to satisfy the normality assumption of the Ordinary-Least-Squares regression (OLS) and be consistent with the literature. In addition, the matched hotspots were compared in terms of their location and ignition date, which was calculated based on the first logged FRP measurement in the time series of the stable BRIGHT_AHI pixel centroid location.
Results
BRIGHT_AHI vs MOD14/MYD14
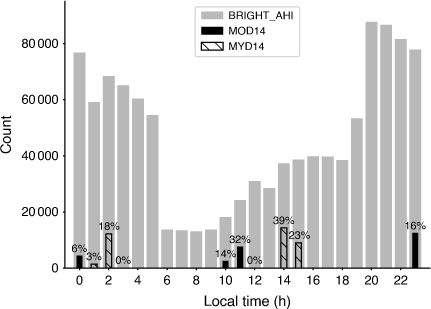
The frequency distribution for the different sensor hotspot retrievals (Fig. 2) depicts the temporal coverage difference between the two platforms over the diurnal cycle. BRIGHT_AHI reports considerably more hotspots per hour than MOD14/MYD14 on their concurrent hours, but this should be interpreted after considering the temporal resolution (BRIGHT_AHI makes six retrievals per hour versus four retrievals per day by MOD14/MYD14) and spatial resolution (BRIGHT_AHI’s pixels are two to four times larger than MOD14/MYD14) differences. However, BRIGHT_AHI detects significantly fewer hotspots per hour between 06:00 and 19:00 compared to 20:00–05:00 (Fig. 2), which roughly corresponds to a day/night difference.
|
A clear difference in the number of hotspots between BRIGHT_AHI and MOD14/MYD14 products is detected (Fig. 3a, b). Integrated FRP values demonstrate a similar trend (Fig. 3c, d), where observations from both sensors are available, with a dip in the morning hours and an increase from 10:00 to 15:00. Meanwhile, the mean FRP values fluctuate with a similar magnitude and trend, peaking around 15:00. Finally, an inverse relationship between the number of hotspots and their average and integrated FRP is evident in the BRIGHT_AHI data, alternating between day and night (Fig. 3a, c).

|
A further breakdown of the dataset per month and bioregion reveals specific temporal patterns. As seen in Fig. 4, there is a clear gradient indicating that at the beginning of the fire season (November) the majority of hotspots were in the northern regions (NSW North Coast). A month later most hotspots were in the central region (Sydney Basin) and another month later the southern region South East Corner had more hotspots than the other areas.

|
When compared to BRIGHT_AHI, the number of hotspots from MOD14/MYD14 is lower with the resultant loss of fire activity information. However, a similar trend in hotspot spatial-temporal incidence can be seen in the data (Fig. 5). Mean MOD14/MYD14 FRP values are underestimated compared to BRIGHT_AHI (Fig. 4).

|
Fig. 6 replicates the fire season progression (November, December 2019, January 2020) and study bioregions presented in Figs 4, 5. As per the trends in hotspot numbers, fires became more intense over time and progressed towards the south, while their intensity reduced over time in the north. An irregular jump of the FRP is observed in South East Corner for night-time observations in December 2019.

|
MOD14/MYD14 depicts similar spatial and temporal trends as BRIGHT_AHI (Fig. 7), but these are smaller in magnitude. The night-time peaks measured by BRIGHT_AHI during November in NSW North Coast and December in Sydney Basin and South East Corner are not captured by MOD14/MYD14.

|
BRIGHT_AHI vs MOD14/MYD14: fire superclusters
Using the fire superclusters (for derivation see Methods), BRIGHT_AHI continues to offer a more complete picture of fire intensity and hotspot numbers (Table 2). As seen in Fig. 8, Table 2, the NSW North Coast supercluster as captured by BRIGHT_AHI is consistent with the results from the bioregional level analysis (Fig. 4), with a peak of intensity between 10:00 and 14:00, unlike MOD14/MYD14 that misses the FRP variation. Meanwhile, MOD14/MYD14 successfully indicates the increase in intensity between 11:00 and 14:00 for the Sydney Basin supercluster, but with less detail than BRIGHT_AHI. The intensity during the South East Corner fire supercluster is the highest measured out of the three events as observed by BRIGHT_AHI, while MOD14/MYD14 failed to capture any data at this location/time.

|

|
Next, the association of the total FRP per supercluster was examined for BRIGHT_AHI and MOD14/MYD14 (Fig. 9). The correlation between the two datasets is moderately positive when all hotspots in a supercluster are integrated and compared (r = 0.67, P < 0.01, slope = 1.38), with BIRGHT_AHI logging higher total values due to its more frequent observations. Meanwhile, the observed correlation is lower (r = 0.49, P < 0.01, slope = 1.29) when only hotspots that are concurrently observed by both datasets within 10 min of each other are integrated, and the bias towards BRIGHT_AHI FRP is reduced.

|
BRIGHT_AHI vs MD14_agg
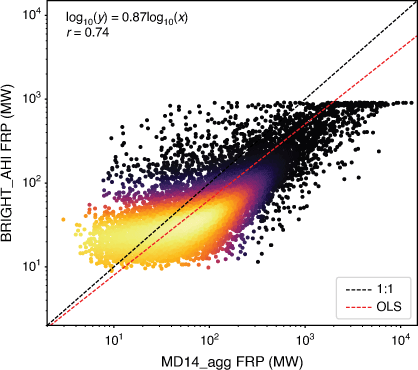
Over 90 000 concurrent hotspots, between BRIGHT_AHI and MD14_agg, were identified for the nine bioregions used in this study. A strong positive correlation between the FRP products (r = 0.74, Fig. 10) was observed, while the linear model, passing through the origin and applied to the log-transformed data, was fitted with a slope of 0.87. Despite the strong correlation, BRIGHT_AHI still underestimates the FRP values and saturates at around 950 MW.
|
Fig. 11 illustrates the spatiotemporal progression of the fire for BRIGHT_AHI and MD14_agg in the form of a 2D histogram. The plots show that fires spread from North to South and from East to West (length of artefacts along the y-axis). Most of the distance was covered during the last week of December and the first week of January, where fire ignitions peaked through 2° of latitude and 2.5° of longitude. From beginning to end, December had the largest number of ignitions (length of artefacts along the x-axis), especially along the 150° meridian, which correspond to the Sydney Basin IBRA region of the study area.

|
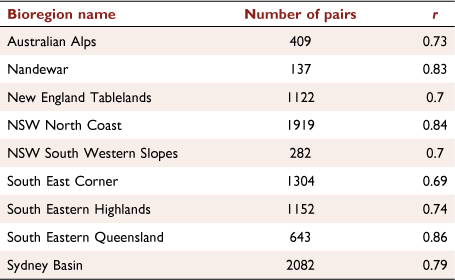
On a bioregion level, the two datasets remain positively correlated with values ranging from 0.69 to 0.86 as reported in Table 3. Pearson’s r is higher in NSW North Coast and Sydney Basin, and slightly lower in the South East Corner bioregion, compared to the overall correlation (r = 0.74, P < 0.01).
|
Discussion
Fire Radiative Power estimations from LEO (MOD14/MYD14) and GEO (BRIGHT_AHI) sensors were compared using different spatial and temporal constraints at three spatial aggregations. General agreement between FRP estimates was observed for bioregion (first level) and fire event (second level) stratifications of the data, with BRIGHT_AHI providing more detailed diurnal information due to its higher temporal resolution. Meanwhile, a high agreement was shown in the fire spread patterns captured by each sensor and detection algorithm. A strong positive correlation was also shown in concurrently observed fire hotspots by both datasets, which is significant, given the sensor and orbit differences (third level). This overall agreement is supportive of the legitimacy of BRIGHT_AHI detections and the utility of AHI to derive measures of FRP when compared to a higher spatial resolution product.
BRIGHT_AHI and MOD14/MYD14 were first compared according to month and bioregion. BRIGHT_AHI showed clear advantages over MOD14/MYD14 in the diurnal cycle analysis, where the former’s high temporal resolution allowed for temporal patterns to be captured in detail while fewer insights were able to be extracted from the latter (e.g. Fig. 3). This is to be expected as Himawari-8’s AHI has 144 opportunities per day to capture the earth’s surface compared to the four of the MODIS satellite pair. Nevertheless, a significant difference in the number of hotspots between day and night-time was documented for BRIGHT_AHI, which is a finding consistent with Engel et al. (2021a) and CB Engel, SD Jones, KJ Reinke (unpubl. data). Furthermore, in the case of cloud presence during the overpass of the satellite, the entire fire event can be missed (e.g. fire supercluster in South East Corner – Fig. 8) or sporadic high-intensity fire activity during the night-time compared to daytime can also be omitted (e.g. South East Corner during December – Fig. 6). The absence of an albedo check in the night-time BRIGHT algorithm relaxes detection rules, thereby increasing hotspot detections and potentially the rate of commission errors.
For the second level of intercomparison between the datasets, an alternative spatiotemporal constraint based on the work by Lizundia-Loiola et al. (2020) and adapted to the area by Ramsey et al. (2021) was applied using superclusters that corresponded to specific fire events. Here, it was observed that MOD14/MYD14 data underrepresented or completely omitted the fire activity (Fig. 8), unlike BRIGHT_AHI that provided consistent information for all the events. In the case of the South East Corner supercluster, a small number of BRIGHT_AHI hotspots along with high FRP values were measured, while MOD14/MYD14 missed the entire event. To further explore this, the cloud cover during the event was visually inspected using Japan’s National Institute of Information and Communications Technology (NICT) website (https://himawari8.nict.go.jp/). There it was observed that in the early morning and afternoon, both clouds and smoke were present covering parts of the coast, while the sky was clear only during the late morning of 30 December 2019. This could mean that MOD14/MYD14 did not observe this extreme event due to cloud and smoke contamination during the AQUA/TERRA overpasses, unlike BRIGHT_AHI that managed to provide information throughout the day utilising clear-sky moments.
The third level of comparison was implemented on a pixel level, using a superellipse neighbourhood to better match the MOD14/MYD14 smaller IFOV to the coarser and differently shaped BRIGHT_AHI pixels. As a result, the ‘double counting’ of MOD14/MYD14 hotspots with multiple adjacent BRIGHT_AHI was reduced for the pixel matching process, better aligning the different grid systems of the two products compared to a simpler model, e.g. Euclidean distance (circle). Further quality considerations for the neighbourhood definition include the varying pixel shape of BRIGHT_AHI across the observed disk, an artefact of the Earth’s curvature and AHI’s orbit. Adjustments to the dimensions of the superellipse in terms of rotation, minor and major axis length could be made when applied in continental scales to keep the pixel matching consistent. Nevertheless, the distortion introduced by the sub-state size of the study area presented here was assumed insignificant and therefore the superellipse method had high utility.
To better appreciate the strong positive correlation (r = 0.74) between the two hotspot products for concurrent detections (Fig. 10), variations in addition to the gridding systems should be considered. For example, while both products implement the same FRP calculation algorithm (Wooster et al. 2003), they each derive the background radiation differently during the hotspot detection stage. Background radiation is an important input in the model developed by Wooster et al. (2003), and therefore it greatly affects the final FRP estimation. BRIGHT_AHI utilises a series of dynamic seasonal, bioregional, and time-of-day thresholds to derive the background radiation for a given hotspot, whereas MOD14/MYD14 uses only spatially neighbouring ‘ambient’ pixels from a single scene to separate the radiation from a fire hotspot from the radiation of the background. Furthermore, the fact that multiple MOD14/MYD14 observations are aggregated and compared to a single BRIGHT_AHI observation can exacerbate the differences in FRP magnitude that are caused by the difference in spatial resolution between AHI and MODIS. An example of this is the saturation at around 950 MW for BRIGHT_AHI FRP that is attributed to the MIR AHI channel saturation at 400 K (Hall et al. 2019), but also worsens through the MOD14/MYD14 aggregation, amplifying the positive bias towards the latter (Fig. 10).
Finally, the fire spread patterns derived by the two products using the first ignition per pixel analysis revealed similar insights about the black summer fire season. Both datasets suggest that the fire started in the north and spread towards the south and south-east of the study area over time, following the findings of Zheng et al. (2021). Our findings also indicate that most ignitions occurred in the south of the study area towards the end of December. This peak of ignitions corresponds to the South East Corner bioregion, which shows a low number of hotspots during daytime in December, but a large increase of hotspot number, mean and integrated FRP during the night-time (Fig. 6) that is in agreement with the high night-time activity in East Victoria as documented by Zheng et al. (2021).
Several studies have compared and combined GEO and LEO FRP products that focus on biomass burning emissions (Freeborn et al. 2009; Li et al. 2018, 2019; Mota and Wooster 2018; Zhang et al. 2020). However, fewer studies focused on the intercomparison of FRP estimations from GEO and LEO sensors (Hyer et al. 2013; Xu et al. 2017, 2021). AHI and MOD14/MYD14 were compared in the work by Xu et al. (2017), which was conducted for the whole disk for a single month (June 2015) and a hotspot aggregation to 0.5° grid cells or specific fire event clusters spatial scales. In addition, Xu et al. (2017) used the FTA algorithm (Wooster et al. 2015) to calculate the FRP from AHI data (FTA_AHI). These aggregations may be sufficient for extracting general differences and trends, however, in this study we also used AHI’s native resolution to perform pixel-to-pixel overlap comparison. A higher resolution comparison allows for more detailed information about fire activity and how it is captured by different sensors to be produced.
As shown by Engel et al. (2021a), the regionally tuned BRIGHT_AHI performs slightly better in terms of omission and commission errors compared to FTA_AHI, which uses global assumptions (Xu et al. 2017). The statistics provided for the FRP value comparison in terms of concurrently observed fire event clusters suggest an almost perfect association between the two datasets used by Xu et al. (2017) with a slope of 0.99 and an R2 = 0.98. We found a 1.29 slope for the fitted linear model through the origin and a Pearson’s r = 0.49 (R2 = 0.24), suggesting a low/moderate association with a clear underestimation of FRP for MOD14/MYD14 when it comes to concurrently observed hotspots in the spatial extend of superclusters. When the data are compared on a fire supercluster level without a concurrency constraint, the association becomes stronger (r = 0.67, R2 = 0.45), but the bias increases with a 1.38 slope for the fitted linear model towards BRIGHT_AHI (Fig. 9) as a result of temporal resolution differences.
On the grid cell level, BRIGHT_AHI seems to perform better than FTA_AHI when both datasets are compared to MOD14/MYD14. Using a 0.5° grid cell aggregation, Xu et al. (2017) found a slope of 0.54 for the fitted linear model. Meanwhile here, BRIGHT_AHI shows a slope of 0.87 and a Pearson’s r of 0.74 (R2 = 0.55) on the pixel-by-pixel comparison with MOD14/MYD14 (Fig. 9), in an approximately 20 times finer resolution grid than the one used in Xu et al. (2017). The differences between BRIGHT_AHI and FTA_AHI in this context could be also be explained due to the fact that Xu et al. (2017) used a shorter time period (1 vs 5 months), for different intensity events (mainly agricultural fires vs megafires), over a larger area (East Asia and Australia vs a sub-region of Australia). More research is needed to draw robust conclusions on algorithm suitability in different conditions.
Conclusions
The aim of this paper was to explore the capabilities and limitations of newly developed geostationary products for fire monitoring. FRP estimations from BRIGHT_AHI were compared to the widely used FRP retrievals from MOD14/MYD14 during the extreme Black Summer Fires that devasted South-Eastern Australia in 2019–2020. Intercomparison on a pixel level revealed a strong association between the two, something that increases the confidence of BRIGHT_AHI, whereas focusing on the temporal variability of FRP showcased an increased utility value when time dense measurements are available. Our findings suggest that geostationary products can be used in fire monitoring contexts which will also help enhance our understanding of wildfire dynamics from space.
Data availability
Data are available upon request.
Conflicts of interest
The authors declare no conflicts of interest.
Declaration of funding
The support of the Commonwealth of Australia through the SmartSat Cooperative Research Centre is acknowledged. K. C.-V. is supported by a Research Stipend Scholarship from RMIT University Australia.
Acknowledgements
The support of the Commonwealth of Australia through the Bushfire and Natural Hazards Cooperative Research Centre is acknowledged. We would like to thank S. Ramsey and N. Trihantoro for the fire supercluster dataset that they provided.
References
DAWE (2000) Revision of the Interim Biogeographic Regionalisation for Australia (IBRA) and Development of Version 5.1 – Summary report. Department of Agriculture, Water and the Environment, Australian Government, (Canberra, Australia). Available at https://www.environment.gov.au/system/files/resources/401ff882-fc13-49cd-81fe-bc127d16ced1/files/revision-ibra-development-5-1-summary-report.pdfDAWR (2018) Australia’s State of the Forests Report 2018 – Executive summary. Department of Agriculture and Water Resources. Australian Government, Canberra, ACT, Australia.
| Crossref |
Engel CB, Jones SD, Reinke KJ (2021a) Real-time detection of daytime and night-time fire hotspots from geostationary satellites. Remote Sensing 13, 1627
| Real-time detection of daytime and night-time fire hotspots from geostationary satellites.Crossref | GoogleScholarGoogle Scholar |
Engel CB, Jones SD, Reinke K (2021b) A seasonal-window ensemble-based thresholding technique used to detect active fires in geostationary remotely sensed data. IEEE Transactions on Geoscience and Remote Sensing 59, 4947–4956.
| A seasonal-window ensemble-based thresholding technique used to detect active fires in geostationary remotely sensed data.Crossref | GoogleScholarGoogle Scholar |
FEER (2021) MODFIRE Dataset. Fire Energetics and Emissions Research NASA. Available at https://feer.gsfc.nasa.gov/data/frp/
Filkov AI, Ngo T, Matthews S, Telfer S, Penman TD (2020) Impact of Australia’s catastrophic 2019/20 bushfire season on communities and environment. Retrospective analysis and current trends. Journal of Safety Science and Resilience 1, 44–56.
| Impact of Australia’s catastrophic 2019/20 bushfire season on communities and environment. Retrospective analysis and current trends.Crossref | GoogleScholarGoogle Scholar |
Freeborn PH, Wooster MJ, Roberts G, Malamud BD, Xu W (2009) Development of a virtual active fire product for Africa through a synthesis of geostationary and polar orbiting satellite data. Remote Sensing of Environment 113, 1700–1711.
| Development of a virtual active fire product for Africa through a synthesis of geostationary and polar orbiting satellite data.Crossref | GoogleScholarGoogle Scholar |
Freeborn PH, Wooster MJ, Roberts G, Xu W (2014a) Evaluating the SEVIRI fire thermal anomaly detection algorithm across the Central African Republic using the MODIS active fire product. Remote Sensing 6, 1890–1917.
| Evaluating the SEVIRI fire thermal anomaly detection algorithm across the Central African Republic using the MODIS active fire product.Crossref | GoogleScholarGoogle Scholar |
Freeborn PH, Wooster MJ, Roy DP, Cochrane MA (2014b) Quantification of MODIS fire radiative power (FRP) measurement uncertainty for use in satellite-based active fire characterization and biomass burning estimation. Geophysical Research Letters 41, 1988–1994.
| Quantification of MODIS fire radiative power (FRP) measurement uncertainty for use in satellite-based active fire characterization and biomass burning estimation.Crossref | GoogleScholarGoogle Scholar |
Fryirs KA, Cowley KL, Hejl N, Chariton A, Christiansen N, Dudaniec RY, Farebrother W, Hardwick L, Ralph T, Stow A, Hose G (2021) Extent and effect of the 2019–20 Australian bushfires on upland peat swamps in the Blue Mountains, NSW. International Journal of Wildland Fire 30, 294
| Extent and effect of the 2019–20 Australian bushfires on upland peat swamps in the Blue Mountains, NSW.Crossref | GoogleScholarGoogle Scholar |
Fu Y, Li R, Wang X, Bergeron Y, Valeria O, Chavardès RD, Wang Y, Hu J (2020) Fire detection and fire radiative power in forests and low-biomass lands in northeast Asia: MODIS versus VIIRS fire products. Remote Sensing 12, 2870
| Fire detection and fire radiative power in forests and low-biomass lands in northeast Asia: MODIS versus VIIRS fire products.Crossref | GoogleScholarGoogle Scholar |
Gibson R, Danaher T, Hehir W, Collins L (2020) A remote sensing approach to mapping fire severity in south-eastern Australia using sentinel 2 and random forest. Remote Sensing of Environment 240, 111702
| A remote sensing approach to mapping fire severity in south-eastern Australia using sentinel 2 and random forest.Crossref | GoogleScholarGoogle Scholar |
Giglio L, Schroeder W, Justice CO (2016) The collection 6 MODIS active fire detection algorithm and fire products. Remote Sensing of Environment 178, 31–41.
| The collection 6 MODIS active fire detection algorithm and fire products.Crossref | GoogleScholarGoogle Scholar | 30158718PubMed |
Giglio L, Boschetti L, Roy DP, Humber ML, Justice CO (2018) The Collection 6 MODIS burned area mapping algorithm and product. Remote Sensing of Environment 217, 72–85.
| The Collection 6 MODIS burned area mapping algorithm and product.Crossref | GoogleScholarGoogle Scholar | 30220740PubMed |
Giglio L, Schroeder W, Hall JV, Justice CO (2021) MODIS Collection 6 and Collection 6.1 Active Fire Product User’s Guide. Available at http://maps.geog.umd.edu/products/MODIS_Fire_Users_Guide_2.3.pdf
Godfree RC, Knerr N, Encinas-Viso F, Albrecht D, Bush D, Christine Cargill D, Clements M, Gueidan C, Guja LK, Harwood T, Joseph L, Lepschi B, Nargar K, Schmidt-Lebuhn A, Broadhurst LM (2021) Implications of the 2019–2020 megafires for the biogeography and conservation of Australian vegetation. Nature Communications 12, 1023
| Implications of the 2019–2020 megafires for the biogeography and conservation of Australian vegetation.Crossref | GoogleScholarGoogle Scholar | 33589628PubMed |
Gridgeman NT (1970) Lamé Ovals. The Mathematical Gazette 54, 31–37.
| Lamé Ovals.Crossref | GoogleScholarGoogle Scholar |
Hall JV, Zhang R, Schroeder W, Huang C, Giglio L (2019) Validation of GOES-16 ABI and MSG SEVIRI active fire products. International Journal of Applied Earth Observation and Geoinformation 83, 101928
| Validation of GOES-16 ABI and MSG SEVIRI active fire products.Crossref | GoogleScholarGoogle Scholar |
Hyer EJ, Reid JS, Prins EM, Hoffman JP, Schmidt CC, Miettinen JI, Giglio L (2013) Patterns of fire activity over Indonesia and Malaysia from polar and geostationary satellite observations. Atmospheric Research 122, 504–519.
| Patterns of fire activity over Indonesia and Malaysia from polar and geostationary satellite observations.Crossref | GoogleScholarGoogle Scholar |
Ichoku C, Ellison L (2014) Global top-down smoke-aerosol emissions estimation using satellite fire radiative power measurements. Atmospheric Chemistry and Physics 14, 6643–6667.
| Global top-down smoke-aerosol emissions estimation using satellite fire radiative power measurements.Crossref | GoogleScholarGoogle Scholar |
Ichoku C, Kaufman YJ (2005) A method to derive smoke emission rates from MODIS fire radiative energy measurements. IEEE Transactions on Geoscience and Remote Sensing 43, 2636–2649.
| A method to derive smoke emission rates from MODIS fire radiative energy measurements.Crossref | GoogleScholarGoogle Scholar |
Li F, Zhang X, Kondragunta S, Roy DP (2018) Investigation of the Fire Radiative Energy Biomass Combustion Coefficient: a comparison of polar and geostationary satellite retrievals over the conterminous United States. Journal of Geophysical Research: Biogeosciences 123, 722–739.
| Investigation of the Fire Radiative Energy Biomass Combustion Coefficient: a comparison of polar and geostationary satellite retrievals over the conterminous United States.Crossref | GoogleScholarGoogle Scholar |
Li F, Zhang X, Roy DP, Kondragunta S (2019) Estimation of biomass-burning emissions by fusing the fire radiative power retrievals from polar-orbiting and geostationary satellites across the conterminous United States. Atmospheric Environment 211, 274–287.
| Estimation of biomass-burning emissions by fusing the fire radiative power retrievals from polar-orbiting and geostationary satellites across the conterminous United States.Crossref | GoogleScholarGoogle Scholar |
Lizundia-Loiola J, Otón G, Ramo R, Chuvieco E (2020) A spatio-temporal active-fire clustering approach for global burned area mapping at 250 m from MODIS data. Remote Sensing of Environment 236, 111493
| A spatio-temporal active-fire clustering approach for global burned area mapping at 250 m from MODIS data.Crossref | GoogleScholarGoogle Scholar |
Mota B, Wooster MJ (2018) A new top-down approach for directly estimating biomass burning emissions and fuel consumption rates and totals from geostationary satellite fire radiative power (FRP). Remote Sensing of Environment 206, 45–62.
| A new top-down approach for directly estimating biomass burning emissions and fuel consumption rates and totals from geostationary satellite fire radiative power (FRP).Crossref | GoogleScholarGoogle Scholar |
Nguyen HM, Wooster MJ (2020) Advances in the estimation of high Spatio-temporal resolution pan-African top-down biomass burning emissions made using geostationary fire radiative power (FRP) and MAIAC aerosol optical depth (AOD) data. Remote Sensing of Environment 248, 111971
| Advances in the estimation of high Spatio-temporal resolution pan-African top-down biomass burning emissions made using geostationary fire radiative power (FRP) and MAIAC aerosol optical depth (AOD) data.Crossref | GoogleScholarGoogle Scholar |
Ramsey S, Reinke K, Trihantoro N, Jones S, Engel C (2021) Kangaroo island Black Summer 2019–2020 fire reconstruction. Bushfire and Natural Hazards CRC, Melbourne, Vic., Australia. Available at https://www.bnhcrc.com.au/publications/biblio/bnh-8129
Roberts G, Wooster MJ, Xu W, Freeborn PH, Morcrette JJ, Jones L, Benedetti A, Jiangping H, Fisher D, Kaiser JW (2015) LSA SAF Meteosat FRP products-Part 2: evaluation and demonstration for use in the Copernicus Atmosphere Monitoring Service (CAMS). Atmospheric Chemistry and Physics 15, 13241–13267.
| LSA SAF Meteosat FRP products-Part 2: evaluation and demonstration for use in the Copernicus Atmosphere Monitoring Service (CAMS).Crossref | GoogleScholarGoogle Scholar |
Roy DP, Huang H, Boschetti L, Giglio L, Yan L, Zhang HH, Li Z (2019) Landsat-8 and Sentinel-2 burned area mapping – a combined sensor multi-temporal change detection approach. Remote Sensing of Environment 231, 111254
| Landsat-8 and Sentinel-2 burned area mapping – a combined sensor multi-temporal change detection approach.Crossref | GoogleScholarGoogle Scholar |
Shen Y, Jiang C, Chan KL, Hu C, Yao L (2021) Estimation of field-level NOx emissions from crop residue burning using remote sensing data : a case study in Hubei, China. Remote Sensing 13, 404
| Estimation of field-level NOx emissions from crop residue burning using remote sensing data : a case study in Hubei, China.Crossref | GoogleScholarGoogle Scholar |
Wickramasinghe C, Wallace L, Reinke K, Jones S (2020) Intercomparison of Himawari-8 AHI-FSA with MODIS and VIIRS active fire products. International Journal of Digital Earth 13, 457–473.
| Intercomparison of Himawari-8 AHI-FSA with MODIS and VIIRS active fire products.Crossref | GoogleScholarGoogle Scholar |
Wintle BA, Legge S, Woinarski JCZ (2020) After the megafires: what next for Australian wildlife? Trends in Ecology and Evolution 35, 753–757.
| After the megafires: what next for Australian wildlife?Crossref | GoogleScholarGoogle Scholar | 32680597PubMed |
Wooster MJ, Zhukov B, Oertel D (2003) Fire radiative energy for quantitative study of biomass burning: derivation from the BIRD experimental satellite and comparison to MODIS fire products. Remote Sensing of Environment 86, 83–107.
| Fire radiative energy for quantitative study of biomass burning: derivation from the BIRD experimental satellite and comparison to MODIS fire products.Crossref | GoogleScholarGoogle Scholar |
Wooster MJ, Roberts G, Perry GLW, Kaufman YJ (2005) Retrieval of biomass combustion rates and totals from fire radiative power observations: FRP derivation and calibration relationships between biomass consumption and fire radiative energy release. Journal of Geophysical Research Atmospheres 110, 1–24.
| Retrieval of biomass combustion rates and totals from fire radiative power observations: FRP derivation and calibration relationships between biomass consumption and fire radiative energy release.Crossref | GoogleScholarGoogle Scholar |
Wooster MJ, Roberts G, Freeborn PH, Xu W, Govaerts Y, Beeby R, He J, Lattanzio A, Fisher D, Mullen R (2015) LSA SAF Meteosat FRP products. Part 1: algorithms, product contents, and analysis. Atmospheric Chemistry and Physics 15, 13217–13239.
| LSA SAF Meteosat FRP products. Part 1: algorithms, product contents, and analysis.Crossref | GoogleScholarGoogle Scholar |
Xu W, Wooster MJ, Kaneko T, He J, Zhang T, Fisher D (2017) Major advances in geostationary fire radiative power (FRP) retrieval over Asia and Australia stemming from use of Himarawi-8 AHI. Remote Sensing of Environment 193, 138–149.
| Major advances in geostationary fire radiative power (FRP) retrieval over Asia and Australia stemming from use of Himarawi-8 AHI.Crossref | GoogleScholarGoogle Scholar |
Xu W, Wooster MJ, He J, Zhang T (2021) Improvements in high-temporal resolution active fire detection and FRP retrieval over the Americas using GOES-16 ABI with the geostationary Fire Thermal Anomaly (FTA) algorithm. Science of Remote Sensing 3, 100016
| Improvements in high-temporal resolution active fire detection and FRP retrieval over the Americas using GOES-16 ABI with the geostationary Fire Thermal Anomaly (FTA) algorithm.Crossref | GoogleScholarGoogle Scholar |
Zhang T, de Jong MC, Wooster MJ, Xu W, Wang L (2020) Trends in eastern China agricultural fire emissions derived from a combination of geostationary (Himawari) and polar (VIIRS) orbiter fire radiative power products. Atmospheric Chemistry and Physics 20, 10687–10705.
| Trends in eastern China agricultural fire emissions derived from a combination of geostationary (Himawari) and polar (VIIRS) orbiter fire radiative power products.Crossref | GoogleScholarGoogle Scholar |
Zheng Y, Liu J, Jian H, Fan X, Yan F (2021) Fire diurnal cycle derived from a combination of the Himawari-8 and VIIRS satellites to improve fire emission assessments in southeast Australia. Remote Sensing 13, 2852
| Fire diurnal cycle derived from a combination of the Himawari-8 and VIIRS satellites to improve fire emission assessments in southeast Australia.Crossref | GoogleScholarGoogle Scholar |