

Global hotspots of endemicity, rarity and speciation of aquatic macrophytes
Tatiana Lobato-de Magalhães A B * , Kevin Murphy C , Julissa Tapia Grimaldo C , Thomas A. Davidson D , Eugenio Molina-Navarro E , José Arturo de-Nova F and Andrey Efremov G
A
B
C
D
E
F
G
Abstract
Most aquatic macrophytes are ecozone-endemic species, and approximately two-thirds of them have rare occurrence at global scale. These small-range plants are seriously under-studied at macroecological scale, despite their marked vulnerability to extinction through habitat loss and climate change.
To identify global hotspots of endemism and rarity of aquatic macrophytes and examine the factors that resulted in speciation hotspots of macrophytes in some areas of the planet.
We analysed a database of 3499 macrophyte species to locate speciation hotspots and assess the biogeographic and environmental drivers that maintain ecozone-endemic, and globally rare species within their current limited global areas of occupancy.
Ecozone-endemic and globally rare macrophyte species hotspots across the planet showed similar occurrence patterns and drivers among ecozones. Ecozone environmental conditions, particularly harsh environments, influenced macrophyte phylogenetic diversity and structure. Most macrophyte species diversification is recent (<10 million years ago). A negative association with bird-mediated zoochory was seen for endemicity and rarity hotspots.
This study identified hotspots of endemicity and rarity, and potential cradle and museum speciation areas.
Our findings could inform global action to conserve the macrophyte diversity of wetlands, and other inland aquatic habitats, across the world.
Keywords: aquatic plants, diversification, ecozone-endemic, long-distance dispersal, phylogenetic diversity, range distribution, vicariance, globally rare species.
Introduction
Most vascular aquatic macrophytes (vascular plants large enough to see with the naked eye, that occur in inland freshwater and brackish waterbodies; Murphy et al. 2019) are ecozone-endemic species; >70% of the global pool of macrophyte species are endemic to only one of the eight recognised terrestrial world ecozones (Murphy et al. 2019; Lobato-de Magalhães et al. 2023). These small-range plants are seriously under-studied at macroecological scale, despite their vulnerability to extinction through anthropogenic factors such as habitat loss and global change (Zhang et al. 2017; Murphy et al. 2019; Alahuhta et al. 2021; García-Girón et al. 2021). Identifying the locations of speciation hotspots, defined both in taxonomic and phylogenetic terms, is crucial to improve the knowledge base needed to inform actions required to protect the macrophyte species of wetlands and other inland aquatic habitats (Murphy et al. 2019; Dagallier et al. 2020). The large-scale factors that control the distribution of ecozone-endemic (limited to a single world region) and globally rare (species with small global ranges) species remain poorly known for most groups of biota, despite the fact that such ‘small-ranged species constitute most of Earth’s species diversity’ (Sandel et al. 2011, p. 663). This statement is certainly correct for aquatic macrophytes (Murphy et al. 2019).
Rarity of a species within the overall biodiversity of the Earth, or at more local scales, is a notoriously difficult concept to define, being heavily dependent on factors such as local distribution, human sentiment, and legal frameworks for species protection (e.g. May 1995; Alahuhta et al. 2014). Rare species are not necessarily limited to a single region of the planet, but endemic species are. Endemism can occur at a range of geographic scales from very small to broad. For example, Murphy et al. (2019) gave an example of extreme endemism in freshwater plants, namely, Polypleurum longicaule M.Kato (Podostemaceae), which has a tiny world range of just 100 m2, its only known population being a waterfall near Udon Thani, north-eastern Thailand, in the Oriental ecozone. At a larger scale, a good example of a macrophyte species endemic to a single macroregion of a global ecozone is Myriophyllum limnophilum Orchard (Haloragaceae), which has a distribution limited to winter-ephemeral waterbodies and swamps in the Perth area of Western Australia, within the Australasia ecozone, and with a total world range of just over 1500 km2 (Murphy et al. 2019, 2020).
In some cases, the perceived rarity of a species can lead to outcomes where substantial effort and resources may be devoted to protecting a species which is rare at a local scale in one or more countries, but which is common at a world scale. A good example is Najas flexilis (Willd.) Rostk. & W.L.E. Schmidt (Hydrocharitaceae), which is a rare species in the British Isles, limited to ~70 lakes in Scotland and Ireland, and protected under the EC Habitats Directive, but which is a common species at a world scale, with a circumboreal range through the Palaearctic and Nearctic amounting to 34% of world grAH (total world grid-cell inland aquatic habitat area; Murphy et al. 2019), placing it in the top 5% of macrophyte world species-range size. Despite this fact, this species has received very substantial research and conservation effort in the British Isles over the past 20 years (e.g. Wingfield 2002; Murphy and Hall 2005; Wingfield et al. 2005, 2006; O’Connor 2013; Bishop et al. 2018, 2019; Bishop 2019; Waters-Hart 2020; Gunn and Carvalho 2021). The concept of ‘rare’ species could encompass several other combinations of factors, such as low abundance at widely separated sites, but here we focus on globally rare macrophytes, defined as those showing restricted total global range, namely, species being present in <5% of the total inland area of freshwater and brackish waterbodies across the Earth.
There are several potential factors that may influence the current distribution of macrophyte species, including endemic and rare species, at a global scale (Lobato-de Magalhães et al. 2023). The primary question of interest in this study is what are the biogeographic and environmental drivers that maintain ecozone-endemic, and globally rare, species within their current limited areas of occupancy across the planet? And how important are factors associated with species origin, and particularly ecozone-endemic speciation, in influencing current global species distributions of endemic and globally rare aquatic plants? In this paper, we particularly set out to assess the following four main hypotheses relevant to the macroecology of rare and endemic macrophyte species:
Hypothesis 1: endemic and rare macrophyte species show similar patterns of occurrence world-wide.
Hypothesis 2: macrophyte phylogenetic diversity is likely to be highest where growth conditions are harsh.
Hypothesis 3: current macrophyte distribution patterns are the result of recent events (occurring <10 million years ago, Ma).
Hypothesis 4: lack of long-distance dispersion vectors is more strongly associated with endemic and rare species occurrence than landscape or climatic factors influencing their ecology.
Methods
Endemic and rare macrophyte species
We used a database of 3499 macrophyte species occurring within the total world grid-cell inland aquatic-habitat area (world grAH, taken, from satellite imagery, as 3,141,662 km2; obviously, this value will fluctuate depending on seasonal and other factors, but it is the figure derived from available imagery-area values by Murphy et al. (2019), updated by Lobato-de Magalhães et al. (2023)). We exclude saline, hypersaline and soda-lake inland waterbodies from the dataset because aquatic macrophytes rarely or never occur in such waterbodies. Where appropriate, species were allocated ecozone-endemic or globally rare status, across 238 world grid cells, at a resolution of 10° latitude × 10° longitude.
In this research, we define endemism at a rather broad scale; ecozone-endemic species are limited in their distribution to only one of the eight terrestrial world ecozones that provide habitat for freshwater macrophytes (Neotropics (NEO); Afrotropics (AFR); Nearctic (NEA); Palaearctic (PAL); Orient (OR); Australasia (AUS); Pacific islands of Oceania (OCE); Antarctica and the sub-Antarctic islands (ANT)). Because of the extremely limited area of inland waterbodies that they provide for macrophyte growth, we do not here include Antarctica, and the Pacific islands making up Oceania, in calculating species range estimates; however, it should be noted that there are some macrophyte species endemic to these ecozones, and several species also found in one or more of the six main target ecozones also occur in one or both of these two ecozones. Examples of such endemics include Potamogeton marianensis Cham. & Schltdl. (Potamogetonaceae), an Oceania endemic, limited to Guam in the southern Mariana Islands, and Ranunculus moseleyi Hook.f. (Ranunculaceae) known only from sub-Antarctic islands including Kerguelen and the Prince Edward islands. We identify the main macroregions occupied by ecozone-endemic species of aquatic plants, for each of the six main target world ecozones (and we also do this for all macrophyte species present in OCE and ANT, in the absence of detailed range data). See also appendix A6 in Murphy et al. (2019) for more on this topic.
For ecozone-endemic species, the overall distribution of the species within the ecozone was classified in the following three categories:
Restricted endemic distribution (A): records confined to a single geographical area (a single macroregion or >1 contiguous macroregions), within the ecozone.
Disjunct endemic distribution (B): records present in two or more non-contiguous macroregions within the ecozone.
Cosmopolitan endemic distribution across ecozone (C): records present in all macroregions of the ecozone.
We examined the number of ecozone-endemic species within 92 families present in the world macrophyte pool. To identify endemicity hotspot grid cells, we analysed ecozone-endemic species distribution. We defined as an endemicity hotspot those grid cells with ≥50% of maximum recorded E species for each individual ecozone. The outcome was mapped to show the overall global pattern of occurrence of endemicity hotspots. In addition, we mapped the world grid-cell distribution of 26 individual genera that have at least 20 ecozone-endemic species to provide an indication of whereabouts on the planet generic hotspots of ecozone-endemicity are located.
For rare species, the overall distribution was classified in the following two categories:
Rare (R): species with world range of <5% world grAH (area of aquatic habitat present per grid cell: <157,083 km2). At grid-cell level, the percentage occurrence of all R species present in a grid cell was calculated (1) as a percentage of total number of macrophyte species present in the grid cell (%R), (2) as a percentage of the total ecozone pool of R species (%RE), and (3) as a percentage of the total world pool of R species (%RW).
Very rare (VR): within the Rare category, a subset of species was identified with world range of <1% (<31,417 km2).
We calculated the R species pool for each ecozone in terms of species origin, following the classification described in Lobato-de Magalhães et al. (2023), as follows:
Endemic (E): species limited to a single home ecozone.
Native (N): species occurring as native in at least two ecozones.
Introduced, naturalised and invasive species (I): species present in an ecozone as a result of anthropochorous propagule transfer from one or more other world ecozones.
Ecozone-endemic introduced (E(I)): species naturally occurring in only a single ecozone, but which have been spread to one or more additional ecozones by human-interference vectors; they are considered endemic in the original home ecozone and have I origin-status elsewhere.
Records were compiled for two-hundred thirty-eight 10 × 10° (latitude × longitude) grid cells covering the six target world ecozones, using ArcMap (ver. 9.3.1, ESRI, Redlands, CA, USA, see https://www.esri.com) for mapping purposes, following procedures described in detail by Murphy et al. (2019, 2020). For relevant world maps of predictor variables see Murphy et al. (2019, 2020); Lobato-de Magalhães et al. (2021, 2023).
Phylogenetic diversity
A phylogenetic tree for macrophyte species was constructed utilising the mega-phylogeny Phyto-Phylo from V.PhyloMaker using BLADJ scenario (see https://github.com/jinyizju/V.PhyloMaker; Qian and Jin 2016; Jin and Qian 2019). It is based on the phylogeny of Zanne et al. (2014) that was expanded to include all extant families of seed plants comprising 32,223 species. The time-calibrated phylogenetic tree was used to calculate abundance-weighted metrics of phylogenetic diversity in each grid cell. We calculated the standardised effect size of phylogenetic diversity sensu stricto (hereafter ses.PD). This metric represents the deviation, in branch length, of the phylogeny of all species (tips) occurring in each patch (Faith 1992), from branch length obtained from random shuffling phylogeny tree permuted 999 times (Swenson 2011). This deviation was standardised and then expressed in standard deviations by using the following equation:
where PDs is the total branch length in each patch, PDr is the branch length obtained from randomisations, and σr is the standard deviation from the randomised set (Webb et al. 2002). The mean pairwise phylogenetic distance (MPD) and the mean pairwise distance to the nearest taxon (MNTD) between species in the phylogeny were also calculated. Finally, we calculated the inverse of the standardised effect sizes of MPD and MNTD (ses.MPD and ses.MNTD), also known as net relatedness index (NRI) and nearest taxon index (NTI). The ses.MPD and ses.MNTD are calculated in an analogous manner, using the following expression:
where Ns is the average (NRI) or average nearest-taxon (NTI) distance in each patch, Nr is the average nearest-taxon distance obtained from a set of randomised samples (999 permutations), and σr is the standard deviation from the randomised set (Webb et al. 2002). Standardised metrics identify the relative excess (overdispersion) or deficit (clustering) in phylogenetic diversity for a given set of species for each grid cell relative to the species pool in the overall phylogenetic tree. Negative standardised metric values reflect relative species clustering, whereas positive values reflect relative overdispersion of species (Mazel et al. 2016). Significant phylogenetic clustering was detected when P-values of the standardised metrics were <0.05 (null hypothesis is over dispersed phylogeny). We used phylogenetic diversity indices to identify potential phylogenetic diversity hostpots (cradles and museums), comparing the values of MPD.obs.ps and MNTD.obs.P. A value of 0 indicates that the observation is lower than all null expectations (clustering), whereas a value of 0.5 indicates that the observation equals to the median of the null distribution (over dispersed). Cradles are grid cells where assemblages had a basal clustering and terminal dispersion (MPD.obs.P < 0.5 and MNTD.obs.P > 0.5); museums were grid cells where assemblages had a basal over-scattering and terminal clustering (MPD.obs.P < 0.5 and MNTD.obs.P > 0.5), following the proposed scheme of Mazel et al. (2016). All analyses were performed in R (ver. 4.0.5, R Foundation for Statistical Computing, Vienna, Austria, see https://www.R-project.org/).
Diversification rate analyses and speciation age
We used the time-calibrated phylogenetic tree to investigate the long-term diversification dynamics using the fit_bd function of the RPANDA package for phylogenetic analyses of diversification in R (ver. 2.3, see https://cran.r-project.org/package=RPANDA; Morlon et al. 2011, 2016). These analyses can evaluate the diversification dynamics of an entire phylogenetic tree, finding the parameters that maximise the likelihood associated with the model (Morlon et al. 2016), and can be used to test explicitly whether (and how) diversification rates variy through time (Morlon et al. 2011). We implemented the birth–death models that were originally considered by Nee et al. (1992) and are the basis of most diversification scenarios used today to explore macroevolutionary processes. We compared the following four different diversification scenarios: (1) pure birth model with a constant speciation rate (λ > 0), (2) birth–death model with a constant speciation rate (λ > 0) and a constant extinction rate (μ ≠ 0), (3) pure birth model with exponential variation (exp ≠ 0) in speciation rate (λ > 0), and (4) birth–death model with exponential variation (exp ≠ 0) in speciation rate (λ > 0) and constant extinction (μ ≠ 0). Model selection was performed with the second-order (corrected) Akaike information criterion (AICc) for small sample sizes (Burnham and Anderson 2002) by using the number of taxa as the number of observations, and a likelihood ratio test (LRT) was implemented for model comparison of nested models and to select the best. All analyses were performed in R (ver. 4.0.5, R Foundation for Statistical Computing).
Information on macrophyte age of speciation was extracted from the literature on molecular divergence times for plant speciation, primarily summarised by the TimeTree website (Kumar et al. 2017) and supplemented by data from additional sources (e.g. Les et al. 2003, 2015; Renner and Zhang 2004; Crawford et al. 2006; Estrada-Ruiz et al. 2009; Chen et al. 2012a, 2012b; Zhu et al. 2015; Tippery et al. 2018; Li et al. 2020). A note was made of estimated speciation age, given in the literature (where >1 age estimate is available, average values were calculated), and the plants were divided into two categories (Young: speciation age of <5.3 Ma, so of Pliocene or Pleistocene origin, and probably unlikely to be affected by ancient vicariance vectors for inter-ecozone transference; Old: speciation age of ≥5.3 Ma, so Miocene or earlier in origin, and with a higher possibility of ancient vicariance factors influencing their current distribution). Coverage is quite good for some genera (e.g. Nymphoides), but poor to non-existent for many. However, there are enough species with age data to give a reasonable sample in each ecozone of ecozone-native species older than 5.3 Ma, i.e. originating in the Miocene or earlier, and hence more likely to have experienced ancient vicariance distribution effects. The data were also used to calculate a predictor variable for use with BRT analyses, namely AGE, which is the mean age of species present per grid cell (Ma), see below.
Boosted regression-tree analysis (BRT)
We used 19 predictor variables in this research, as follows:
Four spatial or landscape variables: mid-grid-cell latitude (°) (LAT), mid-grid-cell absolute latitude (°) (ABS), mid-grid-cell longitude (LONG, °), altitude (average elevation above sea level, per grid cell (ALT), m ASL), area of inland aquatic habitat present per grid cell (grAH, km2), percentage of agricultural land cover per grid cell (CROP) (Sandel et al. 2011; Fick and Hijmans 2017; Trabucco and Zomer 2019).
Nine current climatic variables: potential evapotranspiration (Et0, mm), aridity index (AI), average annual temperature (TYR, °C), maximum temperature of warmest month (TMX, °C), maximum temperature of warmest month – minimum temperature of coldest month (TRG, °C), average temperature of driest quarter (TDRY, °C), annual precipitation (PCP, mm), precipitation of driest quarter (PCPDR, mm), precipitation seasonality (PCPS, coefficient of variation of monthly precipitation).
Six other variables: historic (Late Quaternary) climate change velocity (CCV, m year−1); mean age of species present per grid cell, potentially implying effects of ancient vicariance on world distribution for old species (AGE, Ma); information on macrophyte species closely associated with migratory birds, mainly herbivorous waterfowl, which were identified where suitable data were available (BIRD vector) (see Lobato-de Magalhães et al. 2023 for more detail); world distribution possibly aided by inter-ecozone hydrochorous movement in rivers (HYD); and likely recent human vectors affecting distribution – introduced, naturalised and invasive species (I).
All predictor variables are continuous, except hydrochory (HYD) and introduced, naturalised and invasive species (I), for which we used binary data. For full methodology used in compiling these variables, see Lobato-de Magalhães et al. (2023).
The data were used to predict outcomes for four response variables measured at grid-cell level, namely percentage of endemic species present in the grid-cell flora (%E), percentage of globally rare species present in the grid-cell flora (%R), number of globally rare species present in the grid-cell flora (R) and percentage of globally rare species within the ecozone total species pool (%RE), and the three phylogenetic diversity metrics (ses.PD, ses.MPD, ses.MNTD) for species present in the macrophyte assemblage of each of the 238 grid cells, using boosted regression-tree (BRT) analyses. Following the guidelines of Elith et al. (2008), tree complexity and learning rates were set to ensure at least 5000 trees in the analysis. Tree complexity was set at three, with a learning rate of 0.003, and with the bag fraction set at 0.75. Results of the simplified trees are presented. The trees were simplified by use of a cost-complexity measure where the least important variable was sequentially dropped from the analysis to eliminate non-influential predictors and assess the loss in predictive power. The process was stopped if there was a loss in predictive power larger than a standard error of the original model. The predictors that are retained in the simplified model are therefore considered significant predictors. Partial dependence plots of fitted diversity function v. observed values for variables significantly predicting the response variables are provided to present the influence uniquely attributable to a single predictor. BRT analysis was performed using the gbm package (ver. 2.1.5, B. Greenwell, B. Boehmke and J. Cunningham, see https://cran.r-project.org/package=gbm) with additional code from Elith et al. (2008) in R (ver. 4.0.5, R Foundation for Statistical Computing).
Results
Endemic macrophyte species
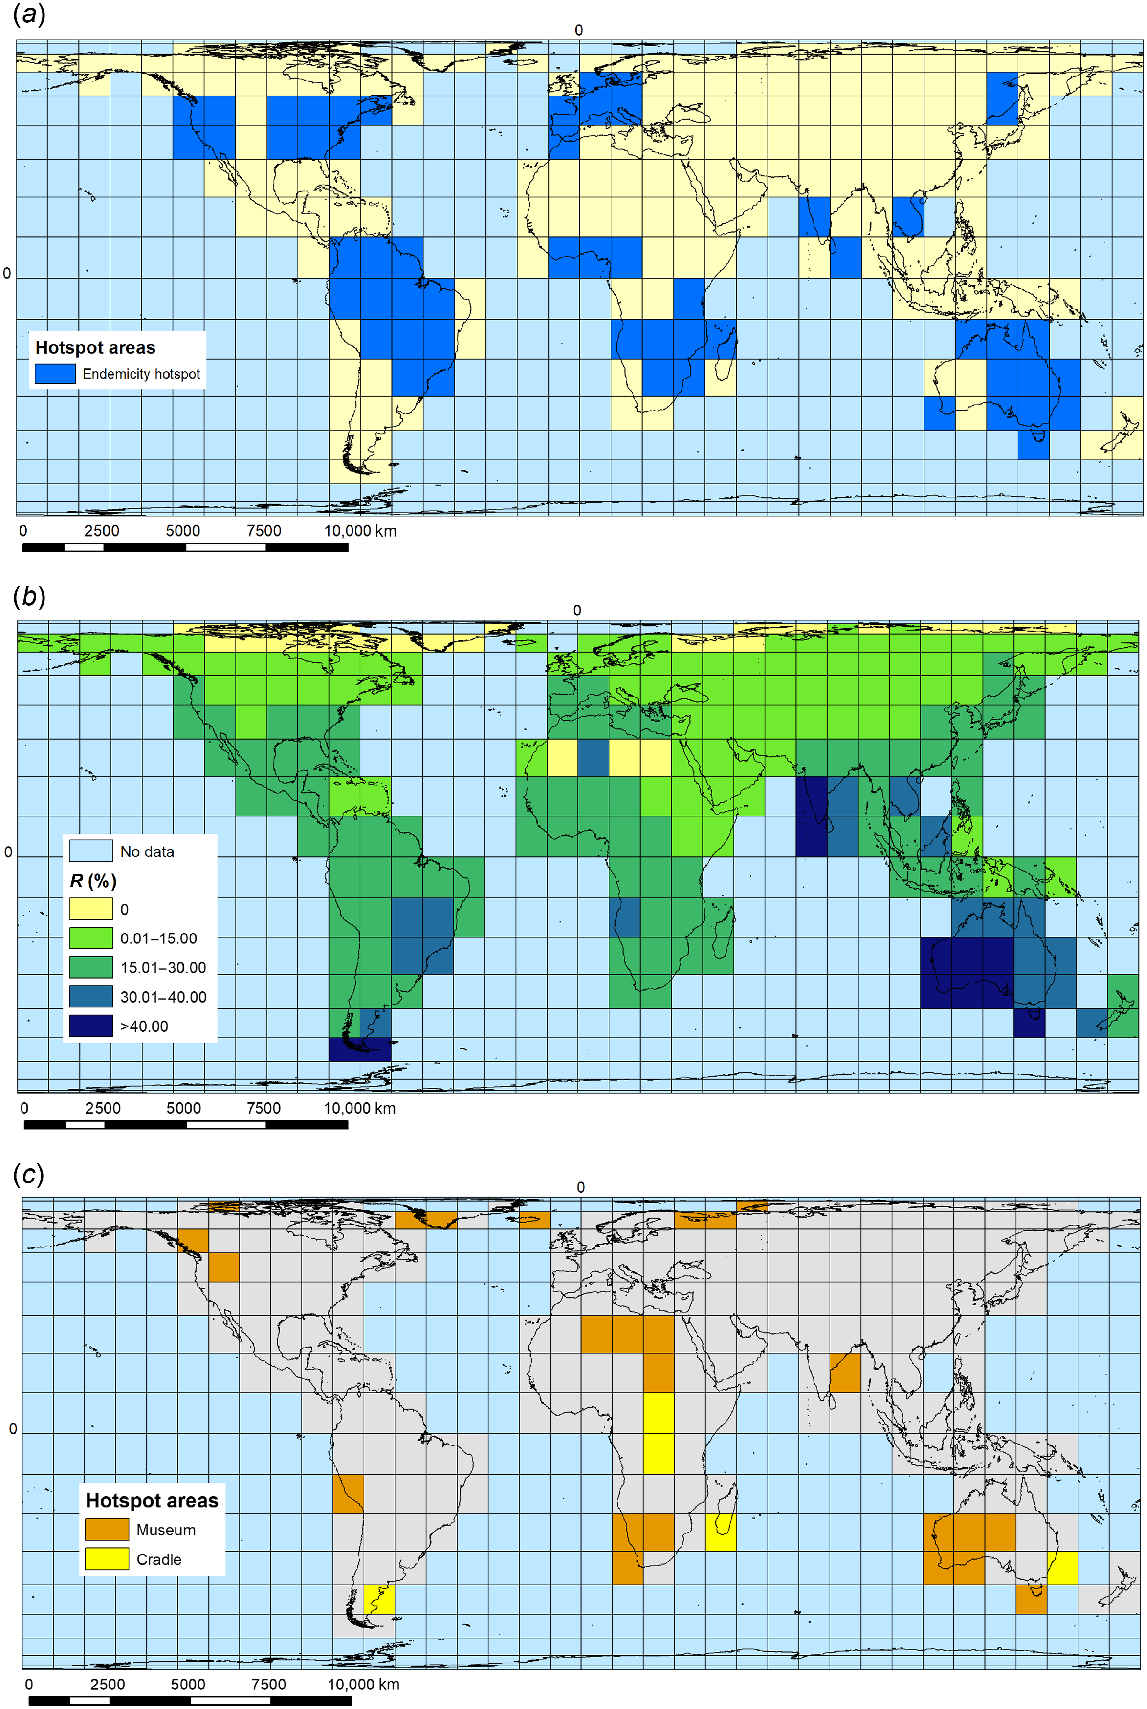
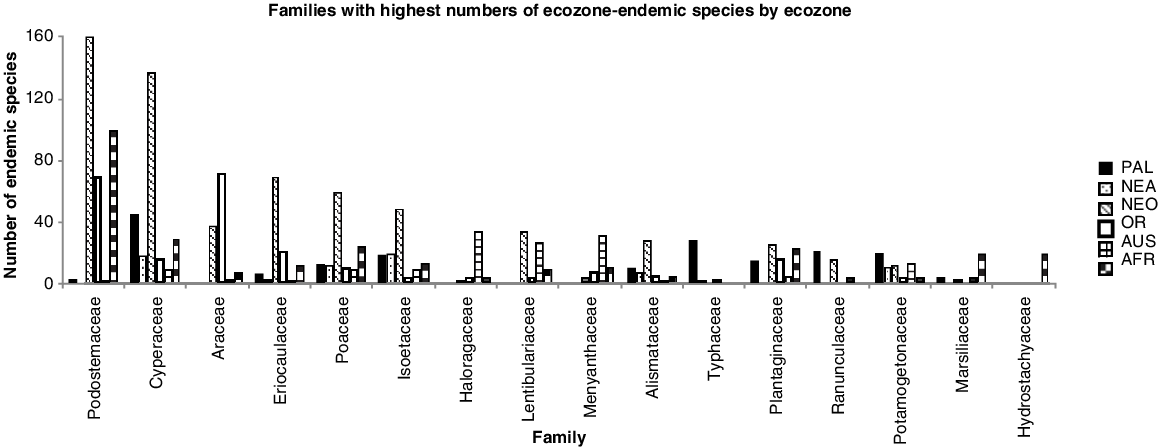
Ecozone-endemic macrophytes make up the biggest set of species within the global pool of 3499 macrophyte species examined here, with 2491 species showing single-ecozone endemic natural global distributions (E or E(I) species), although with substantial differences among the six main world ecozones that support macrophytes in inland freshwater and brackish waterbodies (Nearctic, 196; Australasia, 239; Palaearctic, 318; Orient, 321; Afrotropics, 475; Neotropics, 942 ecozone-endemic species, including E(I) species occurrences in their home ecozone). We highlighted ecozone-endemic species hotspot grid cells defined as having ≥50% of maximum recorded grid-cell endemic diversity for ecozone (number of ecozone endemic species per grid cell divided by the maximum number of endemics recorded for any grid cell in the ecozone) (Fig. 1a). In addition, there is one macrophyte species endemic to the Antarctica–sub-Antarctic island ecozone, and another nine endemic species to one or more of the Pacific island groups making up Oceania, one of these (Podocarpaceae) representing an additional macrophyte family over and above those present in the six main world ecozones studied. From 94 families present in the world macrophyte pool (for all eight world terrestrial ecozones), 20 families had no ecozone-endemic species in any ecozones targeted in this study. Of the remainder, 16 families had ≥20 endemic species present in at least one ecozone (Fig. 2). The Neotropical ecozone is of outstanding importance for ecozone-endemicity, with half of these 16 families having their greatest number of endemic species present in this ecozone.
Macrophyte-diversity hotspots: (a) ecozone-endemic species occurrence, showing hotspot grid cells in each ecozone (defined per ecozone as having ≥50% of maximum recorded grid-cell endemic diversity for the ecozone), (b) percentage occurrence per grid cell of all rare (R) species (with world distribution of ≤5% world grAH) (%R), (c) cradle and museum speciation hotspots. Cradles are grid cells where assemblages have a basal clustering and terminal dispersion (mpd.obs.P < 0.5 and mntd.obs.P > 0.5); museums are grid cells where assemblages have a basal over-scattering and terminal clustering (mpd.obs.P > 0.5 and mntd.obs.P < 0.5).
Families with highest numbers of ecozone-endemic species by ecozone. PAL, Palaearctic; NEA, Nearctic; NEO, Neotropics; OR, Orient; AUS, Australasia; AFR, Afrotropics.
Comparisons were made among ecozones for the proportion of A, B and C categories of endemic-species distribution within ecozones (Supplementary Fig. S1). There are substantial differences between the ecozones, although in all cases the distribution of endemic species within the ecozone is dominated by Category A species, showing restricted distribution, confined to only one part of the ecozone, most prominently so in the Orient. The proportion of species showing a disjunct distribution (Category B) within the macroregions making up the ecozone shows a seven-fold difference across the ecoregions, with less than 5% of endemic species following this pattern in the Orient, rising to >30% in Australasia. Endemic species showing cosmopolitan distribution (Category C) across the ecozone are absent to rare in all ecozones, and even in Australasia, account for <3% of the endemic species occurring in the ecozone.
We identify a global pattern of occurrence of endemicity hotspots for ecozone-endemic macrophyte species in 26 individual genera (Fig. 3). All but three of these genera are single aquatic representatives of their family, except for Lythraceae (with two genera), Cyperaceae (four), and Podostemaceae (five), emphasising the importance of these three families for overall global macrophyte endemicity. Most of the target genera (17) have all their endemic-species hotspots located in a single ecozone; three genera show two-ecozone endemic species hotspot distributions. The remaining six genera have multi-ecozone endemic diversity hotspots (Table 1).
Maps showing locations of endemic species hotspots (grid cells with ≥5 endemic species of the genus present) for 26 individual macrophyte genera. Position of Greenwich Meridian (0° longitude) and Equator (0° latitude) marked as ‘0’ on maps. Scale bars are indicative only, referring to average longitudinal distance on the map: (a) Apinagia, (b) Aponogeton, (c) Callitriche, (d) Carex, (e) Cryptocoryne, (f) Cuphea, (g) Cyperus, (h) Echinodorus, (i) Elatine, (j) Eleocharis, (k) Eriocaulon, (l) Inversodicraea, (m) Isoetes, (n) Ledermaniella, (o) Marathrum, (p) Marsilea, (q) Myriophyllum, (r) Nymphaea, (s) Nymphoides, (t) Potamogeton, (u) Ranunculus, (v) Rhyncholacis, (w) Rhynchospora, (x) Rotala, (y) Typha, and (z) Utricularia.
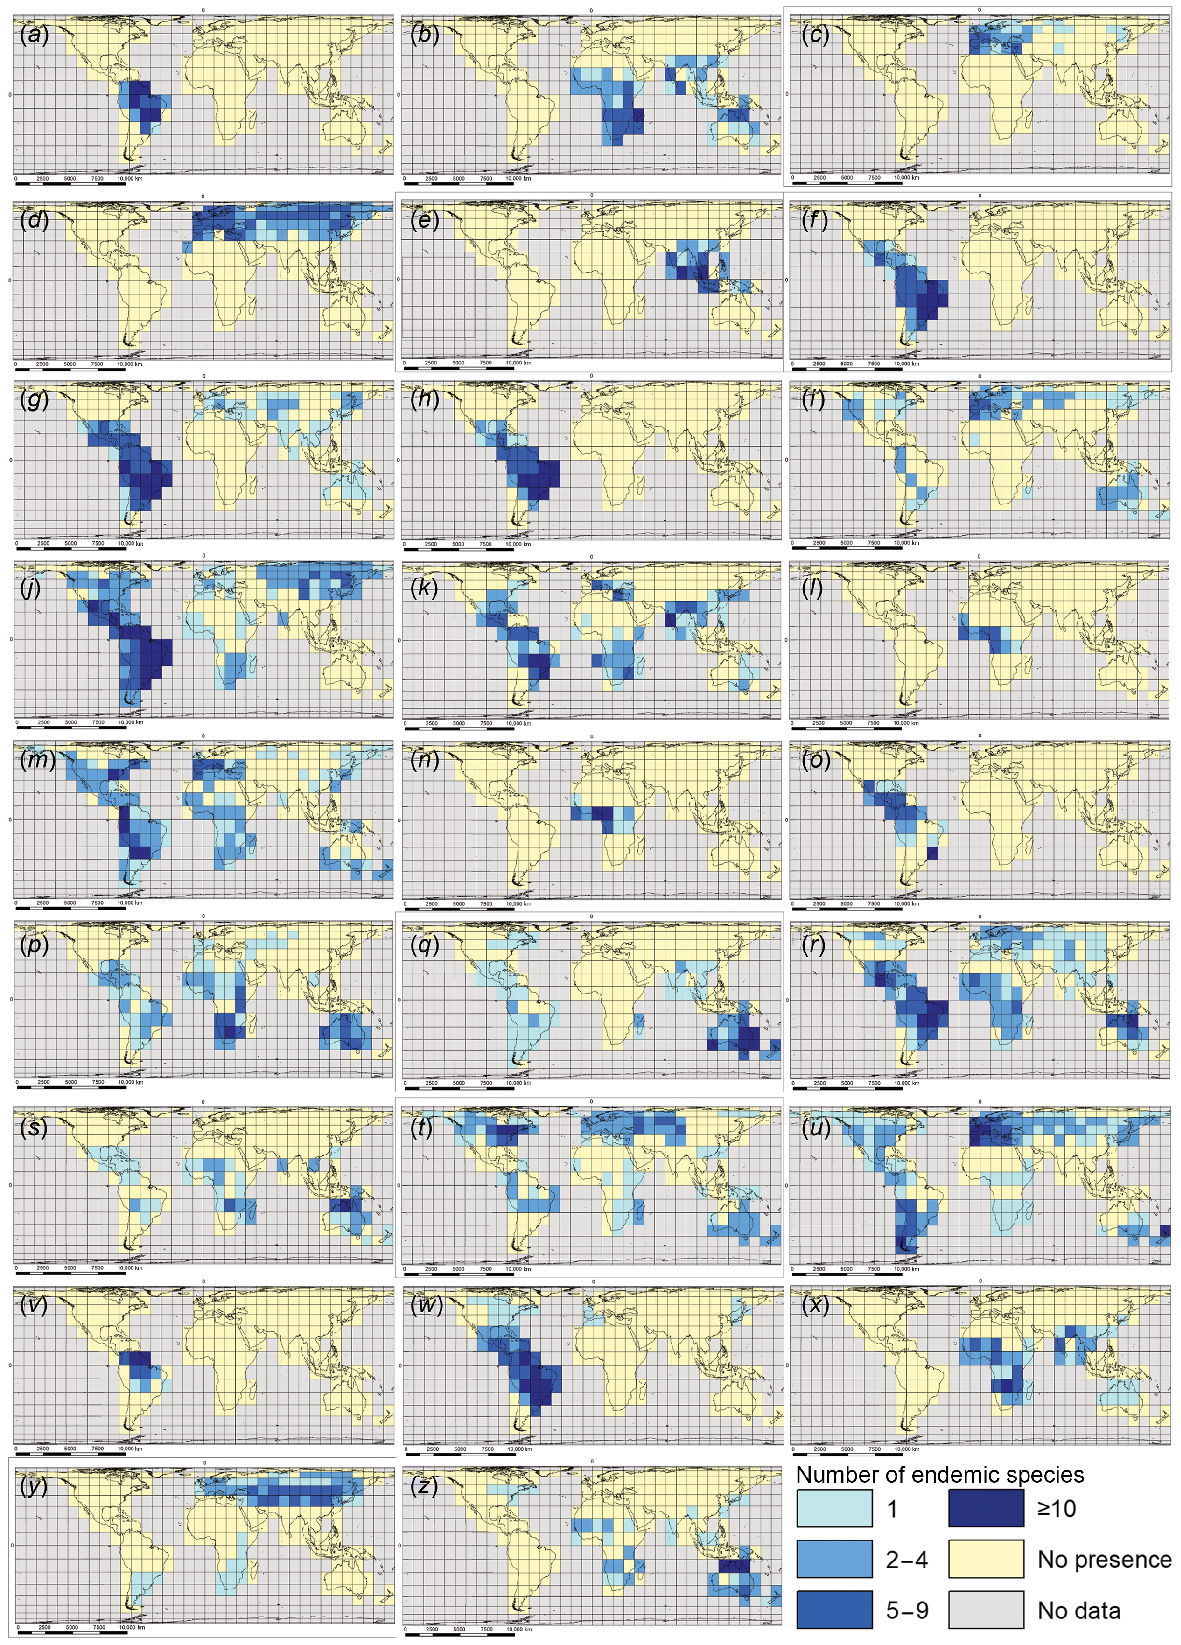
| Genera with endemic species hotspots located in a single ecozone (17) | Genera with two-ecozone endemic species hotspot distributions (3) | Genera with multi-ecozone endemic diversity hotspots (6) | |
|---|---|---|---|
| OR: Cryptocoryne AUS: Myriophyllum, Nymphoides; AFR: Marsilea, Ledermaniella, Inversodicraea PAL: Callitriche, Carex, Typha, Elatine NEO: Apinagia, Cuphea, Cyperus, Marathrum, Echinodorus, Rhyncholacis, Rhynchospora | PAL and NEO: Ranunculus OR and AFR: Rotala AUS and NEO: Utricularia | NEA, NEO and AUS: Potamogeton OR, AUS and AFR: Aponogeton NEA, NEO and PAL: Isoetes, Eleocharis NEO, AFR and AUS: Nymphaea NEO, AFR, OR and PAL: Eriocaulon |
NEO, Neotropics; AFR, Afrotropics; NEA, Nearctic; PAL, Palaearctic; OR, Orient; AUS, Australasia.
Rare macrophyte species
Most, but not all, ecozone-endemic macrophytes are rare at world scale. We found a total pool of rare macrophytes of 2296 species (world ranges of 1–5% world grAH) (Fig. 1b), with 1194 of these being classed as ‘very rare’ (world ranges of <1% world grAH) (Table 2) (Supplementary Fig. S2). In all six of the ecozones providing most of the world’s inland aquatic habitat, endemics make up the main component of the rare macrophyte flora, but there are substantial differences among ecozones, both in total number of rare species present (ranging from just 9 occurring in Antarctica–sub-Antarctic islands (ANT) to 859 in Neotropics), and the proportion of E/E(I) species present within their rare macrophyte flora (Supplementary Fig. S3). The situation is different in the other two ecozones, which have only tiny areas of inland freshwater bodies, and correspondingly low numbers of R species present in their macrophyte floras. In the case of ANT (with an extremely small macrophyte flora, in total amounting to only 16 species), its globally rare species pool is dominated by N species, with no rare species at all of I origin, whereas in Pacific islands of Oceania (OCE), the majority of the globally rare species present are of I origin, reflecting the very high proportion of I species in the OCE ecozone (66.5% of the macrophyte species present).
| Species | Ecozone | ||||||
|---|---|---|---|---|---|---|---|
| AFR | AUS | OR | PAL | NEA | NEO | ||
| Total species | 916 | 824 | 989 | 1031 | 931 | 1619 | |
| Globally rare species (occur on <5% grAH) | 445 | 362 | 461 | 327 | 239 | 846 | |
| Percentage of rare species of total species present per ecozone | 48.6 | 43.9 | 46.6 | 31.7 | 25.7 | 52.3 | |
| I total rare species | 16 | 36 | 8 | 25 | 20 | 18 | |
| N total rare species | 31 | 81 | 140 | 88 | 96 | 98 | |
| E total rare species | 398 | 245 | 313 | 214 | 123 | 730 | |
| I percentage of total rare species | 3.6 | 9.9 | 1.7 | 7.6 | 8.4 | 2.1 | |
| N percentage of total rare species | 7.0 | 22.4 | 30.4 | 26.9 | 40.2 | 11.6 | |
| E percentage of total rare species | 89.4 | 67.7 | 67.9 | 65.5 | 51.4 | 86.3 | |
E, ecozone-endemic; N, native; I, introduced, naturalised or invasive; NEO, Neotropics; AFR, Afrotropics; NEA, Nearctic; PAL, Palaearctic; OR, Orient; AUS, Australasia; OCE, Pacific islands of Oceania.
In all ecozones, I species form only a minor component of the rare macrophyte flora, reaching a maximum value of 9% in Australasia, and falling to a low of just 2% in the Orient (Table 2; Fig. S3). Some rare species are found in more than one ecozone and are therefore not ecozone-endemics. No endemic species show inter-ecozone transfer mechanisms, but some rare species do. For example, 24% of the 406 native species occurring in common to the Nearctic and Neotropics are rare at world scale, with some having very restricted world-range size (e.g. Isoetes orcuttia A.A.Eaton (Isoetaceae) at just 0.47% world grAH, which is found only in the western North America section of the Nearctic, and Baja California–Sonora region of the Mexican Neotropics). We also observed that the proportion of rare species decreases with an increasing latitude, at the 10 × 10° scale across the planet, although with some notable outliers (e.g. south-western India, Sahara–Somali–Arabian deserts, Tierra del Fuego, and southern Patagonia and Falkland Islands–Islas Malvinas).
Phylogenetic diversity
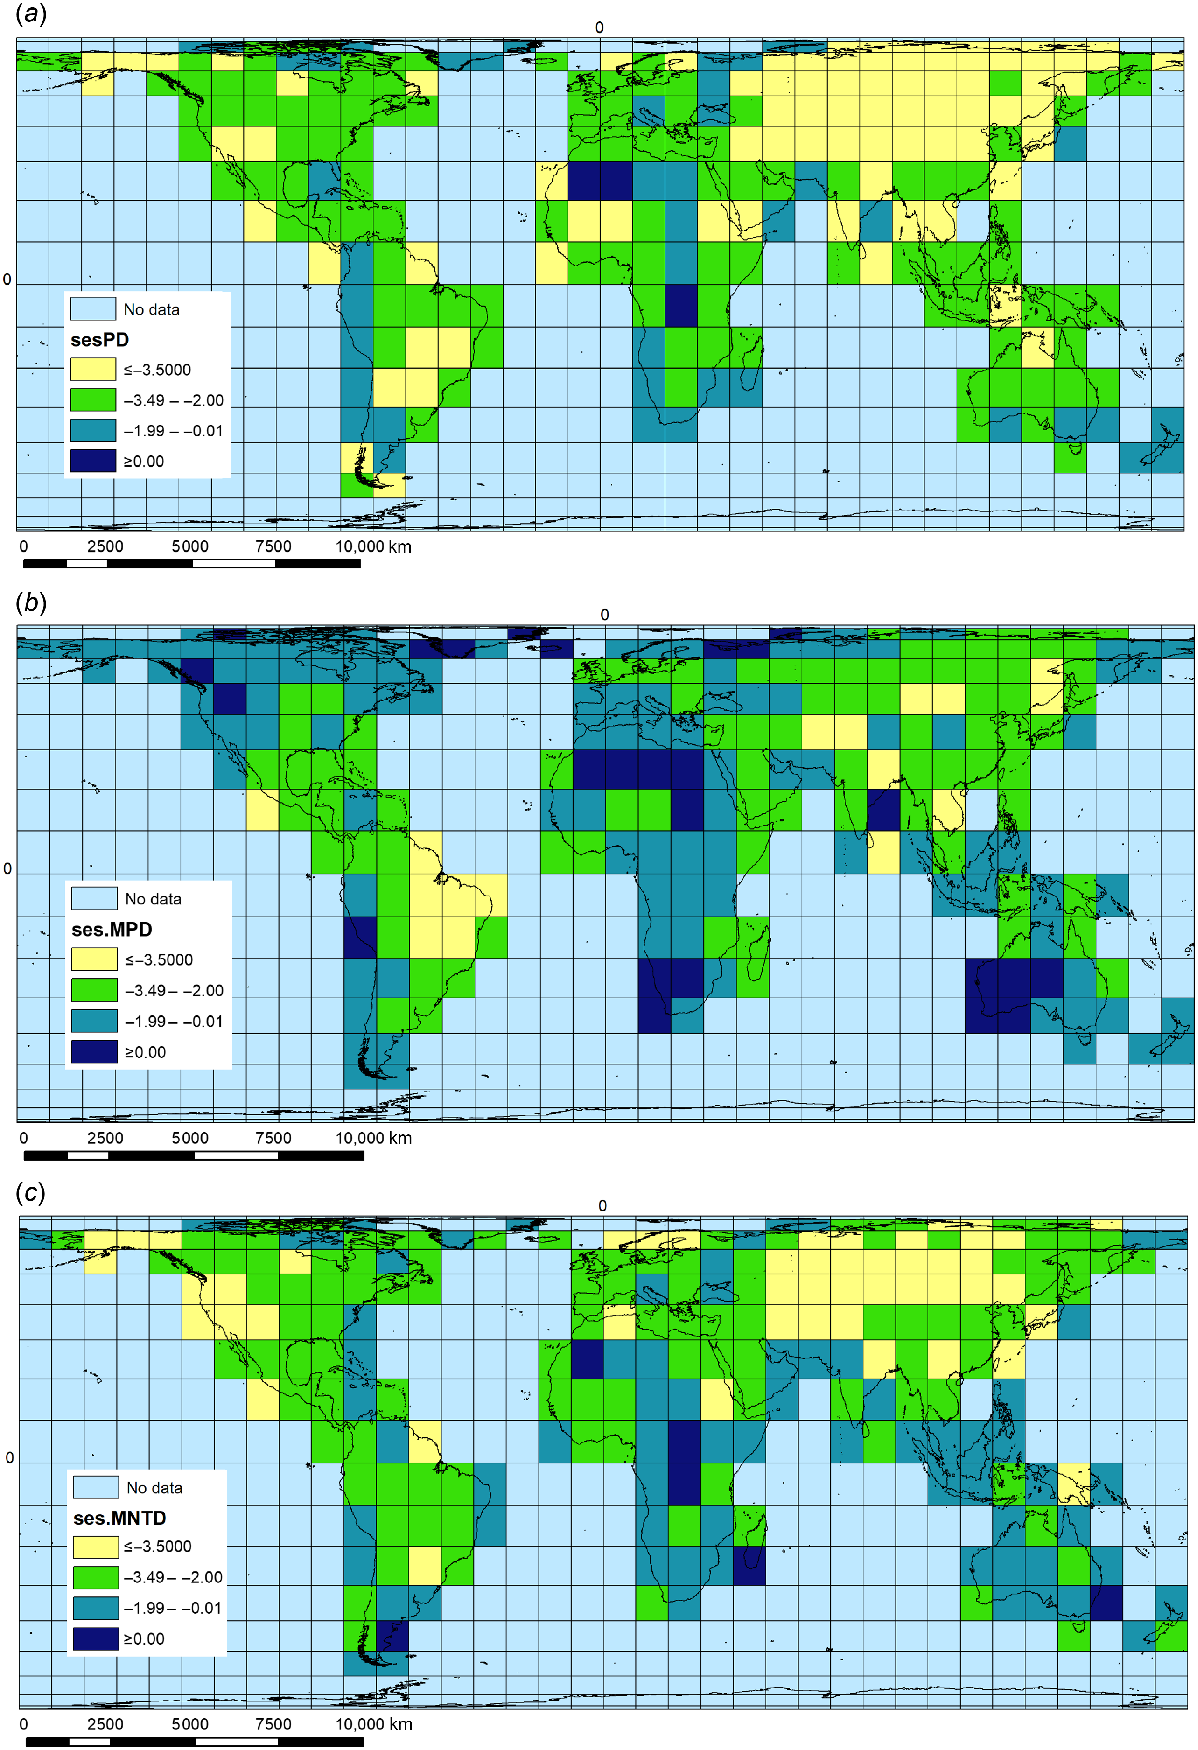
The highest values for PD were for the Neotropical grid cells covering (1) Mato Grosso–Pantanal mostly in Brazil, (2) Brasilia–Goiás, and (3) the Upper Rio Paraná region of Brazil, together with part of Corrientes in northern Argentina, and part of Paraguay. The highest values for MPD are for (1) two Palaearctic grid cells located in the Sahara Desert, covering parts of Algeria and Mauritania, and (2) an Arctic grid cell located in northern Russia, centred on Archangelsk. The highest values for MNTD are for (1) two Sahara Desert grid cells located in Algeria and Libya, and (2) an Arctic grid cell located in Greenland (Supplementary Table S1). We observed predominantly negative standardised metrics (ses.PD, ses.MPD, ses.MNTD), which reflect a strong phylogenetic clustering (P > 0.05), with closely related species sharing the same sites (Fig. 4) (Supplementary Tables S1 and S2). This significant clustering was identified both in the basal (ses.MPD) and terminal (ses.MNTD) levels of the phylogeny for most of the grids. Twenty-four grid cells showed overdispersion with basal over-scattering and terminal clustering (potential museums). At the other extreme, five grid-cell assemblages displayed basal clustering and terminal dispersion (potential cradles) (Table 3; Fig. 1c).
Phylogenetic diversity distribution of global pool of macrophytes (a) ses.PD, (b) ses.MPD, and (c) ses.MNTD.
| Basal clustering and terminal dispersion (cradles) (grids that have mpd.obs.P < 0.5 and mntd.obs. P > 0.5) | Basal over-scattering and terminal clustering (museums) (grids that have mpd.obs.P of >0.5 and mntd.obs.P of <0.5) | Basal and terminal clustering | |||||
|---|---|---|---|---|---|---|---|
| Code | Abbrev. | Region | Code | Abbreviation | Region | ||
| C078 | NeoS I | Patagonia | C107 | PaW AA | Southern Algeria (Hoggar) (N) | All of the other grids are included here. | |
| C206 | Aus U | New South Wales | C014 | NeaN N | British Columbia | ||
| C223 | AfrN U | Eastern Central African Republic–western South Sudan | C022 | NeaN V | Western Greenland | ||
| C227 | AfrS B | DRC | C023 | NeaN WS | Greenland | ||
| C236 | AfrS K | Southern Madagascar | C027 | NeaN AA | Victoria Island (W) | ||
| C033 | NeaS B | Montana | |||||
| C065 | NeoN K | Lima | |||||
| C081 | PaW A | Iceland | |||||
| C085 | PaW E | North-western Russia (Kola–Karelia) | |||||
| C086 | PaW F | North-western Russia (Archangelsk) | |||||
| C108 | PaW BB SW | Libya (N) | |||||
| C109 | PaW CC SE | Libya–south-western Egypt (N) | |||||
| C130 | PaC S | Arctic Russia (Novaya Zemlya) | |||||
| C178 | Or H | South-eastern India | |||||
| C197 | Aus L | Western Western Australia | |||||
| C198 | Aus M | Eastern Western Australia | |||||
| C199 | Aus N | Southern Northern Territory (Alice Springs) | |||||
| C202 | Aus Q | Perth | |||||
| C203 | Aus R | Nullarbor Plain | |||||
| C208 | Aus W | Tasmania | |||||
| C215 | AfrN M | Eastern Chad–western Sudan | |||||
| C233 | AfrS H | Southern Namibia | |||||
| C234 | AfrS I | Botswana–northern South Africa | |||||
| C237 | AfrS L | Western Cape | |||||
A value of 0 indicates that the observation is lower than all null expectations (clustering), and a value of 0.5 indicates that the observation equals to the median of the null distribution (over dispersed).
Diversification rate analyses and speciation age
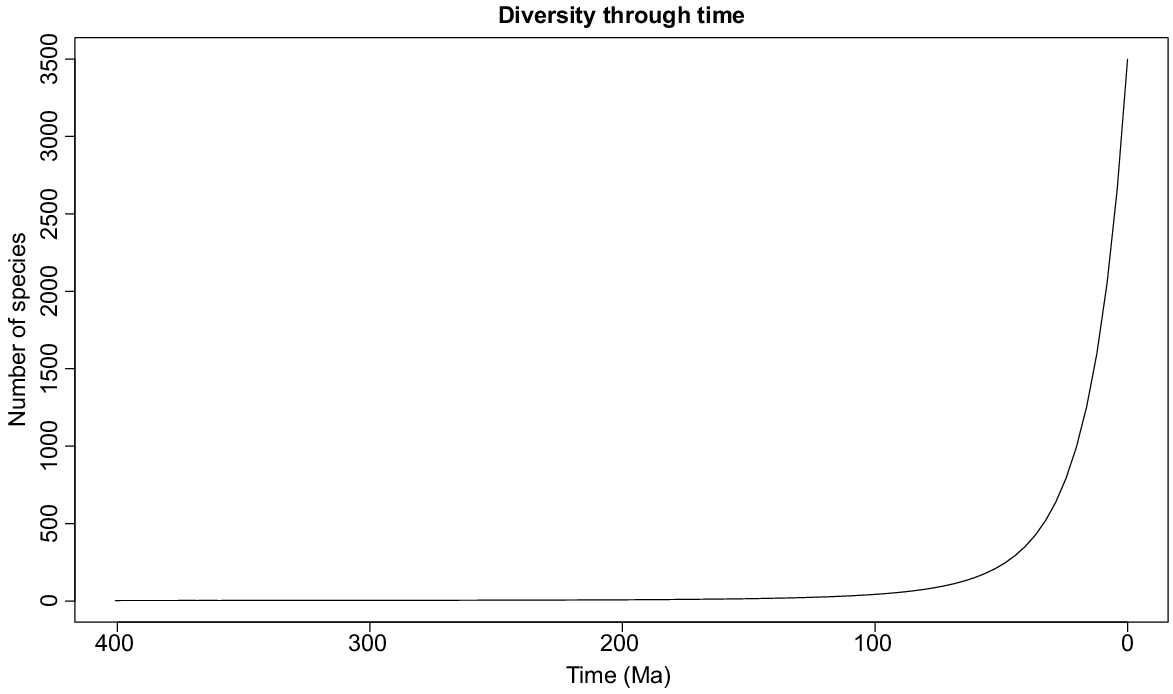
The best diversification model estimated with RPANDA for macrophyte aquatics was the pure birth, with exponential variation in speciation rate (λ = 0.06, exp = −0.009), mainly concentrated in the past 30 Ma (Fig. 5). Independently derived age data were available for 560 macrophyte species (16% of the total world macrophyte species pool), of which the majority (73%) evolved in the Pleistocene, Pliocene or late Miocene, i.e. with ages of <10 Ma (Supplementary Fig. S4). The sample size is not large, limiting the conclusions that can be drawn; however, comparing among ecozones, the highest number of old species (speciation age at least 5.3 Ma) is seen in the Palaearctic (171 species), whereas the Neotropics (95) and Australasia (92) had fewest old species potentially open to ancient vicariance vector distributions across their range. Although the mean age (±s.e) of species was also highest in the Palaearctic (9.61 ± 0.73 Ma), closely followed by the Afrotropics at 9.60 ± 0.76 Ma, the ecozone with the youngest mean age of species present (Orient, 8.09 ± 0.50 Ma) was not that much different, and there were no significant differences in mean age of macrophyte speciation between the ecozones (ANOVA, P = 0.356).
Boosted regression-tree analysis (BRT)
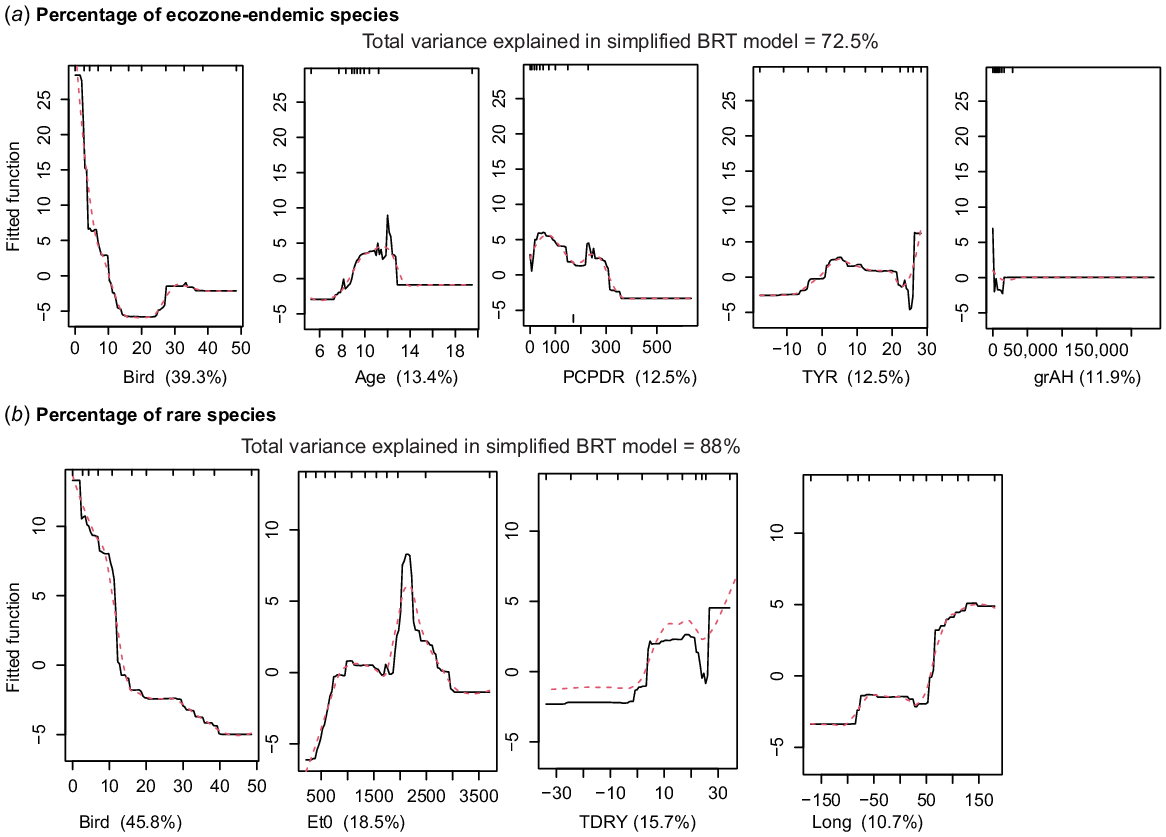
The BRT models with highest predictive power were %E, %R, number of R species and %RE (Supplementary Fig. S5–S11). For %E species (73% of the variance explained; Fig. 6a) the model showed that sites with highest endemicity are associated with a low value for the BIRD vector, together with a small influence of intermediate age (>8 Ma), climate (PCPDR and TYR) and habitat (grAH). For %R species, the BRT model (88% of the variance explained, Fig. 6b) also strongly suggested a negative relationship with the BIRD vector. Rare taxa are most abundant when species associated with the BIRD vector are at their lowest, followed by climatic (Et0, TDRY) and geographical (LONG) variables as important predictors; LONG, from 50 to 150°E had a higher %R species. The R species BRT model (88% of the variance explained) indicated a negative effect of BIRD vector, followed by climatic variables (TDRY) and (PCP). The %RE species BRT model (78% of the variance explained) also suggested BIRD vector as the strongest predictor, with a negative relationship on %RE.
(a) Boosted regression-tree partial dependency plots for the variables making up the best predictive model of percentage of ecozone-endemic species and the shape of that relationship. (b) Boosted regression-tree partial dependency plots for the variables making up the best predictive model of percentage of globally rare species and the shape of that relationship.
The phylogenetic diversity indices ses.PD, ses.MTD, ses.MNTD were not as well predicted as the variables above, but still had 55–60% of variance explained (Fig. S5–S11). We observed only two predictors of ses.PD, namely climate (TRG), which was negatively associated with ses.PD, and AGE, with an association among ses.PD and old species. The best predictors of ses.MTD were grAH (negative relationship) and BIRD vector, given a low ses.MTD with sharp increase with the smallest increase in BIRD vector-associated species. TRG and TYR were the strongest explanatory variables for ses.MNTD. Again, there was a strong negative effect of TRG ~40–50°C.
Discussion
Overall, it appears that the ecozone-endemic macrophyte species of the world have a strong tendency towards tight geographical endemicity within their individual ecozones, often being confined to a single macroregion. The occurrence of ecozone-endemic (E) and globally rare macrophyte (R) species in grid cells across the planet shows similar occurrence patterns and importance of environmental drivers among ecozones (Albrecht 2002; Bove and Philbrick 2014; Efremov and Sviridenko 2016; Pereira et al. 2016; Shcherbakov and Lyubeznova 2017; Takacs et al. 2017; Cheek et al. 2020; Efimov and Efimova 2020). However, we observed a tendency of endemicity hotspots to occur in the New World, mainly Neotropics, where we found the species-richest grid cells worldwide (Murphy et al. 2019), whereas rarity hotspots were most frequent in the Orient (particularly southern Asia) and Australasia. As suggested by Lobato-de Magalhães et al. (2023), and observed here, long-distance dispersion by zoochory (particularly birds) is probably (and unsurprisingly) negatively associated with the global distribution of ecozone-endemic and globally rare species. This suggests that endemicity and rarity of macrophyte species could be associated with poor connectivity (i.e. lack of dispersion vectors), whereas more cosmopolitan species make strong use of these vectors, whether via natural (e.g. hydrochory, zoochory) or human dispersion agents (anthropochory). Better understanding of how and why these hotspots are created is crucial to the future global protection of macrophyte species and their environment, particularly in the context of global climatic change.
There are some issues that we wish to consider related to the question of ‘what factors may drive the distribution of endemic and rare macrophyte species across the planet’, because the regional definition used for ‘rarity’ of species, data grid-scale used, and geographical area(s) investigated, may all lead to study outcomes which may be strictly speaking correct in terms of the area(s) studied, but may prove to be rather skewed in their conclusions when considered at a global scale. An example is the recent study, at 50 × 50-km grid-scale resolution (much finer-scale than in our study), by García-Girón et al. (2021), of macrophyte distribution in North America and part of the western Palaearctic, which suggested that diversity of rare species showed ‘different patterns in relation to latitude on the two continents’. Although this is correct in relation to the specific areas studied by these authors, it does not agree with the world latitudinal pattern of macrophyte rare-species diversity, at a broader scale, which shows a noisy but significant general trend of declining rare-species macrophyte diversity with an increasing latitude, and, specifically, a pattern which is near identical for both ecozones within the 30–80°N latitude band common to the Nearctic and Palaearctic. What the outcome of the study by García-Girón et al. (2021) probably reflects is most likely to be a combination of a low sampling effort in south-eastern Europe (see appendix A5 in Murphy et al. 2019 for more on the implications of sampling effort for reported macrophyte diversity) compared with northern Europe; so, rare species will tend to be recorded less frequently, and there may be some real local reductions in rare species diversity, especially in the drier areas of the Balkans. In addition, and crucially, their study did not include Iberia, where a lot of rare macrophyte species are present. Using our definition of rarity, for the two grid cells covering Spain and Portugal, 19 and 24% of species present per grid cell are globally rare, whereas, for the grid cell covering most of the British Isles, the corresponding value is just 9%. One of their conclusions is that the British Isles form a hotspot for rare macrophyte species occurrence, which, on the evidence presented here, we think is unlikely to be correct, although it is true that for certain genera (e.g. Carex, Potamogeton, Ranunculus; see Fig. 3d, t, u), the British Isles lie within a broader Palaearctic hotspot for E species occurrence, many of these also being globally rare species.
Regarding macrophyte phylogenetic diversity indices, the evidence here suggests higher values for these metrics occurring in areas with harsh environmental conditions, such as massive seasonal environmental disturbance owing to flooding occurring in tropical river floodplains (e.g. Martins et al. 2013), extreme heat or drought or cold in highlands, deserts and at high latitudes, compared with other areas worldwide. Phylogenetic clustering highlights the recent diversification of closely related macrophyte species worldwide with the same patterns, probably driven by climatic changes through the Miocene. This exponential diversification is concentrated towards the present. There are some clear global hotspots of recent speciation in some genera (e.g. Nymphoides in Australasia, with 15 ecozone-endemic species present, all with divergence ages in the Pliocene–Pleistocene, and some very young, such as Nymphoides quadriloba at just 0.3 Ma). The issue of phylogenetic v. species-diversity hotspots as cradles (areas of especially rapid species origination) or museums (areas of especially long-term persistence of species) is something of interest to examine in this light, as well as the possible role of changes in ploidy (Chen et al. 2012a, 2012b; Ito et al. 2017a, 2017b; Lobato-de Magalhães et al. 2021; van de Peer et al. 2021) in assisting macrophyte evolution.
The location of speciation hotspots, defined both in taxonomic and phylogenetic terms, is beginning to be known for macrophytes, and better understanding of the factors that produced such hotspots as well as the drivers of endemic and rare species distributions at a global scale, can undoubtedly improve the knowledge base needed to inform actions required for protection of these plants (Murphy et al. 2019; Dagallier et al. 2020; Lobato-de Magalhães et al. 2023). Macrophyte phylogenetic diversity could be influenced by harsh environment, particularly cold or dry areas (e.g. Dagallier et al. 2020). Phylogenetic clustering detected both in basal and terminal levels indicate in situ diversification in closely related lineages, mainly throughout the Miocene. It is interesting to see to what extent our outcomes are consistent with phylogenetically well-studied macrophyte genera, for example, Ottelia (Li et al. 2020). These authors identified two main centres of Ottelia diversity in Africa (~13 species), and in south-eastern Asia (~8 species). The genus was inferred to have arisen in Africa–Australasia–Asia during the Miocene (7–20 Ma) and orogenic movement during the Pliocene (Trifonov et al. 2008) may be associated with the evolution of the Chinese endemic taxa.
One of the factors that may have influenced the current global distribution of macrophytes is ancient vicariance speciation, related to divergence of species that happened long-enough ago to have been associated with movements of land and other geographic-scale events (such as the periodic appearance and re-inundation of the Bering land bridge linking the Palaearctic and Nearctic), over time scales of millions of years. Although molecular studies utilising species divergence times for closely related species occurring in different regions of the planet have generally found that such divergences are ‘far too recent to implicate continental drift as a major determinant of discontinuous distributions in aquatic plants’ (Les et al. 2003), for some older species, this factor remains as a possibility for explaining, at least in part, inter-ecozone macrophyte species distribution (e.g. Renner and Zhang 2004). Age data compiled for this study (see below, mainly derived from species-divergence molecular data) suggest that most speciation of currently extant macrophytes occurred during or following the Miocene, so within the past 23 million years (e.g. Wang et al. 2005), although some fossil evidence exists for older, extinct macrophyte species (e.g. Friis et al. 2001; Wang and Dilcher 2006; Estrada-Ruiz et al. 2009). In Europe, at least 14–15 palaeospecies are known, and, in Asia (Urals and western Siberia), at least 6 predominantly endemic palaeospecies are known to occur (Chen et al. 2012a). It remains to be shown whether older or more recent hybridisation events (e.g. Nymphaea loriana Wiersema & Borsch (Nymphaeaceae): Borsch et al. 2014; see also Dai et al. 2021), occurring in parental contact-zone areas, may also be of relevance, to varying degrees, for speciation in this context.
Although ancient vicariance effects could be a factor for a small percentage of older rare species, we have only mean age (AGE) data for a limited number of rare species, so it is difficult to draw conclusions other than to say that it looks a possibility for a few rare species in every ecozone. In contrast, we have reasonably good data for the occurrence of species in every ecozone via human-interference effects, and the pattern is again similar to what we see for the all-species dataset, with the biggest proportion of world rare I species found in Australasia, and the lowest occurrences in Neotropics and Orient ecozones.
Conclusions
This study is the first to delineate global endemicity and rarity hotspots of aquatic macrophyte species. Our outcomes identified some of the potential drivers of ecozone-endemic and globally rare macrophyte species distribution across the Earth, and particularly examined the factors that resulted in the development of speciation hotspots that tend to maximise taxonomic or phylogenetic diversity of macrophytes in certain regions of the planet. We highlighted 26 from 92 macrophyte families as having the potential for strong endemicity, particularly Lythraceae (with two global genera endemic hotspots), Cyperaceae (four), and Podostemaceae (five), emphasising the importance of these three families for overall global macrophyte endemicity. From a total global pool of 3499 macrophyte species, 2496 species showed single-ecozone endemic distributions. The Neotropical ecozone is of outstanding importance for endemicity hotspots, with the greatest number of endemic species present among all world ecozones. Most, but not all, ecozone-endemic macrophytes are rare at a world scale. We found a total pool of rare macrophytes of 2296 species, with 1194 of these being classed as ‘very rare’, and Australasia was highlighted as one of the most critical hotspots of macrophyte rarity. We also observed that the proportion of rare species decreases with an increasing latitude, at the 10 × 10° scale across the planet. Our findings are relevant to identify hotspots of macrophyte endemicity and rarity, and potential cradle and museum speciation areas for these plants, that could usefully inform global actions to conserve the macrophyte diversity of inland aquatic habitats across the world.
Finally, we provide below a formal assessment, based on the evidence presented in this paper, of the outcomes for the four main hypotheses laid out in the Introduction section.
Hypothesis 1: endemic and rare macrophyte species show similar patterns of occurrence world-wide. Accepted; although there are some differences (noted and discussed above), in general the patterns observed for R and E macrophyte species at a global scale are rather congruent.
Hypothesis 2: macrophyte phylogenetic diversity is likely to be highest where growth conditions are harsh. Provisionally accepted, although more research is clearly needed in this area to determine in better detail how macrophyte phylogenetic diversity is related to high environmental stress (and probably also environmental disturbance sensuGrime 1979).
Hypothesis 3: current distribution patterns are the result of recent events (occurring <10 Ma). Largely accepted, although it is clear that some species’ distributions are quite likely to have been influenced by more ancient events affecting their phytogeography.
Hypothesis 4: lack of long-distance dispersion vectors is more strongly associated with endemic and rare species occurrence than landscape or climatic factors influencing their ecology. Accepted; lack of natural long-range dispersion vectors, such as bird-mediated zoochory, appears to be one of the most important factors explaining endemic and rare species occurrence, with a negative association, followed by landscape and climatic factors.
Data availability
The data that support this study are available in the article and accompanying online supplementary material or on request from the first and second authors (T. Lobato‑de Magalhães, K. Murphy).
References
Alahuhta J, Johnson LB, Olker J, Heino J (2014) Species sorting determines variation in the community composition of common and rare macrophytes at various spatial extents. Ecological Complexity 20, 61-68.
| Crossref | Google Scholar |
Alahuhta J, Lindholm M, Baastrup-Spohr L, García-Girón J, Toivanen M, Heino J, Murphy K (2021) Macroecology of macrophytes in the freshwater realm: patterns, mechanisms and implications. Aquatic Botany 168, 103325.
| Crossref | Google Scholar |
Albrecht DE (2002) Elatine macrocalyx (Elatinaceae), a new species from central and western Australia. Nuytsia 14, 319-324.
| Crossref | Google Scholar |
Bishop IJ, Bennion H, Patmore IR, Sayer CD (2018) How effective are plant macrofossils as a proxy for macrophyte presence? The case of Najas flexilis in Scotland. Journal of Paleolimnology 60, 153-165.
| Crossref | Google Scholar |
Bishop IJ, Bennion H, Sayer CD, Patmore IR, Yang H (2019) Filling the ‘data gap’: using paleoecology to investigate the decline of Najas flexilis (a rare aquatic plant). Geo: Geography and Environment 6, e00081.
| Crossref | Google Scholar |
Borsch T, Wiersema JH, Hellquist CB, Löhne C, Govers K (2014) Speciation in North American water lilies: evidence for the hybrid origin of the newly discovered Canadian endemic Nymphaea loriana sp. nov. (Nymphaeaceae) in a past contact zone. Botany 92, 867-882.
| Crossref | Google Scholar |
Bove CP, Philbrick CT (2014) Rediscovery of a Neotropical rheophyte (Podostemaceae) after 160 years: implications for the location of conservation unit boundaries (Tocantins, Brazil). Check List 10, 1170-1173.
| Crossref | Google Scholar |
Cheek M, Séné O, Ngansop E (2020) Three new critically endangered Inversodicraea (Podostemaceae) species from Tropical Africa: I. senei, I. tanzaniensis and I. botswana. Kew Bulletin 75, 31.
| Crossref | Google Scholar |
Chen L-Y, Chen J-M, Gituru RW, Wang Q-F (2012a) Generic phylogeny, historical biogeography and character evolution of the cosmopolitan aquatic plant family Hydrocharitaceae. BMC Evolutionary Biology 12, 30.
| Crossref | Google Scholar |
Chen L-Y, Chen J-M, Gituru RW, Temam TD, Wang Q-F (2012b) Generic phylogeny and historical biogeography of Alismataceae, inferred from multiple DNA sequences. Molecular Phylogenetics and Evolution 63, 407-416.
| Crossref | Google Scholar | PubMed |
Crawford DJ, Landolt E, Les DH, Kimball RT (2006) Speciation in duckweeds (Lemnaceae): phylogenetic and ecological inferences. Aliso: A Journal of Systematic and Floristic Botany 22, 231-242.
| Crossref | Google Scholar |
Dagallier L-PMJ, Janssens SB, Dauby G, Blach-Overgaard A, Mackinder BA, Droissart V, Svenning J-C, Sosef MSM, Stévart T, Harris DJ, Sonké B, Wieringa JJ, Hardy OJ, Couvreur TLP (2020) Cradles and museums of generic plant diversity across tropical Africa. New Phytologist 225, 2196-2213.
| Crossref | Google Scholar |
Dai X, Li X, Song X, Li X, Liu X (2021) The evolutionary history and phylogeographic pattern of Hippuris vulgaris: hybridization and long-distance dispersal from China. Plant Systematics and Evolution 307, 10.
| Crossref | Google Scholar |
Efimov D, Efimova L (2020) Флористические находки редких видов растений в Республике Хакасии. Floristic finds of rare plant species in the Republic of Khakassia. Turczaninowia 23(2), 91-98 [In Russian with title and abstract in Russian and English].
| Crossref | Google Scholar |
Efremov AN, Sviridenko BF (2016) О распространенииредких гидрофитов вОмской области. On distribution rare hydrophytes in Omsk Region. БОТАНИЧЕСКИЙ ЖУРНАЛ [Botanical Journal] 101, 923-927 [In Russian with title and abstract in Russian and English].
| Google Scholar |
Elith J, Leathwick JR, Hastie T (2008) A working guide to boosted regression trees. Journal of Animal Ecology 77, 802-813.
| Crossref | Google Scholar | PubMed |
Estrada-Ruiz E, Calvillo-Canadell L, Cevallos-Ferriz SRS (2009) Upper Cretaceous aquatic plants from Northern Mexico. Aquatic Botany 90, 282-288.
| Crossref | Google Scholar |
Faith DP (1992) Conservation evaluation and phylogenetic diversity. Biological Conservation 61, 1-10.
| Crossref | Google Scholar |
Fick SE, Hijmans RJ (2017) WorldClim 2: new 1-km spatial resolution climate surfaces for global land areas. International Journal of Climatology 37(12), 4302-4315.
| Crossref | Google Scholar |
Friis EM, Pedersen KR, Crane PR (2001) Fossil evidence of water lilies (Nymphaeales) in the Early Cretaceous. Nature 410, 357-360.
| Crossref | Google Scholar | PubMed |
García-Girón J, Heino J, Iversen LL, Helm A, Alahuhta J (2021) Rarity in freshwater vascular plants across Europe and North America: patterns, mechanisms and future scenarios. Science of The Total Environment 786, 147491.
| Crossref | Google Scholar | PubMed |
Gunn IDM, Carvalho L (2021) Slender naiad (Najas flexilis) habitat quality assessment. (Centre for Expertise of Water, CREW: Aberdeen, UK) Available at https://nora.nerc.ac.uk/id/eprint/528396/1/N528396CR.pdf [Verified October 2022]
Ito Y, Tanaka N, Albach DC, Barfod AS, Oxelman B, Muasya AM (2017a) Molecular phylogeny of the cosmopolitan aquatic plant genus Limosella (Scrophulariaceae) with a particular focus on the origin of the Australasian L. curdieana. Journal of Plant Research 130, 107-116.
| Crossref | Google Scholar | PubMed |
Ito Y, Tanaka N, Barfod AS, Kaul RB, Muasya AM, Garcia-Murillo P, De Vere N, Duyfjes BEE, Albach DC (2017b) From terrestrial to aquatic habitats and back again: molecular insights into the evolution and phylogeny of Callitriche (Plantaginaceae). Botanical Journal of the Linnean Society 184, 46-58.
| Crossref | Google Scholar |
Jin Y, Qian H (2019) V.PhyloMaker: an R package that can generate very large phylogenies for vascular plants. Ecography 42(8), 1353-1359.
| Crossref | Google Scholar |
Kumar S, Stecher G, Suleski M, Hedges SB (2017) TimeTree: a resource for timelines, timetrees, and divergence times. Molecular Biology and Evolution 34, 1812-1819.
| Crossref | Google Scholar | PubMed |
Les DH, Crawford DJ, Kimball RT, Moody ML, Landolt KE (2003) Biogeography of discontinuously distributed hydrophytes: a molecular appraisal of intercontinental disjunctions. International Journal of Plant Sciences 164, 917-932.
| Crossref | Google Scholar |
Les DH, Peredo EL, King UM, Benoit LK, Tippery NP, Ball CJ, Shannon RK (2015) Through thick and thin: cryptic sympatric speciation in the submersed genus Najas (Hydrocharitaceae). Molecular Phylogenetics and Evolution 82(Part A), 15-30.
| Crossref | Google Scholar |
Li Z-Z, Lehtonen S, Martins K, Gichira AW, Wu S, Li W, Hu G-W, Liu Y, Zou C-Y, Wang Q-F, Chen J-M (2020) Phylogenomics of the aquatic plant genus Ottelia (Hydrocharitaceae): implications for historical biogeography. Molecular Phylogenetics and Evolution 152, 106939.
| Crossref | Google Scholar | PubMed |
Lobato-de Magalhães T, Murphy K, Efremov A, Chepinoga V, Davidson TA, Molina-Navarro E (2021) Ploidy state of aquatic macrophytes: global distribution and drivers. Aquatic Botany 173, 103417.
| Crossref | Google Scholar |
Lobato-de Magalhães T, Murphy K, Efremov A, Davidson TA, Molina-Navarro E, Wood KA, Tapia-Grimaldo J, Hofstra D, Fu H, Ortegón-Aznar I (2023) How on Earth did that get there? Natural and human vectors of aquatic macrophyte global distribution. Hydrobiologia 850, 1515-1542.
| Crossref | Google Scholar |
Martins SV, Milne J, Thomaz SM, McWaters S, Mormul RP, Kennedy M, Murphy K (2013) Human and natural drivers of changing macrophyte community dynamics over 12 years in a Neotropical riverine floodplain system. Aquatic Conservation: Marine and Freshwater Ecosystems 23, 678-697.
| Crossref | Google Scholar |
Mazel F, Davies TJ, Gallien L, Renaud J, Groussin M, Münkemüller T, Thuiller W (2016) Influence of tree shape and evolutionary time-scale on phylogenetic diversity metrics. Ecography 39, 913-920.
| Crossref | Google Scholar | PubMed |
Morlon H, Parsons TL, Plotkin JB (2011) Reconciling molecular phylogenies with the fossil record. Proceedings of the National Academy of Sciences 108, 16327-16332.
| Crossref | Google Scholar | PubMed |
Morlon H, Lewitus E, Condamine FL, Manceau M, Clavel J, Drury J (2016) RPANDA: an R package for macroevolutionary analyses on phylogenetic trees. Methods in Ecology and Evolution 7, 589-597.
| Crossref | Google Scholar |
Murphy K, Efremov A, Davidson TA, Molina-Navarro E, Fidanza K, Crivelari Betiol TC, Chambers P, Tapia Grimaldo J, Varandas Martins S, Springuel I, Kennedy M, Mormul RP, Dibble E, Hofstra D, Lukács BA, Gebler D, Båastrup-Spohr L, Urrutia-Estrada J (2019) World distribution, diversity and endemism of aquatic macrophytes. Aquatic Botany 158, 103127.
| Crossref | Google Scholar |
Murphy K, Carvalho P, Efremov A, Tapia Grimaldo J, Molina-Navarro E, Davidson TA, Thomaz SM (2020) Latitudinal variation in global range-size of aquatic macrophyte species shows evidence for a Rapoport effect. Freshwater Biology 65, 1622-1640.
| Crossref | Google Scholar |
Nee S, Mooers AO, Harvey PH (1992) Tempo and mode of evolution revealed from molecular phylogenies. Proceedings of the National Academy of Sciences 89, 8322-8326.
| Crossref | Google Scholar |
Pereira JBS, Salino A, Arruda A, Stützel T (2016) Two new species of Isoetes (Isoetaceae) from northern Brazil. Phytotaxa 272, 141-148.
| Crossref | Google Scholar |
Qian H, Jin Y (2016) An updated megaphylogeny of plants, a tool for generating plant phylogenies and an analysis of phylogenetic community structure. Journal of Plant Ecology 9(2), 233-239.
| Crossref | Google Scholar |
Renner SS, Zhang L-B (2004) Biogeography of the Pistia clade (Araceae): based on chloroplast and mitochondrial DNA sequences and Bayesian Divergence Time Inference. Systematic Biology 53, 422-432.
| Crossref | Google Scholar | PubMed |
Sandel B, Arge L, Dalsgaard B, Davies RG, Gaston KJ, Sutherland WJ, Svenning J-C (2011) The influence of late Quaternary climate-change velocity on species endemism. Science 334(6056), 660-664.
| Crossref | Google Scholar | PubMed |
Shcherbakov AV, Lyubeznova NV (2017) Problems in creating lists of protected species for regional Red Data Books: aquatic vascular plants of European Russia and North Caucasus as case studies. Wulfenia 24, 171-192.
| Google Scholar |
Swenson NG (2011) Phylogenetic beta diversity metrics, trait evolution and inferring the functional beta diversity of communities. PLoS ONE 6, e21264.
| Crossref | Google Scholar | PubMed |
Takacs A, Molnár AV, Horváth O, Sramkó G, Popiela A, Mesterházy A, Lovas-Kiss A, Green AJ, Löki V, Nagy T, Lukács BA (2017) The rare aquatic angiosperm Elatine gussonei (Elatinaceae) is more widely distributed than previously thought. Aquatic Botany 141, 47-50.
| Crossref | Google Scholar |
Tippery NP, Sears NL, Zentner AB, Sivadas V (2018) Evidence for allopolyploid speciation in Nymphoides (Menyanthaceae). Systematic Botany 43, 117-129.
| Crossref | Google Scholar |
Trabucco A, Zomer R (2019) Global aridity index and potential evapotranspiration (ET0) climate database. FigShare v2. [Dataset, posted 18 January 2019] doi:10.6084/m9.figshare.7504448.v3
Trifonov VG, Artyushkov EV, Dodonov AE, Bachmanov DM, Mikolaichuk AV, Vishnyakov FA (2008) Pliocene–Quaternary orogeny in the Central Tien Shan. Russian Geology and Geophysics 49(2), 98-112.
| Crossref | Google Scholar |
van de Peer Y, Ashman T-L, Soltis PS, Soltis DE (2021) Polyploidy: an evolutionary and ecological force in stressful times. The Plant Cell 33(1), 11-26.
| Crossref | Google Scholar | PubMed |
Wang H, Dilcher DL (2006) Aquatic angiosperms from the Dakota Formation (Albian, Lower Cretaceous), Hoisington III locality, Kansan, USA. International Journal of Plant Sciences 167, 385-401.
| Crossref | Google Scholar |
Wang Y-F, Ferguson DK, Li C-S (2005) Ceratophyllum (Ceratophyllaceae) from the Miocene of eastern China and its paleoecological significance. Systematic Botany 30, 705-711.
| Crossref | Google Scholar |
Webb CO, Ackerly DD, McPeek MA, Donoghue MJ (2002) Phylogenies and community ecology. Annual Review of Ecology, Evolutiom, and Systematics 33, 475-505.
| Crossref | Google Scholar |
Wingfield R, Murphy K, Gaywood M (2005) Lake habitat suitability for the rare European macrophyte Najas flexilis (Willd.) Rostk. & Schmidt. Aquatic Conservation: Marine and Freshwater Ecosystems 15, 227-241.
| Crossref | Google Scholar |
Wingfield R, Murphy KJ, Gaywood M (2006) Assessing and predicting the success of Najas flexilis (Willd.) Rostk. & Schmidt, a rare European aquatic macrophyte, in relation to lake environmental conditions. Hydrobiologia 570, 79-86.
| Crossref | Google Scholar |
Zanne AE, Tank DC, Cornwell WK, Eastman JM, Smith SA, FitzJohn RG, McGlinn DJ, O’Meara BC, Moles AT, Reich PB, Royer DL, Soltis DE, Stevens PF, Westoby M, Wright IJ, Aarssen L, Bertin RI, Calaminus A, Govaerts R, Hemmings F, Leishman MR, Oleksyn J, Soltis PS, Swenson NG, Warman L, Beaulieu JM (2014) Three keys to the radiation of angiosperms into freezing environments. Nature 506, 89-92.
| Crossref | Google Scholar | PubMed |
Zhang Y, Jeppesen E, Liu X, Qin B, Shi K, Zhou Y, Thomaz SM, Deng J (2017) Global loss of aquatic vegetation in lakes. Earth-Science Review 173, 259-265.
| Crossref | Google Scholar |
Zhu J, Yu D, Xu X (2015) The phylogeographic structure of Hydrilla verticillata (Hydrocharitaceae) in China and its implications for the biogeographic history of this worldwide-distributed submerged macrophyte. BMC Evolutionary Biology 15, 95.
| Crossref | Google Scholar | PubMed |