

The phenology of Eucalyptus camaldulensis (Dehnh, 1832) and Eucalyptus coolabah (Blakely & Jacobs, 1934) in the northern Murray–Darling Basin and implications for recruitment on floodplains
Janice Kerr A * , Douglas Harding A , James Fawcett A and Andrea Prior A
A
Abstract
Published evidence suggests recruitment of floodplain trees is declining in the northern Murray–Darling Basin (MDB) and that this is linked to river flow.
We investigated the reproductive phenology of Eucalyptus camaldulensis and Eucalyptus coolabah to better understand tree reproductive cycles and the influence of rainfall and flow on seed production.
We surveyed phenological events (bud, flower and fruit production) over 6 years, at nine sites along the Condamine–Balonne River and examined correlations between these events and meteorological parameters.
For both species, event timing was consistent across sites and years and event relative abundance scores were different between years. Bud abundance was correlated with rainfall, flooding and warming temperatures and E. coolabah produced additional bud crops after floods.
The timing of events did not differ significantly from published results for the southern MDB. Rainfall, river flows and flooding in spring resulted in more abundant bud crops in E. camaldulensis and E. coolabah, and subsequently more abundant fruit crops. Fruit dehiscence coincided with summer–autumn flooding, which provides seed for germination. Genetic and physiological factors may also influence the observed pattern.
These results will inform water planning in Queensland, Commonwealth Environmental Water Holder watering actions and long-term watering plans in the northern MDB.
Keywords: ecohydrology, environmental water, floodplains, Murray–Darling system, plants, recruitment, reproductive biology, seed.
Introduction
Riverine floodplains are characterised by high biodiversity and high productivity, and are valued by humans for cultural and economic reasons (Petsch et al. 2023). They are also one of the most threatened landscapes on a global scale (Tockner et al. 2008), being vulnerable to changes in the river’s hydrologic regime that alter the frequency and extent of floodplain inundation (Kuiper et al. 2014; Petsch et al. 2023). These changes can affect floodplain vegetation through reduced water availability (Bren 1988; Shilpakar et al. 2021), salinisation (Jolly et al. 1993), waterlogging (Parolin and Wittmann 2010) and proliferation of invasive species (Cleverly et al. 1997).
In Australia, state governments, the Murray–Darling Basin Authority (MDBA), the Office of the Commonwealth Environmental Water Holder (CEWH) and research institutions have invested effort into understanding the water requirements of floodplain trees over recent decades (e.g. Wen et al. 2009; Murray–Darling Basin Authority 2012; Holloway et al. 2013; Casanova 2015; Department of Science, Information Technology and Innovation and Department of Natural Resources and Mines 2017; Bowen 2019). This work has often targeted tree condition (Cunningham et al. 2007; Kath et al. 2013), and specifically improved tree condition along the Murray River (Souter 2019; Wallace et al. 2020), as a measure of adequate watering. Within the Queensland Murray–Darling Basin (QMDB), flooding is not the dominant water source supporting floodplain tree condition. These trees obtain water from a variety of other sources including the river channel, rain and shallow groundwater by a complex spatial and temporal dynamic related to landscape (Department of Science, Information Technology and Innovation and Department of Natural Resources and Mines 2017).
The focus of water managers has turned to recruitment and establishment because these processes are thought to be critically linked to river flow (Horner et al. 2009) and recruitment in the QMDB is occurring at rates below those required to maintain stable populations (Ngugi et al. 2022). In plants, recruitment includes three basic processes: germination, establishment and growth (Eriksson and Ehrlén 2008). In all these processes, floodplain trees rely on floods or a combination of floods and rainfall (Jensen 2008; Roberts and Marston 2011; Holloway et al. 2013; Balcombe et al. 2021; Fryirs and Carthey 2022). However, recruitment is preceded by seed production, and an understanding of phenology is necessary to determine the water requirements of floodplain trees to support recruitment.
Plant phenology is under the influence of seasonal and inter-annual variations in parameters such as temperature, rainfall and river discharge (Jensen et al. 2008), but is mediated by genetics (Feltrim et al. 2022) and hormonal responses (Bolotin 1975; Schaber and Badeck 2003). Discrete phases in a tree’s reproductive cycle (e.g. budding, flowering, fruit set and seed set) can be referred to as phenological events, and observational studies of these events can assist in identifying and quantifying the environmental drivers of reproduction in floodplain trees.
Two iconic eucalypt species from the Murray–Darling Basin (MDB) are the river red gum (Eucalyptus camaldulensis) (Dehnh 1832) and coolibah (Eucalyptus coolabah) (Blakely and Jacobs 1934, formerly known as E. microtheca). In the southern MDB, river red gum form large forests and rely on flooding every 1–3 years for maintenance and recruitment (Roberts and Marston 2011; Good et al. 2017). In the northern MDB, river red gum populations take the form of a thin riparian ‘ribbon’ on the high bank of rivers and streams, and good condition is supported by in-channel flows (Department of Science, Information Technology and Innovation and Department of Natural Resources and Mines 2017). Spring to summer flooding to a depth of 0.2–0.3 m and lasting for more than 6 weeks is thought to be critical for E. camaldulensis. Mainly occurring in the northern MDB and other locations to the north and west (Atlas of Living Australia 2024), coolibah commonly form a secondary riparian ribbon on areas of higher elevation adjacent to the river red gum habitat along rivers, and around waterholes, and may also extend onto the floodplain to form forests and woodlands. The condition of E. coolabah is supported by water from rainfall and shallow aquifers (Department of Science, Information Technology and Innovation and Department of Natural Resources and Mines 2017). Casanova (2015) indicates that both species depend on floods for recruitment, with germination occurring on flood recession, although recruitment of E. coolabah may also occur in areas where runoff pools. Additional moisture through the hot months is required to support establishment.
One aspect of phenology previously reported for Eucalyptus species is serotiny (Jensen 2008; Jensen et al. 2008). This is the ability of plants to retain seeds in the canopy and release them after a delay or over an extended period (Hamilton-Brown et al. 2009; Clarke et al. 2013). It is also referred to as an aerial seed bank. Serotiny is advantageous to floodplain trees because it: (a) protects seeds from predation, pathogens and senescence; (b) reduces competition amongst germinating seeds; and (c) provides an opportunity to release seed coinciding with favourable germination and establishment conditions (Lamont and Enright 2000). E. camaldulensis exhibits serotiny in most locations, and E. coolabah exhibits it only at some locations (Capon et al. 2016a). It has been suggested that serotiny is triggered by poor tree condition (George 2004) or increasing moisture deficit (Christensen and Kimber 1975).
The phenology of river red gum (Dexter 1970; George 2004; Jensen et al. 2007; Jensen 2008; Jensen and Walker 2017) and coolibah (Roberts 1993; Pettit 2002; Boland et al. 2006) has been investigated previously. These studies have shown that the seasonality of flowering can be highly variable within the MDB for both species (Jensen et al. 2008; Roberts and Marston 2011), which may be related to phenological variation between the seven subspecies of E. camaldulensis (Butcher et al. 2009; McDonald et al. 2009) and three subspecies of E. coolabah (Hill and Johnson 1995). Phenological studies of E. coolabah have been rare, and those few that are available have been based on few observations (e.g. Roberts 1993), were carried out on a limited sample of trees (e.g. Khan 1970), looked at only one aspect of reproductive phenology (e.g. seed production) (e.g. Gillen 2017) or were conducted outside the MDB (e.g. Pettit 2002). There were no studies where the relationship between the timing of phenological events in E. coolabah and environmental parameters were examined, and the authors are not aware of any comprehensive studies of the phenology of either species that were conducted in the QMDB or continued for a similar period. Given the known variability, and the scale of the MDB (1.06 × 10⁶ km2), it is important to determine phenological patterns from local observations rather than rely on research conducted in other locations. Therefore, the 6-year dataset presented herein makes a substantial contribution to the body of knowledge that enables MDB water managers to support seed production and recruitment in floodplain tree populations. The longevity of the study provides the best opportunity to date to investigate correlations with environmental parameters.
This study investigates the phenological cycles of E. camaldulensis and E. coolabah populations within the northern MDB to determine:
How the observed cycles differ from those reported for E. camaldulensis in the central and lower Murray regions, as described in published literature, and
Whether environmental parameters can be correlated with the (a) timing and (b) abundance of phenological events in of E. camaldulensis and E. coolabah at the population level.
Materials and methods
Study area
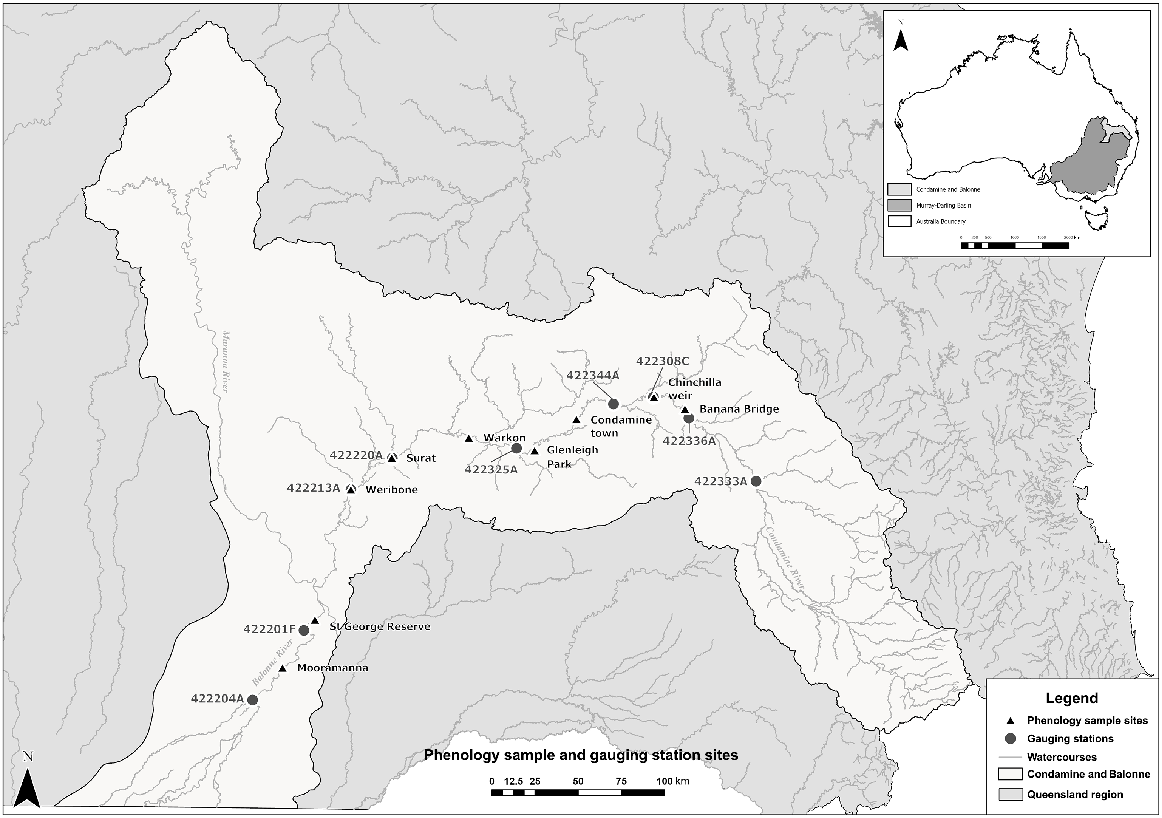
Phenological sites were distributed across the Condamine–Balonne River system (in the QMDB) from Mooramanna Station south of St George to Banana Bridge at Brigalow in the north-east of the catchment (Fig. 1). This watercourse is 1195 km long and has a catchment area of 13,292 km2. Within the catchment, surface-water, groundwater and overland flow are regulated for irrigated cropping, coal-seam gas production and urban supplies. There are two major storages – Leslie Dam and Beardmore Dam – and a number of weirs that serve supplemented water supply schemes (Department of Regional Development, Manufacturing and Water 2024a). The catchment extends from the Great Dividing Range and to the Balonne River floodplains, where it continues into New South Wales. The eastern part of the catchment has an elevation of ~1400 m above sea level (ASL) and is composed of slopes and tablelands. In the south-west, there are flat, semi-arid plains with elevations of ~100–200 m ASL (Commonwealth Environmental Water Holder 2021; Murray–Darling Basin Authority 2021).
The Condamine–Balonne Water Plan Area, indicating the location of phenology sample sites and water monitoring gauges.
The Condamine–Balonne catchment experiences a semi-arid climate where rainfall occurs mainly in summer. Average annual rainfall ranges from 1200 mm in the east to 400 mm in the west (Department of Regional Development, Manufacturing and Water 2024a). Average daily maximum temperatures at Surat occur in January (34.4°C), and average minima occur in July (4.4°C) (Bureau of Meteorology 2021a). Over the longer term, wet years are followed by droughts that are then broken by large floods. Rainfall minus evapotranspiration ranges from 0 to 100 mm, and average soil moisture ranges from <25 to 75 mm (Bureau of Meteorology 2021b). River flows usually cease over the winter period and are highly variable for the remainder of the year. Average streamflow ranges from 0–1.16 m3 s−1 in upland reaches to 115.74–578.70 m3 s−1 in the middle reaches (Bureau of Meteorology 2021c) and then reduces downstream of St George, where the main river channel bifurcates into a series of distributary channels.
Flood events vary in extent and frequency but usually occur in summer and autumn (Bureau of Meteorology 2017) and may be associated with cyclonic weather patterns further north (Penton et al. 2023). Events lower in the catchment are not usually correlated with local rainfall, but rainfall in the upland regions (Thoms and Sheldon 2002). At the Surat flow gauge (422220A Balonne River at Surat), water heights above the minor flood height (5.0 m) have occurred in 16 of the last 20 years, but major floods (>9.0 m) have occurred in only seven of these years (Department of Regional Development, Manufacturing and Water 2024b). Floods often occur together as a sequence of events of various magnitudes (Murray–Darling Basin Authority 2010). Frequency ranges from several events each year to once every 5 years (Murray–Darling Basin Authority 2010). When the floodplain is inundated, water depth can reach up to 10 m with a duration of a few days to several months (Smith et al. 2006).
Survey methods
Phenological surveys were conducted monthly, as far as was possible, between October 2015 and May 2021 at nine sites. Each site was ~2.0–2.5 ha in area, parallel to the bank of the Condamine or Balonne River and situated in mixed riparian woodland dominated by E. camaldulensis and E. coolabah. At each site, sample trees were selected using a modified ‘random walk’ technique (Allaby 2006; Dytham 2011). Using a starting position near the middle of the site, the first of a randomly generated sequence based on eight compass points was used to determine the direction of movement, and the first tree in that direction was then: (a) identified as either E. camaldulensis, E. coolabah or another species (referring to Costermans 1992; Anderson 1993; Boland et al. 2006; McDonald et al. 2009) and (b) inspected for signs of reproductive maturity (>10 cm DBH, visible buds, flowers or fruits). For reproductively mature E. camaldulensis and E. coolabah, phenological observations were made. From the location of the observed tree, the next direction from the random sequence was used to select the next tree, repeating the procedure until observations had been recorded for five individuals of each species. On subsequent sampling occasions, no attempt was made to avoid individuals for which observations had been recorded at other times.
A single set of phenological observations was made by one of two observers at each site for each survey date. Selected trees were scanned using binoculars and a qualitative assessment of the relative abundance (hereafter referred to as abundance) of phenological events (immature buds, mature buds, open flowers, finished flowers, closed fruit and open fruit) was made. The scoring methodology was adapted from Jensen (2008). The abundance of each phenological parameter relative to its maximum observed abundance was given a score between zero and four. Scores were 0 = absent, 1 = low volume (<25%), 2 = medium volume (25–50%), 3 = high volume (50–75%) and 4 = very high volume (>75%). For a given phenological event, the mean of the score of five trees was used to represent abundance for that species on a given survey date and site.
Immature buds were defined as small in size and early in development. Mature buds were larger and more developed. Flowers were identified by the expression of the stamen and anther. Closed mature fruit were identified as the swollen green ovary with closed valves and no flower parts present, and open fruit were characterised as brown with open valves. Sampling did not capture the flowering period of E. camaldulensis at some sites in 2018 and 2019. However, observations of finished flowers on subsequent sampling occasions were taken as evidence that flowering had occurred.
Logically, the ultimate yield of seeds will depend on the initial abundance of immature buds, with reducing abundance over time for mature buds, flowers and fruits due to damage, predation and abscission. However, we did not assume that buds were only set once each year and simply recorded abundance for each phenological event without reference to abundances that had previously been recorded. This is because, by randomly selecting the trees for which observations were recorded, we were tracking phenology at the population level, and it could not be assumed that all trees were following the same pattern.
All observers were trained by the same instructor and given the same instructions regarding identification of buds, flowers and fruit, and estimating their abundance. Prior to surveys commencing, the instructor and the observer assessed the same set of trees, with the observer adjusting assessments according to the trainer’s observations. At the completion of data collection, the Chi-Square test was used to evaluate observer bias. Scores for both species, collected in December, January and February of any year, were included in the test data and the frequency at which each observer recorded a particular score (0, 1, 2, 3, 4) was assessed. The critical value for this test was 7.81 for finished flowers and 9.49 for all other phenological events. For each of seven observers scoring phenological parameters, with five possible results (d.f. = 24), this test has shown that observers and scores do not vary independently (α = 0.05; P < 0.0001) for all parameters excluding finished flowers. For finished flowers, there were too few observations at higher abundance scores to conduct a valid test. Some differences in scoring between observers was detected for buds, for which abundance tended to vary with moisture. It was concluded that the differences in scoring between observers at similar times in different years were driven by differences in rainfall between years.
Environmental data
River discharge (m3 s−1) data (total monthly discharge, mean monthly discharge) and mean monthly water level for the study period were sourced from the Department of Regional Development, Manufacturing and Water (DRDMW) gauging station closest to each survey site (Fig. 1). Maximum discharge at each site ranged from 48.4 m3 s−1 at Loudoun’s Bridge to 517 m3 s−1 at St George and seven flood events occurred during the survey period. Not all floods were recorded at all gauges. For the purposes of calculating correlations, floods were defined as discharge above 25 m3 s−1. This was the highest monthly discharge (at increments of 5 m3 s−1) able to identify floods at two or more survey sites. These floods occurred between September and April. Flood days were identified as dates when the water level (m) was above the minor, moderate or major flood height designated by the Bureau of Meteorology (The Bureau) at the nearest flood warning river height station (Bureau of Meteorology 2022). Monthly rainfall (mm) and mean monthly temperature data were collected from DRDMW gauging stations where available, and from The Bureau weather stations at St George Airport, Surat, Condamine, Dalby Airport and Miles Constance Street. Rainfall 12 months prior is described as the monthly rainfall in the same calendar month, but in the previous year.
Data analysis
Variation in average abundance score between sites and years was examined with two-factor Kruskal–Wallis test for each phenological event for each species. Average abundance was calculated as the average score of all trees at each site in each year for each phenological parameter.
The periodic nature of phenological data is best summarised using circular (or angular) statistics (Jammalamadaka and SenGupta 2001), as opposed to linear statistics, as many phenological events occur in repeating annual cycles. Similarly, the results for phenological surveys have been presented as radial plots. Plots were created using the R packages circlize (ver. 0.4.15, see https://cran.r-project.org/package=circlize; Gu et al. 2014) and circular (ver. 0.5-0, C. Agostinelli and U. Lund, see https://CRAN.R-project.org/package=circular). Each radial plot is divided into months and shows a histogram of the mean score for each phenological event recorded in that month of the year.
Descriptive statistics were calculated using the mean score for each phenological event at each site, and the survey date expressed as the day of calendar year (DOY). The DOY was converted to an angle expressed in radians (α) (where a full year is represented by 2π radians). Data for all years were combined but calculated separately for each species. Using this approach, if each data point was represented by a vector, the direction would indicate DOY, and the length would indicate the mean abundance. Unlike with linear statistics, events occurring in December and January are recognised as occurring at similar times. Calculations to convert dates to angles were conducted in Excel for Microsoft 365 (ver. 2404, Microsoft). The R package, CircStats (ver. 0.2-6, C. Agostinelli and U. Lund, see https://cran.r-project.org/package=CircStats), was used for statistical calculations. For each phenological event in each species, the following statistics were calculated: sample size (n), mean direction (), resultant mean length (), circular variance (V, 1 ÷ κ), circular concentration (κ) (values of κ close to zero indicate a uniform distribution, as κ increases it approaches the von Mises, or circular normal, distribution), circular standard deviation (v) and circular range (r) (radians). The Rayleigh test for uniformity was also conducted to assess the significance of the mean resultant length, expressed as a P-value.
Correlations between phenological events and environmental parameters were calculated using Spearman’s rank correlation (for data with tied ranks). Environmental parameters measured on the survey date were compared with the mean phenological score for each species, at each site on that date. Positive relationships are indicated by positive numbers and inverse relationships by negative numbers. The strength of correlation can be described as very weak (0–0.2), weak (0.2–0.4), moderate (0.4–0.6), strong (0.6–0.8) or very strong (0.8–1.0).
Correlations with environmental parameters were further explored using principal coordinates analysis (PCA). PCA was performed using RStudio software (ver. 1.2.1555, Posit Software, PBC, Boston, MA, USA, see https://posit.co/products/open-source/rstudio/) and R libraries cluster (ver. 2.1.4, M. Maechler et al., see https://CRAN.R-project.org/package=cluster/), vegan (ver. 2.6-4, J. Oksanen et al., see https://cran.r-project.org/package=vegan/), circular (ver. 0.5-0) and lubridate (ver. 1.9.3, see https://cran.r-project.org/package=lubridate; Grolemund and Wickham 2011). Dates for phenology and environmental variables were converted to degrees and each year began at day 1, combining data for all years. Environmental variables included monthly rainfall (mm), mean monthly temperature (°C), total monthly discharge (ML), monthly mean water level (m), number of minor and major flood days and monthly rainfall with a 12-month lag period. Given that both continuous and categorical (score) data were being used, dissimilarity matrixes were generated separately for E. coolabah and E. camaldulensis phenology score data using the ‘daisy’ function and Gower distance metric, which is suitable for mixed data types. PCA (Gower 1966) was performed using the ‘cmdscale’ function, returning eigen values for two dimensions. These data were transformed to vectors using the ‘envfit’ function and plotted on two dimensions.
Linear regression was used to explore an association between the El Niño–Southern Oscillation Index (ENSO) and bud abundance. We defined a year as the 12-month period extending from July to June, and used site mean phenology scores collected over 6 years. Linear regression was calculated for the maximum annual abundance of immature and mature buds against the mean Southern Oscillation Index (SOI) for the first 6 months of each year. Regression was also calculated for the first 3 months of the budding season relevant to each species (spring for coolibah, summer for river red gum). SOI data were obtained from the Bureau of Meteorology (2024).
Results
Descriptive statistics
Two-factor Kruskal–Wallis test indicated that there was no significant difference in the abundance of phenological events between sites for either E. camaldulensis or E. coolabah, but there was a significant difference between years (P < 0.05) (Supplementary Tables S1 and S2).
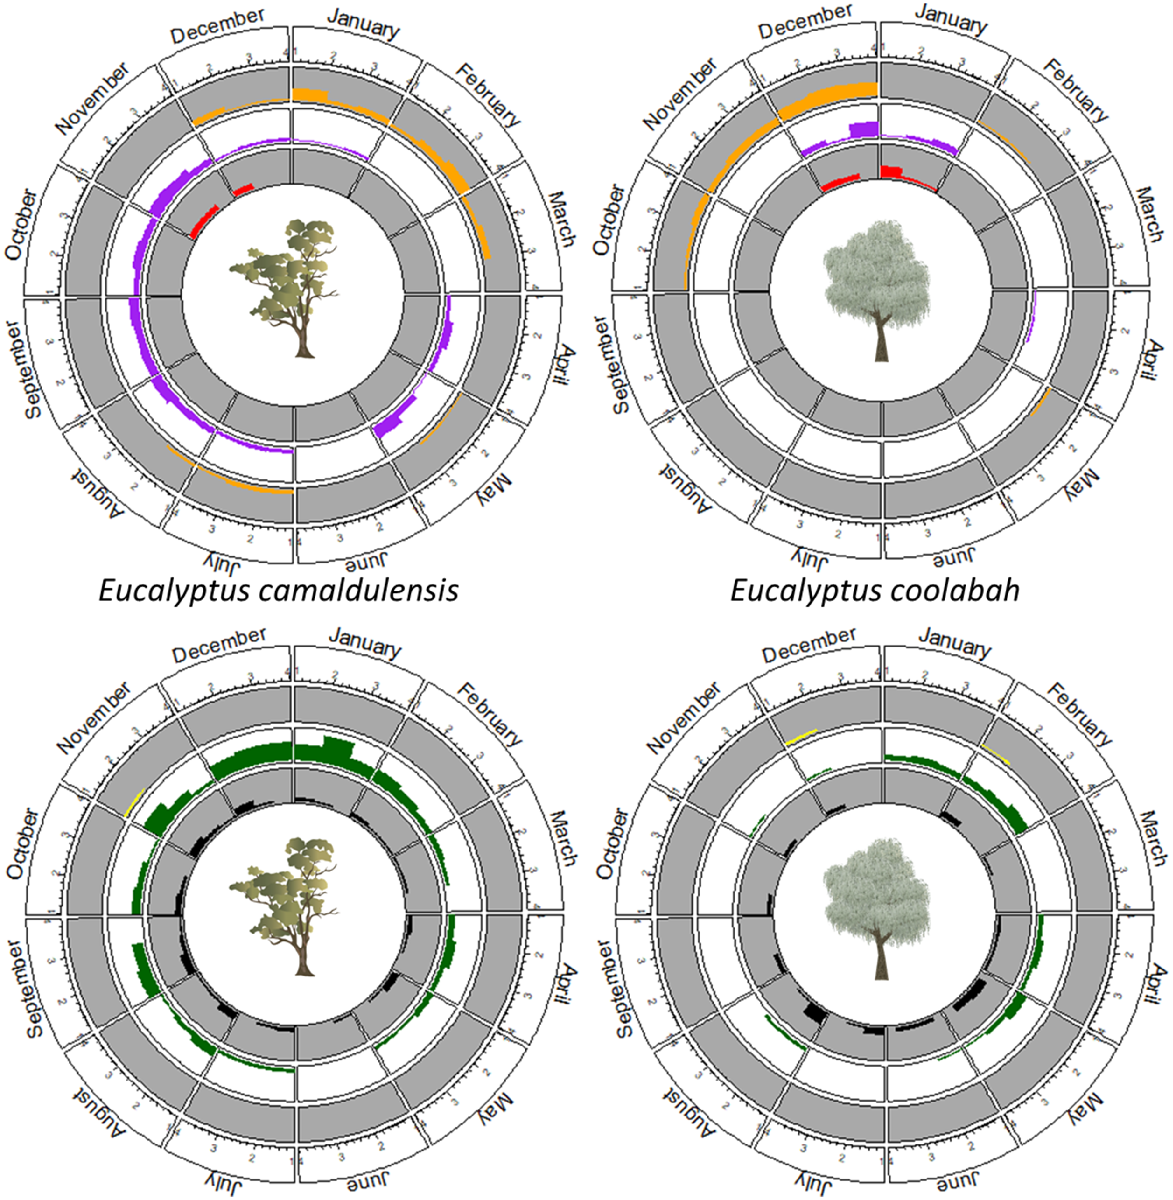
The timing of budding, flowering and fruiting in E. camaldulensis was consistent across all sites and years (Fig. 2). Immature buds were first observed as early as January, and these developed into mature buds during March and April each year. Mature buds persisted until November or December. The first flowers were observed in October but flowering typically peaked in November and December, with fruit developing shortly thereafter. Mature fruit was first observed from February to April in the following year, although some trees carried fruit in the canopy throughout the year. Open mature fruit increased in abundance c. April and May, indicating that seed fall began at this time (Fig. S1).
Circular plots showing the monthly histograms of survey scores of each phenological event over the annual cycle, summarising the 6 years of survey data. Plots for E. camaldulensis are on the left and for E. coolabah on the right. For each species, the upper plot shows histograms for immature buds (orange, outer track), mature buds (purple, middle track) and flowers (red, inside track), whereas the lower plot shows histograms for finished flowers (yellow, outer track), closed mature fruit (green, middle track) and open mature fruit (black, inside track). Counts of zero scores have been omitted from these histograms to improve clarity.
Analysis of these results with circular statistics (Table 1) indicated a 2–3-year cycle preceded by bud initiation in the spring of year 0 and immature buds being most frequently observed in January (year 1). The mean directions for mature buds, flowers and finished flowers were September (year 1), December (year 1) and late December (year 1) respectively. The mean directions for closed and open mature fruits were January (year 2) and September (year 2) respectively. The mean direction of January (year 2) for closed fruit is consistent with the presence of fruit from two reproductive cycles, beginning 1 year apart. If it is assumed that closed fruit are retained on the tree for more than 12 months, open fruit would appear in year 3. These data also indicate that seed fall is likely to occur between January and September in the second or third year after bud initiation.
| E. camaldulensis | n | (rad) | Month | Non-uniformity, P-value | V (var) | r | Circular range (rad) | κ | ||
|---|---|---|---|---|---|---|---|---|---|---|
| Immature buds | 607 | 0.2098 | January | 0.5968 | Yes, <0.05 | 0.4032 | 362.27 | 5.45 | 1.50 | |
| Mature buds | 1182 | 4.5983 | September | 0.3438 | Yes, <0.05 | 0.6562 | 406.39 | 5.58 | 0.73 | |
| Flowers | 283 | 5.8505 | December | 0.8429 | Yes, <0.05 | 0.1571 | 238.54 | 2.73 | 3.51 | |
| Finished flowers | 112 | 6.2489 | December | 0.7986 | Yes, <0.05 | 0.2014 | 89.45 | 3.74 | 2.85 | |
| Closed mature fruit | 1684 | 0.3162 | January | 0.3045 | Yes, <0.05 | 0.6954 | 512.94 | 5.87 | 0.64 | |
| Open mature fruit | 1759 | 4.5256 | September | 0.1408 | Yes, <0.05 | 0.8596 | 246.93 | 5.87 | 0.28 |
‘n’ indicates the number of observations (tree) where the phenological event was observed. Zero radians represent 1 January.
The circular range indicates the dispersion of events throughout the year. These results show that immature buds, mature buds, closed mature fruit and open mature fruit may be present on trees within a population for 82–93% of the year (299–339 days). Flowering and finished flowers were more concentrated in specific times of the year (158 and 217 days respectively), as indicated by kappa (κ) values significantly greater than zero, variance closer to zero and ρ̅ close to 1.0. Significant results in the Rayleigh test indicates that all phenological events are distributed non-uniformly relative to the calendar year.
The highest abundance of immature buds occurred between December and March, and high abundances were also observed in May and June. Mature bud abundance was high between March and early December. Highest abundances of flowers and finished flowers were observed from late December–January and October–February respectively. Closed and open mature fruit were observed in higher abundances between October and March, and between July and December respectively.
Dry conditions occurred between 2016 and 2019. The study area experienced below average rainfall and low river discharge. The abundance of mature buds decreased over time. Subsequently, lower abundances of flowers and fruits were reported across all sites. All sites showed an increase in average abundance of mature buds in January 2019 and December 2020. These increases followed rainfall events and elevated stream discharge.
The timing of E. coolabah budding, flowering and fruiting was consistent across all sites and years (Fig. 2). Immature buds were first observed in November and December, and these developed into mature buds in December and January and flowers later in January. At some sites, buds and flowers were also observed after January, following heavy rain or inundation. Closed mature fruits that first appeared in January–February were most abundant in May and continued to be observed until August. In 2017, <50% abundance of closed fruit was observed into October and November, with increased abundance in January 2018 in conjunction with flowering. In 2019, closed fruit were >75% abundant from February until August, then abundances decreased until December and, as in 2018, increased abundance was observed in January 2020 (associated with recent flowering but no flowers were observed). The years 2017 and 2019 were comparatively dry (see Fig. S2). Open mature fruit were most abundant during May and June, indicating seed fall (Fig. S2). Open fruit usually remained on the tree until c. October.
Circular statistics for E. coolabah are shown in Table 2. The mean direction () indicates that immature buds and mature buds appear in quick succession during December. However, the circular range results indicate that these events are co-occurring at the population level. The mean directions of flowering, finished flowers, closed mature fruit and open mature fruit were January, late January, March and August respectively. This suggests that seeds were shed between March and August each year. Based on the circular range results, closed and open mature fruit may be present on trees within a population for more than 92% of the year. Kappa (κ) values, variance and indicate that flowering was brief, occurring over 54 days, whereas finished flowers persisted for 139 days. Immature buds and mature buds were present on 238 and 230 days respectively. Significant results in the Rayleigh test indicated that all phenological events were distributed non-uniformly relative to the calendar year. Despite not recording any flowering or budding at some sites, on some occasions, there was usually evidence to show that flowering did occur, namely buds before and fruit or finished flowers after.
| E. coolabah | n | (rad) | Month | Non-uniformity, P-value | V (var) | r | Circular range (rad) | κ | ||
|---|---|---|---|---|---|---|---|---|---|---|
| Immature buds | 394 | 5.6875 | December | 0.8687 | Yes, <0.05 | 0.1313 | 342.27 | 4.10 | 4.11 | |
| Mature buds | 201 | 6.1769 | December | 0.9156 | Yes, <0.05 | 0.0844 | 184.03 | 3.95 | 6.20 | |
| Flowers | 188 | 0.1233 | January | 0.9703 | Yes, <0.05 | 0.0297 | 182.41 | 0.93 | 17.07 | |
| Finished flowers | 78 | 0.3767 | January | 0.9326 | Yes, <0.05 | 0.0674 | 72.75 | 2.39 | 7.70 | |
| Closed mature fruit | 671 | 1.0506 | March | 0.5403 | Yes, <0.05 | 0.4597 | 362.56 | 5.80 | 1.28 | |
| Open mature fruit | 959 | 3.9145 | August | 0.1520 | Yes, <0.05 | 0.8480 | 145.82 | 5.87 | 0.31 |
Zero radians represent 1 January.
Immature buds were most abundant between October and December, but lower abundance crops were occasionally observed. Mature bud abundance remained consistently high between November and late January. Flowers were most abundant during early January and finished flowers during late December with lower abundances being observed until late February. Closed and open mature fruit were observed in higher abundances from January to August and from April to September respectively. At all sites, buds were produced every year. In some years there were more abundant or multiple bud crops.
Correlation with environmental parameters
Calculation of Spearman’s rank correlation coefficient indicated that the abundance of phenological parameters in E. camaldulensis was weakly correlated with most of the environmental parameters considered (Table 3). Although we did not examine correlations with time of year and solar exposure, they are highly correlated with temperature, and so correlations with temperature may also indicate correlation with these factors. Spearman’s rank correlation coefficient for mature buds and temperature was −0.53, indicating that mature buds were mainly observed in cooler months. Although observations of finished flowers were rare, there was a moderate positive correlation between temperature and finished flowers, consistent with most of these observations occurring during the hottest months. The strongest correlations for flowers and closed mature fruit were with temperature, although these were weak (0.22) and very weak (0.17) respectively. On a site-by-site basis, finished flowers had moderate positive correlations with temperature at upstream sites (Banana Bridge, Chinchilla Weir, Condamine, Glenleigh Park, Warkon and Werribone) and the magnitude of correlation tended to decrease in a downstream direction (data not shown).
| Spearman’s rho (ρ) | Immature buds | Mature buds | Flowers | Finished flowers | Closed mature fruit | Open mature fruit | |
|---|---|---|---|---|---|---|---|
| n | 412 | 412 | 412 | 412 | 412 | 412 | |
| Rainfall (mm) | 0.2556 | −0.2803 | −0.0202 | −0.0126 | 0.0392 | −0.0558 | |
| Rainfall 12 months prior (mm) | 0.1902 | −0.1821 | 0.0560 | 0.0115 | 0.0843 | −0.2229 | |
| Temperature (°C) | 0.2686 | −0.5272 | 0.2235 | 0.4114 | 0.1721 | −0.1400 | |
| Total monthly discharge (ML) | 0.1313 | −0.1679 | −0.0032 | −0.0514 | −0.0104 | −0.1543 | |
| Mean monthly discharge (m3 s−1) | 0.1258 | −0.1708 | −0.0179 | −0.0467 | −0.0350 | −0.1251 | |
| Mean monthly water level (m) | 0.0267 | −0.0123 | 0.0424 | 0.0951 | −0.0683 | 0.2177 | |
| Minor flood days | −0.0873 | −0.0364 | −0.0604 | −0.0171 | −0.0383 | −0.0028 | |
| Moderate flood days | −0.0701 | −0.0367 | −0.0334 | 0.0443 | −0.0036 | −0.0063 | |
| Major flood days | −0.0403 | −0.0755 | −0.0192 | 0.0213 | −0.0312 | −0.0867 |
Positive or negative numbers greater than 0.5 indicate strong correlations (bold value). Positive or negative numbers greater than 0.2 indicate moderate correlations (italic values). Spearman’s rho (ρ) varies between −1 and +1, with negative values indicating an inverse relationship.
Immature buds were weakly to very weakly but positively correlated, in diminishing order, with rainfall, rainfall 12 months prior, total monthly discharge and mean monthly discharge. Mature buds were negatively correlated with all moisture-related parameters, indicating higher abundances in drier months. Open mature fruit were positively but weakly correlated with mean monthly water level and negatively but weakly correlated with rainfall 12 months prior. Flowers showed neither a positive nor negative correlation with rainfall. However, at some sites (Surat, Warkon and Weribone) there was a weak positive correlation with rainfall 12 months prior (0.19, 0.22 and 0.30 respectively). At sites downstream of Glenleigh Park, closed mature fruit were very weakly but positively correlated with rainfall 12 months prior (Glenleigh Park 0.08, Surat 0.19, Warkon 0.12, Werribone 0.20, St George 0.15, Mooramanna 0.10). At Mooramanna, flowers (0.34) and open mature fruit (0.25) had weak positive correlations with minor flood days.
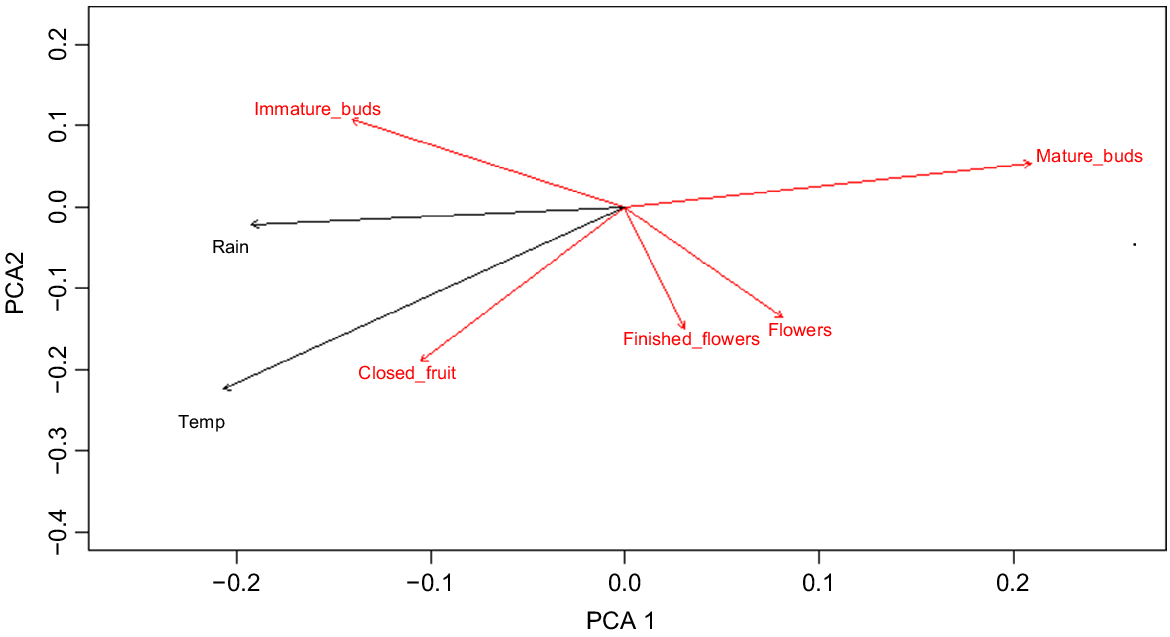
Principle coordinates analysis of E. camaldulensis phenological data at a significance level of P = 0.05 (Fig. 3) shows that temperature and closed fruit occupy similar ordination space, as do rain and immature buds. At a significance level of P = 0.25, finished flowers are correlated with major flood days and open fruit are correlated with rainfall 12 months prior. These similarities indicate that these phenological events occur at a similar time of year to the environmental parameters. The mature bud vector has an opposite direction to that of rainfall, indicating an inverse relationship, or that mature buds occur during drier months.
A 2-D plot of principle components analysis (PCA) of phenological event data for E. camaldulensis (red vectors), overlain by analysis of environmental variables (black vectors), plotted with respect to the day of year expressed in degrees (P = 0.05).
Linear regression showed that the maximum abundance of mature buds increased with the SOI in a linear manner (r2 = 0.82, P = 0.01). Regressions against immature buds were not significant (see Fig. S3a).
Calculation of Spearman’s rank correlation coefficient indicates that phenological parameters in E. coolabah are weakly and negatively correlated with the environmental parameters considered here (Table 4). Open mature fruit were strongly and negatively correlated with temperature at all sites (−0.52), indicating frequent observation of open fruit during the cooler months. This correlation was progressively more negative at more downstream sites. Immature buds were positively correlated with temperature (0.37). Flowers had a moderate positive correlation with temperature at all sites (0.47), being observed during the warmer months, and correlation was more positive with distance downstream.
| Spearman’s rho (ρ)A | Immature buds | Mature buds | Flowers | Finished flowers | Closed mature fruit | Open mature fruit | |
|---|---|---|---|---|---|---|---|
| n | 292 | 292 | 292 | 292 | 292 | 292 | |
| Rainfall (mm) | 0.1777 | −0.1618 | −0.1148 | −0.0741 | −0.0719 | −0.2149 | |
| Rainfall 12 months prior (mm) | 0.1391 | −0.0519 | 0.1124 | 0.1183 | −0.0299 | −0.1311 | |
| Temperature (°C) | 0.3694 | 0.2871 | 0.4650 | 0.2958 | 0.1806 | −0.5202 | |
| Total monthly discharge (ML) | 0.1586 | −0.0758 | −0.0662 | 0.0269 | 0.0410 | −0.0806 | |
| Mean monthly discharge (m3 s−1) | 0.1660 | −0.0825 | −0.0499 | 0.0146 | 0.0615 | −0.0869 | |
| Mean monthly water level (m) | 0.0663 | −0.0451 | −0.0131 | −0.0316 | 0.0849 | 0.0847 | |
| Minor flood days | 0.1601 | −0.0730 | −0.0833 | −0.0694 | −0.0613 | 0.0327 | |
| Moderate flood days | 0.1454 | −0.0413 | −0.0471 | −0.0392 | −0.0247 | −0.0533 | |
| Major flood days | 0.2088 | −0.0237 | −0.0270 | −0.0225 | −0.0732 | −0.1016 |
Immature buds were weakly to very weakly but positively correlated, in diminishing order, with temperature, major flood days, rainfall, mean monthly discharge, minor flood days, total monthly discharge, moderate flood days, rainfall 12 months prior and mean monthly water level. Their correlation with rainfall 12 months prior is most positive at sites upstream of Surat Weir but neutral to negative at downstream sites (data not shown). The strength of correlation between immature buds and mean monthly water level and flood days varies between sites, ranging from very weak to weak. Immature buds are weakly and positively correlated with water level and minor flood days at sites upstream of Weribone, moderately and positively correlated with moderate flood days at Banana Bridge, Chinchilla Weir and Condamine Town, and moderately and positively correlated with major flood days at Chinchilla Weir and Condamine Town.
Mature buds were not positively correlated with any of the moisture parameters. Flowers and finished flowers were very weakly but positively correlated with rainfall 12 months prior. This correlation is weak at sites upstream of Surat Weir and neutral at sites downstream. Closed mature fruit were not correlated with any moisture parameter, whereas open mature fruit had a moderate negative correlation with temperature and a weak negative correlation with rainfall.
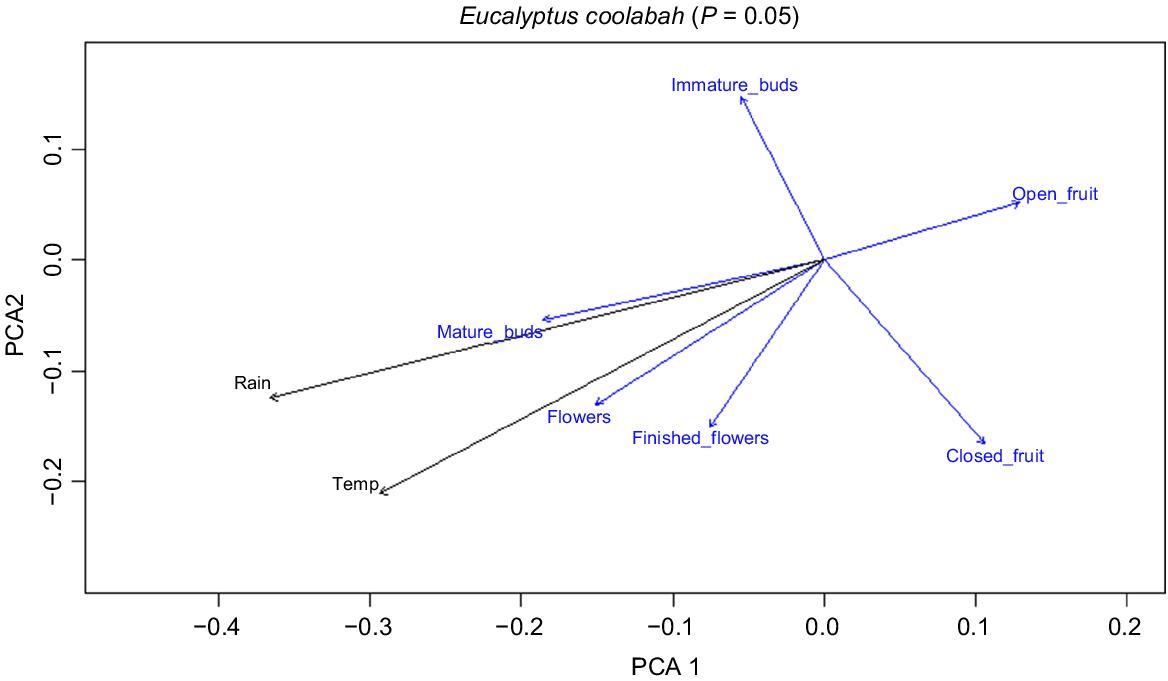
Principle coordinates analysis of E. coolabah phenological data at a significance level of P = 0.05 (Fig. 4) shows that mean monthly rainfall and mature buds occupy similar ordination space, as do temperature and flowers. Similarity at the P = 0.25 level (not shown) indicates that major flood days are closely aligned with immature buds, minor flood days with open fruit, and mean monthly rainfall 12 months prior to the observation with closed fruit.
A 2-D plot of principle components analysis (PCA) of phenological event data for E. coolabah (blue vectors), overlain by analysis of environmental variables (black vectors), plotted with respect to the day of year expressed in degrees (P = 0.05).
Linear regression showed that the maximum annual abundance of immature buds increased with the SOI in a linear manner (r2 = 0.77, P = 0.02) (see Fig. S3b). Regressions against mature buds and immature buds during spring only were not significant.
Discussion
This study has contributed to the understanding of the phenology of E. camaldulensis and E. coolabah by providing northern MDB data relating to the timing and abundance of bud set, flowering and fruiting. The phenological data collected in the QMDB over the study period show that the timing and abundance of phenological events in E. camaldulensis does not differ between the northern and southern regions (George 2004; Jensen et al. 2007) of the MDB, except that flowering may begin earlier. The hypothesis that phenological events occur on a seasonal basis and are not influenced by water-related environmental parameters, was partially supported for E. coolabah, except that this species will produce more abundant or additional bud crops in response to higher moisture availability.
The timing and abundance of phenological events
Much of the previous research into the phenology of E. camaldulensis was conducted in the southern MDB, where there is evidence that bud abundance varies directly with water availability (Jensen et al. 2008). As the seasonality, distribution and intensity of rainfall differs markedly between the southern and northern MDB, it was expected that substantial differences in timing and abundance of phenological events in E. camaldulensis would occur as a consequence. However, the phenological cycles of E. camaldulensis along the Condamine and Balonne Rivers were similar to those reported in the southern MDB, except with respect to flowering.
Significantly less published work has focused on E. coolabah. This may be because the distribution of E. coolabah is mainly in the northern MDB, it is found under more arid conditions and has less value for forestry. Our observations of E. coolabah phenology were consistent with the published literature, and additional knowledge was gathered. Overall, analysis of E. coolabah phenology suggested that the timing of phenological events is driven by the time of year (as indicated by temperature) and that high levels of moisture availability promote more abundant bud initiation.
Eucalyptus camaldulensis and E. coolabah differed in the length of their phenological cycles and the period for which buds and fruits were retained in the canopy. E. camaldulensis buds and fruits were commonly seen together on a single tree, and sometimes on a single branch, whereas E. coolabah fruits and buds did not co-occur.
Immature buds began to develop very soon after flowering (January and February) and had developed into mature buds by April. These persisted until November–December. As Jensen et al. (2007) did not differentiate between immature and mature buds, they found buds were retained for up to 12 months before flowering and were present in all months. A study of bud development in a plantation of E. globulus ssp. globulus consisting of multiple genotypes (Jones et al. 2011) found that bud initiation occurred simultaneously across all trees, and identified temperature, measured as mean heat sum and expressed as degree days (Trudgill et al. 2005), as the main driver of the timing of bud initiation. The mean heat sum was the cumulative total of mean daily temperature above a baseline of 5°C between 1 April and bud initiation. However, Jones et al. (2011) did not consider correlations with rainfall or soil moisture. Our study found that the development of immature buds in E. camaldulensis, while most strongly correlated with temperature, was also positively correlated with rainfall in the current year and mean monthly water level.
Higher mature bud abundance was correlated with higher mean SOI values, indicating that La Niña weather patterns are associated with higher bud abundance. La Niña weather patterns bring cloudier and wetter conditions in northern Australia, wetter wet seasons and above average winter–spring rainfall in eastern Australia, and this result suggests that wetter conditions over winter and spring may stimulate growth and bud production in the following months.
Flowering begins earlier in the northern MDB than it does in the south, and the flowering period is longer. In the southern MDB, flowering from November to December is typical (Dexter 1978; Birtchnell and Gibson 2006; Jensen 2008; Butcher et al. 2009), whereas in the northern MDB we have found that flowering began in October and peaked in November and December. August and September flowering events occurred at the more upstream sites and were of low abundance. Trees defoliated by a storm event at Chinchilla Weir in October 2015 produced light crops of flowers beginning in September 2017, November 2018, August 2019 and October 2020. Flowers were not observed during the months of January to July, but finished flowers were observed in February at Chinchilla Weir, Warkon and Weribone, suggesting that flowering had extended into January. We did not differentiate between the sub-species of E. camaldulensis, but Butcher et al. (2009) identified populations of E. camaldulensis ssp. acuminata and E. c. ssp. camaldulensis in the Queensland MDB and found that E. c. ssp. acuminata flowered between August and September, whereas E. c. ssp. camaldulensis flowered from mid-November to mid-January. This suggests that individuals flowering in August and September at more upstream sites were E. c. ssp. acuminata.
Flowering time in E. camaldulensis was most strongly correlated with temperature. This is consistent with findings for other Eucalyptus species, such as E. globulus ssp. globulus (Jones et al. 2011) and Eucalyptus nitens (Barbour et al. 2006). Jones et al. (2011) concluded that the duration of the period between bud set and flowering was determined by genotype, but that year to year variability in flowering time was controlled by the mean heat sum, which was consistent between years. If control of flowering time by mean heat sum applies to E. camaldulensis, climatic differences between the southern and northern MDB should produce an earlier peak flowering time in the north. However, we found that the period between bud set and peak flowering in the northern MDB was consistent with observations reported by Jensen et al. (2007) for the southern MDB. It is possible this inconsistency is due to: (a) variability in the flowering time between years; (b) differences between sub-species; or (c) adaptation to local conditions. However, it is unlikely that temperature alone is sufficient to explain the variation in flowering time for E. camaldulensis, and there will be an interplay between environmental, genetic and biochemical factors (Jones et al. 2011).
Fruit development closely followed flowering in E. camaldulensis, commencing a year after bud initiation. The highest abundance of closed fruit was observed between December and April, but closed fruit were observed in all months. Other authors have found that closed fruit persist for up to 24 months before dehiscence (George 2004; Jensen et al. 2007; Jensen 2008). There were periods at some sites when no fruit were observed: at Chinchilla Weir for 2 years following defoliation by a severe storm in October 2015, and at the Mooramanna site between May 2017 and October 2017. In both cases, heavy fruit crops were observed in the following summer (December to April). Fruit absence for up to 7 months was also reported by Jensen et al. (2007), who suggested this was due to drought conditions triggering abscission. The absence of fruits may also be explained by wildlife that nip off branches (pruning) or consume fruit and flowers. Species known to prune or browse E. camaldulensis include little corellas (Cacatua sanguinea) (Badman 1989; Palmer 1991; St John 1994), sulfur-crested cockatoos (Cacatua galerita) (Polley and Lill 2021) and common brush-tailed possums (Trichosurus vulpecula) (Voller and Eddie 1995). Trees may be extensively damaged by these species (Voller and Eddie 1995; Bomford and Sinclair 2002) but usually recover their condition over the winter months. When food is scarce, such as during droughts, feeding, roosting and pruning activity may reduce the annual seed yield (St John 1994).
Observed abundance of open mature fruit was, on average, greatest in April and May, indicating that seedfall is likely to peak at this time (seed production was not measured in this study). However, the month with the highest abundance of open fruit was extremely variable: February and November in 2016, June in 2017, August in 2018, May in 2019 and September in 2020. The timing of the maximum abundance of open mature fruit also varied between sites. This variability is consistent with reports that these trees are constantly shedding seed as a light ‘seed rain’ (Jensen 2008; Colloff 2014). Data collected from the Chinchilla Weir site after trees were defoliated showed closed fruit first appearing in December 2017 and open fruit first appearing in April 2018. By August 2018, the abundance of open fruit had increased and of closed fruit had decreased. This suggests that dehiscence began in April that year and continued for some months. Other authors have found the seedfall maxima to occur from December to February (Stefano 2002; Jensen et al. 2007), March (Jensen 2008), autumn (Pettit and Froend 2001), winter (Pudney 1998), spring (Dexter 1978), spring and autumn (George 2004) or 9–12 months after flowering (Stefano 2002; Casanova 2015). This variation in the timing of seedfall between locations suggests that it is not influenced by day length, insolation or temperatures suitable for germination (11–35°C) (Grose and Zimmer 1958; Stefano 2002; Jensen 2008) but is likely to be triggered by moisture-related factors such as receding floodwaters (Dexter 1978; Curtis 1989), seasonal rain (Lamont and Enright 2000) or high soil moisture content (Pettit and Froend 2001). Tree health is also a contributing factor, as healthier trees are known to release more seed over a longer period and those in poor condition retain seed longer (Jensen 2008). Perhaps a combination of environmental factors, such as sequence of wet and dry periods, is required for dehiscence. Widespread floods, a sequence of floods or above average rainfall (Jensen et al. 2007; Jensen 2008; Casanova 2015) would support tree health so that fruit is retained until maturity. Other factors such as soil anoxia or humidity may trigger dehiscence. Further research is required to substantiate these hypotheses.
Open mature fruit were observed on trees throughout the year. This differs from observations made by Jensen et al. (2008) that capsules were shed 1 month after dehiscence. Shedding was reported to occur during March and April at some sites and January at others. We were not able to detect a seasonal pattern in capsule shedding.
Data from this study support previous findings (George 2004; Birtchnell and Gibson 2006; Jensen 2008) that the reproductive cycle of E. camaldulensis takes at least 2 years from bud initiation to seed fall. This cycle may begin each year and result in overlapping cycles (Jensen 2016), and seed yield may be alternately heavy and light in successive years (Dexter 1970; Curtis 1989; Jensen et al. 2007). However, the length of the phenological cycle will depend on the length of time that seeds are held in the canopy before dehiscence. For example, if seeds are retained in capsules for 24 months (George 2004; Jensen et al. 2007; Jensen 2008), then the full cycle may require 36 months. The duration of canopy storage (serotiny) can be influenced by environmental factors such as desiccation or water deficit (Silva et al. 2016; Martín-Sanz et al. 2017), rainfall or floods (Lamont and Enright 2000; Jensen 2008) or fire (dos Santos et al. 2015). Thus, cycle length will vary with environmental conditions, and therefore location (Pettit and Froend 2001; Butcher et al. 2009). Cycle length will also be influenced by differences in the physiological responses of subspecies to environmental factors (genetics and hormonal interactions) (Lipe and Morgan 1972; Jaradat et al. 2014), so cycle length could also be expected to differ between subspecies.
Observations of immature buds ranged from September through to May and peak abundance occurred in November–December. Bud abundance was strongly correlated with temperature and immature buds were also weakly and positively correlated with rainfall and discharge. Buds initiated in November–December quickly developed into mature buds in December–January. Roberts and Marston (2011) have suggested that bud set may occur intermittently, which is consistent with our observation that bud development occurs over the range of warmer months, but the regularity of bud set in the warmer months, regardless of rainfall and flows, suggests that bud initiation follows a period of growth and responds to warming temperatures. Buds may be set opportunistically in response to unseasonal rain, higher soil moisture (Ogaya and Penuelas 2007) or flooding, and these environmental events may also result in increased bud abundance or lower rates of abscission.
There was no consistent indication in the data that drought conditions decrease the abundance or duration of bud crops. However, higher immature bud abundance was correlated with higher mean SOI values, indicating that La Niña weather patterns are associated with higher bud abundance.
Buds initiated in late November–early December developed into flowers in January, and flowering lasted for 4–5 weeks. The abundance of flowers was most strongly correlated with temperature, and all correlations with moisture parameters were weak. Flowering time was not synchronised across sites or years, although no flowers were observed outside the period from December to February. Finished flowers were mainly observed in January–February, but were also observed in May at Mooramanna, suggesting that some trees had flowered as late as April. This flowering period is consistent with previously published data (Boland et al. 2006; Roberts and Marston 2011), and reports of flowering after rainfall (Casanova 2015). Flowers were observed at most sites on an annual basis, but few flowers were observed in January 2019 at Surat and Warkon. At Surat, this summer was the driest on record since 2000 (Bureau of Meteorology 2021b) and trees were in poor condition. These conditions may have prevented flowering.
There are three subspecies of E. coolabah and two of these subspecies occur in the northern MDB (Hill and Johnson 1995). As we did not differentiate between subspecies, it is possible that summer flowering is characteristic of the dominant subspecies, Eucalyptus coolabah ssp. coolabah, whereas opportunistic or early flowering is associated with Eucalyptus coolabah ssp. excerata.
Following flowering in December–January, closed mature fruit were first observed in February and in some cases persisted in the canopy until September. Open fruit were observed in all months but the highest abundances occurred between April and August. Very few open fruit were observed between September and January. Open mature fruit were negatively correlated with temperature and rainfall. These data suggest, firstly, that seed fall occurs during late autumn and winter in the Condamine–Balonne catchment. This time coincides with moist soils, low evaporation rates and warm but reducing temperatures that may be favourable for germination (Good 2012). Although the factors that trigger dehiscence in E. coolabah are not well understood (Capon et al. 2016b), the data show that seed is released every year, regardless of climatic conditions. This life history pattern suggests that E. coolabah has adapted to release seeds every year at the time when maximum germination success could be expected (Gillen 2017).
Reproductive phenology in E. coolabah follows an annual cycle. Heavy crops may alternate with light crops. The regularity of this cycle suggests that the initiation of new bud crops may trigger dehiscence and shedding of capsules by biological processes, such as hormonal feedback or resource partitioning. The annual cycle supports a view held widely in the published literature (Doran and Boland 1984; Casanova 2015) that E. coolabah does not retain its seeds in the canopy for long periods. In contrast, E. camaldulensis may retain seed in the canopy for 24 months or more. However, observations of closed mature fruit persisting into January during the dry period between 2017 and 2019 suggests that E. coolabah has the ability to retain seed in the canopy.
Serotiny
Although seed fall was not measured directly, data from this study support hypotheses that E. coolabah and E. camaldulensis in the Condamine–Balonne River catchment exhibit serotiny, releasing seed over an extended period that may overlap with bud and flower production. We suggest that this is a response to low moisture availability.
Phenological responses to heat, light and moisture
Flowering in eucalypts is correlated with the annual heat sum (Jones et al. 2011) rather than day length (Moncur 1992). However, a period of cool temperatures (15°C during the day, 10°C at night) followed by warm temperatures (i.e. vernalisation) may be required for bud initiation (Moncur 1992; Moncur and Hasan 1994; Dai et al. 2023). Data from our study are consistent with these findings, showing that bud initiation in E. camaldulensis and E. coolabah occurs when daily average temperatures are increasing. Droughts have also been reported to trigger mass flowering events in some tree species (Sakai et al. 2006).
Plant hormones
Environmental stimuli such as heat, cold, changing day length and dry or wet conditions stimulate genetic activity that up- or downregulate hormone production to ready a tree for a shift from vegetative growth to reproduction (Ferrandiz 2002). An understanding of these phytohormonal responses and interactions will assist in identifying environmental triggers for phenological events by elucidating the mechanisms whereby physiological changes are effected. Although phytohormonal responses to heat, cold and light have been better studied, responses to water status are of greater relevance to river management and the conservation of floodplain trees. Gibson et al. (1991) and He et al. (2019) suggest roles for abscisic acid and ethylene in mediating water stress responses in E. camaldulensis and E. coolabah to promote reproduction. Conversely, flooding eucalypt forests reduces gas diffusion in the soil and triggers synthesis of auxins and ethylene in the roots (Peng et al. 2005; Medina et al. 2019) to promote the formation of adventitious roots and open stomates (Visser et al. 1995; Wilkinson and Davies 2010; De Almeida et al. 2017). If flooding can trigger ethylene production, these elevated levels of ethylene (either internal or external to the tree) may also inhibit auxin activity to trigger fruit dehiscence and seed fall (Lipe and Morgan 1972; Meakin and Roberts 1990; Sriyook et al. 1994; McAtee et al. 2013). This provides a potential mechanism for droughts enhancing rates of serotiny and enhanced seed fall associated with floods. However, the activity of ethylene can vary with its concentration, genetic factors, interactions with other hormones, developmental stage, tissue type and environmental cues (Iqbal et al. 2017), so experimental evidence is needed to explore this mechanism in E. camaldulensis and E. coolabah.
Management implications, knowledge gaps and conclusions
Neither E. camaldulensis nor E. coolabah form a soil seed bank (Pettit 2002; Jensen et al. 2007; Capon et al. 2017). Instead, seeds are delivered as a gradual ‘seed rain’ (Jensen 2008) that is heaviest in autumn (this study). Therefore, environmental watering targeting germination would be most effective if delivered in autumn. However, the triggers for fruit dehiscence are not clear in E. camaldulensis, and it may be that flooding itself acts as a trigger. Moreover, in the QMDB, abundant germination following a flood is common but seedling survival rates decrease with increasing time since the last inundation and few seedlings survive to adulthood (Capon et al. 2012). With these facts in mind, recruitment of E. camaldulensis in northern basin ribbon stands may be best supported by providing or augmenting in-channel flows (Department of Science, Information Technology and Innovation, Department of Natural Resources and Mines 2017) in spring to promote bud development and later seed production. This is consistent with current Murray–Darling Basin Authority (2010) recommendations for maintenance of riparian E. camaldulensis with a within channel flow of 138.89 m3 s−1 at St George, lasting for 7 days. To support seedling establishment through the dry winter, a flow delivered in late autumn following unregulated flood events (Doody et al. 2014) is recommended to maintain soil moisture.
Seed production by E. coolibah occurs annually in the QMDB and is driven by rainfall and groundwater availability (Department of Science, Information Technology and Innovation and Department of Natural Resources and Mines 2017). Therefore, floods benefit E. coolibah by recharging the surface aquifer (Department of Science, Information Technology and Innovation and Department of Natural Resources and Mines 2017) to support seed production, enhance bud abundance and trigger germination. Post-germination, a greenhouse experiment shows that it takes ~17 weeks for seedlings to establish a root system to 1.0-m depth (Balcombe et al. 2021), so seedling establishment relies on recharge of the surface aquifer and soil moisture in the absence of rainfall. The optimum timing of floods for germination would coincide with temperatures of 15°C at night and 30°C during the day (Vincent 2012). Floods should also be shallow in depth (Foster 2015), last for ~9 days (Marshall et al. 2011) and result in successful recruitment once every 10–20 years (Good et al. 2012, 2017; Department of Science, Information Technology and Innovation and Department of Natural Resources and Mines 2017). Floods inundating the majority of coolibah woodlands on the Lower Balonne Floodplain (LBF) occur with a discharge of 695–750 m3 s−1 at St George (Sims and Thoms 2002; Whittington et al. 2002; Sims 2004), but Queensland’s current infrastructure and management rules are not able to deliver flows exceeding 8.45 m3 s−1.
In Queensland, water is managed using a rules-based approach and by placing conditions on allocations. In the LBF, water is managed using the water sharing and flow event management rules set out in the Condamine and Balonne Water Management Protocol 2019. The Condamine and Balonne water plan aims to achieve environmental outcomes by limiting how much water may be extracted and under what circumstances. This ensures that critical environmental flows are protected instream. This is known as ‘planned environmental water’ (PEW). The CEWH also owns a number of unsupplemented water entitlements, held environmental water (HEW), and these are usually left instream. A small amount of supplemented HEW owned by the CEWH is held in Beardmore Dam, which may be released as environmental flows. The Queensland government does not own any HEW. Queensland’s long-term water plan (LTWP) for the Condamine–Balonne catchment provides information to the CEWH regarding environmental watering requirements (EWRs). It does not currently define EWRs for woody vegetation, but findings from this research will inform the revision of the LTWP. These findings are also of relevance to northern NSW where other management levers may be available.
Opportunities for policy-based approaches to support floodplain tree recruitment are limited in the QMDB due to it being highly unregulated, but a number of policy measures have been built into the plans to protect the environment. For example, as ‘no growth’ plans, no decision can be made that would increase the take of water from the plan area. However, this also minimises opportunities to place new conditions on water licences. Plan reviews provide an opportunity to refine environmental flow objectives (EFOs), which are referred to for water trade and water allocation decisions. An existing EFO in the Water Plan (Condamine and Balonne) 2019 aims to preserve the natural frequency of floodplain inundation at locally relevant flow thresholds, and the results of this research will inform the revision of these thresholds at next plan review. In addition, an EFO could be developed that would protect recharge to surface aquifers during floodplain inundation.
Following the Northern Basin Review (Murray–Darling Basin Authority 2016), the MDBA introduced the Northern Basin Toolkit program. This program aimed to achieve ecological outcomes using a range of approaches including environmental works and removal of physical constraints. Floodplain tree recruitment would benefit from a suite of complementary measures aimed at managing non-flow threats. An example of a possible approach is the recent Fencing Northern Basin Riverbanks Project (Southern Queensland Landscapes 2022). Other options include land buy-back or policy to protect germinants from grazing (Horner et al. 2009), land clearing (Good et al. 2012) or drainage and diversion (Jurskis and Turner 2002). Such projects have been implemented through the cooperative efforts of government, landholders and non-government organisations such as Landcare Australia (see https://landcareaustralia.org.au/) and Southern Queensland Landscapes (see https://www.sqlandscapes.org.au/).
This study has highlighted several areas that require additional research. Regarding environmental flows that support seed yield in E. camaldulensis and E. coolabah, future projects should track changes in a group of randomly selected mature individuals over time, rather than randomly selecting trees on each survey date, and follow phenological changes on marked branches with respect to hydrological events for a subset of individuals. This work would be complemented by seed fall measurements, in situ climate and soil moisture logging, and data concerning tree height, diameter, condition and potentially age (Gardner et al. 2023). These changes would: (a) improve correlations between phenology and climatic drivers; (b) confirm seed crop yield variation and periodicity over successive years; (c) inform the relative importance of floods, flows, rainfall and soil moisture as triggers for bud initiation and seed fall; and (d) improve understanding of the impacts of long-term weather patterns (e.g. ENSO) on tree reproduction and recruitment. Further exploration of the phenology of these species should include: (a) differentiation of event timing by subspecies to better identify differences between the northern and southern MDB; and (b) investigation of the genetic and hormonal mechanisms linking water availability with phenology (e.g. triggers for dehiscence). Future recruitment studies should focus on the sequence of watering events (natural or managed) required for germinated seedlings to reach reproductive maturity, including minimum and maximum inundation duration.
This study has contributed to understanding the importance of specific water sources, and their timing, to the phenology of E. camaldulensis and E. coolabah in the northern MDB, an important first step in better understanding their water requirements for recruitment. Some knowledge gaps regarding E. coolabah have been filled and we have recorded aseasonal bud initiation in response to rainfall and serotiny in response to drought. The data collected represent one of few long-term phenological datasets for the MDB and will support future investigations of the critical life history requirements for E. camaldulensis and E. coolabah. Consideration of these findings within Queensland’s LTWP will inform the CEWH regarding environmental watering of floodplain vegetation, and the Queensland Government in assessment of the Water Plan (Condamine and Balonne) Environmental Outcomes in future Water Plan reviews.
Data availability
The data that support the findings of this study are available from the corresponding author upon reasonable request.
Declaration of funding
All authors are employees of the Queensland Government, and all funds required to conduct this research were provided by the Queensland Government Department of Regional Development, Manufacturing and Water.
Author contributions
A. Prior led the conceptualisation, conducted the early field surveys and managed policy and funding. J. Kerr and D. Harding conducted field surveys, data analysis and collaborated on draft documents. J.Fawcett conducted field surveys and provided technical feedback on early drafts. All authors contributed equally to review and editing of the written material.
Acknowledgements
The authors respectfully acknowledge the Traditional Owners of the land on which this publication was based, their Elders past, present and future, and their Nations. We thank Tess Mullins, Peter Brownhalls, Tina Zohl, Claire Doyle, Jason Chavasse and others for their assistance in the field, and Jon Marshall, Jaye Lobegeiger and Bill Senior from the Department of Environment and Science for professional advice and reviews of earlier drafts.
References
Atlas of Living Australia (2024) Eucalyptus coolabah Blakely & Jacobs. Available at https://bie.ala.org.au/species/https://id.biodiversity.org.au/taxon/apni/51439792 [Verified 19 July 2024]
Balcombe SR, Biggs A, Prior A, Capon SJ (2021) Seedling root growth experiments for two Australian dryland riparian eucalypts provide new insights for environmental watering. River Research and Applications 37, 1463-1470.
| Crossref | Google Scholar |
Barbour RC, Potts BM, Vaillancourt RE, Tibbits WN (2006) Gene flow between introduced and native Eucalyptus species: flowering asynchrony as a barrier to F1 hybridisation between exotic E. nitens and native Tasmanian Symphyomyrtus species. Forest Ecology and Management 226, 9-21.
| Crossref | Google Scholar |
Birtchnell MJ, Gibson M (2006) Long-term flowering patterns of melliferous Eucalyptus (Myrtaceae) species. Australian Journal of Botany 54, 745.
| Crossref | Google Scholar |
Bolotin M (1975) Photoperiodic induction of precocious flowering in a woody species Eucalyptus occidentalis Endl. Botanical Gazette 136, 358-365.
| Crossref | Google Scholar |
Bomford M, Sinclair R (2002) Australian research on bird pests: impact, management and future directions. Emu–Austral Ornithology 102, 29-45.
| Crossref | Google Scholar |
Bren LJ (1988) Effects of river regulation on flooding of a riparian red gum forest on the River Murray, Australia. Regulated Rivers: Research & Management 2, 65-77.
| Crossref | Google Scholar |
Bureau of Meteorology (2017) Balonne and Maranoa. Rivers flood warning system. Flood warning system for the Balonne and Maranoa Rivers. (The Bureau) Available at http://www.bom.gov.au/qld/flood/brochures/condamine_balonne/condamine_balonne.shtml#PreviousFlooding [Verified 19 June 2024]
Bureau of Meteorology (2021a) Australian Landscape Water Balance simulated [ALWB] data – soil moisture, rainfall, evapotranspiration, deep drainage, and runoff estimates [1911 onwards] {DRAFT stopgap metadata}. (The Bureau) Available at http://www.bom.gov.au/metadata/catalogue/19115/ANZCW0503900503?template=full [Dataset, verified 15 December 2021]
Bureau of Meteorology (2021b) Climate data online. (The Bureau) Available at http://www.bom.gov.au/climate/data/ [Verified15 December 2021]
Bureau of Meteorology (2021c) Flood warning system for the Condamine–Balonne river below Cotswold. (The Bureau) Available at http://www.bom.gov.au/qld/flood/brochures/condamine_balonne/condamine_balonne_downstream_of_cotswold.shtml [Verified 3 June 2024]
Bureau of Meteorology (2022) Queensland flood warning river height stations: flood classifications. (The Bureau) Available at http://www.bom.gov.au/qld/flood/networks/section4.shtml [Verified 28 November 2023]
Bureau of Meteorology (2024) Southern Oscillation Index (SOI) since 1876. (The Bureau) Available at http://www.bom.gov.au/climate/enso/soi/ [Verified 30 May 2024]
Butcher PA, McDonald MW, Bell JC (2009) Congruence between environmental parameters, morphology and genetic structure in Australia’s most widely distributed eucalypt, Eucalyptus camaldulensis. Tree Genetics & Genomes 5, 189-210.
| Crossref | Google Scholar |
Capon S, Rolls R, James C, Mackay S (2012) Regeneration of floodplain vegetation in response to large-scale flooding in the Condamine–Balonne and Border Rivers. Final report, Cotton CRC project number 5.01.42, Coton Catchment Communities CRC and Australian Rivers Institute, Griffith University, Brisbane, Qld, Australia.
Capon SJ, Balcombe SR, McBroom J (2017) Environmental watering for vegetation diversity outcomes must account for local canopy conditions. Ecohydrology 10, e1859.
| Crossref | Google Scholar |
Christensen PE, Kimber PC (1975) Effect of prescribed burning on the flora and fauna of south-west Australian forests. Proceedings of the Ecological Society of Australia 9, 85-106.
| Google Scholar |
Clarke PJ, Knox KEJ, Butler D (2013) Fire, soil fertility and delayed seed release: a community analysis of the degree of serotiny. Evolutionary Ecology 27, 429-443.
| Crossref | Google Scholar |
Cleverly JR, Smith SD, Sala A, Devitt DA (1997) Invasive capacity of Tamarix ramosissima in a Mojave Desert floodplain: the role of drought. Oecologia 111, 12-18.
| Crossref | Google Scholar | PubMed |
Commonwealth Environmental Water Holder (2021) Northern unregulated rivers (includes Northern Intersecting Streams and Barwon–Darling). (Australian Government, Department of Climate Change, Energy, the Environment and Water) Available at https://www.dcceew.gov.au/water/cewo/catchment/northern-unregulated-rivers [Verified 15 December 2021]
Cunningham SC, Read J, Baker PJ, Mac Nally R (2007) Quantitative assessment of stand condition and its relationship to physiological stress in stands of Eucalyptus camaldulensis (Myrtaceae). Australian Journal of Botany 55, 692.
| Crossref | Google Scholar |
Dai X, Lin Y, Zhou T, Li Y, Liao X, Cao J, Ding J (2023) Natural annual transcriptome dynamics of Eucalyptus reveal seasonal adaptation of tropical/sub-tropical trees. Tree Physiology 43, 658-674.
| Crossref | Google Scholar | PubMed |
De Almeida MR, Aumond M, Jr, Da Costa CT, Schwambach J, Ruedell CM, Correa LR, Fett-Neto AG (2017) Environmental control of adventitious rooting in Eucalyptus and Populus cuttings. Trees 31, 1377-1390.
| Crossref | Google Scholar |
Department of Regional Development, Manufacturing and Water (2024b) Water monitoring information portal. (Queensland Government) Available at https://water-monitoring.information.qld.gov.au/ [Verified 3 June 2024]
Dexter BD (1978) Silviculture of the river red gum forests of the central Murray flood plain. Proceedings of the Royal Society of Victoria 90, 175-191.
| Google Scholar |
Doody TM, Benger SN, Pritchard JL, Overton IC (2014) Ecological response of Eucalyptus camaldulensis (river red gum) to extended drought and flooding along the River Murray, South Australia (1997–2011) and implications for environmental flow management. Marine and Freshwater Research 65, 1082-1093.
| Crossref | Google Scholar |
Doran JC, Boland DJ (1984) Effects of temperature on germination of Eucalyptus microtheca. Australian Forest Research 14, 49-55.
| Google Scholar |
dos Santos P, Matias H, Deus E, Águas A, Silva JS (2015) Fire effects on capsules and encapsulated seeds from Eucalyptus globulus in Portugal. Plant Ecology 216, 1611-1621.
| Crossref | Google Scholar |
Eriksson O, Ehrlén J (2008) Seedling recruitment and population ecology. In ‘Seedling ecology and evolution’. (Eds MA Leck, VT Parker, RL Simpson) pp. 239–254. (Cambridge University Press) doi:10.1017/CBO9780511815133.013
Feltrim D, Gupta B, Gundimeda S, Kiyota E, Júnior APD, Cintra LC, Mazzafera P (2022) Exposure of Eucalyptus to varied temperature and CO2 has a profound effect on the physiology and expression of genes related to cell wall formation and remodeling. Tree Genetics & Genomes 18, 3.
| Crossref | Google Scholar |
Ferrandiz C (2002) Regulation of fruit dehiscence in Arabidopsis. Journal of Experimental Botany 53, 2031-2038.
| Crossref | Google Scholar | PubMed |
Fryirs K, Carthey A (2022) How long do seeds float? The potential role of hydrochory in passive revegetation management. River Research and Applications 38, 1139-1153.
| Crossref | Google Scholar |
Gardner ST, Bertucci EM, Sutton R, Horcher A, Aubrey D, Parrott BB (2023) Development of DNA methylation-based epigenetic age predictors in loblolly pine (Pinus taeda). Molecular Ecology Resources 23, 131-144.
| Crossref | Google Scholar | PubMed |
Gibson A, Hubick KT, Bachelard EP (1991) Effects of abscisic acid on morphological and physiological responses to water stress in Eucalyptus camaldulensis seedlings. Functional Plant Biology 18, 153-163.
| Crossref | Google Scholar |
Good MK, Price JN, Clarke PJ, Reid N (2012) Dense regeneration of floodplain Eucalyptus coolabah: invasive scrub or passive restoration of an endangered woodland community? The Rangeland Journal 34, 219.
| Crossref | Google Scholar |
Gower JC (1966) Some distance properties of latent root and vector methods used in multivariate analysis. Biometrika 53, 325-338.
| Crossref | Google Scholar |
Grolemund G, Wickham H (2011) Dates and times made easy with lubridate. Journal of Statistical Software 40, 1-25.
| Crossref | Google Scholar |
Grose RJ, Zimmer WJ (1958) Some laboratory germination responses of the seeds of river red gum, Eucalyptus camaldulensis Dehn. Syn. Eucalyptus rostrata Schlecht. Australian Journal of Botany 6, 129-153.
| Crossref | Google Scholar |
Gu Z, Gu L, Eils R, Schlesner M, Brors B (2014) Circlize implements and enhances circular visualization in R. Bioinformatics 30, 2811-2812.
| Crossref | Google Scholar | PubMed |
Hamilton-Brown S, Boon PI, Raulings E, Morris K, Robinson R (2009) Aerial seed storage in Melaleuca ericifolia Sm. (swamp paperbark): environmental triggers for seed release. Hydrobiologia 620, 121-133.
| Crossref | Google Scholar |
He J, Jin Y, Palta JA, Liu H-Y, Chen Z, Li F-M (2019) Exogenous ABA induces osmotic adjustment, improves leaf water relations and water use efficiency, but not yield in soybean under water stress. Agronomy 9, 395.
| Crossref | Google Scholar |
Hill K, Johnson L (1995) Systematic studies in the eucalypts. 7. A revision of the bloodwoods, genus Corymbia (Myrtaceae). Telopea 6, 185-504.
| Crossref | Google Scholar |
Holloway D, Biggs A, Marshall JC, McGregor GB (2013) Watering requirements of floodplain vegetation asset species of the Lower Balonne River Floodplain: review of scientific understanding and identification of knowledge gaps for asset species of the northern Murray−Darling Basin. Department of Science, Information Technology, Innovation and the Arts, Brisbane, Qld, Australia.
Horner GJ, Baker PJ, Mac Nally R, Cunningham SC, Thomson JR, Hamilton F (2009) Mortality of developing floodplain forests subjected to a drying climate and water extraction. Global Change Biology 15, 2176-2186.
| Crossref | Google Scholar |
Iqbal N, Khan NA, Ferrante A, Trivellini A, Francini A, Khan MIR (2017) Ethylene role in plant growth, development and senescence: interaction with other phytohormones. Frontiers in Plant Science 8, 475.
| Crossref | Google Scholar | PubMed |
Jaradat MR, Ruegger M, Bowling A, Butler H, Cutler AJ (2014) A comprehensive transcriptome analysis of silique development and dehiscence in Arabidopsis and Brassica integrating genotypic, interspecies and developmental comparisons. GM Crops & Food 5, 302-320.
| Crossref | Google Scholar | PubMed |
Jensen AE, Walker KF (2017) Sustaining recovery in red gum, black box and lignum in the Murray River Valley: clues from natural phenological cycles to guide environmental watering. Transactions of the Royal Society of South Australia 141, 209-229.
| Crossref | Google Scholar |
Jensen AE, Walker KF, Paton DC (2007) Using phenology of eucalypts to determine environmental watering regimes for River Murray floodplain, South Australia. In ‘Proceedings of the 5th Australian Stream Management Conference. Australian rivers: making a difference’, 21–25 May 2007, Albury, NSW, Australia. (Eds AL Wilson, RL Dehaan, RJ Watts, KJ Page, KH Bowmer, A Curtis) pp. 175–180. (Charles Sturt University: Albury, NSW, Australia)
Jensen AE, Walker KF, Paton DC (2008) The role of seedbanks in restoration of floodplain woodlands. River Research and Applications 24, 632-649.
| Crossref | Google Scholar |
Jolly ID, Walker GR, Thorburn PJ (1993) Salt accumulation in semi-arid floodplain soils with implications for forest health. Journal of Hydrology 150, 589-614.
| Crossref | Google Scholar |
Jones RC, Vaillancourt RE, Gore PL, Potts BM (2011) Genetic control of flowering time in Eucalyptus globulus ssp. globulus. Tree Genetics & Genomes 7, 1209-1218.
| Crossref | Google Scholar |
Jurskis V, Turner J (2002) Eucalypt dieback in eastern Australia: a simple model. Australian Forestry 65, 87-98.
| Crossref | Google Scholar |
Kath J, Reardon-Smith K, Le Brocque A, Dafny E, Dyer F, Fritz L, Batterham M (2013) Groundwater depth thresholds for tree condition. In ‘Proceedings of the 52nd Australian Society for Limnology Congress (ASL 2013): From Theory to Practice in Water Science’, 2–5 December 2013, Canberra, ACT, Australia. (University of Southern Queensland) Abstract available at https://research.usq.edu.au/item/q2v64/groundwater-depth-thresholds-for-tree-condition
Khan MAW (1970) Phenology of Acacia nilotica and Eucalyptus microtheca at Wad Medani (Sudan). Indian Forester 96, 226-248.
| Google Scholar |
Kuiper JJ, Janse JH, Teurlincx S, Verhoeven JTA, Alkemade R (2014) The impact of river regulation on the biodiversity intactness of floodplain wetlands. Wetlands Ecology and Management 22, 647-658.
| Crossref | Google Scholar |
Lamont BB, Enright NJ (2000) Adaptive advantages of aerial seed banks. Plant Species Biology 15, 157-166.
| Crossref | Google Scholar |
Lipe JA, Morgan PW (1972) Ethylene: role in fruit abscission and dehiscence processes. Plant Physiology 50, 759-764.
| Crossref | Google Scholar | PubMed |
McAtee P, Karim S, Schaffer R, David K (2013) A dynamic interplay between phytohormones is required for fruit development, maturation, and ripening. Frontiers in Plant Science 4, 79.
| Crossref | Google Scholar | PubMed |
McDonald MW, Brooker MIH, Butcher PA (2009) A taxonomic revision of Eucalyptus camaldulensis (Myrtaceae). Australian Systematic Botany 22, 257-285.
| Crossref | Google Scholar |
Martín-Sanz RC, Callejas-Díaz M, Tonnabel J, Climent JM (2017) Maintenance costs of serotiny in a variably serotinous pine: the role of water supply. PLoS ONE 12, e0181648.
| Crossref | Google Scholar | PubMed |
Meakin PJ, Roberts JA (1990) Dehiscence of fruit in oilseed rape (Brassica napus L.). Journal of Experimental Botany 41, 1003-1011.
| Crossref | Google Scholar |
Medina EF, Mayrink GCV, Dias CR, Vital CE, Ribeiro DM, Silva IR, Merchant A (2019) Physiological and biochemical responses of Eucalyptus seedlings to hypoxia. Annals of Forest Science 76, 4.
| Crossref | Google Scholar |
Moncur MW (1992) Effect of low temperature on floral induction of Eucalyptus lansdowneana F. Muell. & J. Brown subsp. lansdowneana. Australian Journal of Botany 40, 157-167.
| Crossref | Google Scholar |
Moncur MW, Hasan O (1994) Floral induction in Eucalyptus nitens. Tree Physiology 14, 1303-1312.
| Crossref | Google Scholar | PubMed |
Murray–Darling Basin Authority (2021) Catchments; Condamine–Balonne. (MDBA, Canberra, ACT, Australia) Available at https://www.mdba.gov.au/water-management/catchments/condamine-balonne [Verified 15 December 2021]
Ngugi MR, Neldner VJ, Dowling RM, Li J (2022) Recruitment and demographic structure of floodplain tree species in the Queensland Murray–Darling basin, Australia. Ecological Management & Restoration 23, 64-73.
| Crossref | Google Scholar |
Ogaya R, Penuelas J (2007) Species-specific drought effects on flower and fruit production in a Mediterranean holm oak forest. Forestry 80, 351-357.
| Crossref | Google Scholar |
Parolin P, Wittmann F (2010) Struggle in the flood: tree responses to flooding stress in four tropical floodplain systems. AoB PLANTS 2010, plq003.
| Crossref | Google Scholar |
Peng H-P, Lin T-Y, Wang N-N, Shih M-C (2005) Differential expression of genes encoding 1-aminocyclopropane-1-carboxylate synthase in Arabidopsis during hypoxia. Plant Molecular Biology 58, 15-25.
| Crossref | Google Scholar | PubMed |
Penton DJ, Teng J, Ticehurst C, Marvanek S, Freebairn A, Mateo C, Vaze J, Yang A, Khanam F, Sengupta A, Pollino C (2023) The floodplain inundation history of the Murray–Darling Basin through two-monthly maximum water depth maps. Scientific Data 10, 652.
| Crossref | Google Scholar | PubMed |
Petsch DK, Cionek VM, Thomaz SM, Dos Santos NCL (2023) Ecosystem services provided by river-floodplain ecosystems. Hydrobiologia 850, 2563-2584.
| Crossref | Google Scholar |
Pettit NE (2002) Riparian vegetation of a permanent waterhole on Cooper Creek, southwest Queensland. Proceedings of the Royal Society of Queensland 110, 15-25.
| Google Scholar |
Pettit NE, Froend RH (2001) Availability of seed for recruitment of riparian vegetation: a comparison of a tropical and a temperate river ecosystem in Australia. Australian Journal of Botany 49, 515-528.
| Crossref | Google Scholar |
Polley E, Lill A (2021) Foraging of sulphur-crested cockatoos: examining the roles of preadaptation, behavioural flexibility and interspecific competition in urban dwelling. Corella 45, 7-16.
| Google Scholar |
Roberts J (1993) Regeneration and growth of coolibah, Eucalyptus coolabah subsp. arida, a riparian tree, in the Cooper Creek region of South Australia. Australian Journal of Ecology 18, 345-350.
| Crossref | Google Scholar |
Sakai S, Harrison RD, Momose K, Kuraji K, Nagamasu H, Yasunari T, Chong L, Nakashizuka T (2006) Irregular droughts trigger mass flowering in aseasonal tropical forests in Asia. American Journal of Botany 93, 1134-1139.
| Crossref | Google Scholar | PubMed |
Schaber J, Badeck F-W (2003) Physiology-based phenology models for forest tree species in Germany. International Journal of Biometeorology 47, 193-201.
| Crossref | Google Scholar | PubMed |
Shilpakar RL, Thoms MC, Reid MA (2021) The resilience of a floodplain vegetation landscape. Landscape Ecology 36, 139-157.
| Crossref | Google Scholar |
Silva JS, dos Santos P, Sério A, Gomes F (2016) Effects of heat on dehiscence and germination in Eucalyptus globulus Labill. International Journal of Wildland Fire 25, 478-483.
| Crossref | Google Scholar |
Sims NC, Thoms MC (2002) What happens when floodplains wet themselves: vegetation response to inundation on the lower Balonne floodplain. In ‘The structure, function and management implications of fluvial sedimentary systems’. (Eds FJ Dyer, MC Thoms, JM Olley) p. 195. (IAHS: Alice Springs, NT, Australia)
Souter NJ (2019) The red gum condition index: a multi-variable tree condition index for visually assessed river red gum (Eucalyptus camaldulensis) trees. Transactions of the Royal Society of South Australia 143, 67-85.
| Crossref | Google Scholar |
Southern Queensland Landscapes (2022) How to fence your riparian zone and what to look out for. (SQL: Toowoomba, Qld, Australia) Available at https://irp.cdn-website.com/1018ad9f/files/uploaded/J7234_SQL_NBFP%20-%20Technical%20Sheet_03.pdf [Verified 18 June 2024]
Sriyook S, Siriatiwat S, Siriphanich J (1994) Durian fruit dehiscence – water status and ethylene. HortScience 29, 1195-1198.
| Crossref | Google Scholar |
St John B (1994) Ecology and management of the little corella (Cacatua sanguinea) in the southern Flinders Ranges, South Australia. MSc thesis, University of Adelaide, Adelaide, SA, Australia. Available at https://hdl.handle.net/2440/111594
Stefano JD (2002) River red gum (Eucalyptus camaldulensis): a review of ecosystem processes, seedling regeneration and silvicultural practice. Australian Forestry 65, 14-22.
| Crossref | Google Scholar |
Thoms MC, Sheldon F (2002) An ecosystem approach for determining environmental water allocations in Australian dryland river systems: the role of geomorphology. Geomorphology 47, 153-168.
| Crossref | Google Scholar |
Trudgill DL, Honek A, Li D, Straalen NM (2005) Thermal time – concepts and utility. Annals of Applied Biology 146, 1-14.
| Crossref | Google Scholar |
Vincent B (2012) Coolibah recruitment after flooding and implications for environmental water management. (Cotton Catchment Communities CRC) Available at https://www.insidecotton.com/coolibah-recruitment-after-flooding-and-implications-environmental-water-management [Verified 26 July 2024]
Visser EJW, Heijink CJ, Van Hout KJGM, Voesenek LACJ, Barendse GWM, Blom CWPM (1995) Regulatory role of auxin in adventitious root formation in two species of Rumex, differing in their sensitivity to waterlogging. Physiologia Plantarum 93, 116-122.
| Crossref | Google Scholar |
Voller P, Eddie C (1995) The influence of possum and cockatoo damage on tree decline in drought affected riparian forests of the Upper Condamine River, South Queensland. In ‘Proceedings of the 10th Australian Vertebrate Pest Control Conference’, 29 May–2 June 1995, Hobart, Tas., Australia. pp. 224–227. (Tasmania Department of Primary Industry and Fisheries)
Wallace TA, Gehrig S, Doody TM (2020) A standardised approach to calculating floodplain tree condition to support environmental watering decisions. Wetlands Ecology and Management 28, 315-340.
| Crossref | Google Scholar |
Wen L, Ling J, Saintilan N, Rogers K (2009) An investigation of the hydrological requirements of river red gum (Eucalyptus camaldulensis) forest, using classification and regression tree modelling. Ecohydrology 2, 143-155.
| Crossref | Google Scholar |
Wilkinson S, Davies WJ (2010) Drought, ozone, ABA and ethylene: new insights from cell to plant to community. Plant, Cell & Environment 33, 510-525.
| Crossref | Google Scholar | PubMed |