Impacts of the new UM convection scheme, CoMorph-A, over the Indo-Pacific and Australian regions
Hongyan Zhu A * , Debra Hudson A , Chen Li
  A , Li Shi A , Bethan White A , Griffith Young A , Alison Stirling B , Michael Whitall B , Adrian Lock B , Sally Lavender C and Rachel Stratton B
A
B
C
Abstract
A new convection scheme, ‘CoMorph-A’, has been introduced into the latest UK Met Office coupled (GC4) and atmosphere-only (GA8) models. In this study, the impact of CoMorph-A is assessed in atmosphere-only Atmospheric Model Intercomparison Project simulations, as well as in sets of initialised 28-day forecasts with both the coupled and uncoupled models. Initial results show improvements over the Indo-Pacific and northern Australian regions, as well as improvements in the rainfall bias, Madden–Julian Oscillation simulation and prediction, tropical cyclone forecasts and the diurnal cycle of rainfall over the Maritime Continent. The improvements are mostly consistent across the initialised forecasts and the climate simulations, indicating the effectiveness of the new scheme across applications. The use of this new convection scheme is promising for future model configurations, and for improving the simulation and prediction of Australian weather and climate. The UK Met Office is continuing to develop CoMorph and will soon release version B.
Keywords: Australia weather and climate, CoMorph, convection scheme, diurnal cycle, Madden–Julian Oscillation, MJO, model biases, tropical cyclone, UK Met Office global model, UM.
1.Introduction
The UK Met Office’s global coupled and atmosphere models are used to provide forecasts and projections over a range of timescales for the Australian public and industry. At The Bureau of Meteorology, Australia, the global atmosphere-only model is used for numerical weather prediction (NWP) (ACCESS-G/GE; Bureau of Meteorology 2019) and the global coupled model is used for multi-week and seasonal prediction (ACCESS-S; Hudson et al. 2017; Wedd et al. 2022). For longer timescales, CSIRO uses the atmosphere model in Australia’s coupled model (ACCESS-CM2; Bi et al. 2020) to produce climate change projections.
There are major long-standing model biases in the tropical Indian and Pacific Ocean regions in the Met Office global coupled and atmosphere models that act to limit the prediction skill and model performance over Australia. For example, the dry bias over the Maritime Continent (MC) that was seen in climate simulations nearly 20 years ago (Neale and Slingo 2003), is still present in the recent configurations (e.g. Global Atmosphere version 8, GA8, used in this study; Willett et al. 2020). Early experiments showed that the dry bias persisted even in higher-resolution simulations of the same model, indicating deficiencies in the representation of the physical system (Neale and Slingo 2003). It has also been argued that deficient rainfall over the MC could be associated with other systematic errors, such as the excess precipitation over the tropical western Indian Ocean, the easterly wind bias over the eastern Indian Ocean and the hyperactive Indian Ocean Dipole (Hudson et al. 2017; Wedd et al. 2022). Biases in rainfall over the MC region have also been reported to adversely affect the eastward propagation of the Madden–Julian Oscillation (MJO) across the region (e.g. Neale and Slingo 2003; Klingaman and Woolnough 2014; Zhu et al. 2017).
Previous modifications made to the default Unified Model (UM) convection scheme (Willett and Whitall 2017; Zhu et al. 2017) improved the representation of convection, and partially reduced the dry bias over the MC region and wet bias over the western Indian Ocean, but further improvements are required. The default convection scheme lacks much of the structural flexibility needed to address systematic biases generated by the convection scheme and, given the growth in capability of regional modelling at kilometre scales, there is a need to have a scheme that can be scale-adaptive (Park et al. 2022). To address this, a new mass flux convection scheme, CoMorph, has recently been developed at the Met Office (Whitall and Matsubayashi 2022; Daleu et al. 2023; Lavender et al. 2024; Lock et al. 2024). This scheme has removed ad hoc structure assumptions that have hampered progress in the past and allows representation of new physical processes that were previously neglected. Results from the Met Office indicate that the CoMorph-A configuration can have a positive effect on NWP forecasts and climate simulations (Stirling et al. 2021).
In this work, we evaluated the performance of CoMorph-A in the latest global model (GA8 and GC4) compared to using the standard convection configuration, with a focus on the Indo-Pacific and Australian regions. The experiments are described in Section 2, and the default and CoMorph convection schemes are introduced in Section 3. The results are discussed in Section 4, followed by a conclusion in Section 5.
Note that the development of CoMorph is ongoing and Version B is due to be released in the near future. Unless otherwise specified, when CoMorph is mentioned in the paper, it refers to CoMorph-A.
2.Model experiments
In this study we use the latest released scientific configurations of the atmosphere and coupled models from the Met Office, which were frozen in March 2020. The global atmosphere model is version 8, GA8.0, which is tightly coupled to the global land surface model (GL9.0) (Willett et al. 2020). The code base for GA8 and GL9 is UM version 12.1. The coupled model is Global Coupled model version 4 (GC4), which comprises GA8 and GL9 coupled to the Global Ocean model (GO6.0; Storkey et al. 2018) and the Global Sea Ice model (GSI8.1; Ridley et al. 2018). The ocean model has a 0.25° resolution (ORCA025) and is based on version 3.6 of the NEMO (Nucleus for European Modelling of the Ocean; Madec et al. 1998) ocean model. It is tightly coupled to the sea ice model, which is based on version 5.1.2 of the Los Alamos CICE model (Hunke et al. 2015).
To test the impact of the CoMorph convection scheme on initialised forecasts, 28-day forecasts are run, using an N320 (~40 km) atmosphere model resolution, with the following configurations:
GA8 – global atmosphere model with the default convection scheme.
GA8–CoM – global atmosphere model with CoMorph convection scheme (experiments using CoMorph are referred to in this paper as ‘–CoM’).
GC4 – global coupled model with the default GA8 convection scheme.
GC4–CoM – global coupled model with CoMorph convection scheme.
For each of these four model configurations, two sets of forecast experiments are carried out. The first set has 24 start-dates covering the period from June 2013 to April 2014 (note that the start dates are not evenly spread through the period). This set is only used for the diurnal cycle evaluation in Section 4.4 with respect to Tropical Rainfall Measuring Mission (TRMM) rainfall (Hersbach et al. 2020). The second set has 58 start-dates from December 2018 to April 2021 with two forecast start-dates per month (on the 1st and 16th). Both sets of experiments have 28 days lead time.
We also analyse the impact of CoMorph using Atmospheric Model Intercomparison Project (AMIP; Gates et al. 1999) simulations, where the atmospheric model is run with prescribed observed monthly and interannually varying sea surface temperature and sea ice extent. The AMIP simulations are done with horizontal model resolution at N216 (~60 km) and 85 vertical levels. Two 20-year (1989–2008) AMIP simulations are run:
3.Convection schemes
3.1. Default GA8 convection scheme
In GA8, the default convection scheme is the mass flux scheme of Gregory and Rowntree (1990). The mass flux scheme defines the following types of convection:
Shallow convection starting from the boundary layer and stopping below the freezing level or below an inversion with descent or weak ascent above. The shallow mass flux scheme was developed to model shallow convection like that observed over the ocean by the BOMEX3 campaign (Holland 1970).
Deep convection starting from the boundary layer and not diagnosed as shallow convection.
Mid-level convection starting above the boundary layer or above shallow or deep convection. In the UM this can represent convection in mid-latitude storms, nocturnal convection over land and also small-scale instabilities over a few model levels (i.e. numerical noise).
In GA8 convection (Willett et al. 2020), the following improvements have been implemented:
The ‘prognostic based convective entrainment rate (ProgEnt)’ (Willett and Whitall 2017) adds memory of subgrid activity into the convection parameterisation.
Convective snow and convective rain melt and freeze respectively over a physical depth rather than a single model level (Zhu et al. 2017)
The computational stability of the Gregory–Kershaw convective momentum transport.
The convection–dynamics coupling is improved through the time-smoothing of convective temperature and humidity increments.
An improvement to the convective ascent termination condition that prevents convection reaching physically unrealistic depths.
3.2. CoMorph convection scheme
Like the default scheme, CoMorph is also a mass-flux convection scheme. Comprehensive descriptions of the scheme are provided in Daleu et al. (2023) and Lavender et al. (2024), with full details available in Whitall and Matsubayashi (2022) upon request.
CoMorph-A has been written with the following design goals:
Rather than trying to impose different physical assumptions under different weather regimes (e.g. separate ‘shallow’ and ‘deep’ convection schemes), the scheme has a single adaptive framework, under which differing behaviour under different regimes arises naturally as an emergent property (i.e. a single model for all convection types, but with an assumed plume size or entrainment rate that varies as a function of the environment).
Avoid hardwired structural assumptions (e.g. many convection schemes force convection to only launch from a single pre-ordained model-level, such as the surface or a surface-based lifting condensation level height, when in fact convection may trigger from any height in the column).
Include appropriate numerical methods and self-consistent assumptions required to address the longstanding problem of intermittency (many existing convection schemes ‘switch on and off’ from one timestep to the next).
Couple the convection scheme more fully and consistently to other components of the UM physics, e.g. large-scale microphysics, large-scale cloud, boundary-layer processes and aerosols (while maintaining portability, i.e. the ability to run CoMorph as a standalone calculation outside of the UM, or to be coupled into other models).
A generic, flexibly written convection code, to allow a range of developments within the ‘mass-flux’ convection parameterisation framework to be experimented with.
This work uses CoMorph-A, which is a package of changes to the UM physics. In summary, these include:
The CoMorph convection scheme.
The bimodal cloud scheme (Van Weverberg et al. 2021) to initiate condensation in the cloud scheme.
Extra prognostics for graupel and the subgrid area fraction of rain and graupel.
Convective precipitation generated by the upwards transport of the convective massflux and handled by the same microphysics scheme (Wilson and Ballard 1999) as for the large-scale rainfall when it falls. By contrast, for GA8, although convective precipitation is also generated during the upwards transport of the convective massflux, the microphysics schemes handling convective and large-scale rainfall are different (Stratton et al. 2021). In the CoMorph package, this means that the formations of large-scale and convective precipitation are handled consistently with respect to the microphysics.
Revised vertical interpolation of the local Richardson number in the boundary layer.
The fountain buster scheme (Lock et al. 2024) to improve conservation at stagnation points in the flow.
Development of CoMorph is ongoing and version B is under development with the following desired outcomes:
4.Results
4.1. Mean biases
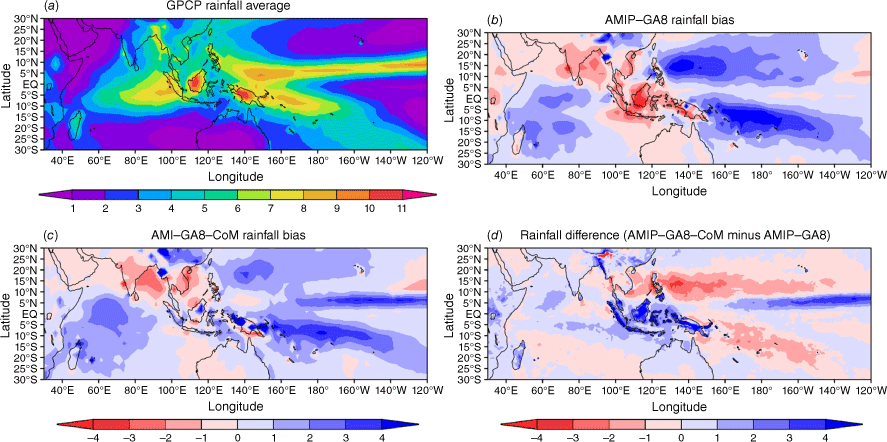
Climate models face significant challenges in realistically simulating rainfall. The rainfall bias from the 20-year AMIP simulation for the latest GA8 model with respect to Global Precipitation Climatology Project (GPCP, 2.5° resolution) observations (Adler et al. 2003) is shown in Fig. 1b for the tropical Indian Ocean and western Pacific Ocean region. The results indicate that GA8 has a dry bias over the MC region, northern Australia, the Indian subcontinent and eastern equatorial Indian Ocean south of the equator. However, wet biases cover much of the tropical oceanic regions, with the largest biases seen over the western Indian Ocean and the off-equatorial western Pacific Ocean regions. These dry and wet rainfall biases have been a persistent issue in different versions of the UM (Zhu and Hendon 2015; Zhu et al. 2017, 2018)
(a) Annual mean rainfall (mm day−1) from GPCP rainfall (Adler et al. 2003). Annual mean rainfall bias (mm day–1) with respect to the GPCP rainfall (Adler et al. 2003) in the (b) AMIP–GA8 and (c) AMIP–GA8–CoM experiments. (d) The difference in annual mean rainfall (mm day–1) between AMIP–GA8–CoM and AMIP–GA8.
The MC is a region where global climate models struggle to realistically represent the spatial distribution of rainfall and its variability (Jourdain et al. 2013). This is partially due to the complex topography and mesoscale circulations that are generally not captured by coarse global models (Neale and Slingo 2003; Rashid and Hirst 2017; Baranowski et al. 2019). In addition, deficient rainfall over the MC is often associated with other systematic errors, such as excess precipitation over the western Indian and western Pacific Oceans, which may promote divergence over the MC region (Zhu et al. 2017). Biases in rainfall over the MC have also been reported to adversely affect simulation of the eastward propagation of the MJO across the region (e.g. Neale and Slingo 2003; Klingaman and Woolnough 2014; Zhu et al. 2017).
By implementing the CoMorph convection scheme in GA8, many of the persistent biases seen in AMIP–GA8 (and prior model versions) have been reduced (Fig. 1b–d). AMIP–GA8–CoM has increased the rainfall over the MC and northern Australian regions (Fig. 1d) but overdoes it with an average wet bias of 0.62 mm day–1 over the MC (Table 1, Fig. 1c). The dry rainfall bias over the eastern equatorial Indian Ocean, south of the equator (Fig. 1b), is reduced in the AMIP–GA8–CoM simulation (Fig. 1c). Rainfall over the off-equatorial intertropical convergence zones (ITCZs) in the western Pacific Ocean is reduced in GA8–CoM. A wet bias, 1.88 mm day–1 (Table 1), over the tropical Pacific Ocean centred at 5°N is observed with the CoMorph convection scheme, due to the slight southwards shift of the northern branch of the ITCZ in AMIP–GA8–CoM (Fig. 1d and evident from the pattern of annual mean rainfall in GA8–CoM, not shown). The differences between the two simulations over the western Indian Ocean are generally small (Fig. 1d).
| Domain | MC | Western IO | Southern West Pacific | Northern West Pacific | Tropical Pacific | |
|---|---|---|---|---|---|---|
| Area | 100–150°E, 10°S–5°N | 50–80°E, 20°S–5°N | 160–200°E, 20°S–0 | 130–170°E, 0–30°N | 170–240°E, 0–10°N | |
| AMIP–GA8 | –1.60 | 1.71 | 2.73 | 1.89 | 0.56 | |
| AMIP–GA9-CoM | 0.62 | 1.81 | 2.04 | 1.28 | 1.88 |
To better understand the rainfall difference between GA8 and GA8–CoM, we examine the austral summer (DJF) and winter (JJA) rainfall (Fig. 2). Biases in a given hemisphere are most pronounced during the local summer when total rainfall amounts are also higher (Fig. 2a–f). For AMIP–GA8, the precipitation bias in austral summer (DJF) is characterised by wet biases over the western Indian and western Pacific Oceans south of the equator and a dry bias over the MC and northern Australia (Fig. 2c). With the CoMorph convection scheme, the average rainfall rate is increased in the MC region and northern Australia where the control simulation has a dry bias, and wet biases are reduced over the western Pacific Ocean warm pool region (Fig. 2e, g). However, as for annual mean rainfall (Fig. 1), in the AMIP–GA8–CoM run, wet biases are observed across the tropical Pacific Ocean just north of the equator located at ~5°N and over parts of the MC region (Fig. 2e).
The mean rainfall rate (mm day–1) of GPCP (Adler et al. 2003) for (a) DJF and (b) JJA and the rainfall rate (mm day–1) bias in (c, e) DJF and (d, f) JJA in (c, d) AMIP–GA8 and (e, f) AMIP GA8–CoM with respect to GPCP. The rainfall rate (mm day–1) difference between AMIP–GA8–CoM and AMIP–GA8 is shown in (g) and (h) for DJF and JJA respectively.
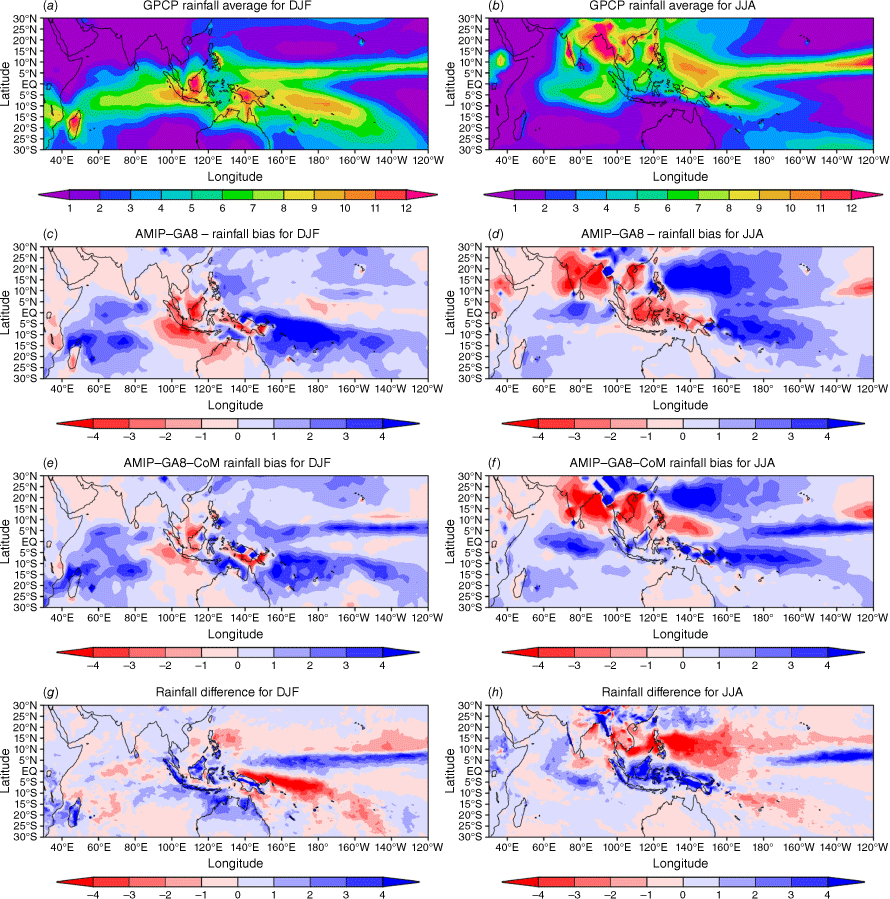
In the austral winter (JJA), the most dominant rainfall bias moves northwards to the northern hemisphere subtropical and tropical regions (Fig. 2d, f), consistent with the northward movement of the ITCZ. As seen in austral summer, there is a dry bias in AMIP–GA8 over the MC region. However, this is the dry season over northern Australia and the biases there are negligible compared to the wet (DJF) season (Fig. 2c, d). The wet bias over the Indian Ocean region moves from the western Indian Ocean (Fig. 2c) to the central equatorial Indian Ocean (Fig. 2d). North of this wet bias is a strong dry bias over the Indian monsoon region (Fig. 2d). This north–south dipole pattern of rainfall biases was previously identified in Keane et al. (2021) and probably is related to a local ascending–descending response to the convection. In contrast to the AMIP–GA8 simulation, there is now a wet bias over the MC in GA8–CoM (Fig. 2f, h). There is a reduction in rainfall over the western tropical Pacific in the northern hemisphere in AMIP–GA8–CoM compared to AMIP–GA8 (Fig. 2h). These changes reduce some of the wet biases seen in AMIP–GA8 (Fig. 2d, f), although a stronger dry bias southeast of the Philippines is introduced. There is no obvious improvement for the Indian monsoon region in the GA8–CoM simulation. Consistent with Martin et al. (2021), the systematic errors of rainfall and circulation for the Indian Ocean monsoon region evolve relatively quickly and persist in both GA8 and GA8–CoM and that the rate of error growth is comparable in the two models (not shown). Similar to the DJF season (Fig. 2e), there are wet biases across the tropical Pacific Ocean and over the MC region in AMIP–GA8–CoM in JJA (Fig. 2f).
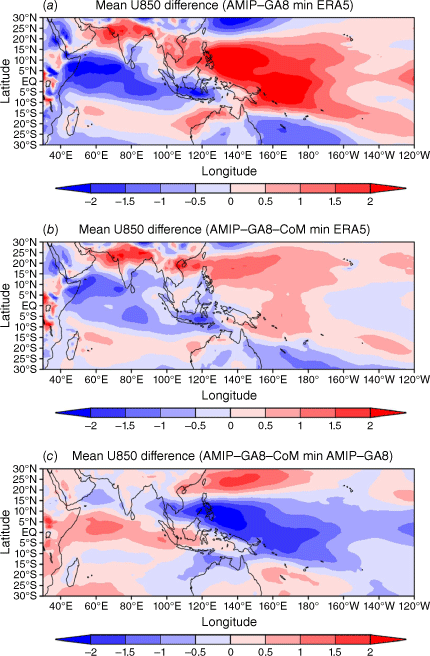
Associated with the rainfall bias in GA8 with the default convection scheme, there is increased ascending motion over the western Indian Ocean region and descending motion over the MC region (Zhu et al. 2017), leading to near-surface easterly winds that are too strong across the tropical Indian Ocean (Fig. 3a). Some of the improvements in the representation of rainfall over the Indian Ocean in the GA8-AMIP-CoM simulation, particularly the improvements over the eastern equatorial region, are likely associated with the reduced easterly wind bias (Fig. 3). The wind bias over the tropical Western Pacific Ocean region (i.e. easterlies that are too weak) is also significantly reduced in the AMIP–GA8–CoM experiment.
Zonal wind bias (m s–1) at 850 hPa (U850) with respect to ERA5 (Hersbach et al. 2020) in (a) AMIP–GA8 and (b) AMIP–GA8–CoM. (c) The difference in mean U850 (m s–1) between AMIP–GA8–CoM and AMIP–GA8.
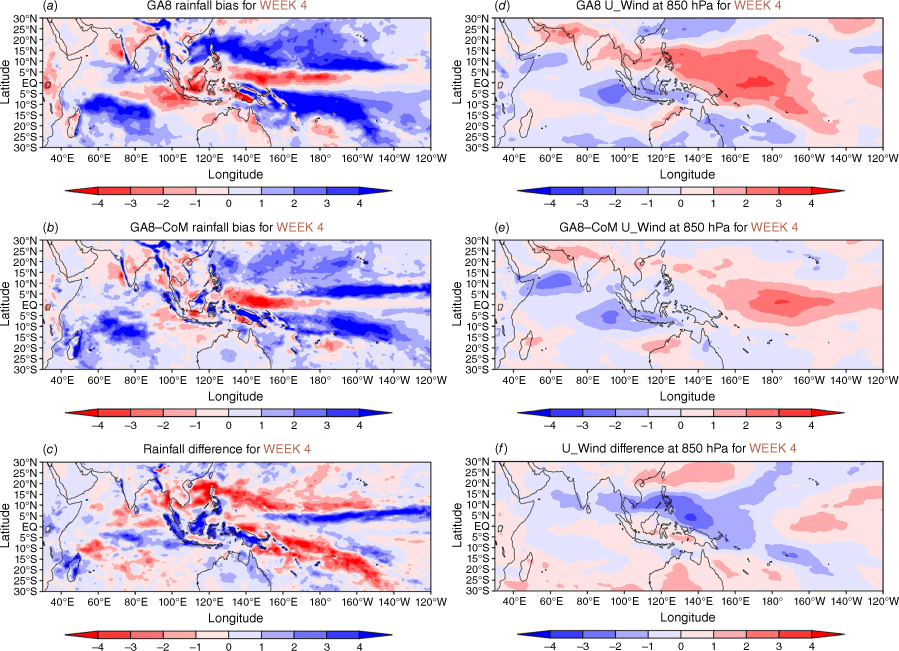
Similar improvements in rainfall and zonal wind biases are also found for the 28-day forecasts with GA8, indicating the effectiveness of the improvements with CoMorph-A across applications. Fig. 4 shows the Week-4 (i.e. average of days 22–28 of the forecast) rainfall and wind biases. The wet–dry–wet rainfall biases are evident over the western Indian Ocean, the eastern equatorial Indian Ocean and the MC, and the off-equatorial western Pacific Ocean respectively in GA8 (Fig. 4a). With CoMorph-A in GA8, the rainfall biases over the eastern Indian Ocean and off-equatorial western Pacific Ocean regions are somewhat reduced (Fig. 4b, c), but there is a strengthening of the wet bias over the central tropical Pacific Ocean (east of ~160°E), centred at 5°N, and the dry biases over the MC are now wet biases (Fig. 4b), as was seen in the AMIPS runs (Fig. 1 and 2). Similarly, the wind biases over the eastern equatorial Indian Ocean and MC regions and the tropical western Pacific Ocean are both improved with the CoMorph-A configuration (Fig. 4e, f).
Mean biases at Week 4 of the forecast in the set of 28-day forecasts comprising 58 initialisation dates from December 2018 to April 2021. Left panels: Week-4 mean rainfall rate bias (mm day–1) with respect to the GPCP rainfall observations (Hersbach et al. 2020) for (a) GA8 and (b) GA8–CoM. (c) The difference in Week-4 mean rainfall rate (mm day–1) between GA8–CoM and GA8. Right panels: Week-4 mean zonal wind bias (m s–1) with respect to the ERA5 (Hersbach et al. 2020) for (d) GA8 and (e) GA8–CoM. (f) The difference in Week-4 mean zonal wind (m s–1) between GA8–CoM and GA8.
4.2. MJO simulation and prediction
With the improvement of the mean precipitation distribution in the MC, the eastward propagation of organised convection associated with MJO also somewhat improves. To demonstrate the ability of the model to simulate eastward propagating intraseasonal variability, we calculate the lead-lag correlation coefficients between 20 and 100 days bandpass filtered outgoing longwave radiation (OLR) data from a central Indian Ocean time series and the associated 10°N–10°S averaged fields at all longitudes (Fig. 5a, c, e). AMIP–GA8–CoM (Fig. 5e) exhibits some improvement in the eastward propagation across the Indian and west Pacific Oceans compared to AMIP–GA8 (Fig. 5c), in which the convection fails to propagate eastwards beyond the central Indian Ocean. However, compared to reanalysis (Fig. 5a), there are still clear deficiencies in the eastward propagation of convection in AMIP–GA8–CoM, particularly in the propagation across the MC.
Left panels: lag correlation of equatorial intraseasonal OLR onto a reference zonal wind time series at 90°E in (a) ERA5, (c) AMIP–GA8 and (e) AMIP–GA8–CoM. The MC (100–140°E) is marked by green boxes. Right panels: coherence squared (colours) and phase (vectors) spectra between the symmetric OLR and U850 components for (b) ERA5, (d) AMIP–GA8 and (f) AMIP–GA8–CoM. Upward pointing arrows indicate that the fields are in phase, and an arrow pointing to the right indicates that the first field is leading the second field by a quarter cycle.
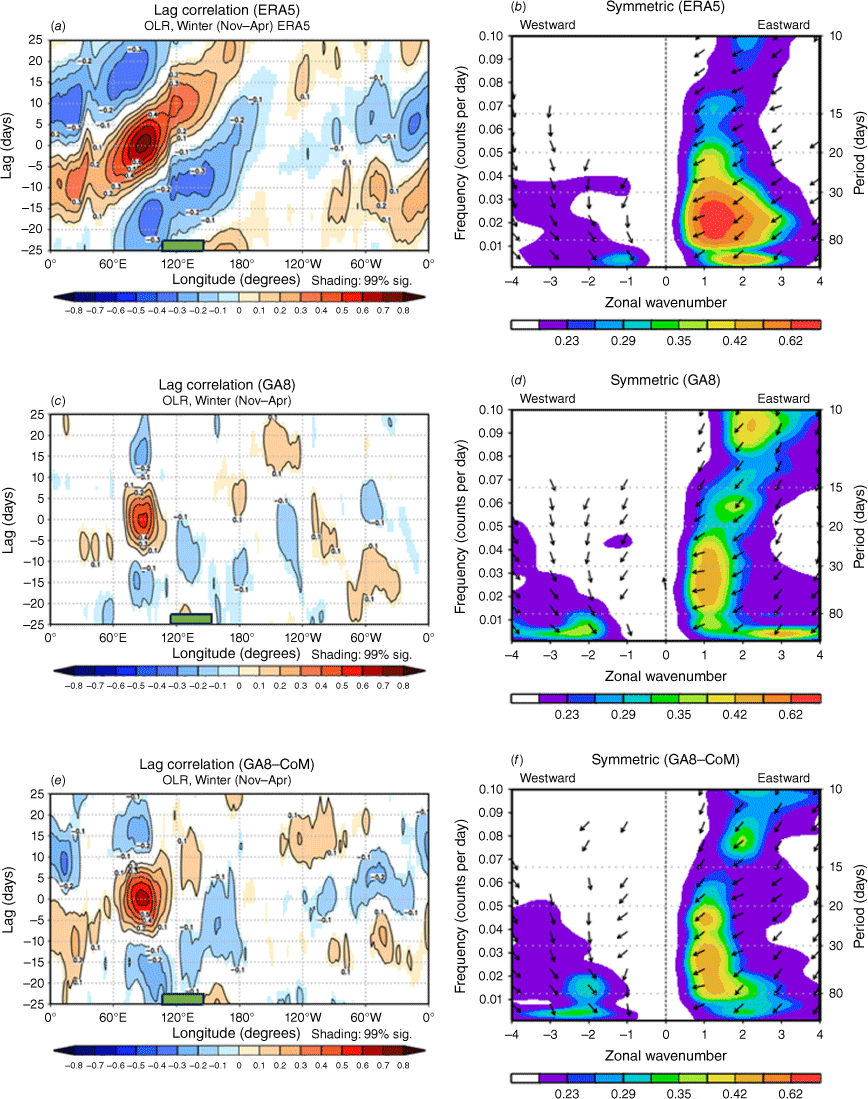
The simulation of the MJO is also assessed using wavenumber–frequency spectral analysis (Fig. 5b, d, f). The analysis is applied to daily mean OLR and zonal wind at 850 hPa, and we display the coherence squared for the equatorially symmetric components (e.g. Wheeler and Kiladis 1999). In addition, to focus on the MJO, the results in Fig. 5 are restricted to wavenumbers between −4 and 4 and frequencies less than 0.1. The reanalysis shows a spectral peak at wave numbers 1–3 and a period of 30–90 days (Fig. 5b). For the AMIP–GA8 experiment (Fig. 5d), there is spectral peak at wave number 1 with a period of 25–80 days, but wave activity for wave numbers 2 and 3 is deficient. Comparing AMIP–GA8–CoM (Fig. 5f) and AMIP–GA8 (Fig. 5d), the power among the frequencies between 20 and 80 days at wave numbers 2–3 has improved in the AMIP–GA8–CoM experiment. In both AMIP experiments, the wave signals are weaker compared to ERA5 (Fig. 5b).
Zhu et al. (2009) showed that the ability of a model to exhibit convective organisation at time and space scales associated with MJO is sensitive to the humidity state of the atmosphere as represented by the saturation fraction. Daily values of saturation fraction (r) are computed as follows:
where W and W* are the column-integrated water vapour mixing ratio and column-integrated saturated water vapour mixing ratio respectively.
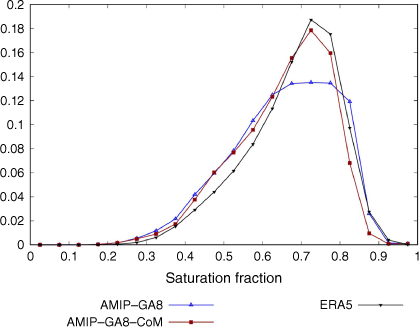
The frequency of occurrence of saturation fraction is shown in Fig. 6. The ERA5 distribution is strongly peaked with the mode near 0.70–0.75, with a sharp decline towards higher saturation fraction (very few occurrences greater than 0.9) and a long tail towards lower saturation fractions. The AMIP–GA8 result displays a broader distribution with a flat peak at 0.60–0.85 and a much lower peak value compared to reanalysis. This broader and flatter distribution in AMIP–GA8 might be indicative of convection being triggered more easily and being less well-organised than in ERA5. By contrast, the shape of the frequency distribution for AMIP–GA8–CoM is closer to the reanalysis, consistent with its improved MJO forecast skill as demonstrated next.
Frequency of occurrence (i.e. ratio of the number of cases to the total number of data points) of saturation fraction values over tropical ocean grid points in the Indo-Pacific warm-pool region (20°S–20°N, 60–180°E) for AMIP–GA8, AMIP–GA8–CoM and the ERA5 reanalysis. A bin size of 0.05 was used for the saturation fraction values.
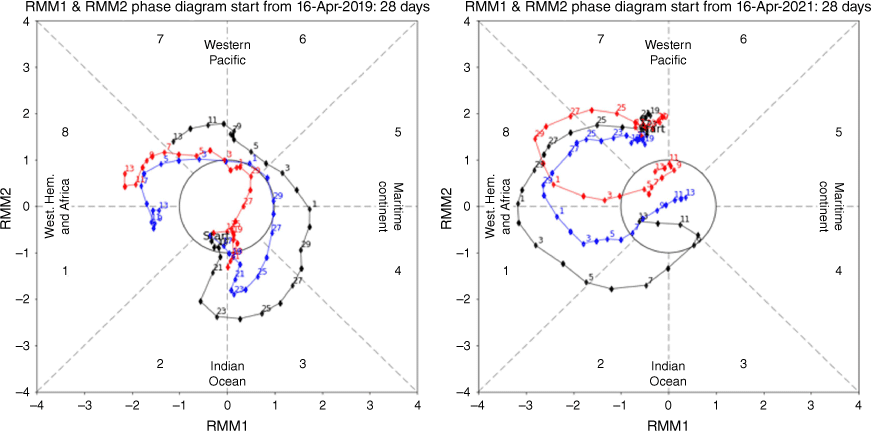
To evaluate MJO forecasts in GC4 and GC4 with CoMorph, we start by examining two forecast cases that exhibited large MJO amplitudes in the reanalysis. Fig. 7 shows the Real-time Multivariate MJO (RMM)1 and RMM2 phase diagrams (Wheeler and Hendon 2004) for forecasts initialised on 16 April 2019 and 2021 respectively. The reanalysis shows that in April 2019, the MJO propagates through Phases 2–7 with the strongest amplitudes in Phases 3 and 4 (Fig. 7, left panel). By contrast, GC4 has its weakest amplitudes for Phases 3 and 4 (essentially inactive) and largest amplitude in Phase 8. The forecast with GC4–CoM better agrees with the reanalysis for most phases of the MJO cycle compared to GC4, with a much stronger amplitude in Phase 3. For the forecast initiated on 16 April 2021, the ERA5 MJO propagates through Phases 7, 8, 1, 2, 3 and 4 with the strongest amplitudes in Phase 8 and 1 (Fig. 7, right panel). The GC4 forecast only experiences MJO Phases 7 and 8 and then rapidly decays. With the CoMorph convection scheme, the MJO forecasts in GC4–CoM correctly capture the phase evolution, and the maximum amplitude occurs in Phases 8 and 1 as in ERA5.
Phase space of the Real-time Multivariate MJO (RMM) index of Wheeler and Hendon (2004) for the 28-day forecasts starting on 16 April 2019 (left panel) and 2021 (right panel). Each dot represents a day, and the sequence of days is joined by lines. The black line represents ERA5, the red line is for GC4 and the blue line is for GC4–CoM.
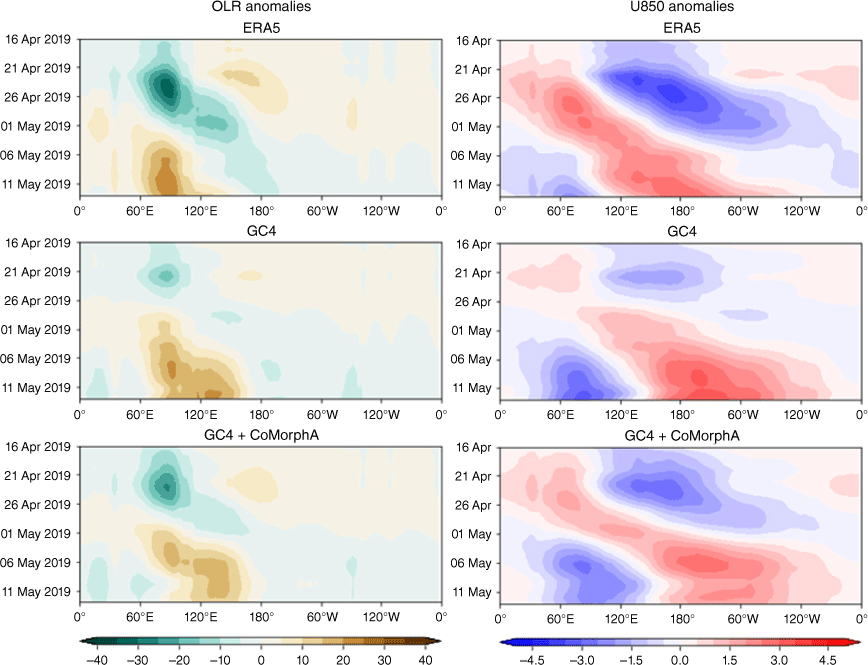
The eastward propagation of OLR and U850 anomalies for the case initialised on 16 April 2019 is displayed in Fig. 8. The reanalysis shows that the convection and 850-hPa wind associated with the MJO starts in the central Indian Ocean and propagates to the western Pacific Ocean after ~2 weeks. The MJO forecast using GC4 fails to propagate eastwards. In GC4–CoM, both the OLR and U850 anomalies associated with the MJO show improved eastward propagation.
Time-longitude plot of the OLR (left panel) and U850 (right panel) reconstructed from the leading empirical orthogonal function (EOF) pair of the RMM EOF analysis for the case initialised on 16 Apr 2019 for ERA5 (top panel), GC4 (middle panels) and GC4–CoM (lower panels).
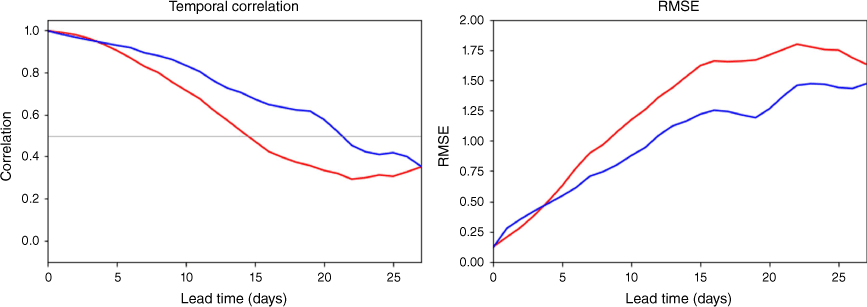
The above results are, however, only for two cases. The verification of all the MJO forecasts (58 initialisation dates − see Section 2) are shown in Fig. 9. The left panel shows the correlation between the forecast and reanalysis bivariate RMM index as a function of lead time. GC4–CoM has a significantly higher correlation with ERA5 compared to GC4, with correlations above 0.5 out to ~20 days lead time compared to ~15 days for GC4. Similarly, the root mean square error (RMSE) of the bivariate RMM index is lower in GC4–CoM. In the future we plan to increase the robustness of this result by introducing an ensemble forecast for each start time.
Correlation (left panel) and root mean square error (RMSE, right panel) of the predicted bivariate RMM index for the 28-day forecasts as a function of lead time (days) for all the 58 forecast initialisation dates. The red lines represent the results of GC4 and blue lines are for GC4–CoM forecasts.
4.3. Case studies of tropical cyclone forecasts
In this section, we investigate the forecast performance for Tropical Cyclones (TCs) Seroja, Ruby and Seth in GA8 and GA8–CoM.
Severe TC Seroja was a deadly tropical cyclone that brought historic flooding and landslides to portions of southern Indonesia and East Timor and later went on to make landfall in Western Australia’s mid-west region.
We use the minimum surface pressure to verify the TC track and intensity against the best track databases for the Australian region (Courtney et al. 2020). The TC centre is defined as the location of the minimum surface pressure (Pmin) and the intensity as the value of Pmin. The intensity forecasts of TC Seroja are compared in Fig. 10a. The observation (black line) shows that TC Seroja started to intensify from the initial time reaching a minimum central pressure of 983 hPa after 90 h, with a second rapid intensification to 972 hPa after 210 h. The GA8 forecast (blue line) fails to capture these two intensifications, instead having a weaker central surface pressure oscillating at ~1003 hPa. The forecast with CoMorph (GA8–CoM; red line) successfully predicts the two intensification periods of TC Seroja, although the second intensification occurrs more than a day earlier than observed.
(a) The intensity evolution in terms of minimum surface pressure and (b) the track in terms of the position of the central surface pressure for TC Seroja from observations (black; the best track databases, Courtney et al. 2020) and forecasts from GA8 (blue) and GA8–CoM (red). The forecasts were initialised at 12:00 hours UTC on 2 April 2021.
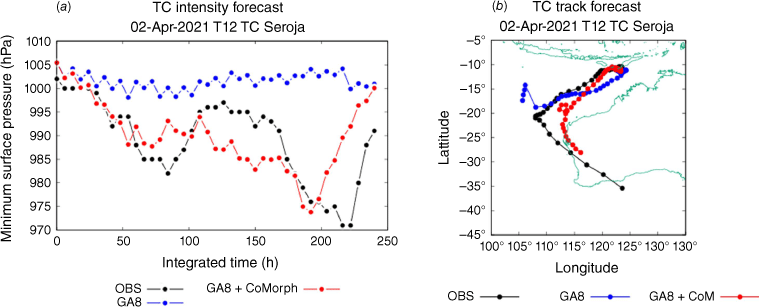
Fig. 10b shows the track forecast comparison of TC Seroja. The observed best track (black line) shows that the tropical storm starts from Indonesia moving south-westerly followed by a south-easterly movement when experiencing extra-tropical transition. The track forecast from GA8 (blue line) fails to capture the south-eastwards transition of the storm track. The track forecast is improved with GA8–CoM (red line), which captures the south-eastwards transition, although not travelling as far south over the 10 days as was observed.
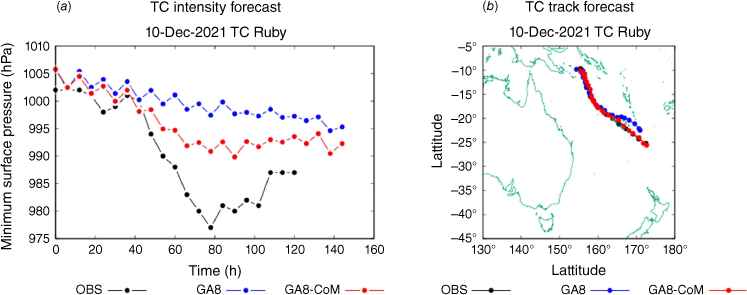
Tropical Cyclone Ruby was a strong but short-lived TC that impacted New Caledonia with strong winds and rainfall. The observed TC Ruby started rapid intensification after 40 h from the initial time, 10 December 2021, and reached a minimum surface pressure of 976 hPa after ~80 h, followed by a decay. The forecast with GA8 fails to capture the rapid intensification of the vortex and the minimum surface pressure only oscillates at ~1000 hPa at the 80-h lead time, much weaker compared to the observation. The intensity forecast is improved in GA8–CoM, which captures some intensification of the cyclone, with the minimum surface pressure ~10 hPa lower than that of the control forecast from GA8 at 80-h lead time.
The track forecast (Fig. 11b) comparison indicates that both GA8 and GA8–CoM forecasts capture the south-eastwards motion of the storm. The track forecast in GA8–CoM is well in line with the observation, and the track forecast in GA8 deviates slightly eastwards at later integration times.
As for Fig. 10, i.e. (a) the intensity evolution in terms of minimum surface pressure and (b) the track in terms of the position of the central surface pressure, but for TC Ruby initialised at 00:00 hours UTC on 10 December 2021.
Similar improvements of the TC forecast in GA8–CoM are also observed for TC Seth. This TC brought strong winds, rain and large waves to the Queensland coast with waves up to 6 m and developed into a Category 2 TC while travelling south-east along the Queensland coast to Mackay, where it was downgraded to a Category 1 TC on 1 January 2022.
The observation (Fig. 12a) shows that TC Seth started with a rapid intensification from the initial time, 30 December 2021, and reached the minimum surface pressure of 982 hPa after 35 h, followed by a period of decaying. The rapid intensification in the forecast with GA8 is delayed by ~2 days and the minimum surface pressure only reaches ~995 hPa in the first 3 days of the forecast, much weaker compared to observed. The intensity forecast with CoMorph-A is improved compared to GA8, with a much deeper minimum surface pressure, but the forecast (from both models) shows a monotonic intensification over the period, rather than a rapid intensification and then decay.
As for Fig. 10, i.e. (a) the intensity evolution in terms of minimum surface pressure and (b) the track in terms of the position of the central surface pressure, but for TC Seth initialised at 00:00 hours UTC on 30 December 2021.
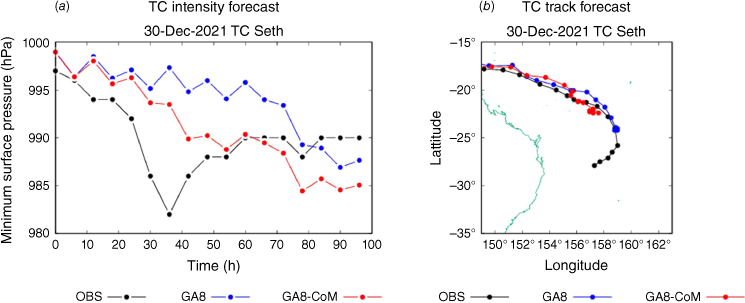
The track forecasts (Fig. 12b) from both GA8 and GA8–CoM compare well with the observation, except that the cyclone moves slower than observed in both models.
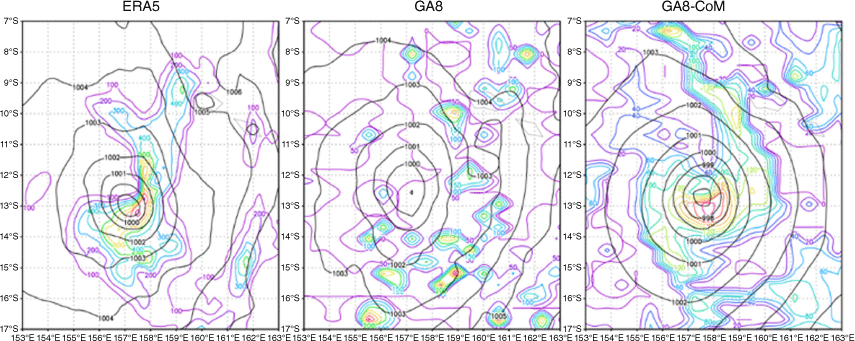
Overall in these three cases, the GA8 model with the CoMorph-A configuration has better TC forecasts in terms of intensity and track compared to those from the control forecast with GA8. The forecasted TC intensity in GA8 in general is much weaker than observed (Fig. 10–12). The overall weaker intensity than observed for both model configurations is probably due in part to the use of a 40-km model. Typically, TCs range in diameter from 100 to 2000 km, therefore a 40-km model resolution should be able to reasonably capture them, albeit potentially underpredicting the central pressure (amongst other things). We have run 12-km resolution forecasts with GA8 for TCs Ruby and Seroja, and the 12-km versions do indeed show a small improvement in intensity compared to the respective 40-km forecasts (not shown). However, in both cases the TCs in the 12-km GA8 model are still not as intense as in the respective 40-km GA8 CoMorph configurations. The major driver of the weak TC intensity in GA8 may be due to the way the model produces the TC rainfall spatial distribution, and the subsequent impacts that has on the TC dynamics, as shown for TC Ruby (Fig. 13). The spatial rainfall distribution in GA8–CoM is more coherent and symmetric in the inner core region, which helps to strengthen the TC circulation in the simulation with the CoMorph convection scheme (Smith and Montgomery 2016). Fig. 13 shows that the rainfall pattern from GA8–CoM is much closer to that from the ERA5 reanalysis (Hersbach et al. 2020) compared to GA8. By contrast, the rainfall in the simulation with the default GA8 convection scheme has a scattered, spotty and asymmetric structure, which is mainly located outside of the vortex inner core, leading to less organised TC circulation and weaker intensification of the vortex. Similar rainfall distributions are observed with the other TC cases (not shown).
4.4. Diurnal cycle over the MC
The Met Office UM has considerable difficulty in capturing the observed phase of the diurnal cycle in convection, which suggests some fundamental difficulties in the model’s physical parameterisations (Yang and Slingo 2001; Guichard et al. 2004; Stratton and Stirling 2011; Stirling and Stratton 2012). To evaluate the simulation of the diurnal cycle, we use 3-hourly TRMM data (Huffman et al. 2007) for the observations. Fig. 14 compares the diurnal cycle of rainfall from observations, and the climatology from the GC4 and GC4–CoM forecasts respectively for the island of Borneo (defined as 113–127°E, 5°S–2°N, land only) for December 2013.
The diurnal cycle of rainfall (mm h–1) over Borneo from TRMM observations (black line), and the climatology from the GC4 (blue line) and GC4–CoM (red line) forecasts.
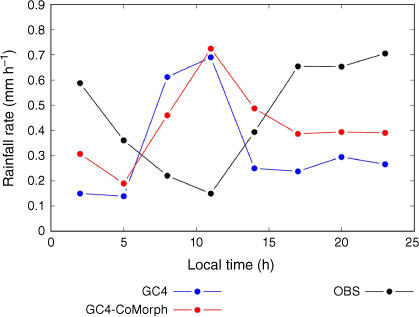
The observations show that the rainfall rate has a minimum in the morning c. 11:00 hours (Fig. 14) when rainfall mainly occurs over the surrounding sea (Fig. 15a). The rainfall over land then starts to increase in the afternoon and reaches its maximum in the late afternoon and evening (Fig. 14). The observed convection over land tends to accumulate instability in the late morning and early afternoon, and then rains in the late afternoon and evening when the convective instability reaches a maximum.
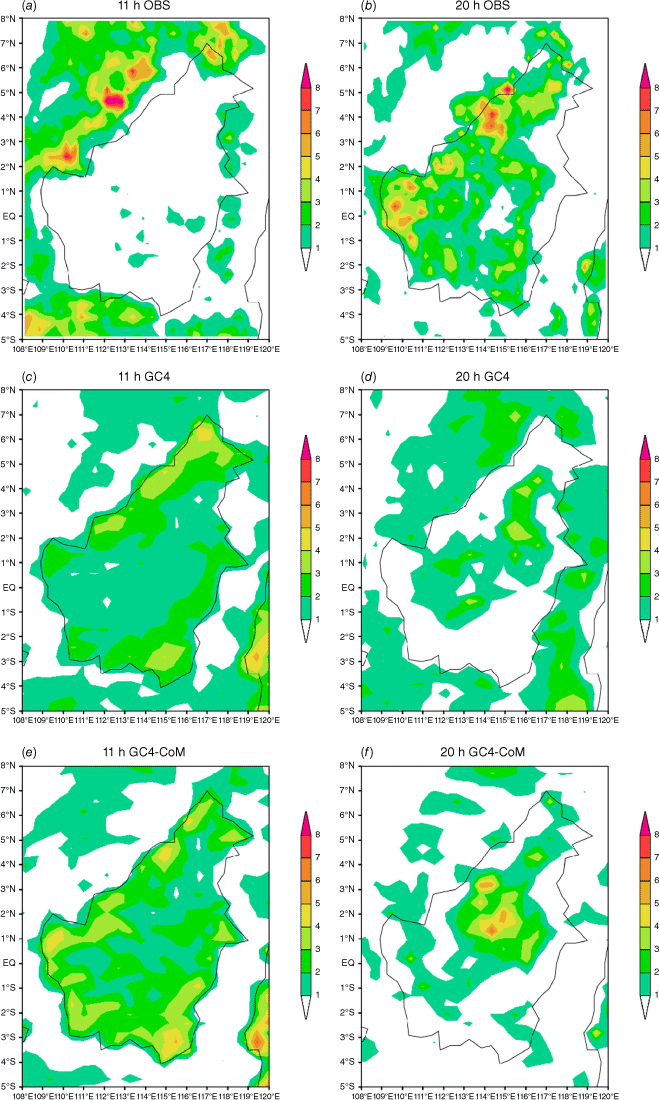
Morning (a, c and e) and evening (b, d and f) rainfall rates (mm day–1) over the Borneo region for TRMM observations (a, b) and model forecast climatologies from GC4 (c, d) and GC4–CoM (e, f).
It is clear that the UM continues to face challenges in accurately representing the diurnal cycle of rainfall, with both GC4 models performing poorly in this region (Fig. 14). For the GC4 forecast with the default convection scheme, the rainfall rates reach a maximum in the morning c. 11:00 hours, presumably due to the convective available potential energy (CAPE) closure settings in the convection scheme, which is designed to release convective instability whenever the instability is present. In contrast to observations, the rainfall rates in GC4 are at a minimum in the late afternoon and in the evening. In the simulation with the CoMorph convection scheme (GC4–CoM), the rainfall also peaks at 11:00 hours, as in GC4, but the intensity of convection is stronger in the late afternoon and evening compared to GC4.
To further understand the evolution of the diurnal cycle of convection, Fig. 15 shows the precipitation map at 11:00 hours in the morning and 20:00 hours in the evening for the observations and forecasts with the GC4 and GC4–CoM models.
The TRMM observations (Fig. 15a, b) show that in the morning the convection is mainly located offshore and there is a lack of convection over the land, whereas in the evening most of the convection is over the land. By contrast, for both GC4 and GC4–CoM the convection is focused over the land during the morning, and generally weakens, or is less widespread, over land in the evening (Fig. 15c–f). However, GC4–CoM does seem to somewhat better sustain the intensity of convection into the afternoon and evening, possibly due to the changes in entrainment scheme in CoMorph. An improved rainfall diurnal cycle over the land with modified convection entrainment rates has been studied by Stratton and Stirling (2011), Stirling and Stratton (2012) and Willett and Whitall (2017).
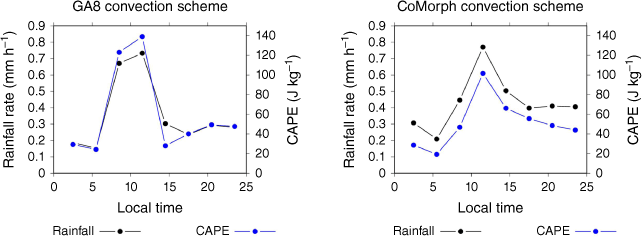
Both the default and CoMorph convection schemes are based on convective instability, which tends to lead to an earlier start of inland convection in the models. Fig. 16 shows the diurnal cycle of CAPE and rainfall rate in the forecasts with the GA8 and CoMorph convection schemes respectively. In both experiments, the CAPE peaks c. 11:00 hours and the rainfall rate develops in phase with the CAPE. This points toward the limitation of an instability-based convection scheme to reproduce the observed diurnal cycle of rainfall. Other physics processes have been found to be important for MC convection. For example, precipitation in the MC region has been shown to have a strong dependence on sea breezes (Qian 2008; Bergemann et al. 2017). Improving the diurnal cycle of convection is one of the main aims in the current development of CoMorph-B, the next version of CoMorph.
The diurnal cycle of convective available potential energy (CAPE, J kg–1) and rainfall (mm h–1) over Borneo. Left panel is for GC4 with the default convection scheme in GA8 and the right panel is for GC4 with the CoMorph convection scheme.
As a dominant mode of the tropical intraseasonal oscillations, the MJO initiated from the western Indian Ocean can modulate the behaviour of the diurnal cycle of precipitation over the MC (e.g. Hassim et al. 2016; Vincent and Lane 2016, 2018; Lu et al. 2019). In general, the amplitude of the island diurnal cycle reaches its maximum during a local MJO suppressed period and reaches its minimum in a MJO active period, while the opposite is true for the diurnal cycle over the ocean (e.g. Birch et al. 2016; Vincent and Lane 2017). By contrast, some other studies have shown that the diurnal cycle of rainfall phase is not significantly affected by the MJO (e.g. Suzuki 2009). Wei et al. (2020) showed that the MJO modulates the amplitude, timing and propagation of diurnal precipitation through a combination of varying large-scale and local circulations and convection. In summary, the interaction between the diurnal cycle of rainfall in the MC region and the MJO is complex. In addition, it is not clear what role the erroneous diurnal cycle (as seen in the models) might have on the poor propagation of the MJO in this region (Fig. 5).
Furthermore, the diurnal cycles of precipitation, temperature and humidity have been shown to vary with the monsoon regimes and non-monsoon periods across the MC. For example, May et al. (2012) studied active monsoonal and large-scale suppressed (buildup and break) conditions and demonstrated that the diurnal variation of rainfall is significantly larger during the break periods, and the spatial distribution of rainfall differs markedly between the monsoon and break regimes. May et al. (2023) further examined the diurnal and seasonal variability of near-surface temperature and humidity at several large areas within the MC and found a strong monsoonal influence across these fields, linked to low-level circulation, rainfall, cloud cover and resulting radiation. Future work could consider the impacts of the MJO and monsoon flow on the diurnal cycle of rainfall over the MC region in these forecasts.
5.Conclusion
To improve the model convection performance and reduce model biases, a new convection scheme, ‘CoMorph-A’, is introduced into the current GC4 and GA8 models. The impact of CoMorph is examined in atmosphere-only AMIP simulations run at ~60-km resolution (N216), as well as in initialised 28-day forecasts with both coupled (GC4) and uncoupled (GA8) configurations at ~40-km (N320) atmosphere resolution. Model performance is analysed in terms of tropical rainfall and wind biases, MJO simulation and prediction, TC forecasts and the diurnal cycle over the MC.
The tropical rainfall biases in GC4 and GA8 are characterised by dry biases over the MC and northern Australian regions and positive precipitation biases in the tropical western Indian and Pacific Oceans. Replacing the standard convection scheme with the CoMorph package in both GC4 and GA8 has a significant effect on these biases. Using CoMorph results in an increase in precipitation over the MC region and northern Australia, and a decrease in rainfall over the tropical (off-equatorial) western Pacific Ocean, thus reducing the biases in these regions. However, the increase in rainfall over the MC region with CoMorph is somewhat overdone, resulting in a wet bias in places. The reduced precipitation biases are accompanied by reduced zonal wind biases over the eastern Indian Ocean and MC (where the easterlies are too strong in GA8 and GC4), and over the tropical western Pacific Ocean (where the easterlies are too weak in GA8 and GC4).
With the improvement of the mean precipitation and zonal wind distribution over the tropical Indo-Pacific regions, the eastward propagation of organised convection associated with the MJO is somewhat improved in both the GC4 forecasts and the GA8 AMIP climate simulations when including CoMorph-A. However, the MJO signal is still weaker than in the ERA5 reanalysis when using CoMorph. There is an impressive improvement in the MJO prediction skill when CoMorph is included in GC4. This is based on single member forecasts for 58 cases. Future work will look to including an ensemble to increase the robustness of the results.
The case studies of TCs Seroja, Ruby and Seth show much improved intensity forecasts in GA8 when CoMorph-A convection scheme is employed, compared to forecasts with the default convection scheme in GA8, in which the forecasted TC intensities are too weak.
Capturing the diurnal cycle of rainfall has been a challenging topic for models. Over the MC the rainfall rate is at a minimum in the morning and reaches a maximum in the late afternoon and evening. Compared to observations, the diurnal cycle of rainfall over the MC (specifically Borneo) in GC4 peaks too early, in the late morning, and drops abruptly in the later afternoon and evening. The diurnal cycle over the MC land region slightly improves when CoMorph is used in GC4 with increased intensity of rainfall in the late afternoon and evening. However, there is still a tendency for rainfall to peak in the morning presumably due to the design of the mass flux convection scheme, which does not allow for convective instability to properly accumulate in both GC4 and GC4–CoM models.
CoMorph is continuing to be developed, and the next version, CoMorph-B, is due to be released in the near future. CoMorph-B aims to address some of the issues found with CoMorph-A, including improving the diurnal cycle of rainfall over land, especially the early peaking. It also involves the addition of new physical processes such as the triggering of convection by forced uplift, including updraft radius dependence on regime and dynamic entrainment. Future evaluation work of the impact of CoMorph on the Indo-Pacific and Australian regions will focus on CoMorph-B, as well as using the latest configuration of the global coupled model, GC5.
Data availability
The model output that supports this study will be shared upon reasonable request to the corresponding author.
Declaration of funding
This work received financial support to Hongyan Zhu and Chen Li from the Australian Government’s National Environmental Science Program (NESP2) and to Sally Lavender from the Northern Australia Climate Program (NACP3).
Acknowledgements
We thank the kind technical support form Anderson Murray and Scott Wales from the next-generation modelling team at The Bureau of Meteorology (Australia) and the constructive suggestions from two anonymous reviewers.
References
Adler RF, Huffman GJ, Chang A, et al. (2003) The version-2 Global Precipitation Climatology Project (GPCP) monthly precipitation analysis (1979–present). Journal of Hydrometeorology 4, 1147-1167.
| Crossref | Google Scholar |
Baranowski DB, Waliser DE, Jiang X, Ridout JA, Flatau MK (2019) Contemporary GCM fidelity in representing the diurnal cycle of precipitation over the Maritime Continent. Journal of Geophysical Research: Atmospheres 124, 747-769.
| Crossref | Google Scholar |
Bergemann M, Khouider B, Jakob C (2017) Coastal tropical convection in a stochastic modelling framework. Journal of Advances in Modelling Earth Systems 9, 2561-2582.
| Crossref | Google Scholar |
Bi D, Dix M, Marsland S, et al. (2020) Configuration and spin-up of ACCESS-CM2, the new generation Australian Community Climate and Earth System Simulator coupled model. Journal of Southern Hemisphere Earth Systems Science 70(1), 225-251.
| Crossref | Google Scholar |
Birch CE, Webster S, Peatman SC, Parker DJ, Matthews AJ, Li Y, Hassim M (2016) Scale interactions between the MJO and the western Maritime Continent. Journal of Climate 29(7), 2471-2492.
| Crossref | Google Scholar |
Bureau of Meteorology (2019) APS3 upgrade of the ACCESS-G/GE Numerical Weather Prediction System (BOM). National Operational Centre Operations Bulletin Number 125. (The Bureau of Meteorology) Available at http://www.bom.gov.au/australia/charts/bulletins/opsbull_G3GE3_external_ v3.pdf
Courtney JB, Burton AD, Velden CS, et al. (2020) Towards an objective tropical cyclone dataset for the Australian region. Tropical Cyclone Research and Review 9, 23-36.
| Crossref | Google Scholar |
Daleu CL, Plant RS, Stirling AJ, Whitall M (2023) Evaluating the CoMorph-A parametrization using idealized simulations of the two-way coupling between convection and large-scale dynamics. Quarterly Journal of the Royal Meteorological Society 149, 3087-3109.
| Crossref | Google Scholar |
Gregory D, Rowntree PR (1990) A mass-flux convection scheme with representation of cloud ensemble characteristics and stability dependence closure. Monthly Weather Review 118, 1483-1506.
| Crossref | Google Scholar |
Gates WL, Boyle JS, Covey C, Dease CG, Doutriaux CM, Drach RS, Taylor KE (1999) An overview of the results of the Atmospheric Model Intercomparison Project (AMIP I). Bulletin of the American Meteorological Society 80(1), 29-55.
| Crossref | Google Scholar |
Guichard F, Petch JC, Redelsperger J-L, Bechtold P, Chaboureau J-P, Cheient S, Grabowski W, Grenier H, Jones CG, Kohler M, Piriou J-M, Tailleux R, Tomasimni M (2004) Modelling the diurnal cycle of deepprecipitating convection over land with cloud-resolving models andsingle-column models. Quarterly Journal of the Royal Meteorological Society 130, 3139-3172.
| Crossref | Google Scholar |
Hassim MEE, Lane TP, Grabowski WW (2016) The diurnal cycle of rainfall over New Guinea in convection‐permitting WRF simulations. Atmospheric Chemistry and Physics 16(1), 161-175.
| Crossref | Google Scholar |
Hersbach H, Bell B, Berrisford P, et al. (2020) The ERA5 global reanalysis. Quarterly Journal of the Royal Meteorological Society 146, 1999-2049.
| Crossref | Google Scholar |
Holland JZ (1970) Preliminary report on the BOMEX sea–air interaction program. Bulletin of the American Meteorological Society 51(9), 809-820.
| Crossref | Google Scholar |
Hudson D, Alves O, Hendon HH, et al. (2017) ACCESS-S1: the new Bureau of Meteorology multi-week to seasonal prediction system. Journal of Southern Hemisphere Earth System Science 67(3), 132-159.
| Crossref | Google Scholar |
Huffman GJ, Adler RF, Bolvin DT, Gu G, Nelkin EJ, Bowman KP, Hong Y, Stocker EF, Wolff DB (2007) The TRMM multisatellite precipitation analysis: quasi-global, multi-year, combined-sensor precipitation estimates at fine scale. Journal of Hydrometeorology 8, 38-55.
| Crossref | Google Scholar |
Jourdain NC, Gupta AS, Taschetto AS, Ummenhofer C, Moise AF, Ashok K (2013) The Indo-Australian monsoon and its relationship to ENSO and IOD in reanalysis data and CMIP3/CMIP5 simulations. Climate Dynamics 41, 3073-3102.
| Crossref | Google Scholar |
Keane RJ, Parker DJ, Fletcher JK (2021) Biases in Indian summer monsoon precipitation forecasts in the Unified Model and their relationship with BSISO index. Geophysical Research Letters 48, e2020GL090529.
| Crossref | Google Scholar |
Klingaman NP, Woolnough SJ (2014) Using a case-study approach to improve the Madden–Julian Oscillation in the Hadley Centre model. Quarterly Journal of the Royal Meteorological Society 140, 2491-2505.
| Crossref | Google Scholar |
Lavender S, Stirling AJ, Whitall M, Stratton RA, Daleu CL, Plant RS, Lock A (2024) The use of idealised experiments in testing a new convective parameterization: performance of CoMorph-A. Quarterly Journal of the Royal Meteorological Society 150, 1581-1600.
| Crossref | Google Scholar |
Lock A, Whitall M, Stirling AJ, Williams K, Lavender S, Stratton RA (2024) The performance of the CoMorph-A convection package in global simulations with the Met Office Unified Model. Quarterly Journal of the Royal Meteorological Society. [Published online early 24 June 2024].
| Crossref | Google Scholar |
Lu J, Li T, Wang L (2019) Precipitation diurnal cycle over the Maritime Continent modulated by the MJO. Climate Dynamics 53(9–10), 6489-6501.
| Crossref | Google Scholar |
Madec G, Delecluse P, Imbard M, Levy C (1998) OPA 8.1: Ocean General Circulation Model reference manual. Technical Report LODYC/IPSL Note 11. (Institut Pierre Simon Laplace des Sciences de l’Environnement Global) Available at https://www.nemo-ocean.eu/wp-content/uploads/Doc_OPA8.1.pdf
Martin GM, Levine RC, Rodriguez JM, Vellinga M (2021) Understanding the development of systematic errors in the Asian summer monsoon. Geoscientific Model Development 14, 1007-1035.
| Crossref | Google Scholar |
May PT, Protat A, Long C (2012) The diurnal cycle of the boundary layer, convection, clouds, and surface radiation in a coastal monsoon environment (Darwin, Australia). Journal of Climate 25, 5309-5326.
| Crossref | Google Scholar |
May PT, Trewin B, Narin JR, Ostendorf B, Su Chun-Hsu, Moise A (2023) Diurnal and seasonal variability of near-surface temperature and humidity in the Maritime Continent. Journal of Applied Meteorology and Climate 61(11), 1819-1834.
| Crossref | Google Scholar |
Neale RB, Slingo JM (2003) The maritime continent and its role in the global climate: a GCM study. Journal of Climate 16, 834-848.
| Crossref | Google Scholar |
Park H, Kim G, Cha D-H, Chang E-C, Kim J, Park S-H, Lee D-K (2022) Effect of a scale-aware convective parameterization scheme on the simulation of convective cellsrelated heavy rainfall in South Korea. Journal of Advances in Modeling Earth Systems 14, e2021MS002696.
| Crossref | Google Scholar |
Qian J (2008) Why precipitation is mostly concentrated over islands in the Maritime Continent. Journal of the Atmospheric Sciences 65, 1428-1441.
| Crossref | Google Scholar |
Rashid HA, Hirst AC (2017) Mechanisms of improved rainfall simulation over the Maritime Continent due to increased horizontal resolution in an AGCM. Climate Dynamics 49, 1747-1764.
| Crossref | Google Scholar |
Ridley JK, Blockley EW, Keen AB, Rae JGL, West AE, Schroeder D (2018) The sea ice model component of HadGEM3-GC3.1. Geoscientific Model Development 11, 713-723.
| Crossref | Google Scholar |
Smith RK, Montgomery MT (2016) The efficiency of diabatic heating and tropical cyclone intensification. Quarterly Journal of the Royal Meteorological Society 142, 2081-2086.
| Crossref | Google Scholar |
Stirling AJ, Stratton R (2012) Entrainment processes in the diurnal cycle of deep convection over land. Quarterly Journal of the Royal Meteorological Society 138(666), 1135-1149.
| Crossref | Google Scholar |
Stirling A, Whitall M, Lock A, et al. (2021) CoMorph overview: November 2021. (The Bureau of Meteorology) Available at http://www.bom.gov.au/research/workshop/2021/talks/D2S3_5_AlisonStirling.pdf
Storkey D, Blaker AT, Mathiot P, et al. (2018) UK global ocean GO6 and GO7: a traceable hierarchy of model resolutions. Geoscientific Model Development 11, 3187-3213.
| Crossref | Google Scholar |
Stratton RA, Stirling A (2011) Improving the diurnal cycle of convectionin GCMs. Quarterly Journal of the Royal Meteorological Society
| Crossref | Google Scholar |
Suzuki T (2009) Diurnal cycle of deep convection in super clusters embedded in the Madden–Julian Oscillation. Journal of Geophysical Research 114, D22102.
| Crossref | Google Scholar |
Van Weverberg K, Morcrette C, Boutle I, Furtado K, Field PR (2021) A bimodal diagnostic cloud fraction parameterization. Part I: motivating analysis and scheme description. Monthly Weather Review 149, 841-857.
| Crossref | Google Scholar |
Vincent CL, Lane TP (2016) Evolution of the diurnal precipitation cycle with the passage of a Madden–Julian Oscillation event through the Maritime Continent. Monthly Weather Review 144(5), 1983-2005.
| Crossref | Google Scholar |
Vincent CL, Lane TP (2017) A 10‐year austral summer climatology of observed and modeled intraseasonal, mesoscale, and diurnal variations over the Maritime Continent. Journal of Climate 30(10), 3807-3828.
| Crossref | Google Scholar |
Vincent CL, Lane TP (2018) Mesoscale variation in diabatic heating around Sumatra, and its modulation with the Madden–Julian Oscillation. Monthly Weather Review 146(8), 2599-2614.
| Crossref | Google Scholar |
Wedd R, Alves A, de Burgh-Day C, et al. (2022) ACCESS-S2: the upgraded Bureau of Meteorology multi-week to seasonal prediction system. Journal of Southern Hemisphere Earth Systems Science 72, 218-242.
| Crossref | Google Scholar |
Wei Y, Pu Z, Zhang C (2020) Diurnal cycle of precipitation over the Maritime Continent under modulation of MJO: perspectives from cloud‐permitting scale simulations. Journal of Geophysical Research: Atmospheres 125, e2020JD032529.
| Crossref | Google Scholar |
Wheeler MC, Hendon HH (2004) An all-season real-time multivariate MJO Index: development of an index for monitoring and prediction. Monthly Weather Review 132, 1917-1932.
| Crossref | Google Scholar |
Wheeler M, Kiladis G (1999) Convectively coupled equatorial waves: Analysis of clouds and temperature in the wavenumber–frequency domain. Journal of the Atmospheric Sciences 56, 374-399.
| Crossref | Google Scholar |
Wilson DR, Ballard SP (1999) A microphysically based precipitation scheme for the UK Meteorological Office Unified Model. Quarterly Journal of the Royal Meteorological Society 125, 1607-1636.
| Crossref | Google Scholar |
Yang G, Slingo J (2001) The diurnal cycle in the tropics. Monthly Weather Review 129, 784-801.
| Crossref | Google Scholar |
Zhu H, Hendon H (2015) Role of large scale moisture advection for simulation of the MJO with increased entrainment. Quarterly Journal of the Royal Meteorological Society 143, 2127-2136.
| Crossref | Google Scholar |
Zhu H, Hendon H, Jakob C (2009) Convection in a parameterized and super-parameterized model and its role in the representation of the MJO. Journal of the Atmospheric Sciences 66, 2796-2811.
| Crossref | Google Scholar |
Zhu H, Maloney E, Hendon H, Stratton R (2017) Effects of the changing heating profile associated with melting layers in a climate model. Quarterly Journal of the Royal Meteorological Society 143, 3110-3121.
| Crossref | Google Scholar |

