Seasonal climate summary southern hemisphere (autumn 2020): another coral bleaching event for the Great Barrier Reef without an active El Niño
Grant A. Smith A *
A *
A
Abstract
Austral autumn 2020, inclusive of the months March, April and May, followed a period of hot and dry conditions over summer that led to high bushfire risk in Australia due to a strong positive Indian Ocean Dipole. The autumn period was also warmer and drier than average overall with strong differences across the states. Notable exceptions were rainfall across New South Wales, Tasmania and Victoria, and rainfall associated with Tropical Cyclone Esther near the Pilbara and the Northern Territory Top End. Overall, Australia maximum mean temperatures were +0.65°C above average, with Western Australia in the top 10 recorded temperatures at +1.53°C above average. South-east Australian rainfall led to flooding and extinguished the remaining fires of the 2019–2020 bushfire season. The rainfall did not reach coastal regions of south-east Queensland where severe rainfall deficiencies persisted. Autumn 2020 was classified as neutral in terms of the El Niño–Southern Oscillation (ENSO) and marks the second time that the Great Barrier Reef has experienced mass coral bleaching due to elevated ocean temperatures in an ENSO neutral year. Elevated sea surface temperatures in the Coral Sea are largely attributed to a general warming trend in the region. Antarctic sea ice extent went from below average to close to average by the end of May 2020, aided by a positive Southern Annular Mode. At the end of autumn 2020, there were early signs of a La Niña event building, with negative temperature anomalies in the subsurface and cooling of sea surface temperatures along equatorial Pacific.
Keywords: Antarctic sea ice, bushfire, coral bleaching, Great Barrier Reef, rainfall, seasonal climate summary, surface temperature, tropical cyclone.
1.Introduction
At the conclusion of the 2015–2016 El Niño, El Niño–Southern Oscillation (ENSO) neutral conditions were maintained for the period from mid-2016 to autumn 2020 according to The Bureau of Meteorology ENSO status. However, the US National Oceanic and Atmospheric Administration (NOAA) had declared a weak El Niño in the 2018–2019 austral summer period.
The year prior to 2020 was both the driest and warmest year for Australia on record, with mean temperature anomaly at 1.52°C and maximum temperature anomaly reaching 2.09°C. A particularly strong positive Indian Ocean Dipole (IOD) event was the primary driver of these dry conditions, with secondary contributions later in the year from a persistent negative phase of the Southern Annular Mode (SAM). The hot and dry conditions and also strong winds in December fed into the Forest Fire Danger Index, a measure of fire weather risk, leading to values that were highest on record (Bureau of Meteorology 2020). Weather patterns started to change in early January 2020 as the IOD and SAM moved back towards neutral and dry conditions eased.
This summary reviews the climate patterns for austral autumn 2020 and their impacts, with particular attention given to the Australasian and Pacific regions. Autumn of 2020 exhibited strong differences in temperature and rainfall patterns between south-eastern states and the remainder of the country. Sea surface temperature (SST) anomalies also varied between northern and southern regions, reaching levels in the Great Barrier Reef (GBR) that led to coral bleaching. The main sources of information for this report are analyses prepared by The Bureau of Meteorology using data sourced from a range of centres and datasets.
2.Pacific and Indian Basin climate indices
2.1. Southern Oscillation Index
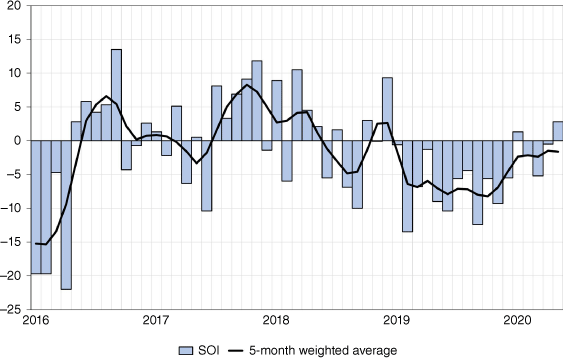
The Troup Southern Oscillation Index (SOI) for the period January 2016 to May 2020 is shown in Fig. 1 (Troup 1965), together with a 5-month weighted moving average to smooth out volatility (Wright 1989). Following the 2015–2016 El Niño, the SOI was positive for most months up to 2019 when it turned consistently negative until autumn 2020 with only 1 month weakly positive. The SOI values for March, April and May 2020 were respectively −5.2, −0.5 and +2.8, giving a neutral seasonal average of −1.0. The 5-month weighted moving average finished negative at −1.6 at the end of autumn. The 5-month weighted moving average was trending from negative towards neutral for the autumn period.
Southern Oscillation Index (SOI) from January 2016 to May 2020, together with a 5-month binomially weighted moving average. The Troup SOI is 10 times the standardised monthly anomaly of the difference in mean-sea-level pressure (MSLP) between Tahiti and Darwin. The calculation is based on a 60-year climatology (1933–1992).
2.2. Composite monthly ENSO index (5VAR) and MEI
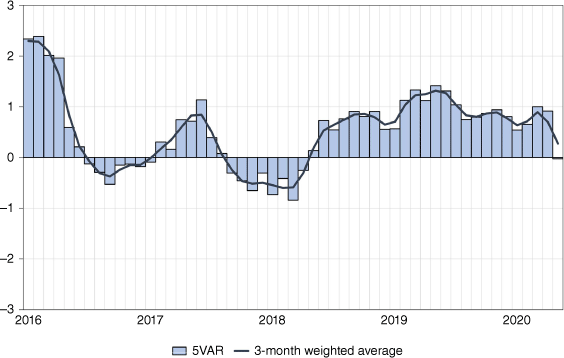
The 5VAR is a composite monthly ENSO index developed by The Bureau of Meteorology, calculated as the standardised amplitude of the first principal component of monthly Darwin and Tahiti MSLP and monthly NINO3, NINO3.4 and NINO4 SSTs from the National Centers for Environment Prediction (NCEP), obtained from ftp://ftp.cpc.ncep.noaa.gov/wd52dg/data/indices/sstoi.indices (Kuleshov et al. 2009). Persistent positive or negative 5VAR values in excess of one standard deviation are typically associated with El Niño or La Niña events respectively. The monthly 5VAR values for the period January 2016 to May 2020 are shown in Fig. 2, along with the 3-month moving average. The autumn period of March, April and May exhibited mildly positive values of +1.00, +0.92 and −0.03 respectively. The 5VAR had been skirting near to the one standard deviation threshold for an El Niño event since mid-2018, being consistently above one for a 6-month period in early 2019 when NOAA issued an El Niño Advisory (National Centers for Environmental Prediction 2019).
5VAR composite standardised monthly ENSO index from January 2016 to May 2020 together with a weighted 3-month moving average. The principal component analysis and standardisation of this ENSO index is performed over the period 1950–1999.
The Multivariate ENSO Index (MEI, v2), produced by the Physical Sciences Division of the Earth Systems Research Laboratory (formerly known as the US Climate Diagnostics Center), is a standardised anomaly derived from a number of atmospheric and oceanic parameters calculated as a 2-month mean (Wolter and Timlin 1993, 1998). The 2020 February–March (0.15), March–April (−0.11) and April–May (−0.24) MEI values were decreasing over the autumn period, similar to the 5VAR, although not reaching La Niña values that are usually close to –1 or below.
2.3. Tropical convection and rainfall
Outgoing long-wave radiation (OLR) is a good proxy for tropical convection and rainfall. Decreased OLR usually indicates increased convection and enhanced associated cloudiness and rainfall, and increased OLR usually indicates decreased convection. During El Niño, OLR is often decreased near the Date Line, indicating increased convection (and rainfall) as the Walker Circulation weakens and the warm pool and associated tropical rainfall is displaced to the east. The reverse is true during La Niña events.
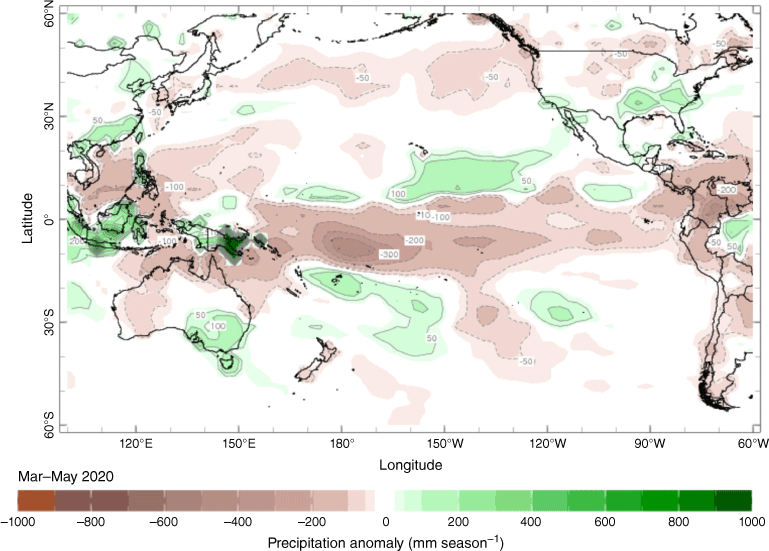
Standardised monthly anomalies of OLR are computed for an equatorial region from 5°S to 5°N and 160°E to 160°W by NOAA’s Climate Prediction Centre (obtained from http://www.cpc.ncep.noaa.gov/data/indices/olr). Monthly values for autumn were +0.1, +0.7 and +0.7 W m−2 for March, April and May 2020 respectively, indicating that convection was suppressed in that area during autumn. A very high precipitation anomaly can be seen over Papua New Guinea in Fig. 3, which led to severe flooding affecting ~60,000 people (FloodList 2020). Other areas of notable positive precipitation anomalies were south-east Australia, Malaysia, Indonesia and an area surrounding Fiji. Negative precipitation anomalies are present across the tropical Pacific, parts of the Maritime Continent and northern Australia, and north-west South America.
Precipitation anomalies for autumn 2020 (mm) for the Pacific region. Base period is 1979–1995, from https://iridl.ldeo.columbia.edu/maproom/Global/Precipitation/Seasonal.html.
2.4. Indian Ocean Dipole
The Indian Ocean Dipole (IOD) is a climate driver that significantly influences rainfall across southern Australia during winter and spring. It is described by an oscillating pattern of SST anomalies across the equatorial Indian Ocean. A positive phase of the IOD is characterised by cooler than usual water near Indonesia and warmer than usual water in the tropical western Indian Ocean. A positive IOD event is often associated with below average rainfall in the eastern Indian Ocean, and also in central and south-eastern Australia in winter and spring (Risbey et al. 2009), and is more likely to occur alongside El Niño. The opposite is true for a negative IOD phase.
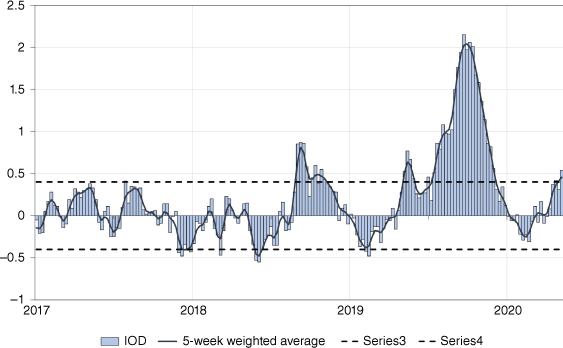
The IOD events can be represented by the Dipole Mode Index (DMI) (Saji et al. 1999). The DMI is the difference in SST anomalies between the Western Tropical Indian Ocean (WTIO) node centred on the equator off the coast of Somalia (50–70°E and 10°S–10°N) and the south-eastern Tropical Indian Ocean (SETIO) node near Sumatra (90–110°E and 10–0°S). Sustained values of DMI below −0.4°C indicate a negative IOD event, while sustained values above +0.4°C indicate a positive IOD event. An IOD event typically starts from May or June and lasts to c. November.
Following a strong positive IOD event that dominated austral winter and spring of 2019, the IOD was mostly weakly positive in autumn 2020. The IOD weekly value breached the +0.4°C threshold for a positive IOD event in two of the weeks in May at +0.42 and +0.54°C (Fig. 4), which likely limited the supply of moisture to the atmosphere and contributed to the dry conditions experienced in western and central Australia.
3.Madden–Julian Oscillation
The Madden–Julian Oscillation (MJO) can be characterised as a burst of tropical cloud and rainfall that develops over the Indian Ocean and propagates eastwards over to the Pacific Ocean, and sometimes around the entire global equator (Madden and Julian 1971, 1972, 1994). The MJO typically takes 30–60 days to cross from the eastern Indian Ocean to the central Pacific, with six to twelve events per year.
The location of the convective phase of the MJO can be detected by looking for large-scale negative OLR anomalies near the equator, and is objectively monitored by the Real-time Multivariate MJO (RMM) index as described in Wheeler and Hendon (2004). Impacts of the MJO can be felt in many regions of the globe, including outside the tropics (Donald et al. 2004), and its frequency and strength vary from year to year (Wheeler and Hendon 2004). During El Niño years, MJO convection anomalies tend to propagate further eastward over the warmer waters of the central and eastern Pacific Ocean, but the influence of ENSO on the MJO in other locations is either weaker or not well understood (Hendon et al. 1999).
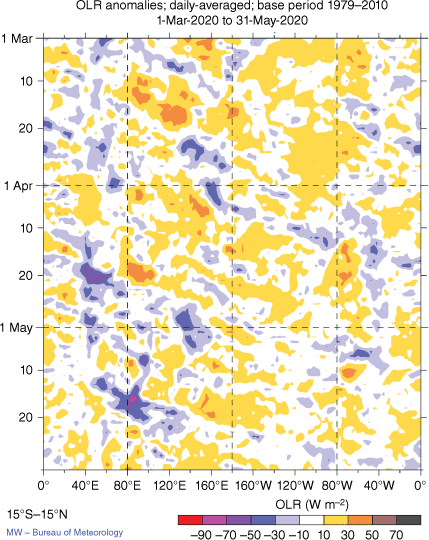
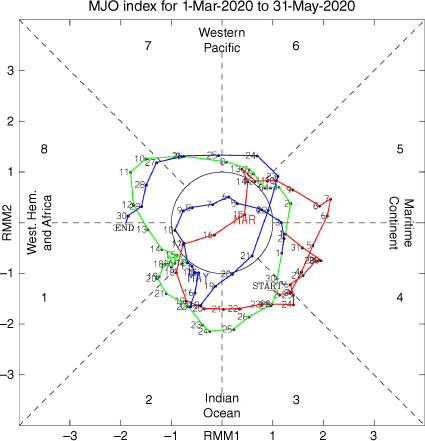
The phase–space diagram of the RMM for autumn 2020 is shown in Fig. 5, and the evolution of tropical convection anomalies along the equator with time is shown in Fig. 6. The MJO was active for all of the middle autumn month of April, completing a full cycle in 1 month. It was active over the Maritime Continent in early April and likely contributed to cyclogenesis of Tropical Cyclone Harold that formed near the Solomon Islands. However, both March and May show that complete cycles occurred over less than 30 days, indicating that the index was dominated by atmospheric Kelvin waves that propagate eastward at a faster rate than the MJO. Proof of this can further be observed in the OLR anomalies in Fig. 6, where negative OLR patterns punctuate the anomalies more regularly west of the dateline in March and May compared to April (Wheeler and Kiladis 1999). Atmospheric Kelvin waves contribute to the generation and progression of the MJO.
Phase–space representation of the MJO index for autumn 2020. Daily values are shown with March in red, April in green and May in blue. The eight phases of the MJO and the corresponding (approximate) locations of the near-equatorial enhanced convective activity are labelled (Wheeler and Hendon 2004).
4.Oceanic patterns
4.1. Sea surface temperatures (SSTs)
The SST anomalies for autumn 2020 from Optimum Interpolation SST (Reynolds et al. 2002) are shown in Fig. 7. The majority of the tropical oceans had warm anomalies greater than 0.5°C, with regions in the Indian Ocean, tropical Atlantic, Western Pacific as well as south central–north-east Pacific with 1–2°C above average.
Global sea surface temperature anomalies (SSTAs) for austral autumn 2020 (°C). Base period is 1981–2010.
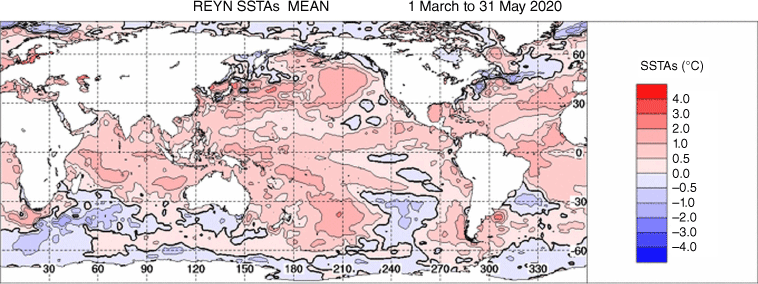
The warm anomalies in the extratropical north and south Pacific and in the western warm pool are consistent with a negative phase of the Pacific Decadal Oscillation that emerged from its previous negative phase near the start of 2020. Most of the northern Australian waters were warmer than average, with cool to neutral anomalies along the southern coastlines and southern half off the coast of Western Australia.
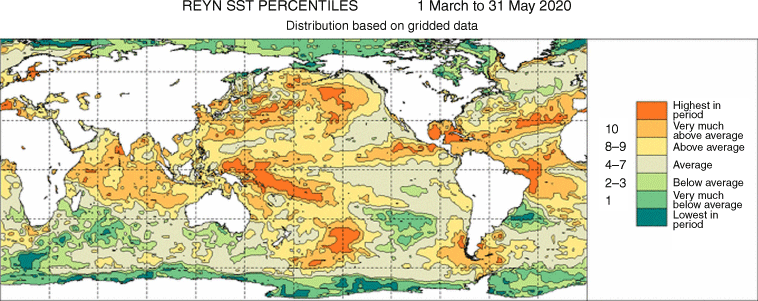
The percentile rankings in terms of deciles are shown in Fig. 8. The darkest green indicates the lowest SST on record since 1981 (of which there was very little occurrence across the globe), and dark orange is the highest on record. There was a significant region of highest on record in the western Pacific Warm Pool stretching from the northern waters of Papua New Guinea, across the Solomon Islands to Samoa.
Other regions of highest on record for autumn 2020 in the southern hemisphere can be seen off the far east coast of New Zealand, around the tropical Atlantic, North West Shelf of Australia, southern Indian Ocean and off the coast of South Africa.
Highest on record temperatures surrounding Mexico and Caribbean were associated with terrestrial heatwave conditions in the region (World Meteorological Organization 2021). Significantly warm waters spanning from the Solomon Islands to Fiji fuelled and strengthened Tropical Cyclone Harold, which travelled from the Solomon Islands to Fiji and beyond in April 2020, reaching category 5 and was one of the strongest storms ever recorded in the South Pacific (World Meteorological Organization 2021).
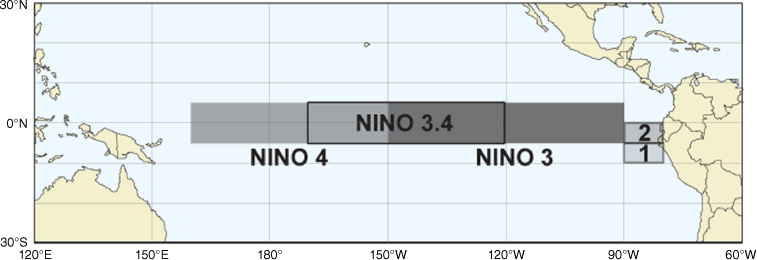
The NINO indices commenced autumn 2020 warmer than average, with NINO4 particularly warm at +0.73°C. The positive anomalies mostly followed a cooling trend over the subsequent autumn months, with three of the four indices finishing with negative anomalies. See Fig. 9 for locations of the NINO boxes listed in Table 1.
| Month | NINO1+2 anomaly (°C) | NINO3 anomaly (°C) | NINO4 anomaly (°C) | NINO3.4 anomaly (°C) | |
|---|---|---|---|---|---|
| March | +0.44 | +0.17 | +0.73 | +0.46 | |
| April | +0.28 | +0.39 | +0.53 | +0.41 | |
| May | –0.28 | −0.13 | +0.04 | −0.21 |
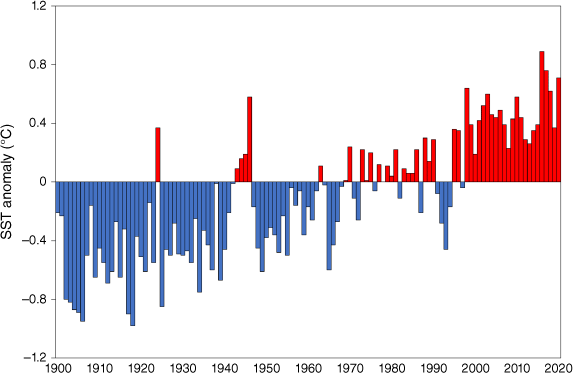
The term coral bleaching refers to the whitening of corals, indicating that the coral has been stressed by a significant change to its preferred environmental conditions that can lead to mortality if adverse conditions persist. In late February and March 2020, much of the GBR experienced coral bleaching (Nolan et al. 2021). This was the third mass coral bleaching event in 5 years caused by elevated SSTs, with autumn 2020 temperatures being the third highest on record behind 2016 and 2017 as shown in Fig. 10 (Huang et al. 2017).
Autumn sea surface temperature (SST) anomalies in the Coral Sea for the years 1900–2020 (ERSSTv5). Averaging region for the Coral Sea spans latitudes 4–26°S and longitudes 142–174°E.
This event also affected the southern GBR, which had escaped bleaching during the most recent two bleaching events in 2016 (Hughes and Kerry 2017; Hughes et al. 2017) and 2017 (Hughes et al. 2019; Smith 2019). Degree heating weeks (DHW) are a specific coral bleaching metric that accumulates the SST anomaly over the maximum monthly mean (MMM) for a period of 12 weeks, shown for the southern third of the GBR in Fig. 11, which includes reef regions spanning from Hervey Bay to Mackay. The DHW is shown to start breaching the MMM threshold from early January and peaks in March 2020, reaching alert level 2.
The sea surface temperature (SST) and degree heating weeks (DHWs) for the southern GBR for 2019 and 2020. The southern GBR region spans from Hervey Bay to Mackay. Source: NOAA Coral Reef Watch.
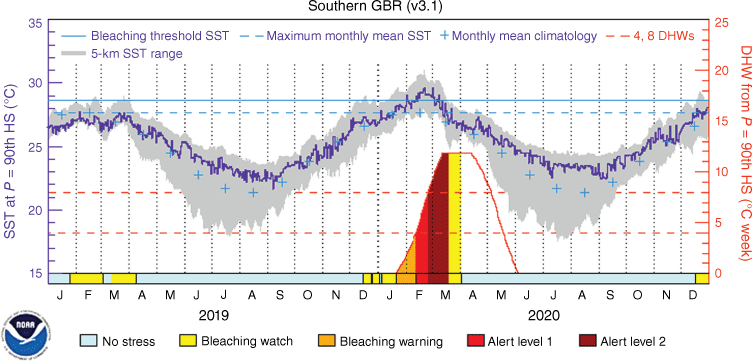
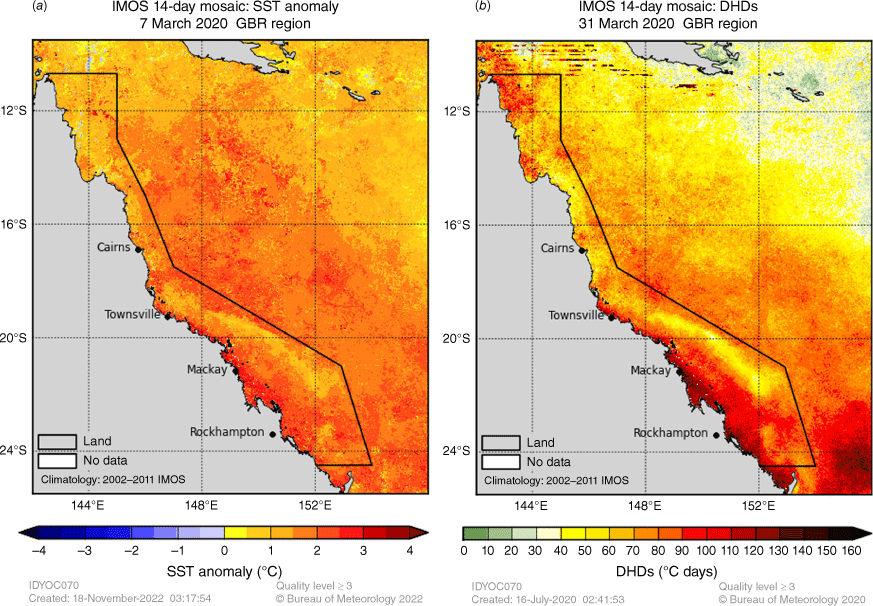
Previous mass coral bleaching events in 1998 and 2016 were largely attributed to their respective El Niño events (Great Barrier Reef Marine Park Authority 2017). However, in the years since these events, both autumn 2017 and 2020 also experienced bleaching events and were classified as ENSO neutral. The driver for the 2020 event was attributed to global warming, the positive IOD event leading up to summer of 2019–2020, and local weather patterns. The positive warming trend in the Coral Sea is evident across the SST anomalies in Fig. 10, supported by findings of the Intergovernmental Panel on Climate Change on increases in global marine heatwave frequency having doubled from 1982 to 2016 (Pörtner et al. 2019). The strong positive IOD of late 2019 delayed the onset of the Australian monsoon, with a northward shift in weather systems over Australia in early to mid-summer. There was less cloud than usual over the GBR as shown in OLR anomalies in Fig. 3. There was also a below average number of summer storms, which would provide mixing with cooler waters below. The peak cyclone month of February had no cyclones in the region, with the first of the summer being Tropical Cyclone Gretel, which was weak when it crossed the GBR in mid-March. The Degree Heating Day (DHD) metric that describes total thermal stress over the 2019–2020 austral summer period is shown in Fig. 12b. Areas of highest stress are shown to be southern inshore regions of the GBR.
The SST anomaly 14-day mosaics over the Coral Sea and in the GBR marine park. (a) Approximate peak of the SST anomaly in March 2020. (b) Degree heating days (DHDs) since 1 December, calculated by summing positive 14-day mosaic anomalies. The mosaics are created by aggregating the satellite coverage over the previous 14-day period, giving preference to the most recent observations.
4.2. Equatorial Pacific subsurface patterns
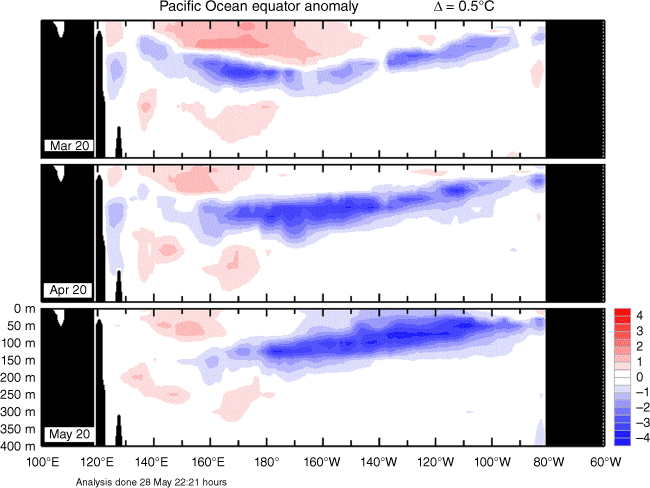
Cross-sectional monthly subsurface temperature anomalies along the equator, encompassing latitudes 2°S to 2°N, are shown in Fig. 13. The first month of autumn 2020 showed the building of cool subsurface anomalies across most of the equatorial Pacific with a patch of warm anomalies closer to the surface in the west that weakened as the autumn months progressed. By the end of autumn 2020, the cool subsurface anomaly was the dominant feature in the central and eastern Pacific, dropping just below −3°C in some parts, and was the first indicator of what would becoming a triple-dip La Niña lasting from 2020 to 2023.
Three-month sequence from March to May 2020 of vertical sea subsurface temperature anomalies at the equator for the Pacific Ocean. Red shading indicates positive (warm) anomalies and blue shading indicates negative (cool) anomalies. The contour interval is 0.5°C, from http://www.bom.gov.au/oceanography/oceantemp/pastanal.shtml. Details on the calculation of the baseline climatology for subsurface temperatures are available at https://www.pmel.noaa.gov/tao/clim/clim-info.html.
The equatorial thermocline is a region below the surface where the temperature gradient between warm near-surface water and cold deep-ocean waters is greatest. The 20°C isotherm depth is generally located close to this equatorial thermocline. Therefore, measurements of the 20°C isotherm make a good proxy for the thermocline depth. Positive anomalies correspond to a deeper-than-average thermocline and vice versa, where shifts in the depth of the 20°C isotherm provide an indication of subsequent temperature changes in SSTs; a deeper thermocline results in less cold water available for upwelling, and therefore warming of surface temperatures. The time–longitude (Hovmöller) diagram for the 20°C isotherm depth anomaly along the equator for January 2018 to May 2020, obtained from the TAO Project Office, is shown in Fig. 14.
Time–longitude section of the monthly anomalous depth of the 20°C isotherm at the equator (2°S to 2°N) for March–May 2020. From the TAO Project Office: http://www.pmel.noaa.gov/tao/jsdisplay.
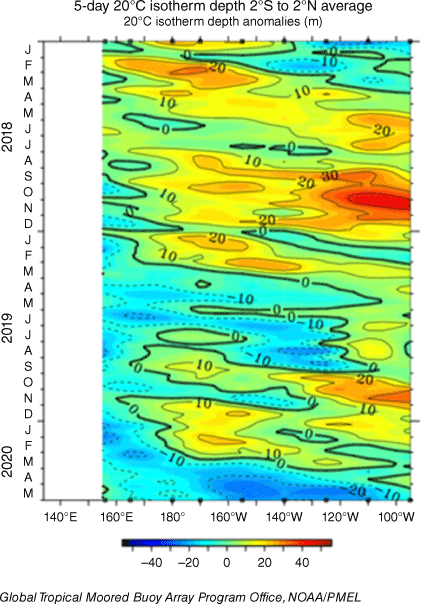
The 20°C isotherm was close to its average position at the start of autumn 2020 apart from in the far west Pacific. By the end of autumn 2020, the 20°C isotherm was above its average position across the Pacific, most prominently in the central to eastern Pacific region.
4.3. Sea level
Sea level anomalies for autumn 2020 are shown in Fig. 15 and reference a datum of mean sea surface height from 1993 to 2020 (climatology period based on satellite altimeter era, see Watson et al. 2015). The southern Pacific Ocean, Indian Ocean and southern Atlantic had mostly positive sea level anomalies. Around Australia, anomalies were also positive, with the highest anomalies along the east coast, especially near to New South Wales.
Sea level anomalies are a combination of data from TOPEX/Poseidon, Jason-1, Jason-2 and Jason-3 satellites. Inverse barometer effect not removed; seasonal signal not removed; global trend not removed; glacial isostatic adjustment removed. Data obtained from CSIRO Sea Level, Waves and Coastal Extremes: http://www.cmar.csiro.au/sealevel/sl_data_cmar.html.

5.Atmospheric patterns
5.1. Surface analysis
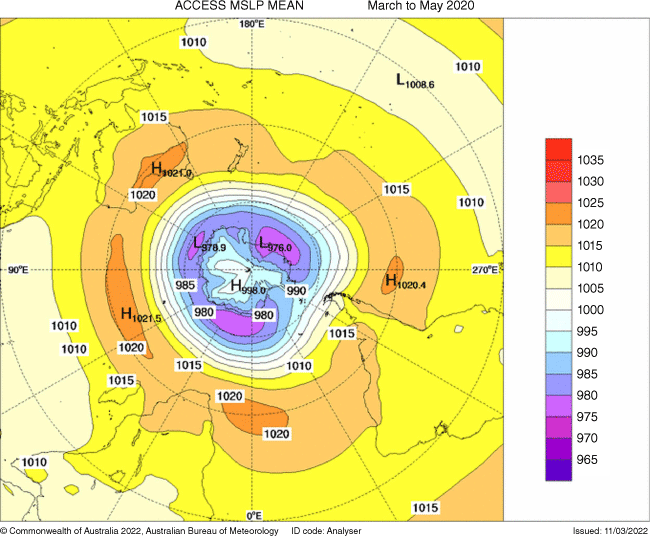
The mean sea level pressure (MSLP) pattern for autumn 2020 is shown in Fig. 16, computed using data from the 00:00 hours UTC daily analyses of The Bureau of Meteorology’s Australian Community Climate and Earth System Simulator (ACCESS) model (Puri et al. 2013). The MSLP anomalies are shown in Fig. 17, relative to the 1979–2000 climatology obtained from NCEP II Reanalysis data (Kanamitsu et al. 2002).
Autumn 2020 mean sea level pressure (MSLP) anomalies (hPa), from 1979–2000 climatology. The MSLP anomaly field is not shown over areas of elevated topography (grey shading) as the extrapolation to sea level can result in unrealistic structures.
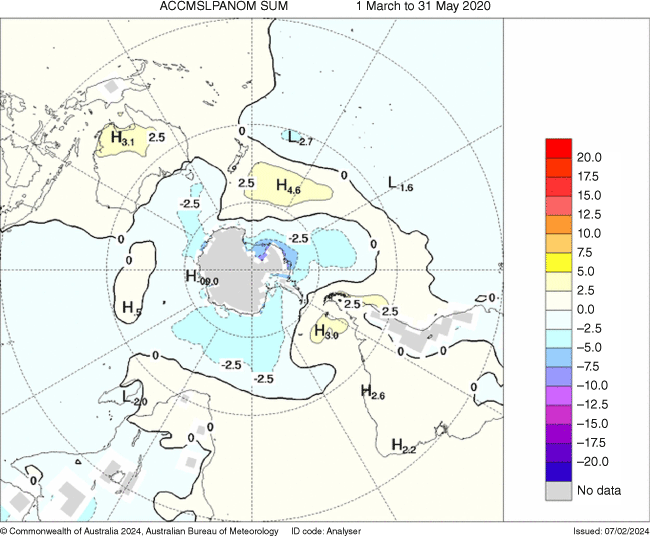
The subtropical ridge formed a band of high pressure situated below 30°S, extending across the Australian continent and Indian Ocean with maximum pressure of 1021.5 hPa. Anomalies show that the high pressure band in the Indian Ocean was higher than average, near Australia it was close to average and over the south Pacific it was below average. There is a notable lack of strong MSLP anomalies at the mid-latitudes. A stronger than average zonal wave number 3 pattern is evident, most likely driven by warmer than usual SSTs in the western warm pool region (Goyal et al. 2021).
5.2. Mid-tropospheric analysis
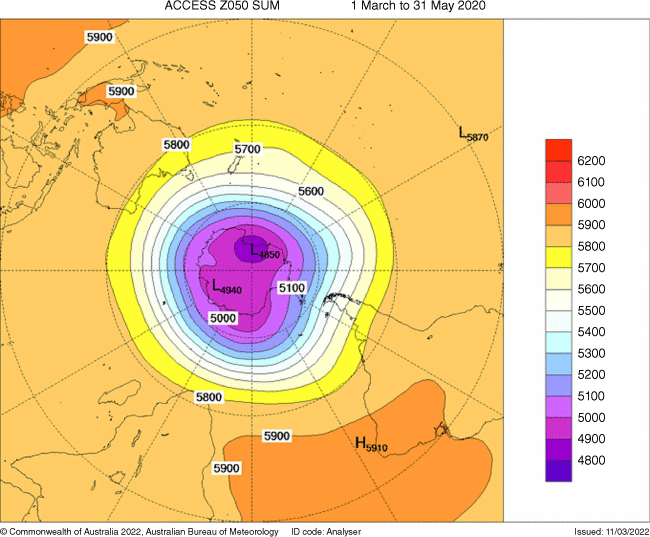
The 500-hPa geopotential height, an indicator of the steering of surface synoptic systems across the southern hemisphere, is shown for autumn 2020 in Fig. 18, with associated anomalies shown in Fig. 19. The anomaly patterns show average geopotential height across most of mainland Australia, with positive anomalies across Far North Queensland and the Top End of the Northern Territory at +33 mean geopotential metres (gpm) and a negative anomaly across Victoria and Tasmania.
Autumn 2020 500-hPa mean geopotential metres (gpm) height anomalies, from a 1979 to 2000 climatology.
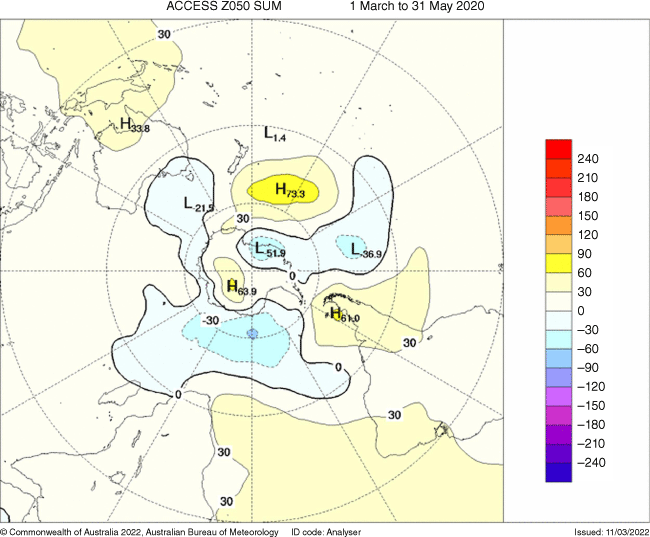
The most significant anomaly was the positive anomaly of 73.3 gpm east of New Zealand, aligning with the position of a positive MSLP anomaly (Fig. 17). This feature would have slowed low-pressure system progression, with systems persisting for longer over south-east Australia and contributing to cooler temperatures and increased rainfall in this region.
5.3. Southern Annular Mode
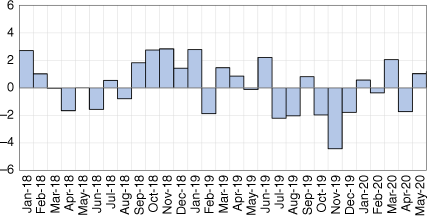
The Southern Annular Mode (SAM) is a mode of variability characterised by the north–south oscillation of westerly winds that circle Antarctica. An index of SAM is the zonal pressure difference between the latitudes 40 and 65°S (Marshall 2003). During a positive SAM phase, westerly winds contract closer to Antarctica, and a negative phase moves westerly winds towards the equator. Fig. 20 shows the SAM index as described in Marshall (2003) from 2018 to the end of autumn 2020 (data obtained from https://legacy.bas.ac.uk/met/gjma/sam.html). The SAM was positive towards the end of 2018, then becoming negative for the second half of 2019. During autumn 2020 SAM was positive in 2 of the 3 months of the season, especially in March, which would have contributed to the increased rainfall in the country’s south-east (Hendon et al. 2007).
6.Winds
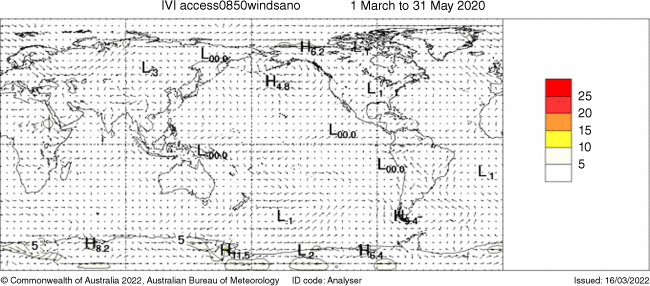
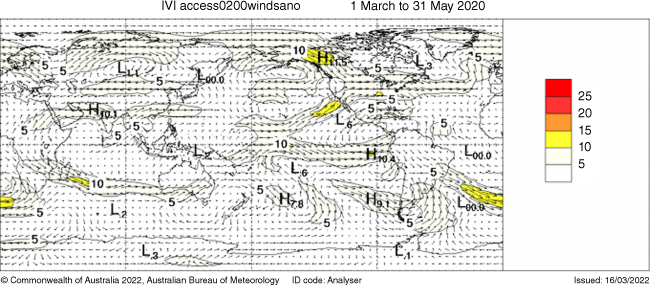
Low-level (850 hPa) and upper-level (200 hPa) wind anomalies are shown in Fig. 21 and 22 respectively. Isotach contours are at 5 m s−1 intervals. The low-level winds show very little anomalous activity across the globe. The upper-level winds polar and subtropical jet streams converge over mainland USA. In the southern hemisphere, subtropical jet winds span from Brazil to South Africa, and then from Madagascar across the Indian Ocean to mainland Australia.
In Australia, low-level cyclonic winds can be seen over south-east Australia associated with dominant low pressure in the region (Fig. 17). The subtropical jet over Australia would have contributed to the development of the low pressure systems from increased baroclinic instability.
7.Australian region
7.1. Rainfall
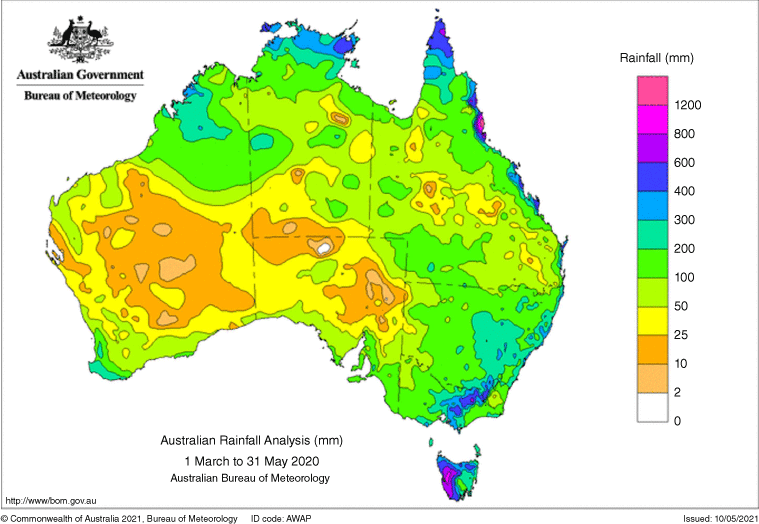
A rainfall summary for Australia nationwide and each state and territory is listed in Table 2. Rainfall was below average in autumn 2020 over significant portions of Australia with Queensland, Northern Territory and Western Australia slightly more than 30% below average. Rainfall was above average in Victoria, New South Wales and Tasmania due to a number of cold fronts crossing these states during autumn. Flooding occurred in the Lake Eyre and Murray–Darling Basins in early March due to the already elevated levels from heavy rainfall in February (Fig. 23).
| Region | Highest seasonal total (mm) | Lowest seasonal total (mm) | Highest daily total (mm) | Area-averaged total (mm) | Rank of area-averaged rainfall | Difference from mean (%) | |
|---|---|---|---|---|---|---|---|
| Australia | 2617.6 at Bellenden Ker Top Station (QLD) | Zero at several locations | 427.0 at Bellenden Ker Top Station (QLD) on 20 May | 95.5 | 38 | 22% below mean | |
| Queensland | 2617.6 at Bellenden Ker Top Station | Zero at several locations | 427.0 at Bellenden Ker Top Station on 20 May | 113.1 | 41 | 31% below mean | |
| New South Wales | 718.8 at Careys Peak (Barrington Tops) | Zero at Kangaroo Valley (Main Road) | 181.0 at Oberon (Jenolan Caves) on 21 March | 168.1 | 100 | 13% above mean | |
| Victoria | 698.5 at Whitlands (Burder’s Lane) | Zero at several locations | 159.2 at Whitlands (Burder’s Lane) on 30 April | 198.8 | 104 | 25% above mean | |
| Tasmania | 1219.2 at Mount Read | Zero at Fortescue Bay, Brea, Creek (Stroud) | 130.0 at Little Swanport (Wineglass Cottage) on 3 April | 411.9 | 107 | 23% above mean | |
| South Australia | 313.1 at Piccadilly (Woodhouse) | Zero at Whyalla (Mount Young) | 65.5 at Innamincka Station on 4 March | 46.5 | 69 | 20% below mean | |
| Western Australia | 335.0 at Illalangi | Zero at several locations | 223.0 at Laurel Downs on 2 March | 61.8 | 30 | 32% below mean | |
| Northern Territory | 534.6 at Pirlangimpi Airport | Zero at several locations | 206.0 at Rockhampton Downs on 3 March | 95.0 | 42 | 33.7% below mean (=143.2) |
The ranking in the 2nd last column goes from 1 (lowest) to 121 (highest) and is calculated over the years 1900–2020 inclusive.
Rainfall deciles indicate where rainfall amounts rank in terms of the 1900–2020 record, which are allotted into 10 percentile bins (Fig. 24). Above average to very much above average rainfall was experienced in Tasmania, central to northern Victoria, most of New South Wales and across the Poeppel Corner where the Northern Territory, Queensland and South Australia borders meet. The rains in the south-east of Australia extinguished the last remaining 2019–2020 bushfires that had been present since September 2019. Many sites in New South Wales, Victoria and Tasmania had their highest autumn rainfall for at least 20 years, with highest autumn rainfall on record at some short-period sites.
Autumn 2020 rainfall deciles for Australia: decile ranges based on grid-point values over all autumns of 1900–2020.
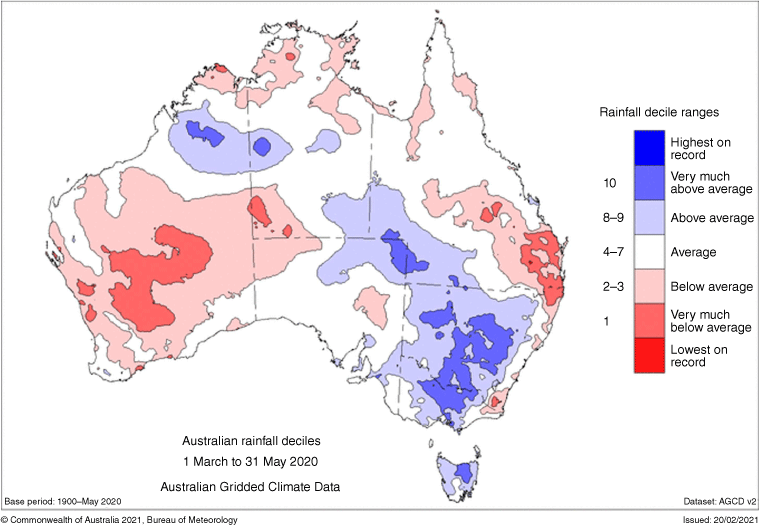
A section of Western Australia, Northern Territory and Queensland experienced above average to very much above average rainfall spanning from the Kimberleys into the central Northern Territory and Queensland, which was related to the passage of category 1 Tropical Cyclone Esther in early March. The highest daily rainfalls in Western Australia and the Northern Territory for autumn 2020 were from Tropical Cyclone Esther: Laurel Downs in Western Australia and Rockhampton Downs in the Northern Territory.
Below average to very much below average rainfall was experienced across much of Western Australia, the Top End of the Northern Territory, around Brisbane and small patches along the coast of New South Wales on the east side of the Great Dividing Range.
7.2. Rainfall deficiencies
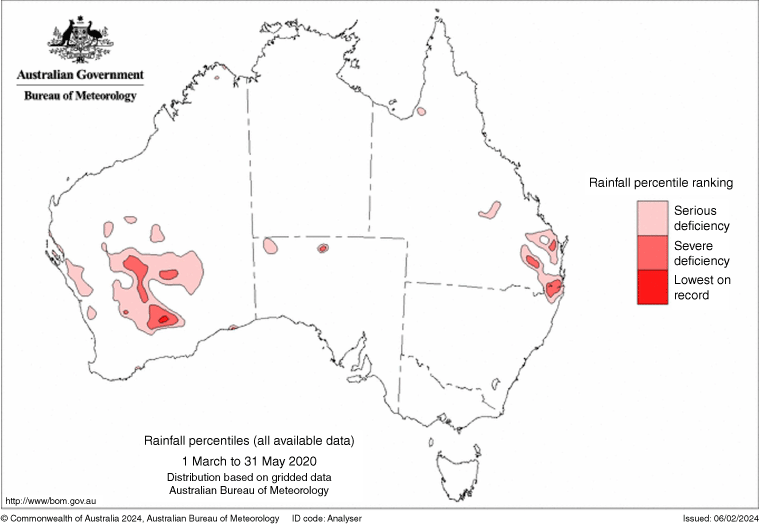
Rainfall deficiencies are used to indicate areas of drought, and are assessed by determining regions in the lowest 10% of records (serious deficiency), lowest 5% (severe deficiency) and lowest on record. Deficiencies for autumn 2020 are shown in Fig. 25. The most prominent regions of rainfall deficiency were in Western Australia and Queensland. In Western Australia, there were patches of severe deficiency in the Midwest and Goldfields–Esperance regions, with areas of serious deficiency stretching into the Wheatbelt and along the coast up to Shark Bay. In Queensland, there were serious to severe deficiencies in the states south-east corner in the Darling Downs, Wide Bay–Burnett and Brisbane and Moreton regions.
7.3. Temperature
A subset of the full temperature network was used to calculate the spatial averages and rankings for Australia, and all states and territories shown in Table 3 (maximum temperature) and Table 4 (minimum temperature). This dataset is known as ACORN-SAT (see http://www.bom.gov.au/climate/change/acorn-sat/ for details) and extends from 1910 to the present. The mean maximum temperature for autumn 2020 was +0.63°C above average for Australia, with national mean minimum temperatures +0.47°C above average. Western Australia stood out as the most significant contributor to the above average temperatures, with a mean maximum temperature anomaly of +1.53°C giving the state a rank of equal 7th hottest autumn on record since 1910. Conversely, New South Wales observed a mean maximum temperature anomaly of −0.87°C, coming in at 15th lowest autumn on record, and lowest on record since 1995.
| Region | Highest seasonal mean maximum (°C) | Lowest seasonal mean maximum (°C) | Highest daily maximum temperature (°C) | Lowest daily maximum temperature (°C) | Area-averaged temperature anomaly (°C) | Rank of area-averaged temperature anomaly | |
|---|---|---|---|---|---|---|---|
| Australia | 36.9 at Marble Bar (WA) | 7.8 at Mount Read (TAS) | 45.1 at Onslow Airport (WA) on 1 March | −2.7 at Thredbo AWS (NSW) on 1 May | 0.63 | 88 | |
| Queensland | 34.1 at Julia Creek Airport | 21.3 at Applethorpe | 42.8 at Birdsville Airport on 1 March | 8.7 at Applethorpe on 22 May | 0.5 | 71 | |
| New South Wales | 26.3 at Tibooburra Airport | 8.4 at Thredbo AWS | 39.6 at Sydney Airport Amo on 2 March | −2.7 at Thredbo AWS on 1 May | −0.87 | 15 | |
| Victoria | 22.7 at Mildura Airport | 8.3 at Mount Buller | 37.5 at Walpeup Research on 19 March | −2.4 at Mount Hotham on 1 May | −0.72 | 31 | |
| Tasmania | 18.2 at Friendly Beaches | 7.8 at Mount Read | 28.9 at Fingal (Legge Street) on 12 March | 0.3 at Kunanyi (Mount Wellington Pinnacle) on 17 April | −0.83 | 29 | |
| South Australia | 28.6 at Oodnadatta Airport | 16.0 at Mount Lofty | 40.9 at Moomba Airport on 1 March | 8.2 at Mount Lofty on 24 May | 0.11 | 62 | |
| Western Australia | 36.9 at Marble Bar | 21.2 at Shannon | 45.1 at Onslow Airport on 1 March | 10.9 at Manjimup on 25 May | 1.53 | 104 | |
| Northern Territory | 35.8 at Bradshaw | 29.1 at Alice Springs Airport | 42.4 at Walungurru Airport on 13 March | 14.6 at Tennant Creek Airport on 22 May | 0.73 | 85 |
The ranking in the last column goes from 1 (lowest) to 111 (highest) and is calculated over the years 1910–2020 inclusive. As the anomaly averages in the tables are only retained to two decimal places, tied rankings are possible.
| Region | Highest seasonal mean minimum (°C) | Lowest seasonal mean minimum (°C) | Highest daily minimum temperature (°C) | Lowest daily minimum temperature (°C) | Area-averaged temperature anomaly (°C) | Rank of area-averaged temperature anomaly | |
|---|---|---|---|---|---|---|---|
| Australia | 27.8 at Browse Island (WA) | 1.2 at Thredbo AWS (NSW) | 31.9 at Telfer Aero (WA) on 18 March | −7.9 at Liawenee (TAS) on 25 May | 0.47 | 92 | |
| Queensland | 26.0 at Coconut Island | 9.3 at Applethorpe | 30.8 at Ballera Gas Field on 2 March | −2.0 at Applethorpe on 4 May | 0.51 | 84 | |
| New South Wales | 17.6 at Byron Bay (Cape Byron AWS) | 1.2 at Thredbo AWS | 25.3 at Lightning Ridge Visitor Information Cent on 4 March | −7.3 at Perisher Valley AWS on 15 May | 0.08 | 72 | |
| Victoria | 12.8 at Wilsons Promontory Lighthouse | 2.5 at Falls Creek | 22.1 at Aireys Inlet 13 March | −5.9 at Mount Hotham on 10 May | −0.12 | 77 | |
| Tasmania | 12.2 at Swan Island | 2.1 at Kunanyi (Mount Wellington Pinnacle) | 18.4 at Friendly Beaches 13 March | −7.9 at Liawenee on 25 May | 0.28 | 87 | |
| South Australia | 15.0 at Moomba Airport | 8.2 at Keith (Munkora) | 26.8 at Oodnadatta Airport 12 March | −3.3 at Gluepot Reserve (Gluepot) on 16 May | −0.03 | 69 | |
| Western Australia | 27.8 at Browse Island | 9.7 at Wandering | 31.9 at Telfer Aero on 18 March | −1.5 at Eyre on 22 May | 0.86 | 101 | |
| Northern Territory | 26.3 at Mccluer Island | 13.6 at Alice Springs Airport | 30.3 at Walungurru Airport on 1 March | −2.7 at Arltunga on 23 May | 0.43 | 84 |
The ranking in the last column goes from 1 (lowest) to 111 (highest) and is calculated over the years 1910–2020 inclusive. As the anomaly averages in the tables are only retained to two decimal places, tied rankings are possible.
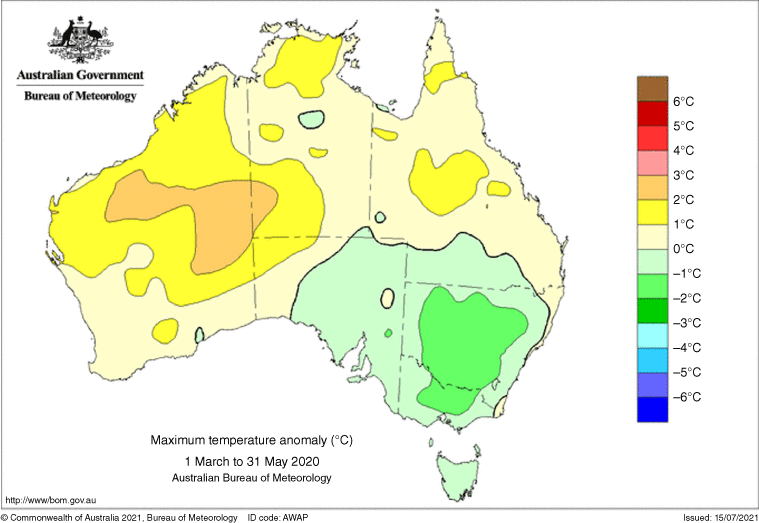
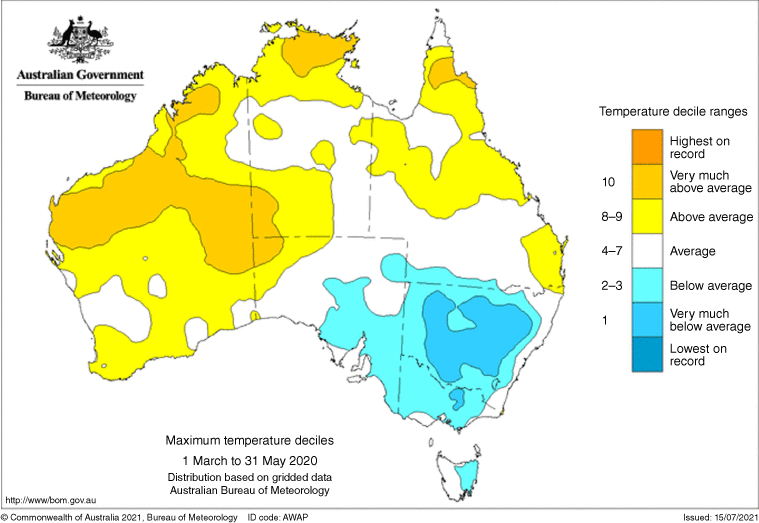
Mean maximum temperatures for autumn (Fig. 26) were above to very much above average for most of Western Australia (maximum temperature anomaly between +2 and +3°C, Fig. 27), the Northern Territory Top End, central and Far North Queensland, and in the regions surrounding and inclusive of Brisbane in the states’ south-east. Below average maximum temperatures were experienced across New South Wales, Victoria (maximum temperature anomaly between −1 and −2°C, Fig. 27), east Tasmania and south-east South Australia including Adelaide, Murray–Darling Basin and parts of the Arid Lands. A significant proportion of New South Wales was very much below average. There were sites in New South Wales, Victoria and Tasmania that experienced their lowest autumn mean maximum temperature on record. These low temperatures were associated with a number of cold fronts that passed through south-east Australia during autumn 2020.
Autumn 2020 maximum temperature deciles from analysis of ACORN-SAT data: decile ranges based on grid-point values for all autumns from 1910 to 2020.
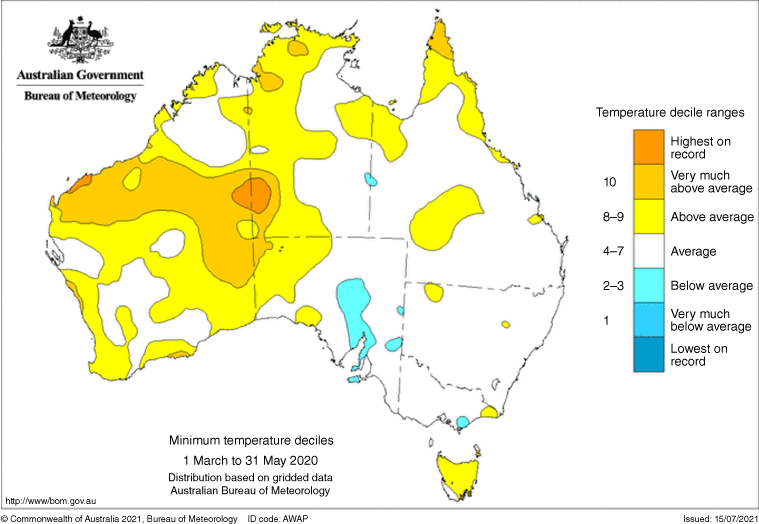
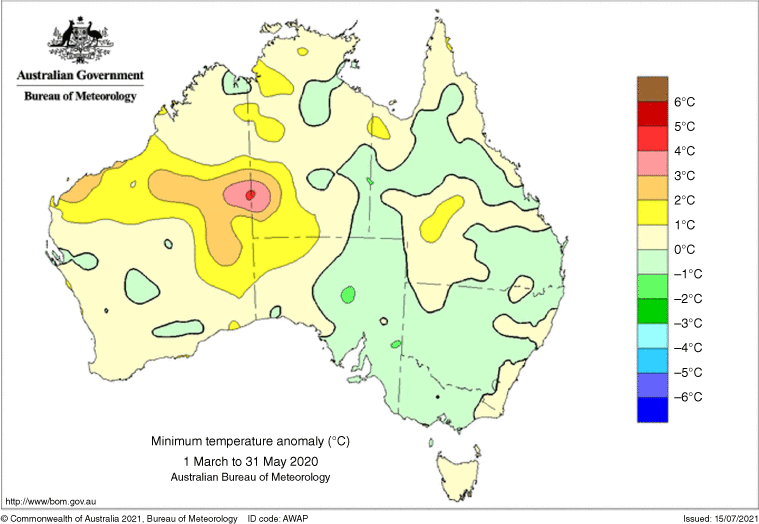
Mean minimum temperatures were above average in Tasmania, Far North Queensland and most of Western Australia reaching into the west of the Northern Territory and South Australia (Fig. 28). Very much above average temperatures spanned from the Pilbara to central Australia with anomalies ranging from +1 to +5°C (Fig. 29), with a patch of highest on record straddling the Western Australia–jNorthern Territory border. Far North Queensland sites experienced their warmest mean minimum temperatures on record in early March. There was a small region of below average minimum temperatures stretching north from the Spencer Gulf in South Australia.
8.Southern hemisphere
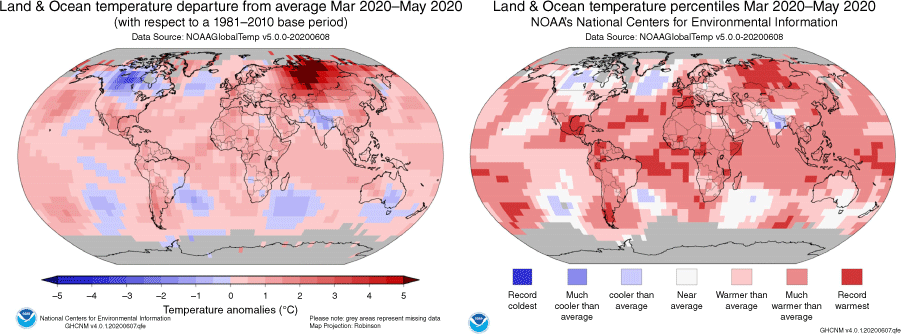
Terrestrial temperatures in autumn 2020 were mostly warmer than the 1981−2010 average for autumn in the southern hemisphere over land, with the only significant exception being an area centred on New South Wales (Fig. 30). Warm temperatures along with dry conditions established favourable conditions for later wildfires across Argentina, Brazil and Paraguay (World Meteorological Organization 2021). Much warmer than average temperatures and record temperatures across the south-west Pacific continued a warming trend identified in (McGree et al. 2022). New Zealand also continued to report glacial mass loss in 2020 from warm temperatures in the region (World Meteorological Organization 2021).
Mean temperature anomalies (°C) from a 1981–2010 base period for March–May 2020 (source: National Centers for Environmental Information).
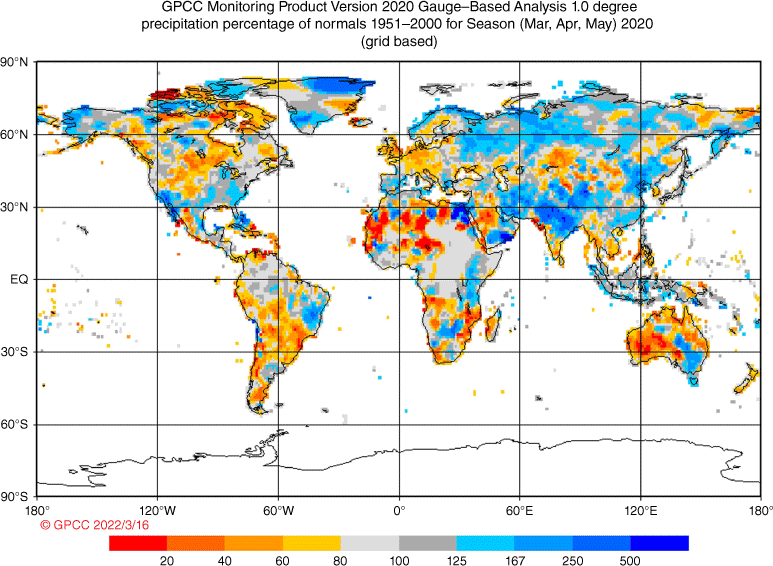
Seasonal precipitation percentages with reference to normal from 1951 to 2000 are shown for autumn 2020 in Fig. 31. In the southern hemisphere, flash flooding was reported in Brazil in March, and in Rwanda and the Democratic Republic of Congo in April and May. Locust outbreaks occurred in the Greater Horn of Africa and were related to the above average rainfall during the ‘long rains’season of March–May (World Meteorological Organization 2021). New Zealand experienced drought conditions from January 2020 due to a persistent high pressure anomaly in the region (Fig. 17), easing from April (National Institute of Water and Atmospheric Research 2021). Mozambique and neighbouring countries including Madagascar also experienced drought conditions, although due to the timing of the event late in the agricultural season the impact was minimal (Joint Research Centre Global Drought Observatory 2020).
Precipitation as a percentage of the 1951–2000 average for March–May 2020 (source: Global Precipitation Climatology Centre).
8.1. Antarctic climate
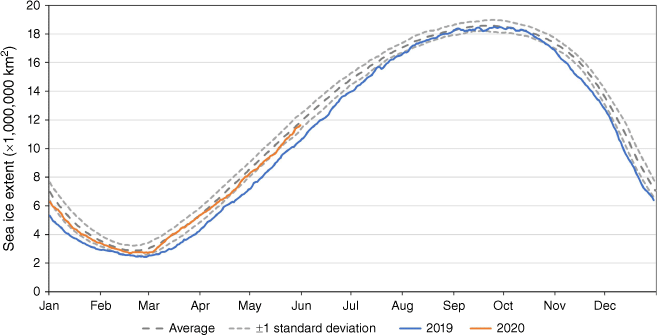
Sea ice extent in the Antarctic ended the autumn 2020 close to average after skirting between average to below average over the March–May period (Fig. 32). This follows a year of mostly well below average sea ice extents over 2019. The SAM index has well known links to Antarctic sea ice extent, with negative (positive) SAM phases linked to reductions (increases) in coverage (Hall and Visbeck 2002). A positive SAM index during March and May of 2020 corresponds to times of recovery in sea ice extents for autumn 2020 (Fig. 20).
Antarctic sea ice extent. Average is calculated for 1981–2010. Data from National Snow and Ice Data Center (see http://nsidc.org/data).
9.Conclusion
Austral autumn 2020 followed on from a hot and dry summer, which continued across most of Australia into autumn with exceptions in the south-east from several passing cold fronts that extinguished the remaining summer bushfires and lead to flooding in the region. This period also marked the second time the GBR experienced mass coral bleaching due to elevated ocean temperatures in an ENSO neutral year, with elevated SSTs attributed to a general warming trend in the Coral Sea. Early signs of a La Niña event started building with a cooling of surface and subsurface temperatures along the equatorial Pacific.
This will be the final of the 3-monthly seasonal climate summaries that have been routinely produced as part of a series that commenced in 1987 and have provided a vital resource for climate and ocean information in the Australian region and the southern hemisphere. Going forward there will be a shift to producing annual climate summaries that span from July to June.
Data availability
Data are available from the provided links in the paper or will be shared upon reasonable request to the corresponding author.
Acknowledgements
The author thanks Matthew Wheeler for providing figures and advice on the OLR and MJO products, and Blair Trewin for reviewing drafts of this manuscript and providing helpful comments.
References
Bureau of Meteorology (2020) Special Climate Statement 73 – extreme heat and fire weather in December 2019 and January 2020. (The Bureau) Available at http://www.bom.gov.au/climate/current/statements/scs73.pdf
Donald A, Meinke H, Power B, Wheeler M, Ribbe J (2004) Forecasting with the Madden–Julian Oscillation and the applications for risk management. In ‘Proceedings of the 4th International Crop Science Congress: New Directions for a Diverse Planet’, 26 September–1 October 2004, Brisbane, Qld, Australia. (University of Southern Queensland) Available at https://research.usq.edu.au/item/9xw3y/forecasting-with-the-madden-julian-oscillation-and-the-applications-for-risk-management
FloodList (2020) Papua New Guinea – thousands affected by floods in Gulf Province. In FloodList, 7 April 2020. Available at https://floodlist.com/asia/papua-new-guinea-floods-gulf-province-april-2020 [Verified 4 October 2023]
Goyal R, Jucker M, Sen Gupta A, Hendon HH, England MH (2021) Zonal wave 3 pattern in the Southern Hemisphere generated by tropical convection. Nature Geoscience 14(10), 732-738.
| Crossref | Google Scholar |
Great Barrier Reef Marine Park Authority (2017) Final report: 2016 coral bleaching event on the Great Barrier Reef. Findings of a rapid ecological impact assessment and summary of environmental monitoring and incident response. June 2017. (GBRMPA: Townsville, Qld, Australia) Available at https://elibrary.gbrmpa.gov.au/jspui/bitstream/11017/3206/1/Final-report-2016-coral-bleaching-GBR.pdf
Hall A, Visbeck M (2002) Synchronous variability in the Southern Hemisphere atmosphere, sea ice, and ocean resulting from the annular mode. Journal of Climate 15(21), 3043-3057.
| Crossref | Google Scholar |
Hendon HH, Zhang C, Glick JD (1999) Interannual variation of the Madden–Julian Oscillation during austral summer. Journal of Climate 12(8 PART 2), 2538-2550.
| Crossref | Google Scholar |
Hendon HH, Thompson DWJ, Wheeler MC (2007) Australian rainfall and surface temperature variations associated with the Southern Hemisphere annular mode. Journal of Climate 20(11), 2452-2467.
| Crossref | Google Scholar |
Huang B, Thorne PW, Banzon VF, Boyer T, Chepurin G, Lawrimore JH, Menne MJ, Smith TM, Vose RS, Zhang HM (2017) Extended reconstructed sea surface temperature, version 5 (ERSSTv5): Upgrades, validations, and intercomparisons. Journal of Climate 30(20), 8179-8205.
| Crossref | Google Scholar |
Hughes TP, Kerry JT (2017) Back-to-back bleaching has now hit two-thirds of the Great Barrier Reef. In The Conversation, 12 April 2017. Available at https://theconversation.com/back-to-back-bleaching-has-now-hit-two-thirds-of-the-great-barrier-reef-76092
Hughes TP, Kerry JT, Álvarez-Noriega M, Álvarez-Romero JG, Anderson KD, Baird AH, Babcock RC, Beger M, Bellwood DR, Berkelmans R, Bridge TC, Butler IR, Byrne M, Cantin NE, Comeau S, Connolly SR, Cumming GS, Dalton SJ, Diaz-Pulido G, Eakin CM, Figueira WF, Gilmour JP, Harrison HB, Heron SF, Hoey AS, Hobbs JA, Hoogenboom MO, Kennedy E V, Kuo CY, Lough JM, Lowe RJ, Liu G, McCulloch MT, Malcolm HA, McWilliam MJ, Pandolfi JM, Pears RJ, Pratchett MS, Schoepf V, Simpson T, Skirving WJ, Sommer B, Torda G, Wachenfeld DR, Willis BL, Wilson SK (2017) Global warming and recurrent mass bleaching of corals. Nature 543(7645), 373-377.
| Crossref | Google Scholar | PubMed |
Hughes TP, Kerry JT, Connolly SR, Baird AH, Eakin CM, Heron SF, Hoey AS, Hoogenboom MO, Jacobson M, Liu G, Pratchett MS, Skirving W, Torda G (2019) Ecological memory modifies the cumulative impact of recurrent climate extremes. Nature Climate Change 9(1), 40-43.
| Crossref | Google Scholar |
Joint Research Centre Global Drought Observatory (2020) GDO analytical report: drought in Mozambique and neighbouring countries July 2020. (European Commision) Available at https://www.gdacs.org/Public/download.aspx?type=DC&id=205
Kanamitsu M, et al. (2002) NCEP-DEO AMIP-II reanalysis (R-2). Bulletin of the American Meteorological Society 83(11), 1631-1643.
| Crossref | Google Scholar |
Kuleshov Y, Qi L, Fawcett R, Jones D (2009) Improving preparedness to natural hazards: Tropical cyclone prediction for the Southern Hemisphere. Advances in Geosciences 12, 127-143.
| Crossref | Google Scholar |
McGree S, Smith G, Chandler E, Herold N, Begg Z, Kuleshov Y, Malsale P, Ritman M (2022) Climate change in the Pacific 2022: historical and recent variability, extremes and change. (Climate and Ocean Support Program in the Pacific, Pacific Community: Suva, Fiji) 10.5281/zenodo.10116941
Madden RA, Julian PR (1971) Detection of a 40–50 day oscillation in the zonal wind in the tropical Pacific. Journal of the Atmospheric Sciences 28(5), 702-708.
| Crossref | Google Scholar |
Madden RA, Julian PR (1972) Description of global-scale circulation cells in the tropics with a 40–50 day period. Journal of the Atmospheric Sciences 29(6), 1109-1123.
| Crossref | Google Scholar |
Madden RA, Julian PR (1994) Observations of the 40–50-day tropical oscillation – a review. Monthly Weather Review 122((5), 814-837.
| Crossref | Google Scholar |
Marshall GJ (2003) Trends in the Southern Annular Mode from observations and reanalyses. Journal of Climate 16(24), 4134-4143.
| Crossref | Google Scholar |
National Centers for Environmental Prediction (2019) El Niño/Southern Oscillation (ENSO) diagnostic discussion. (NOAA National Weather Service: College Park, MD, USA) Available at https://www.cpc.ncep.noaa.gov/products/analysis_monitoring/enso_disc_feb2019/ensodisc.shtml
National Institute of Water and Atmospheric Research (2021) Annual Climate Summary: New Zealand climate summary: 2020. Issued: 12 January 2021. (NIWA) Available at https://niwa.co.nz/sites/default/files/2020_Annual_Climate_Summary_Final.pdf
Nolan MKB, Schmidt-Roach S, Davis AR, Aranda M, Howells EJ (2021) Widespread bleaching in the One Tree Island lagoon (Southern Great Barrier Reef) during record-breaking temperatures in 2020. Environmental Monitoring and Assessment 193(9), 590.
| Crossref | Google Scholar | PubMed |
Pörtner H-O, Roberts DC, Masson-Delmotte V, Zhai P, Tignor M, Poloczanska E, Mintenbeck K, Alegría A, Nicolai M, Okem A, Petzold J, Rama B, Weyer NM (Eds) (2019) The Ocean and Cryosphere in a Changing Climate: a special report of the Intergovernmental Panel on Climate Change. (Intergovernmental Panel on Climate Change) Available at https://www.ipcc.ch/site/assets/uploads/sites/3/2019/12/SROCC_FullReport_FINAL.pdf
Puri K, Dietachmayer G, Steinle P, Dix M, Rikus L, Logan L, Naughton M, Tingwell C, Xiao Y, Barras V, Bermous I, Bowen R, Deschamps L, Franklin C, Fraser J, Glowacki T, Harris B, Lee J, Le T, Roff G, Sulaiman A, Sims H, Sun X, Sun Z, Zhu H, Chattopadhyay M, Engel C (2013) Implementation of the initial ACCESS numerical weather prediction system. Australian Meteorological and Oceanographic Journal 63(2), 265-284.
| Crossref | Google Scholar |
Reynolds RW, Rayner NA, Smith TM, Stokes DC, Wang W (2002) An improved in situ and satellite SST analysis for climate. Journal of Climate 15(13), 1609-1625.
| Crossref | Google Scholar |
Risbey JS, Pook MJ, McIntosh PC, Wheeler MC, Hendon HH (2009) On the remote drivers of rainfall variability in Australia. Monthly Weather Review 137(10), 3233-3253.
| Crossref | Google Scholar |
Saji NH, Goswami BN, Vinayachandran PN, Yamagata T (1999) A dipole mode in the tropical Indian ocean. Nature 401(6751), 360-363.
| Crossref | Google Scholar | PubMed |
Smith GA (2019) Seasonal climate summary for the southern hemisphere (autumn 2017): the Great Barrier Reef experiences coral bleaching during El Niño–Southern Oscillation neutral conditions. Journal of Southern Hemisphere Earth Systems Science 69(1), 310-330.
| Crossref | Google Scholar |
Troup AJ (1965) The Southern Oscillation. Quarterly Journal of the Royal Meteorological Society 91(390), 490-506.
| Crossref | Google Scholar |
Watson CS, White NJ, Church JA, King MA, Burgette RJ, Legresy B (2015) Unabated global mean sea-level rise over the satellite altimeter era. Nature Climate Change 5(6), 565-568.
| Crossref | Google Scholar |
Wheeler MC, Hendon HH (2004) An all-season real-time multivariate MJO index: development of an index for monitoring and prediction. Monthly Weather Review 132(8), 1917-1932.
| Crossref | Google Scholar |
Wheeler M, Kiladis GN (1999) Convectively coupled equatorial waves: analysis of clouds and temperature in the wavenumber–frequency domain. Journal of the Atmospheric Sciences 56(3), 374-399.
| Crossref | Google Scholar |
World Meteorological Organization (2021) State of the Climate 2020. WMO-No: 1264. (WMO: Geneva, Switzerland) Available at https://library.wmo.int/idurl/4/56247
Wolter K, Timlin MS (1993) Monitoring ENSO in COADS with a seasonally adjusted principal component index. In ‘Proceedings of the 17th Climate Diagnostics Workshop’, 18–23 October 1992, Norman, OK, USA. pp. 52–57. (NOAA/NMC/CAC, NSSL, Oklahoma Climate Survey, CIMMS and the School of Meteorology, University of Oklahoma) Available at https://psl.noaa.gov/enso/mei.old/WT1.pdf
Wolter K, Timlin MS (1998) Measuring the strength of ENSO events: how does 1997/98 rank? Weather 53(9), 315-324.
| Google Scholar |
Wright PB (1989) Homogenized long‐period Southern Oscillation indices. International Journal of Climatology 9(1), 33-54.
| Crossref | Google Scholar |

