
The effect of tidal range and mean sea-level changes on coastal flood hazards at Lakes Entrance, south-east Australia
Ben S. Hague A B * , Rodger B. Grayson C , Stefan A. Talke D , Mitchell T. Black A and Dörte Jakob A
A Bureau of Meteorology, Melbourne, Vic., Australia.
B School of Earth Atmosphere and Environment, Monash University, Clayton, Vic., Australia.
C Retired. Formerly at Department of Infrastructure Engineering, The University of Melbourne, Parkville, Vic., Australia.
D Department of Civil and Environmental Engineering, California Polytechnic State University, San Luis Obispo, CA, USA.
Journal of Southern Hemisphere Earth Systems Science 73(2) 116-130 https://doi.org/10.1071/ES22036
Submitted: 29 November 2022 Accepted: 3 May 2023 Published: 24 May 2023
© 2023 The Author(s) (or their employer(s)). Published by CSIRO Publishing on behalf of the Bureau of Meteorology. This is an open access article distributed under the Creative Commons Attribution-NonCommercial-NoDerivatives 4.0 International License (CC BY-NC-ND)
Abstract
Despite being well-documented in other countries, the roles that anthropogenically induced changes and natural variability in tidal processes play in modulating coastal flood frequencies have not been investigated in Australia. Here we conduct a brief assessment of changes in tidal variability around Australia. We then apply a simple attribution framework to quantify the separate and joint effects of tidal range changes and increasing relative mean sea level on nuisance flood frequency at the location with the largest relative changes in tidal range, Lakes Entrance, Victoria. To understand how these changes in variability affect flood hazards, we consider a nuisance flood threshold based on recent coastal flood impact surveys. Results show that increases in the heights of high tides over recent years have exerted a large influence on coastal flood frequencies. These recent changes are potentially linked to changes in channel dredging regimes. We show that 93% of nuisance flood days since 2009 would not have occurred without these tidal range changes or the coincident increases in the mean sea level. We demonstrate the importance of considering tidal processes in estuarine coastal flood hazard assessments for future planning, even if these processes do not represent a substantial flood threat today. We discuss the implications of this study for future work on estuarine flood hazards and the benefits of considering impact-based thresholds in the assessment of such hazards.
Keywords: astronomical tides, channel dredging, climate change, coastal flooding, coastal oceanography, compound flooding, estuaries, sea-level rise.
1.Introduction
The physical drivers of extreme coastal water levels (WLs) cross a complex range of spatial and temporal scales (Woodworth et al. 2019), especially in a country as large and as climatologically diverse as Australia (McInnes et al. 2016). The relative importance of these drivers varies spatially (Rueda et al. 2017) and with the coastal environment where extreme WLs are occurring. Recent Australian coastal flood hazard studies have primarily focused on WLs in harbours, bays and estuaries, considering mean sea level (MSL), astronomical tide, and storm surges, but excluding waves (McInnes et al. 2015; Lowe et al. 2021; Hague et al. 2022). Recent sea-level rise (SLR) has led to dramatic changes in flood drivers in these environments, especially for the most frequently occurring minor floods. These now occur due to tides alone under average weather conditions in some locations (Hague et al. 2022). In the United States, it has also been found that recent changes in tides have led to changes in flood frequencies greater than those expected based on SLR alone (Li et al. 2021).
Variability and trends in offshore WLs can also influence WLs inside tidal rivers, lakes and lagoons. There are many additional physical factors that can lead to changes in tidal patterns and amplitudes, with local-scale processes generally eliciting the largest changes (Haigh et al. 2020; Talke and Jay 2020). The causes of local tidal range changes include changes in bathymetry (e.g. from dredging), frictional drag, inlet geometry and geomorphic features. For example, changes in tides inside inlets have been linked to changes in the depth and cross-sectional area of their channels and entrances (Araújoet al. 2008; Passeri et al. 2016; De Leo et al. 2022). By contrast, regional changes include those due to changes in tectonics and continental drift, regional MSL, shoreline position, ocean stratification or lunar and solar factors.
Previous global and regional studies (Mawdsley et al. 2015; Devlin et al. 2017a) have identified that changes in tidal ranges in Australia have been typically less than 10% of the tidal range. Here we provide an updated assessment of tidal range changes based on a new high-quality Australian sea-level dataset (Hague et al. 2021). This analysis shows that one location, Lakes Entrance, Victoria, had much larger relative increases in tidal range than other Australian locations. To date, the impact of such tidal changes on flood frequencies has only been considered in the United States (e.g. Ralston et al. 2019; Li et al. 2021). Here we leverage established methods to define impact-based flood thresholds (Hague et al. 2019) to relate changes in tidal range at Lakes Entrance to changes in annual nuisance flood days. Rapid changes in the frequency of these nuisance floods are considered harbingers for increases in more extreme floods with further SLR (Sweet and Park 2014; Thompson et al. 2021). We explore the significance of these findings for more extreme floods and the future evolution of flood hazards.
2.Water level data
2.1. Observed water levels
Australian hourly WL observations are obtained from the Australian National Collection of Homogenised Observations of Relative Sea Level up to 2019 (ANCHORS; Hague et al. 2021). We also consider the Australian subset of the Global Extreme Sea Level Analysis version 3 dataset (Haigh et al. 2022) to assess changes in tidal range at additional locations not included in ANCHORS.
For the Lakes Entrance case study, we update the ANCHORS record with 6-min frequency data that is then filtered to hourly observations using a Lanczos-cosine filter for 2020 and 2021. This approximates the process used in the generation of the hourly data from higher-frequency observations in ANCHORS. We then subtract 0.757 m from Lakes Entrance observations to express WLs with respect to the Australian Height Datum (AHD). This is a mean WL datum used for flood mapping, flood mitigation and previous inundation modelling (Grayson et al. 2004; State Emergency Service 2012).
2.2. Harmonic tidal analysis
To quantify the role of tidal processes on WLs, and how these have changed through time, we perform a series of harmonic tidal analyses. We use the TideHarmomics package (ver. 0.1-1, A. Stephenson, see https://cran.r-project.org/package=TideHarmonics) to fit sums of sines and cosines of specific frequencies (constituents) to observed WL timeseries. We use the default options for this package, which involves fitting 114 constituents to the observed WLs. These constituents are then used to estimate WLs under average weather conditions (i.e. the tides) over some past or future period, termed a tidal analysis. The highest and lowest values in the analysis are termed the highest astronomical tide (HAT) and lowest astronomical tide (LAT) respectively.
In this study we use several different tidal analyses. For Section 3, we compute predictions for the 2002–2019 period based on constituents derived from each single year of data. This is repeated for all those years with at least 70% data availability. This produces different realisations of analysed tides for the period 2002–2019. To compute changes in tidal constituents in Section 3, a different approach is taken, following established methods for this type of analysis (Woodworth 2010). This involves fitting 18.61- and 8.85-year cycles to the data as well as a trend. Robust fitting is applied that down-weights outliers.
For Section 4, we define pre- and post-change tidal analyses for a case study location (Lakes Entrance, Victoria). These analyses both provide estimates of tides for the 2009–2021 period but using two different sets of constituents. The pre-change analysis is based on 1994–2001 observations, whereas the post-change tidal analysis is based on 2009–2021 observations. A step change in tidal characteristics occurred between 2001 and 2009 (a period of missing data). Hence, this pre-change analysis represents a counterfactual for what tides may have been like during the later period if the step-change in tidal characteristics had not occurred. In Section 4.3, tidal distributions are then determined using non-parametric kernel density estimation methods in SciPy (Virtanen et al. 2020) based on these analyses.
Due to missing data, nodal corrections are used to address the fact that the observed data do not cover a complete nodal cycle. However, comparison between analyses with and without nodal corrections exhibit average absolute differences equal to the data precision of 0.01 m. Some (small) difference between tidal heights might be expected for predictions from different years, both due to fluctuations in tidal constituents caused by river flow, sea-level variability, coastal stratification (Moftakhari et al. 2013; Devlin et al. 2014; Talke et al. 2020) or errors in the gauge measurement (Zaron and Jay 2014; Talke et al. 2020). However, a significant shift in tidal properties that is larger than the nodal cycle and persists over time represents a change in tidal constituents caused, for example, by a reduction in impedance through an inlet or a decrease in frictional damping (Haigh et al. 2020; Talke and Jay 2020), rather than MSL variability.
Skew surge is used to represent the non-tidal contributions to WLs. It is computed as the difference between daily maximum WL and daily maximum tide level (Batstone et al. 2013; Hague et al. 2022). This skew surge includes the WL contributions that can be attributed to both non-tidal coastal processes, e.g. as described by Woodworth et al. (2019), and riverine processes such as catchment-scale floods. This allows seamless consideration of compound flood events, where both riverine and coastal processes contribute to WLs (Leonard et al. 2014). The skew surge is only calculated on days where there are no missing observations over a 24-h period.
3.National assessment of tidal range changes
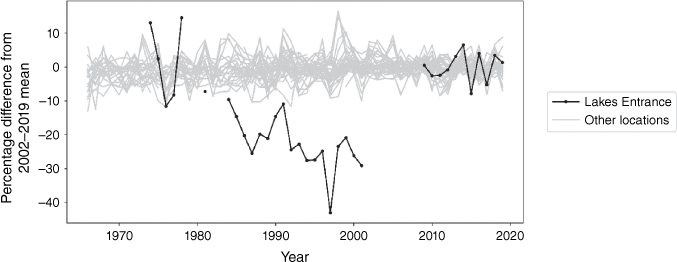
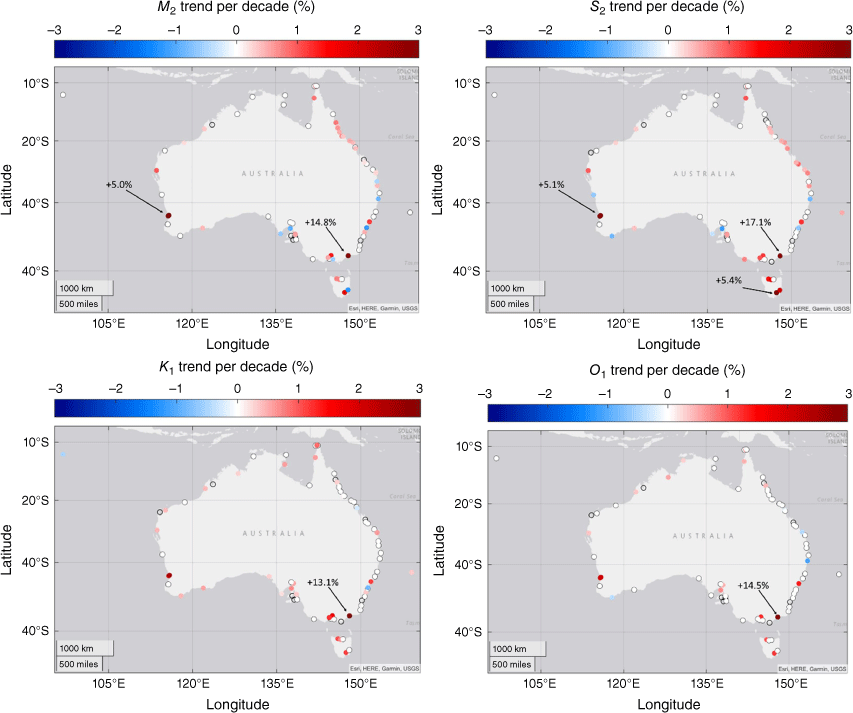
Analysis of the ANCHORS dataset (Fig. 1) shows that recent tidal range changes in Australia are generally small, consistent with those estimated in previous global studies (Mawdsley et al. 2015; Devlin et al. 2017a). On average, tidal ranges over the 2002–2019 epoch are 0.020 m greater than for the 1984–2001 epoch, although some locations have seen reductions in tidal range. The average absolute change in tidal range is 0.035 m, or 2.2%. We assess the statistical significance of these results using the (Australian portion of the) larger GESLA dataset, considering the principal lunar semidiurnal tidal constituent (M2) (Fig. 2a). These changes are statistically significant and positive at 31 locations, statistically significant and negative at 8 locations and not statistically significant at 31 locations. Similar, although fewer statistically significant, results are obtained for the other primary tidal constituents – S2 (principal solar semidiurnal) and K1 and O1 (lunar diurnals) (Fig. 2b–d).
Annual tidal range over 1966–2019, expressed as a percentage of the 2002–2019 mean tidal range. Lakes Entrance is shown in black, with all other locations shown in grey.
Estimated changes to the two primarily semidiurnal (M2, upper left; S2, upper right) and two primary diurnal (K1, lower left; O1, lower right) tidal constituents for Australian tide gauges in GESLA v3 dataset. Locations with changes of greater than 3% in magnitude in a constituent have the estimated trend annotated in the relevant panel, all other values are provided in Supplementary Table S2. Results that are not statistically significant are shown as white-filled circles with grey outlines. Tide gauges with less than 30 years of data are not shown.
The average tidal range over 1984–2001 is uncorrelated (R2 < 0.01) with the observed changes in tidal range between that period and the later period. This means that the largest percentage-wise changes in tidal ranges are generally at locations with small tidal range. This assessment is based on the annual tidal range – the height difference between highest and lowest tide in each year of the epoch based on the tidal analysis. However, results are comparable considering daily, monthly and epochal tidal ranges (Supplementary Table S1). This means that the same tidal range change can elicit a larger change in coastal flood frequencies at locations with smaller tidal ranges. This is similar to how locations with smaller tidal ranges are projected to have larger increases in the frequency of coastal floods under SLR, all else being equal (Ritman et al. 2022).
Compared to the rest of the ANCHORS dataset, one location has much larger increases in tidal range (Fig. 1). At Lakes Entrance, Victoria, annual tidal range over 2009–2019 (note 2002–2008 is missing) is 0.24 m greater than over 1984–2001, an increase of 29%. Overall, tidal ranges decreased from the 1970s until the early 2000s, then increased abruptly in 2009 after a data gap. This change is manifested in all four of the primary tidal constituents: M2 (principal lunar semidiurnal), S2 (principal solar semidiurnal) and K1 and O1 (lunar diurnals) (Fig. 2). Considering linear trends of constituents at Lakes Entrance from 1981 to those observed at the 72 GESLA locations with 30 years of data, further demonstrates the exceptional nature of tidal changes at Lakes Entrance compared to other locations in Australia (Fig. 2, Supplementary Table S2). Hence, Lakes Entrance makes an ideal case study to assess the extent to which changes in tidal range impact flood hazards in Australia. This is the focus of the remainder of this paper.
4.Drivers of coastal flooding at Lakes Entrance
4.1. Impact-based flood levels
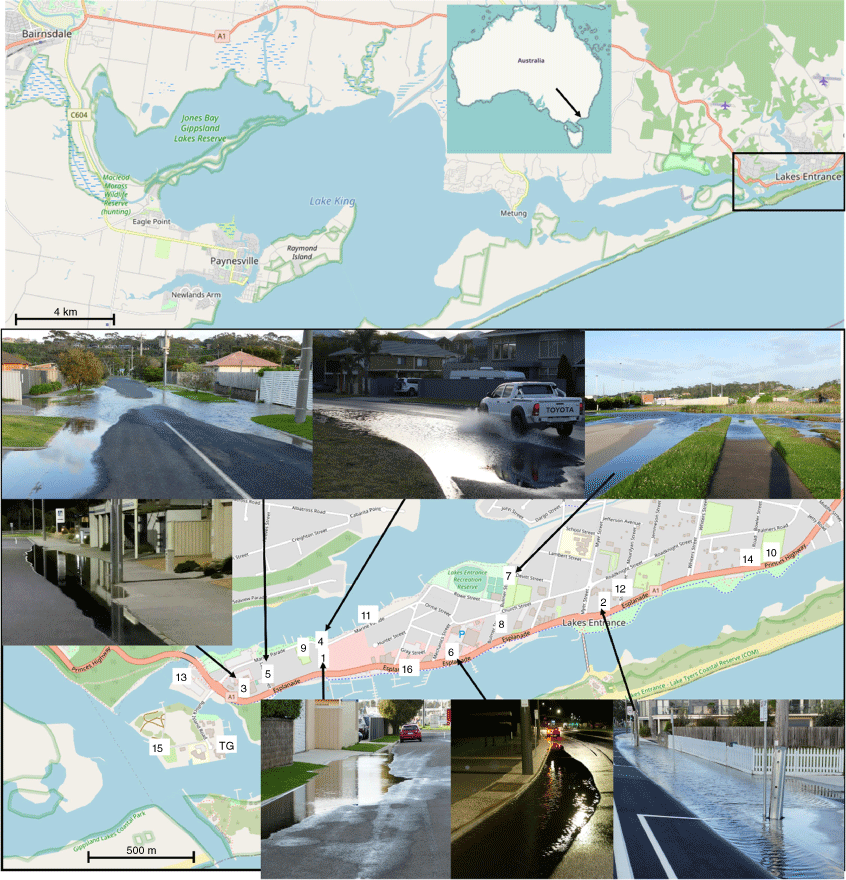
Lakes Entrance is a popular tourist town with a population of ~5000 people located in southern Australia’s East Gippsland region, 250 km east of Melbourne. Most of the town sits on a low-lying peninsula located in the Gippsland Lakes just inside an artificially maintained channel to Bass Strait, constructed between 1870 and 1889 (Wheeler et al. 2010). The water surface area of the Gippsland Lakes is almost 400 km2 and the contributing catchment area is over 20 000 km2, comprising six major rivers (Tan et al. 2008). The Lakes Entrance township is very low-lying with much of the town’s key infrastructure and private property sitting less than 1.3 m above AHD (~1966–1968 MSL) (State Emergency Service 2012). Accordingly, it has experienced many floods over its history. This has led to well-defined flood thresholds being developed for hazard assessments and warnings. Although the flood thresholds have historically been used for riverine flood hazards, they also apply to floods driven by oceanic influences. This follows from them being defined at the ANCHORS tide gauge and the WLs at this gauge being a good proxy for coastally driven flood impacts in the Lakes Entrance township (Table 1).
The minor flood threshold used in forecasting and warning services sits at 0.9 m AHD, whereas the major flood threshold is defined at 1.3 m AHD (Bureau of Meteorology 2013). Nuisance-type flood impacts have been modelled to occur with WLs as low as 0.7 m AHD (State Emergency Service 2012). We established a local impact-monitoring program, deploying a local observer (if available) to photograph flood impacts when WLs were forecasted to exceed this nuisance flood threshold. Over seven events in 2021 and one event in each of 2020 and 2018, flooding was observed in situ at 16 different locations within the Lakes Entrance township (Fig. 3, Table 1). This suggests that 0.7 m AHD is an appropriate impact-based threshold for nuisance flooding at Lakes Entrance (Hague et al. 2019). Most locations where impacts were reported experienced flooding when WLs reached 0.8 m AHD, with more isolated flooding at the 0.7 m AHD level. Flooding was observed due to two main mechanisms: storm-drain backflow and direct marine flooding (Habel et al. 2020). The backflow mechanism explains why saltwater flooding was often reported hundreds of metres from the shoreline (e.g. Fig. 3 photo 5), as observed in other jurisdictions (Gold et al. 2023).
Upper panel: location of Lakes Entrance (black marker) with boundary lower panel denoted by black square. Upper inset shows the location of Lakes Entrance within Australia. Lower panel: locations (numbered) where nuisance flood impacts were reported during monitored extreme sea-level events during 2018, 2020 and 2021 and location of Lakes Entrance water level gauge (TG). Some examples of the types of impacts that were observed are provided. Photos taken by authors on 15 November 2021, except 3 (25 July 2021) and 6 (20 July 2021). Map backgrounds from Open Street Map.
| Date (day/month/year) | WL (m) | Impacts |
|---|---|---|
| 24–25/06/1998 | 1.24 | Widespread (Grayson et al. 2004; Wheeler 2005) |
| 28–30/06/2007 | 1.4A | Widespread (Bishop et al. 2014; Coller et al. 2018) |
| 6–8/06/2012 | 0.86 | Jetties and paths (social media) |
| 5/07/2013 | 0.81 | 11 |
| 8/07/2018 | 0.83 | 11 |
| 23/11/2018 | 0.82 | 4, 7, 15 |
| 2/05/2020 | 0.81 | 3, 4, 7, 10, 11, 14 |
| 26/05/2021 | 0.77 | 4, 7, 10 |
| 26/06/2021 | 0.77 | 4, 7, 10 |
| 20/07/2021 | 0.82 | 6, 7 |
| 23/07/2021 | 0.7 | 4, 5, 7, 10 |
| 24/07/2021 | 0.8 | 1, 2, 3, 4, 5, 7, 10, 14 |
| 25/07/2021 | 0.84 | 1, 2, 3, 4, 5, 7, 8, 11, 12, 14, 16 |
| 5/10/2021 | 0.79 | 1, 3, 4, 5, 7, 10 |
| 15/11/2021 | 0.85 | 1, 2, 3, 4, 5, 6, 7, 8, 9, 10, 11, 12, 13 |
All water levels were from events where photographic evidence of nuisance flood impacts exist. Numbered impacts refer to numbers in Fig. 3.
AThe June 2007 event WL is missing in the ANCHORS dataset, and instead taken from Bishop et al. (2014).
4.2. Drivers of coastal WL and flood variability
The primary driver of WL and coastal flood variability at Lakes Entrance are astronomical tides, which arise from the predictable changes in gravitational forces in the earth–moon–sun system. The largest variability in high tide heights occurs on monthly timescales due to the spring-neap cycle (Fig. 4a). The highest high tide of the month is on average 0.25 m higher than the lowest high tide of the month. This is comparable to magnitude of the largest non-tidal contributions to WLs on annual timescales (Fig. 4e), resulting from wind setup within the Lakes (Walpole et al. 2011), flood flows from its major rivers (Tan et al. 2007) and storm surges (McInnes et al. 2009). Between-month variability is also important, with average heights of the monthly highest tides in June and July on average 0.18 m greater than those in March and October (Fig. 4b).
Tidal and non-tidal factors contributing to observed water levels at Lakes Entrance. Tidal components show (a) daily and (b) monthly highest tides over time periods appropriate to demonstrate their periodicity. These are estimated using the 2009–2021 tidal analysis based on 2009–2022 constituents. (c) The height of the annual highest tide based on the 2021 iteration of the year-by-year analysis described in Section 2.2, (d) shows the annual mean sea level with trend (orange) computed by ordinary least squares, (e) shows the monthly maximum skew surge and (f) shows the astronomical tidal range, estimated using the maximum and minimum tidal level derived over the 2002–2021 period using the iterative year-by-year analysis (i.e. as per Fig. 1). Constituents were only computed for years with at least 70% completeness. Non-tidal components are estimated using (e) annual MSL with linear trend and (f) monthly maximum skew surge. Skew surge is computed as the difference between the daily maximum still water level and maximum tidal level, where tidal level is based on the 2009–2021 analysis.
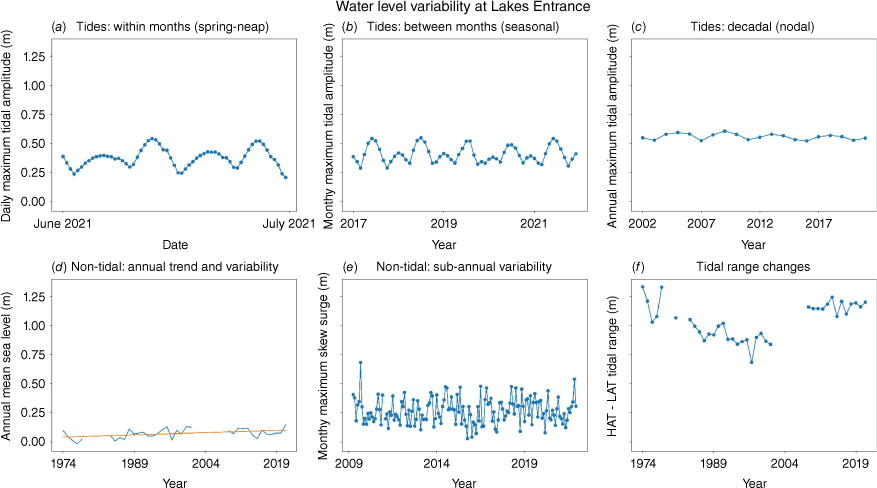
Although smaller in magnitude, the year-to-year variability in the annual highest tide (Fig. 4c) is comparable to the observed increase in MSL over the 1974–2021 period (Fig. 4d). This trend computed as 1.23 mm year–1, based on the annual MSL in years with at least 70% data completeness. Trends in MSL at Lakes Entrance are difficult to estimate with confidence due to a data gap of several years in the early 2000s and a lack of suitable reference series to perform data homogenisation using reference series before and after this data gap (Hague et al. 2021). The annual variability in the number of flood days appears closely linked to the 4.4-year cycles, which produces up to 0.06 m variation in tidal amplitudes between years (Fig. 4c). This results from solar and lunar declination, lunar perigee and their interactions (Ray and Merrifield 2019).
Understanding how high tide heights vary across different timescales is critical to understanding coastal flood hazards. We define a ‘flood day’ as a day in which the observed maximum daily WL exceeds the 0.70 m threshold associated with flooding of at least nuisance severity. This is based on the lowest WL associated with nuisance flooding impacts (Table 1). Flood days are computed from the underlying hourly data (Section 2.1) so some very short (<1 h) duration flood events may be missed. This is consistent with the approach of Hague et al. (2022). Considering flood days allows us to understand whether the variations in the monthly and annual average number of extreme tides and extreme skew surges lead to similar changes in flood frequencies. The flood level of 0.7 m AHD corresponds to the 97.5th percentile of daily maximum levels. Accordingly, we define an ‘extreme tide day’ as a day where the maximum tide exceeds its 97.5th percentile (0.57 m) and an ‘extreme surge day’ as a day where the skew surge exceeds its 97.5th percentile (0.30 m).
Using this approach, we show that despite having larger non-tidal contributions to daily WLs than most other locations in the ANCHORS dataset (Hague et al. 2022), variability in tides is more important in modulating nuisance flood frequencies than variability in skew surges. Since 2008, 75% of flood days have occurred in May, June, July or August at Lakes Entrance (Fig. 5a). All extreme tide days also occurred during these 4 months (Fig. 5c) but only 44% of extreme surge days (Fig. 5e). This strong relationship between high tides and floods exists because higher tides mean that smaller skew surges can lead to flooding, making flooding more likely to occur at these times (Dusek et al. 2022).
Observed flood days by (a) month and (b) year and corresponding counts of (c, d) extreme tide days and (e, f) extreme surge days.
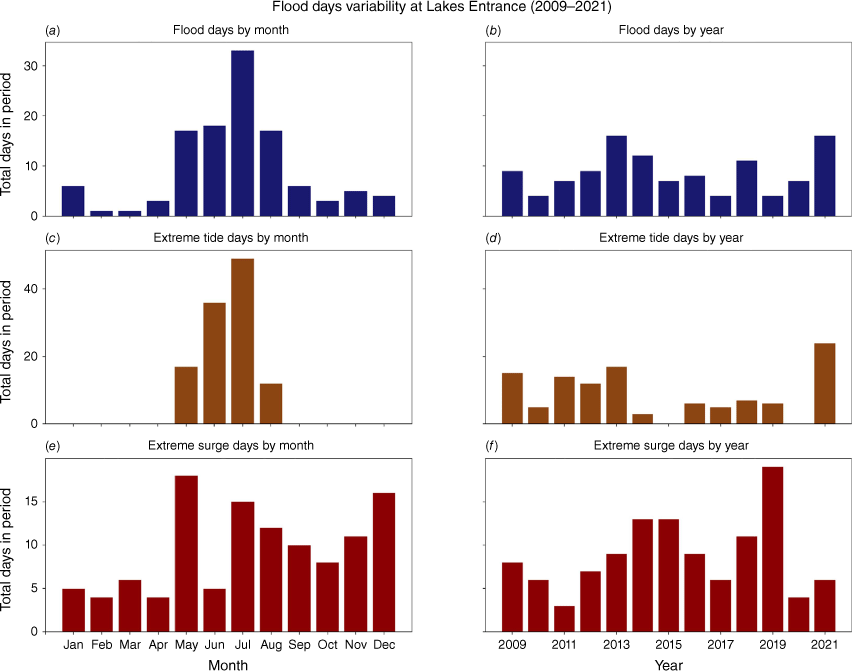
A similar phenomenon is also observed on annual timescales (Fig. 5b). The two years with the largest number of extreme tide days (2021 and 2013) also have the greatest number of flood days (Fig. 5d). By contrast, these years had near- or below-average numbers of extreme surge days (Fig. 5f). These observations indicate that astronomical forcing plays a key role in driving variability of flood days. This astronomical forcing is independent of SLR and weather and climate variability (Williams et al. 2016). Further, this interannual variability of tidal amplitudes is greater than that of annual MSL for southern and eastern Australia (Muis et al. 2018). This is why the production of accurate long-range forecasts and projections of coastal flood hazards will require both tidal and sea-level anomaly inputs (Long et al. 2021; Thompson et al. 2021; Dusek et al. 2022).
4.3. Changes in tidal variability
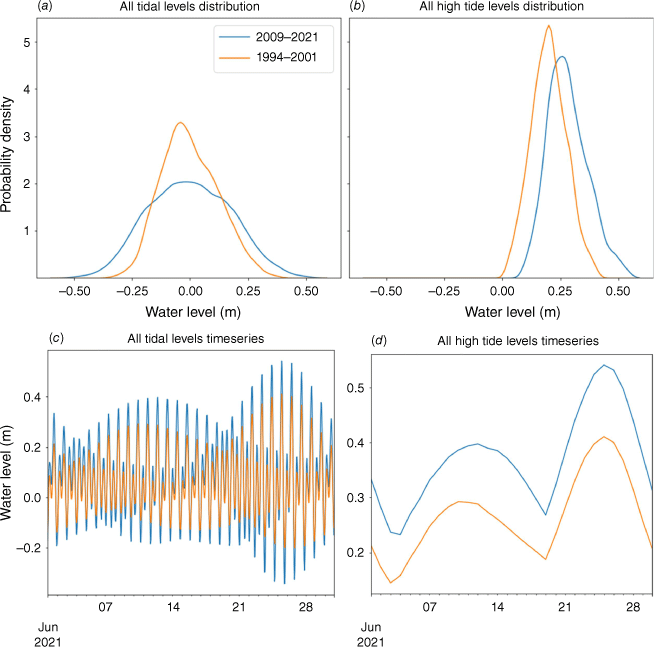
Changes in high tide heights due to changes in the tidal characteristics of a location can also change the non-tidal WL contributions required to cause flooding. This occurred at Lakes Entrance as the gradual decrease in tidal range throughout the 1980s and then stepwise increase between 2001 and 2009 (Fig. 1 and 4f). Analysis of pre- and post-change tidal analyses (Section 2.2) shows that this change has been non-linear, with two aspects of this non-linearity considered here. Firstly, changes in low tide heights have been larger than changes in high tide heights (Fig. 6a, c). The height of the highest annual tide over the 2009–2021 period averaged 0.67 m AHD, compared to 0.54 m AHD over the 1994–2001 period. The lowest tides were substantially lower however, decreasing from −0.31 to −0.49 m AHD. Secondly, the heights of the highest high tides of the month (i.e. spring tides) have increased by more than the lowest high tides of the month (i.e. neap tides) (Fig. 6b, d). Using the 2009–2021 constituent-based analysis, spring high tides were 0.11 m higher than those obtained using the 1994–2001 constituent-based analysis. By contrast, neap high tides were only 0.06 m higher when considering the 2009–2021 constituent-based analysis. This asymmetry has also been observed at other locations where tidal range changes have occurred (Pareja‐Roman et al. 2023).
Changes in the statistical distributions of tidal heights computed for 2009–2021 based on harmonic tidal analysis using constituents over the contemporaneous (2009–2021) period (blue) and pre-change (1994–2001) period (orange). The kernel density estimates for (a) hourly and (b) daily maximum tide heights are shown. A 1-month timeseries from June 2021 is used to compare the (c) hourly and (d) daily maximum tide heights to illustrate how spring and neap tides vary between the two realisations of 2009–2021 tide heights.
How these changes in tidal variability can lead to changes in coastal flood risk can be examined using the concept of freeboard (Devlin et al. 2017b; Dusek et al. 2022). Freeboard is the vertical distance between the local flood level and the typical elevation of high tides and is equal to the non-tidal contributions to WLs required for flooding to occur. Following from its definition, increases in the height of high tides, whether by increases in MSL or tidal variability, can reduce freeboard. This means that both increases in tidal range and MSL cause flooding to occur more frequently as smaller non-tidal contributions to WLs can cause flooding, or flooding can occur due to tides alone (Ray and Foster 2016). In the context of Lakes Entrance this means that spring high tides being 0.11 m higher than previously have the same effect on flood hazards as a 0.11 m increase in MSL would over the same period. This is approximately double the observed SLR over the 1974–2019 period, as estimated by multiplying out the computed linear trend (Fig. 4d).
4.4. Drivers of changes in tidal variability
Changes in tidal variability are anomalous compared to those observed in other Australian locations. This suggests that localised, rather than regional, processes are driving changes in tidal range at Lakes Entrance. In the United States, similarly anomalous changes have been attributed to dredging (Helaire et al. 2019; Ralston et al. 2019; Talke et al. 2021; De Leo et al. 2022; Pareja‐Roman et al. 2023). Dredging influences tidal range by increasing the amount of ocean level variability that is transmitted through an entrance into an estuary. Build-up of sediment in an entrance has the opposite effect, potentially reducing the tidal range. The build-up of sediment in the entrance during the 1980s and 1990s and subsequent change in dredging regime to remove this sediment between 2001 and 2009 provides a plausible, physical explanation for tidal range changes observed at Lakes Entrance. Further, several large fluvial floods that scoured the entrance in the 1970s can explain the occurrence of tidal ranges similar to present-day values in the early part of the Lakes Entrance tide gauge record (Fig. 1).
Before 2008, dredging was undertaken by side casting dredges that operated whenever conditions allowed and moved sand from the channel a short distance to one side or the other of the dredge. During this period, sand built up in the entrance following several large fluvial floods in the 1970s that scoured the entrance. Since 2009, the local port authority has introduced and maintained a new dredging regime aimed at maintaining a channel of constant depth to improve vessel safety and port access (Gippsland Ports 2013). This present dredging regime operates to a target depth of 4.5 m below the lowest astronomical tide, using a trailing suction hopper dredge on a year-round basis (Gippsland Ports 2021). This is substantially deeper than the reported depth in the late 1990s, when a modelling study investigated ‘standard’ and ‘deeper’ channels of 1.9 and 3.0 m respectively (Walker and Andrewartha 2000). The new dredge physically moves the dredged material to a spoil ground well away from the channels, a method known to be a much more effective for maintaining navigable channels.
A more definitive attribution of changes in tidal range to dredging is not possible due to a lack of historical tide gauge data. For example, there are missing data during the period when the dredging regime changes and no pre-2009 data for other locations within the eastern Gippsland Lakes. There are also no WL data from the ocean side of, or within, the entrance channel pre-2009. This inhibits our ability to directly attribute changes in tidal range to dredging as has been done in other studies internationally (e.g. Ralston et al. 2019). Hydrodynamic modelling could help independently test the findings presented here and help isolate the likely causes of localised tidal range changes at Lakes Entrance. However, the agreement between the observed changes in tidal range at Lakes Entrance and the expected hydraulic response to changes in channel depth suggest that changes to dredging regime is the most likely explanation for the changes in tidal range.
4.5. Impact of tidal and MSL variability and changes on coastal flood hazards
To quantify how changes in tides and MSL have affected coastal flood frequencies in Lakes Entrance, we construct several counterfactual WL time series. These represent what WLs may have been if certain observed changes in WL had not occurred. These are conceptually analogous to tidal analyses that represent estimates of WLs if average meteorological and oceanographic conditions (i.e. no storm surges) persisted for the entire analysis period (Ray and Foster 2016; Hague and Taylor 2021). The counterfactuals we define broadly fit into two categories – those that investigate the effects of MSL changes only, and those that investigate the effects of tidal range changes. This second category also includes counterfactuals that consider changes in both tidal range and MSL. These are used to understand how MSL and tides have varied over time and how these changes compare to other sources of sea-level variability.
The construction of counterfactuals that decompose observed daily maximum WLs into sums of different sea-level components follows:
where TL represents the tidal levels, relative to annual MSL, from harmonic tidal analysis; and is a constant MSL that relates the mean WL (computed based on hourly values) over the full data period to the tide gauge datum. In this case, the AHD is used. Two types of MSL variations, ∆MSL, are considered: those due to linear trend (ΔMSLtrend) and the variability of annual means about this linear trend (ΔMSLvar). We estimate ΔMSLtrend as described in Section 4.2 (i.e. Fig. 4d), interpolated to daily frequency. The ΔMSLvar is computed as the difference between this interpolated trend and observed annual MSL of the relevant year, with a positive value indicating that the observed annual MSL is higher than expected based on the trend. This allows the counterfactuals to distinguish between MSL trends and MSL variability. Our assumption is that, over the period of record, the effects of the known acceleration in SLR are relatively small, and cannot easily be assessed using a relatively short record (Haigh et al. 2014). The skew surge represents the non-tidal contributions to daily maximum WLs as defined in Section 2.2.
The counterfactuals (CF) are then derived by removing or swapping out specific sea-level components. In counterfactual 1 (CF 1), tidal levels based on year-by-year tidal analysis are swapped out for the tidal levels based on the pre-2009 analysis (refer Section 2.2). Hence, CF1 represents a timeseries of WLs that could have feasibly been observed had the tidal influences on Lakes Entrance experienced during the 1994–2001 period persisted throughout the 2009–2021 period. Further counterfactuals are defined by altering the ΔMSLtrend and ΔMSLvar terms, or both. The CF2 and CF3 represent WLs (in the observed and CF1 timeseries respectively) that may have occurred without the linear trend in MSL (i.e. ΔMSLtrend = 0). The CF4 and CF5 represent WLs (in the observed and CF1 timeseries respectively) that may have occurred without any year-to-year variability in MSL (i.e. ΔMSLvar = 0). Finally, CF6 and CF7 represent WLs (in the observed and CF1 timeseries respectively) that may have occurred if MSL had remained constant (i.e. ΔMSLtrend = ΔMSLvar = 0). Hence, these timeseries allow quantification of the individual and collective contributions of changes in tides, MSL rise and MSL variability to change in coastal flood frequencies at Lakes Entrance over the 2009–2022 period.
Partitioning sea levels into mean, tidal and non-tidal components is not trivial, and results can differ between different analyses if changes in MSL are characterised differently (Hague and Taylor 2021). As this is effectively definitional, following from the conceptual models of tidal flooding employed, it is difficult to explicitly assess uncertainty in counterfactuals resulting from these choices. The degree to which uncertainty is introduced into these counterfactuals based on the annual variability of tidal constituents can be assessed by considering Fig. 4f. In this analysis, all variability in annual MSL on tidal heights is removed (by virtue of computing a range). The variability in estimates of HAT–LAT tidal range is very small after 2009. Prior to 2009 the variability is larger but still much smaller than the estimated change in tidal range. This year-to-year variability in tidal range could be physically plausible if the intermittent dredging regime prior to 2009 led to inconsistent tidal ranges between years (e.g. as discussed in Section 4.4). Alternatively, it could be an artefact of the inherent sensitivity of harmonic analysis to methodological choices (e.g. as discussed by Li et al. 2021). In any case, this represents a minor source of uncertainty because the change in tidal properties is much larger than the variability in tidal properties before and after the step-change (de Leo et al. 2022).
Following the flood days approach introduced in Section 4.2, we can consider exceedances of the 0.70 m threshold under the various counterfactual scenarios to determine the relative importance of SLR, tidal range changes and MSL variability on the number and intensity of flood days at Lakes Entrance since 2009. We define mutually exclusive subsets of coastal flood days by which events appear in which counterfactuals (Fig. 7a). This means we can categorise each recorded flood day as having occurred due to tidal range change, sea-level rise, sea-level variability or none or some combination of these factors (Supplementary Table S3).
Nuisance flood threshold exceedances categorised based on exceedances in counterfactuals: (a) how annual flood days were classified with accompanying overall flood days in each category over 2009–2022 and (b) break-down of flood days by category in each year over 2009–2022. In both, black shading denotes that flood day would not have occurred without one of the mean sea-level trend (MSL trend) or tidal range change (TR) having occurred. Brown shading denotes that TR change, but not the MSL trend, can explain why a flood day has occurred. Red shading denotes that the MSL trend, but not the TR change, can explain why a flood day has occurred. Orange shading denotes that the coinciding presence of both TR changes and the MSL trends are required to explain a flood day. Grey shading denotes that a flood day could not be attributed to either TR changes or the MSL trend. These are separated into events that would not have occurred without large annual MSL variability (darker grey) and those that would have occurred in the pre-2009 tide regime due to the combined effects of the 1994–2001 tides and the observed skew surge (lighter grey).
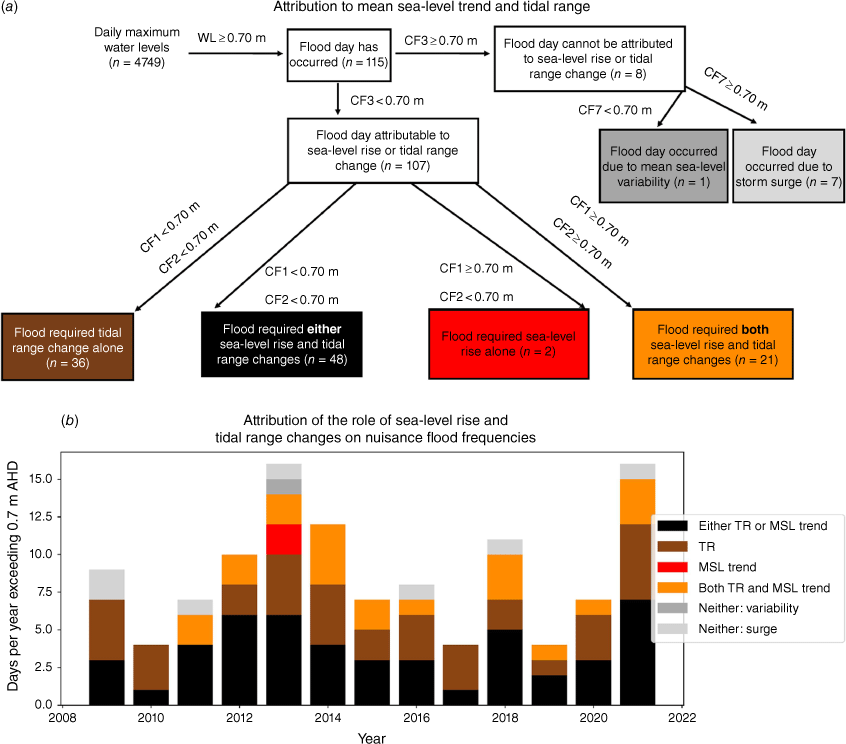
Comparing counterfactual WL timeseries to the observed WLs shows that 107 out of 115 (93%) nuisance flood days recorded since 2009 would not have occurred without changes in tidal range or increases in MSL (Fig. 7a). Of these 107 days, 84 (79%) would not have occurred in the absence of changes in tidal range, whereas 50 (47%) would not have occurred if MSL had not increased. Twenty-one events (20%) would not have occurred without both SLR and tidal range changing. This means that 48 nuisance flood days (45%) would not have occurred without either tidal range changes or SLR, regardless of which it was. Hence, the effect of tidal range changes on the number of nuisance flood days is greater than the effect of SLR over the period of study.
Tidal range change may be the primary factor driving trends in nuisance flood days, but SLR has made flooding more severe across all days. Having SLR in addition to tidal range changes has led to a substantial increase in the maximum WLs during these events. Of the 36 days where tidal range change allows flooding to occur based on the counterfactual scenarios, the average daily maximum WL on flood days is 5.5 cm higher on average in CF1 (only tidal range change removed) than in CF3 (both tidal range change and SLR trend removed). The flood duration, the number of hours when WLs exceed the 0.70 m level, is also increased by SLR. Under CF2, 139 flood hours are estimated, whereas 326 flood hours were recorded in the observed WL timeseries. Hence, there are 187 additional hours of nuisance flooding associated with SLR. This is important as flood damage has been shown to be a function of both flood height and flood duration (Thieken et al. 2005).
5.Discussion: the importance of considering tidal processes and flood thresholds in future estuarine flood risk assessments
Our results demonstrate the importance of explicitly considering tidal processes in assessments of compound and coastal flood hazards in estuaries. There are two facets to this. Firstly, the modulations in coastal flood days caused by daily, monthly, annual and multi-annual variability and trends in tidal amplitude cannot be neglected in coastal flood hazard assessments. Increases in flood days at Lakes Entrance have primarily occurred because of changes in tidal range, not changes in MSL or storm surge magnitudes. Similarly, variations in tidal extremes on annual and monthly timescales are better correlated with flood frequencies than variations in extreme skew surges. Secondly, relating flood thresholds to the typical heights of tides provides a basis to understand which locations are most vulnerable to frequent flooding at some point in time. For example, the Lakes Entrance nuisance flood level used here is much closer to the high tide level (i.e. smaller freeboard) than other locations in southern Australia, despite having similar tidal ranges and skew surge magnitudes (Hague et al. 2022). This means weather systems with storm surges that are too small to cause flooding at Melbourne can still cause flooding at Lakes Entrance.
This difference in flood levels also has implications for how changes in tidal range have affected flood days at Lakes Entrance. If the flood level at Lakes Entrance sat 30 cm above HAT then the impact of tidal range changes on flood hazards would not be detectable. This indicates that further work is required to link observed (e.g. Section 3) and projected (e.g. Harker et al. 2019) tidal range changes and SLR to changes in flood frequency. Similarly, future research on the relative contributions of oceanic and riverine processes to flood hazards must also consider how the magnitude of individual and summed components compare to flood levels. For example, it has been argued that Lakes Entrance has lower flood risk than most other locations due to rainfall and storm surges being independent (Wu et al. 2018). Such comparative analysis ignores a critical aspect of flood hazards – that less rain and smaller storm surges are required to cause the same flood impacts at Lakes Entrance than many other Australian locations.
Extreme coastal WLs at Lakes Entrance are expected to continue to increase in line with increases in global MSL and mean coastal WLs (McInnes et al. 2009). This means that the combinations of storm surges and tides that have led to nuisance flooding in recent years will lead to more extreme floods in the future. Understanding where flood thresholds sit relative to tide levels can be used to explore the implications of changes in tides and MSL on future flood hazards at Lakes Entrance. For example, major flooding could be expected to occur at the same frequency as nuisance flooding does today under 0.6 m SLR as the major flood level sits 0.6 m above the nuisance flood level. The Victorian Government planning policies (Department of Environment Land Water and Planning 2020) indicate that 0.8 m SLR by 2100 should be allowed for in planning decisions. This means that before 2100, major flooding might be expected to occur more frequently than nuisance flooding does today.
The science upon which these policies are based (e.g. McInnes et al. 2009, 2015) does not consider tidal range-driven changes in sea-level variability. More generally, most assessments (e.g. McInnes et al. 2015; Fox-Kemper et al. 2021) assume that climate change only manifests as an increase in the MSL and that extreme sea levels do not become more or less extreme relative to this changing mean. McInnes et al. (2009) is a notable exception to this, although only changes in sea-level variability due to changes in coastal winds are considered. Furthermore, a reliance on pre-2010 data in the Australian studies means that past changes in tidal range at Lakes Entrance have not been considered. In this context, the 0.11 m increase in spring tide heights means that 0.11 m less SLR is required for the emergence future extreme sea-level events, or future changes in flood rates at Lakes Entrance than implied by this modelling. However, the stabilisation of tidal ranges since 2009 suggests that this gap will not continue to widen in the future. Regardless, flood hazards at Lakes Entrance are likely under-estimated in the currently available studies that underpin policy guidance.
This study highlights the need for further investigation into past sea-level variability changes and how these may affect evolving flood hazards under SLR. Future changes in tidal range have been assessed for some Australian locations (Devlin et al. 2017a; Harker et al. 2019) but the significance of these for coastal flood frequencies is yet to be assessed nationally. Some studies have projected future changes in storm surges due to changing weather patterns (McInnes et al. 2009; Colberg et al. 2019), but none have quantitatively assessed how such changes would affect exceedances of known coastal flood thresholds. It is also possible that other Australian locations may have experienced large tidal range changes but are undocumented.
A key limitation to conducting the research proposed above is the lack of coastal flood thresholds, especially for moderate and major estuarine floods. This has meant that most past coastal flood hazard assessments have had to infer flood hazards based on statistical metrics of sea-level extremes or variability. This means one must assume that coastal floods of the same severity all occur at the same frequency right across Australia. This is a poor assumption for minor flooding in Australia (Hague et al. 2022) but has not yet been tested systematically for moderate and major floods, due to a lack of impact-based flood thresholds for these severities. For example, Lakes Entrance is one of only a few Australia coastal locations for which an impact-based major flood level is defined (Bureau of Meteorology 2013). Without flood thresholds the relationships between the heights and frequencies of extreme WLs and their associated impacts remain unstudied. Recent efforts to define impact-based minor flood thresholds (Hague et al. 2019, 2022) provide an opportunity for these more extreme flood levels to be defined in a nationally consistent and impact-based way. These efforts will be essential to inform future planning and emergency management responses to Australia’s changing coastal flood risk.
6.Conclusion
We combined a new national assessment of tidal range changes with coastal impact reports to demonstrate the effect of changes in tides on coastal flood frequencies at Lakes Entrance, Victoria, Australia. The analysis shows that 93% of nuisance flood days (associated with short-duration inundation of residential streets, car parks and footpaths) since 2009 can be attributed to one or both of MSL rise and tidal range changes. Although missing data have limited our ability to be conclusive about these findings, comparisons to other locations give us confidence that the changes in tidal range at Lakes Entrance are most likely due to local effects, consistent with the contemporaneous change in dredging regime.
Our results highlight several aspects of present-day and future flood hazards that should be considered more broadly in Australian studies. Firstly, changes in tidal range can have a comparable effect to changes in MSL on flood frequencies. Currently almost all studies assume that sea-level variability will not change in future, meaning flood hazards are underestimated at locations where tidal range has increased. Secondly, whether changes in tidal range lead to changes in flood frequency depends on how close high tide levels are to flood thresholds. This suggests the need for future work to assess how observed and projected changes in sea-level variability will affect coastal flood frequencies by incorporating coastal impact information in flood hazard assessments.
Data availability
Most of the data used in this study are available in Hague et al. (2021). Data from 2020 to 2021 will be shared upon reasonable request to the corresponding author with permission from Gippsland Ports.
Acknowledgements
The authors thank Gippsland Ports for ongoing provision of water level data to the Bureau of Meteorology that was used in this study. The authors thank Huy Tran and Sharmila Sur, and two anonymous reviewers and the Associate Editor from JSHESS, for constructive reviews on an earlier version of this manuscript.
References
Araújo IB, Dias JM, Pugh DT (2008) Model simulations of tidal changes in a coastal lagoon, the Ria de Aveiro (Portugal). Continental Shelf Research 28(8), 1010-1025.
| Crossref | Google Scholar |
Batstone C, Lawless M, Tawn J, et al. (2013) A UK best-practice approach for extreme sea-level analysis along complex topographic coastlines. Ocean Engineering 71, 28-39.
| Crossref | Google Scholar |
Bishop W, Womersley T, Mawer J, et al. (2014) Report 2: inundation hazard. Gippsland Lakes/90 Mile Beach Local Coastal Hazard Assessment Project. April 2014. Report 2363-01 / R02 v04 Final. (Water Technology Pty Ltd: Melbourne, Vic., Australia) Available at https://www.marineandcoasts.vic.gov.au/__data/assets/pdf_file/0016/415132/2363-01R02v04_Inundation-Gips-L.pdf
Bureau of Meteorology (2013) Service level specification for flood forecasting and warning services for Victoria. (Commonwealth of Australia) Available at http://www.bom.gov.au/vic/flood/brochures/VIC_SLS_current.pdf
Colberg F, McInnes KL, O’Grady J, et al. (2019) Atmospheric circulation changes and their impact on extreme sea levels around Australia. Natural Hazards and Earth System Sciences 19(5), 1067-1086.
| Crossref | Google Scholar |
Coller MLF, Wheeler P, Kunapo J, et al. (2018) Interactive flood hazard visualisation in Adobe Flash. Journal of Flood Risk Management 11, S134-S146.
| Crossref | Google Scholar |
De Leo F, Talke SA, Orton PM, et al. (2022) The effect of harbor developments on future high-tide flooding in Miami, Florida. Journal of Geophysical Research: Oceans 127(7), e2022JC018496.
| Crossref | Google Scholar |
Department of Environment Land Water and Planning (2020) Marine and Coastal Policy. (State of Victoria) Available at https://www.marineandcoasts.vic.gov.au/__data/assets/pdf_file/0027/456534/Marine-and-Coastal-Policy_Full.pdf
Devlin AT, Jay DA, Talke SA, et al. (2014) Can tidal perturbations associated with sea level variations in the western Pacific Ocean be used to understand future effects of tidal evolution? Ocean Dynamics 64(8), 1093-1120.
| Crossref | Google Scholar |
Devlin AT, Jay DA, Zaron ED, et al. (2017a) Tidal variability related to sea level variability in the Pacific Ocean. Journal of Geophysical Research: Oceans 122(11), 8445-8463.
| Crossref | Google Scholar |
Devlin AT, Jay DA, Talke SA, et al. (2017b) Coupling of sea level and tidal range changes, with implications for future water levels. Scientific Reports 7(1), 17021.
| Crossref | Google Scholar |
Dusek G, Sweet WV, Widlansky MJ, et al. (2022) A novel statistical approach to predict seasonal high tide flooding. Frontiers in Marine Science 9, 1073792.
| Crossref | Google Scholar |
Fox-Kemper B, Hewitt HT, Xiao C, et al. (2021) Ocean, cryosphere and sea level change. In ‘Climate Change 2021: The Physical Science Basis. Contribution of Working Group I to the Sixth Assessment Report of the Intergovernmental Panel on Climate Change’. (Eds V Masson-Delmotte, P Zhai, A Pirani, SL Connors, C Péan, S Berger, N Caud, Y Chen, L Goldfarb, MI Gomis, M Huang, K Leitzell, E Lonnoy, JBR Matthews, TK Maycock, T Waterfield, O Yelekçi, R Yu, B Zhou) pp. 1211–1362. (Cambridge University Press) 10.1017/9781009157896.011.1212
Gippsland Ports (2013) Gippsland Lakes Ocean Access: Long Term Monitoring and Management Plan Maintenance Dredging with Ocean Disposal 2013–2023. (Gippsland Ports: Bairnsdale, Vic., Australia) Available at https://www.gippslandports.vic.gov.au/wp-content/uploads/2019/11/2013-gloa-ltmmp-2013-23-revb-final.pdf
Gippsland Ports (2021) History of dredging the entrance to Gippsland Lakes. (Gippsland Ports) Available at http://www.gippslandports.vic.gov.au/wp-content/uploads/2020/06/dredging-facts-sheet_apr2021.pdf
Gold A, Anarde K, Grimley L, et al. (2023) Data from the drain: a sensor framework that captures multiple drivers of chronic coastal floods. Water Resources Research 59, e2022WR032392.
| Crossref | Google Scholar |
Habel S, Fletcher CH, Anderson TR, et al. (2020) Sea-level rise induced multi-mechanism flooding and contribution to urban infrastructure failure. Scientific Reports 10(1), 3796.
| Crossref | Google Scholar |
Hague BS, Taylor AJ (2021) Tide-only inundation: a metric to quantify the contribution of tides to coastal inundation under sea-level rise. Natural Hazards 107(1), 675-695.
| Crossref | Google Scholar |
Hague BS, Murphy BF, Jones DA, et al. (2019) Developing impact-based thresholds for coastal inundation from tide gauge observations. Journal of Southern Hemisphere Earth Systems Science 69(1), 252-272.
| Crossref | Google Scholar |
Hague BS, Jones DA, Trewin B, et al. (2021) ANCHORS: a multi-decadal tide gauge dataset to monitor Australian relative sea level changes. Geoscience Data Journal 9, 256-272.
| Crossref | Google Scholar |
Hague BS, Jones DA, Jakob D, et al. (2022) Australian coastal flooding trends and forcing factors. Earth’s Future 10(2), e2021EF002483.
| Crossref | Google Scholar |
Haigh ID, Wahl T, Rohling EJ, et al. (2014) Timescales for detecting a significant acceleration in sea level rise. Nature Communications 5, 3635.
| Crossref | Google Scholar |
Haigh ID, Pickering MD, Green JAM, et al. (2020) The tides they are a-changin’: a comprehensive review of past and future nonastronomical changes in tides, their driving mechanisms, and future implications. Reviews of Geophysics 58(1), e2018RG000636.
| Crossref | Google Scholar |
Haigh ID, Marcos M, Talke SA, et al. (2022) GESLA version 3: a major update to the global higher-frequency sea-level dataset. Geoscience Data Journal [Published online early 8 September 2022].
| Crossref | Google Scholar |
Harker A, Green JAM, Schindelegger M, et al. (2019) The impact of sea-level rise on tidal characteristics around Australia. Ocean Science 15(1), 147-159.
| Crossref | Google Scholar |
Helaire LT, Talke SA, Jay DA, et al. (2019) Historical changes in Lower Columbia River and Estuary floods: a numerical study. Journal of Geophysical Research: Oceans 124(11), 7926-7946.
| Crossref | Google Scholar |
Leonard M, Westra S, Phatak A, et al. (2014) A compound event framework for understanding extreme impacts. WIREs Climate Change 5, 113-128.
| Crossref | Google Scholar |
Li S, Wahl T, Talke SA, et al. (2021) Evolving tides aggravate nuisance flooding along the US coastline. Science Advances 7(10), eabe2412.
| Crossref | Google Scholar |
Long X, Widlansky MJ, Spillman CM, et al. (2021) Seasonal forecasting skill of sea-level anomalies in a multi-model prediction framework. Journal of Geophysical Research: Oceans 126(6), e2020JC017060.
| Crossref | Google Scholar |
Lowe RJ, Cuttler MVW, Hansen JE (2021) Climatic drivers of extreme sea level events along the coastline of Western Australia. Earth’s Future 9(4), e2020EF001620.
| Crossref | Google Scholar |
Mawdsley RJ, Haigh ID, Wells NC (2015) Global secular changes in different tidal high water, low water and range levels. Earth’s Future 3(2), 66-81.
| Crossref | Google Scholar |
McInnes KL, Macadam I, Hubbert GD, et al. (2009) A modelling approach for estimating the frequency of sea level extremes and the impact of climate change in southeast Australia. Natural Hazards 51, 115-137.
| Crossref | Google Scholar |
McInnes KL, Church J, Monselesan D, et al. (2015) Information for australian impact and adaptation planning in response to sea-level rise. Australian Meteorological and Oceanographic Journal 65(1), 127-149.
| Crossref | Google Scholar |
McInnes KL, White CJ, Haigh ID, et al. (2016) Natural hazards in Australia: sea level and coastal extremes. Climatic Change 139(1), 69-83.
| Crossref | Google Scholar |
Moftakhari HR, Jay DA, Talke SA, et al. (2013) A novel approach to flow estimation in tidal rivers. Water Resources Research 49(8), 4817-4832.
| Crossref | Google Scholar |
Muis S, Haigh ID, Guimarães Nobre G, et al. (2018) Influence of El Niño–Southern Oscillation on global coastal flooding. Earth’s Future 6(9), 1311-1322.
| Crossref | Google Scholar |
Pareja‐Roman LF, Orton PM, Talke SA (2023) Effect of estuary urbanization on tidal dynamics and high tide flooding in a coastal lagoon. Journal of Geophysical Research: Oceans 128(1), e2022JC018777.
| Crossref | Google Scholar |
Passeri DL, Hagen SC, Plant NG, et al. (2016) Tidal hydrodynamics under future sea level rise and coastal morphology in the northern Gulf of Mexico. Earth’s Future 4(5), 159-176.
| Crossref | Google Scholar |
Ralston DK, Talke S, Geyer WR, et al. (2019) Bigger tides, less flooding: effects of dredging on barotropic dynamics in a highly modified estuary. Journal of Geophysical Research: Oceans 124(1), 196-211.
| Crossref | Google Scholar |
Ray RD, Foster G (2016) Future nuisance flooding at Boston caused by astronomical tides alone. Earth’s Future 4(12), 578-587.
| Crossref | Google Scholar |
Ray RD, Merrifield MA (2019) The semiannual and 4.4-year modulations of extreme high tides. Journal of Geophysical Research: Oceans 124(8), 5907-5922.
| Crossref | Google Scholar |
Ritman M, Hague B, Katea T, et al. (2022) Past and future coastal flooding in Pacific small-island nations: insights from the Pacific Sea Level and Geodetic Monitoring Project tide gauges. Journal of Southern Hemisphere Earth Systems Science 72, 202-217.
| Crossref | Google Scholar |
Rueda A, Vitousek S, Camus P, et al. (2017) A global classification of coastal flood hazard climates associated with large-scale oceanographic forcing. Scientific Reports 7(1), 5038.
| Crossref | Google Scholar |
State Emergency Service (2012) East Gippsland Shire Flood Emergency Plan. (State Emergency Service, State of Victoria) Available at https://www.ses.vic.gov.au/documents/8655930/9320058/East+Gippsland+Municipal+Flood+Emergency+Plan+-+Gippsland+Lakes.pdf/0f808192-d354-58ba-5b76-1385eb1bef10
Sweet WV, Park J (2014) From the extreme to the mean: acceleration and tipping points of coastal inundation from sea level rise. Earth’s Future 2(12), 579-600.
| Crossref | Google Scholar |
Talke SA, Jay DA (2020) Changing tides: the role of natural and anthropogenic factors. Annual Review of Marine Science 12, 121-151.
| Crossref | Google Scholar |
Talke SA, Mahedy A, Jay DA, et al. (2020) Sea level, tidal, and river flow trends in the Lower Columbia River Estuary, 1853–present. Journal of Geophysical Research: Oceans 125(3), e2019JC015656.
| Crossref | Google Scholar |
Talke SA, Familkhalili R, Jay DA (2021) The influence of channel deepening on tides, river discharge effects, and storm surge. Journal of Geophysical Research: Oceans 126(5), e2020JC016328.
| Crossref | Google Scholar |
Tan K-S, Chiew FHS, Grayson RB (2007) A steepness index unit volume flood hydrograph approach for sub-daily flow disaggregation. Hydrological Processes 21, 2807-2816.
| Crossref | Google Scholar |
Tan K-S, Chiew FHS, Grayson RB (2008) Stochastic event-based approach to generate concurrent hourly mean sea level pressure and wind sequences for estuarine flood risk assessment. Journal of Hydrologic Engineering 13(6), 449-460.
| Crossref | Google Scholar |
Thieken AH, Müller M, Kreibich H, et al. (2005) Flood damage and influencing factors: new insights from the August 2002 flood in Germany. Water Resources Research 41(12), W12430.
| Crossref | Google Scholar |
Thompson PR, Widlansky MJ, Hamlington BD, et al. (2021) Rapid increases and extreme months in projections of United States high-tide flooding. Nature Climate Change 11(7), 584-590.
| Crossref | Google Scholar |
Virtanen P, Gommers R, Oliphant TE, et al. (2020) SciPy 1.0: fundamental algorithms for scientific computing in Python. Nature Methods 17(3), 261-272.
| Crossref | Google Scholar |
Walker S, Andrewartha J (2000) Gippsland Lakes Environmental Study Hydrodynamic Modelling Technical Report December 2000. Available at http://www.loveourlakes.net.au/wp-content/uploads/2015/05/Hydrodynamic-modelling.pdf
Walpole L, Ladson AR, Herron AG (2011) Estimating lake level response to wind in the Gippsland Lakes. In ‘Proceedings of the 34th World Congress of the International Association for Hydro-Environment Research and Engineering: 33rd Hydrology and Water Resources Symposium and 10th Conference on Hydraulics in Water Engineering’, 26 June–1 July 2011, Brisbane, Qld, Australia. (Eds EM Valentine, CJ Apelt, J Ball, H Chanson, R Cox, R Ettema, G Kuczera, M Lambert, BW Melville, JE Sargison) pp. 1157–1164. (Engineers Australia: Canberra, ACT, Australia) Available at https://search.informit.org/doi/10.3316/informit.335686905611617
Wheeler P (2005) Analysis of pre/post flood bathymetric change using a GIS. Applied GIS 1(3), 24.1-24.29.
| Crossref | Google Scholar |
Wheeler P, Peterson J, Gordon-Brown L (2010) Flood-tide delta morphological change at the Gippsland Lakes artificial entrance, Australia (1889–2009). Australian Geographer 41(2), 183-216.
| Crossref | Google Scholar |
Williams J, Horsburgh KJ, Williams JA, et al. (2016) Tide and skew surge independence: new insights for flood risk. Geophysical Research Letters 43(12), 6410-6417.
| Crossref | Google Scholar |
Woodworth PL (2010) A survey of recent changes in the main components of the ocean tide. Continental Shelf Research 30(15), 1680-1691.
| Crossref | Google Scholar |
Woodworth PL, Melet A, Marcos M, et al. (2019) Forcing factors affecting sea level changes at the coast. Surveys in Geophysics 40(6), 1351-1397.
| Crossref | Google Scholar |
Wu W, McInnes K, O’Grady J, et al. (2018) Mapping dependence between extreme rainfall and storm surge. Journal of Geophysical Research: Oceans 123(4), 2461-2474.
| Crossref | Google Scholar |
Zaron ED, Jay DA (2014) An analysis of secular change in tides at open-ocean sites in the Pacific. Journal of Physical Oceanography 44(7), 1704-1726.
| Crossref | Google Scholar |