Dynamics of 2015 positive Indian Ocean Dipole
Putri Adia Utari A , Mokhamad Yusup Nur Khakim B , Dedi Setiabudidaya B and Iskhaq Iskandar B CA Graduate School of Environmental Science, University of Sriwijaya, Palembang 30139, South Sumatera, Indonesia.
B Department of Physics, Faculty of Mathematics and Natural Sciences, University of Sriwijaya, Indralaya, Ogan Ilir 30662, South Sumatera, Indonesia.
C Corresponding author. Email: iskhaq@mipa.unsri.ac.id
Journal of Southern Hemisphere Earth Systems Science 69(1) 75-83 https://doi.org/10.1071/ES19002
Submitted: 17 December 2018 Accepted: 29 March 2019 Published: 11 June 2020
Journal Compilation © BoM 2019 Open Access CC BY-NC-ND
Abstract
Evolution of typical positive Indian Ocean Dipole (pIOD) event was dominated by a significant sea-surface temperature (SST) cooling in the south-eastern tropical Indian Ocean. Interestingly, during the evolution of 2015 pIOD event, the SST in the south-eastern tropical Indian Ocean did not reveal significant cooling, instead anomalous strong SST warming took place in the western tropical Indian Ocean off the East African coast. This anomalous SST warming was associated with a weakening of the Asian summer monsoon. Furthermore, analysis on the mixed layer heat budget demonstrated that the evolution of the 2015 pIOD event could be attributed mainly to the air-sea heat flux. By decomposing the air-sea heat flux, it is found that reduced latent heat loss plays an important role on the SST warming in the western pole and keeping SST warm in the eastern pole. We note that a residual term also may play a role during the initial development of the event. In contrast to the SST pattern, the subsurface temperature revealed a clear positive dipole pattern. Shallow (deep) 20°C isothermal layer in the eastern (western) equatorial Indian Ocean was observed during boreal summer. This robust subsurface dipole pattern indicated that the subsurface ocean response was largely wind driven through the equatorial wave dynamics as previously suggested.
1 Introduction
A typical positive Indian Ocean Dipole (pIOD) event, characterised by seas surface temperature anomaly (SSTA) dipole pattern with negative (positive) SSTA, was observed in the south-eastern (western) equatorial Indian Ocean (Saji et al. 1999; Webster et al. 1999). This SSTA pattern is tightly associated with surface wind pattern which may be interpreted in terms of Bjerknes-type feedback mechanism (Yamagata et al. 2004). Cooling (warming) SST in the east (west) was associated with enhanced (suppressed) sea-level pressure leading to enhance equatorial easterly wind anomalies. In response to the change in surface winds, the equatorial waves are excited (Vinayachandran et al. 2002; Feng and Meyers 2003). Along the equator, upwelling equatorial Kelvin waves were generated as a response to strong anomalous easterly winds during the peak phase of the pIOD event. Meanwhile, westward propagating downwelling Rossby waves were generated in the off-equatorial region, in particular in the south-western equatorial Indian Ocean.
Recent studies have proposed various types of the pIOD based on the pattern of the SSTA in the tropical Indian Ocean (Vinayachandran et al. 2007; Endo and Tozuka 2016; Tozuka et al. 2016). The pIOD events were not always associated with SST warming in the western equatorial Indian Ocean, instead central Indian Ocean SST warming was also found during the pIOD event. In addition, central Indian Ocean SST warming bounded by SST cooling in the eastern and western pole has been classified as a new type of the pIOD event, namely IOD Modoki event (Endo and Tozuka 2016). In addition, three types of the pIOD events have been suggested based on the SSTA evolution, namely the normal pIOD, prolonged pIOD and unseasonable pIOD events (Du et al. 2013). The unseasonable and normal pIOD types were occurring in JJA and SON season respectively. Meanwhile, the evolution of prolonged pIOD type started in May–June, matured in July–September and terminated in October–November. Consequently, various SSTA patterns associated with various types of the pIOD events have induced different impact on the land precipitation surrounding the Indian Ocean (Weller et al. 2014).
Previous studies have shown that strong El Niño event in the tropical Pacific co-occurred with a strong pIOD event in the tropical Indian Ocean (Murtugudde et al. 2000; Yu and Rienecker 2000). During 2015, however, the tropical Indian Ocean experienced a unique condition. This weak pIOD event was associated with the strongest El Niño event of the 21st century occurring during boreal summer 2015 until boreal spring 2016 (Santoso et al. 2017). Note that previous studies have shown that the 2015–16 El Niño is a combination of typical and central Pacific El Niño types (Paek et al. 2017; Lim et al. 2017; Xue and Kumar 2017; Brainard et al. 2018; Tao et al. 2015; Su et al. 2017). A strong SST warming was observed in the western basin, whereas relatively weak cooling was occurring in the eastern basin (Liu et al. 2017). Therefore, this study designed to examine the unique evolution of the SSTA in the tropical Indian Ocean during boreal summer and fall 2015. In contrast to the previous study that had examined the evolution of SSTA in the tropical Indian Ocean in term of El Niño impact (Liu et al. 2017), our study here is focusing on the inherent dynamics and thermodynamics processes of the Indian Ocean.
The remainder of the paper is organised as follows. Section 2 describes the observational data sets used in the study. In Section 3, we evaluated the dynamics of the evolution of the 2015 pIOD event. The subsurface evolution of the 2015 pIOD event was also evaluated. Finally, a summary and discussion of the results is presented in the last section.
2 Data and method
Daily Optimum Interpolated SST based on the Advanced Very High Resolution Radiometer from National Oceanographic and Atmospheric Administration was used in this study (Banzon et al. 2016; Reynolds et al. 2007). The data have uniform spatial resolution of 0.25 × 0.25° and we used data for a period of January 1982 to December 2015. Monthly near-surface current data from the Ocean Surface Current Analysis-Realtime (OSCAR) project were also used in this study (Bonjean and Lagerloef 2002). The data having 1 × 1° spatial resolution for a period of January 1993 to December 2015 were used.
In addition, the wind fields and surface heat flux data were obtained from the National Centers for Environmental Prediction – National Center for Atmospheric Research Reanalysis-1 (Kistler et al. 1999). The period used was from January 1982 to December 2015 with horizontal resolution of 0.5 × 0.5°. The subsurface temperature and salinity data were from ARGO gridded product. For more details on the data processing gridding methods, interested readers are referred to Lebedev et al. (2007). The data were obtained from the Asia-Pacific Data-Research Center University of Hawaii with uniform horizontal resolutions of 1 × 1°. We utilised data from January 2005 to December 2015.
Following (Saji et al. 1999) the Dipole Mode Index (DMI) was calculated based on the difference of the SSTA between the western equatorial Indian Ocean (10°S–10°N and 50–70°E) and the south-eastern equatorial Indian Ocean (0–10°S and 90–110°E). Note that mean climatology for all variables were calculated based on the period of January 1982 to December 2015 except for the ARGO data which was calculated based on the period of January 2005–December 2015. The anomalies for all variables are then calculated as the deviation from their respective mean climatology.
3 Results
3.1 Evolution of the 2015 positive Indian Ocean Dipole
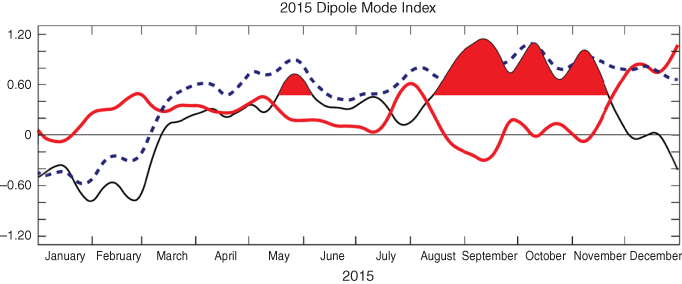
The DMI time series shows an evolution of the 2015 pIOD event (Fig. 1). Unlike a typical pIOD event that is dominated by a cooling in the south-eastern pole, warming in the western pole controlled the evolution of 2015 pIOD event. The SST warming in the western pole initially started in March 2015, with a short weakening in June before it continued to develop throughout a year and lasted until spring 2016. On the other hand, the SST cooling in the south-eastern pole only showed a relatively short and weak cooling event in August–September 2015. The DMI revealed a pIOD condition for about 4 months when the DMI exceeded its one standard deviation (0.47). It developed in early August and rapidly terminated in late-November. We noted that there were short-term variabilities modulating the magnitude of the DMI in late-September and late-October.
|
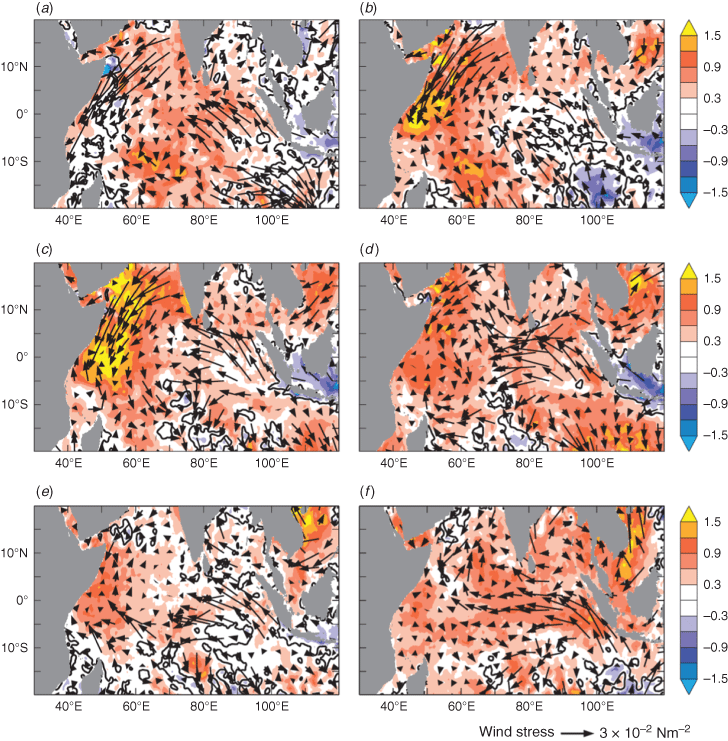
The corresponding basin-wide evolution of ocean-atmosphere conditions is shown in Fig. 2. In July, the equatorial easterly anomalies have been fully developed in the eastern Indian Ocean equatorial Indian Ocean, whereas strong alongshore-north-easterly wind anomalies were observed off north-eastern coast of Africa (Fig. 2a). These strong north-easterly anomalies were associated with a weak Asian summer monsoon (Kawamura 1998; Izumo et al. 2008; Boschat et al. 2012; De Boyer Montégut et al. 2007). The oceanic response to the easterly anomalies was shown by a cooling SSTA in the eastern Indian Ocean off south Java, whereas a warming SSTA were observed in the north-eastern Indian Ocean. The easterly wind anomalies in the eastern Indian Ocean and north-easterly wind anomalies in the north-western Indian Ocean were strengthened in the following months (Fig. 2b, c). Interestingly, although SSTA in the eastern equatorial Indian Ocean did not show a clear cooling event, robust warming event were observed in the north-western Indian Ocean. The SSTA contrast between the western and eastern parts made the DMI in 2015 different from previous pIOD events. It was noted that the SSTA pattern did not show clear typical pIOD pattern such as in 2006 (Horii et al. 2008). The easterly wind anomalies in the eastern equatorial Indian Ocean continued to be strengthened even until December. However, the cooling SSTA was diminished there, and it has already become positive anomaly in October (Fig. 2d). We still observed the SSTA difference between the western and eastern Indian Ocean until November, although basin-wide warming was observed from October. Meanwhile, the warming in the north-western Indian Ocean gradually decreased as the north-easterly anomalies were weakened in October before they reversed their direction in November (Fig. 2d, e). The SSTA gradient in the equatorial Indian Ocean waned after November and a uniform Indian Ocean warming was clearly observed in December, a bit early than the usual Indian Ocean warming following the strong El Niño event (Yu and Rienecker 2000).
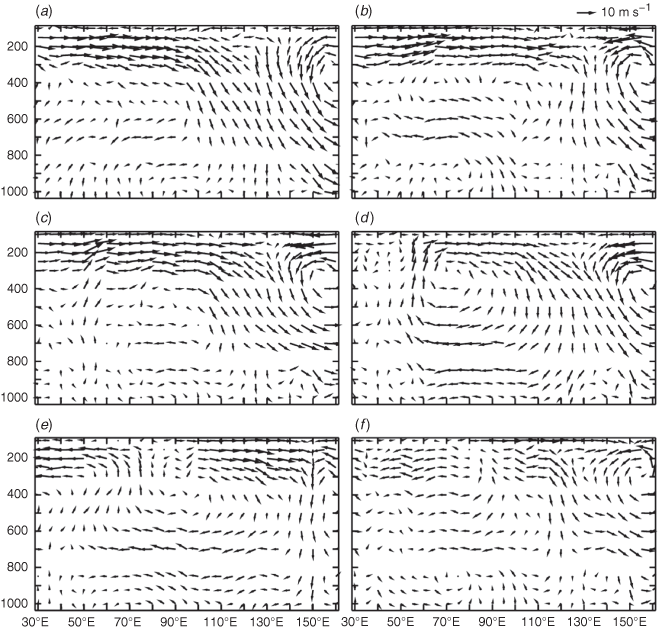
The anomalous Walker Circulation revealed the atmospheric response to the SSTA pattern in the tropical Indian Ocean during 2015 (Fig. 3). Note that the Walker Circulation is defined as a zonal-vertical circulation averaged between 5°S and 5°N. When plotting the figure, we multiplied the vertical velocity by 100. As previously suggested by Tozuka et al. (2016), the canonical pIOD is characterised by a single cell of the Walker Circulation centred at about 80°E and 400 hPa. Strong downward motion was observed over the Maritime Continent from July to October (Fig. 3a–d) before it was weakened in November (Fig. 3e). An upward motion was observed over the western equatorial Indian Ocean from September collocated with the maximum SSTA (Fig. 3c). A clear Walker Circulation cell, characterised by downward (upward) motion in the eastern (western) equatorial Indian Ocean and westerly (easterly) wind anomaly in the upper (lower) troposphere, was observed in October (Fig. 3d). Note that the descending branch observed in the far eastern part of the Maritime Continent was associated with the evolution a strong El Niño event in the tropical Pacific Ocean (Liu et al. 2017).
3.2 Subsurface evolution of the 2015 positive Indian Ocean Dipole
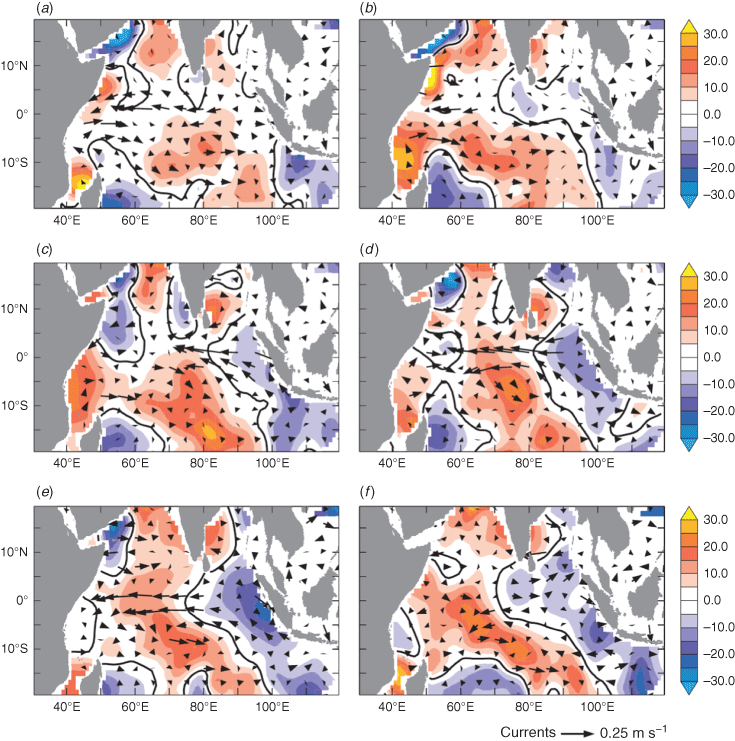
In contrast to the surface pattern, the subsurface pIOD pattern was clearly observed in 2015 (Fig. 4). Previous studies have shown that the subsurface IOD is governed by the equatorial wave dynamics (Murtugudde et al. 2000; Rao et al. 2002). In response to enhanced easterly anomalies in the eastern equatorial Indian Ocean in July–August (Fig. 2a, b), upwelling equatorial Kelvin waves and downwelling off equatorial Rossby waves were generated, that was indicated by elevated the depth of 20°C isotherm (D20) in the eastern basin and deepened D20 in the off equatorial region (Fig. 4a, b). The downwelling Rossby waves propagated westward and deepened the D20 there (Fig. 4b–d). Meanwhile, the upwelling equatorial Kelvin waves propagated eastward, and once they reached the eastern boundary, some of their energy were reflected back into Indian Ocean as upwelling Rossby waves, and the remaining was propagated southward and northward along the eastern boundary (Fig. 4b–d). Similarly, the near surface currents were also in agreement with the surface wind patterns. Westward current anomalies observed in the along the equator were associated with the peak of easterly wind anomalies in September–November (Fig. 4c–e). Note that this clear subsurface pIOD pattern during 2015 indicated that the subsurface ocean response was largely wind driven. In addition, we can also see that during 2015 the subsurface pIOD pattern lasted longer than the surface pattern.
Figure 5 shows the time series of DMI and subsurface DMI (SDMI) for a period of January 2005 to December 2015. Here, we defined the SDMI as the difference between the depth of D20 in western equatorial Indian Ocean (10°S–10°N and 50–70°E) and its eastern counterpart (0–10°S and 90–110°E). It is shown that most of the surface IOD signals can be represented by the subsurface IOD signals except in 2012.

|
Previous studies have suggested that surface heat flux play an important role on the evolution of surface pIOD events (Murtugudde et al. 2000; Horii et al. 2008), whereas the subsurface dipole is more related to the wind-forced ocean dynamics (Rao et al. 2002; Shinoda et al. 2004). The time series of DMI and SDMI further show clearly the different in time evolution of the surface and subsurface IOD events.
3.3 Mixed layer heat budget
In order to evaluate the mechanism leading to a unique SSTA pattern associated with 2015 pIOD event, mixed layer heat budget analysis was conducted for the eastern and western poles. The temperature equation was adopted form previous studies (Vialard et al. 2008; Iskandar et al. 2013). A simplified form of the mixed layer heat budget is defined as

In this study, we used SST as a proxy for the temperature of the mixed layer (Horii et al. 2013). The mixed layer depth (MLD), indicated by h, was computed using monthly temperature and salinity profiles during January 2005–December 2015 from ARGO floats. A density criterion was used to estimate the MLD in which the MLD was defined when the density is 0.2 kg m−3 larger than the surface density (Kumar et al. 2012). Here, ρ and Cp are the density and specific heat capacity of seawater respectively. Here, u and v are defined as the mixed layer zonal and meridional currents respectively. In this study, the mixed layer currents were estimated using the OSCAR data that represent the currents at about 15 m depth (Bonjean and Lagerloef 2002). The net surface heat flux is defined the sum of surface heat flux (Q0) and the penetrative component of shortwave radiation through the base of the mixed layer (Qpen). Note that the total surface heat flux (Q0) consists of shortwave and long wave radiation, latent and sensible heat flux, and it is defined as

Meanwhile, the vertical entrainment, diffusion terms and error in computation are considered as the residual term in our calculation.
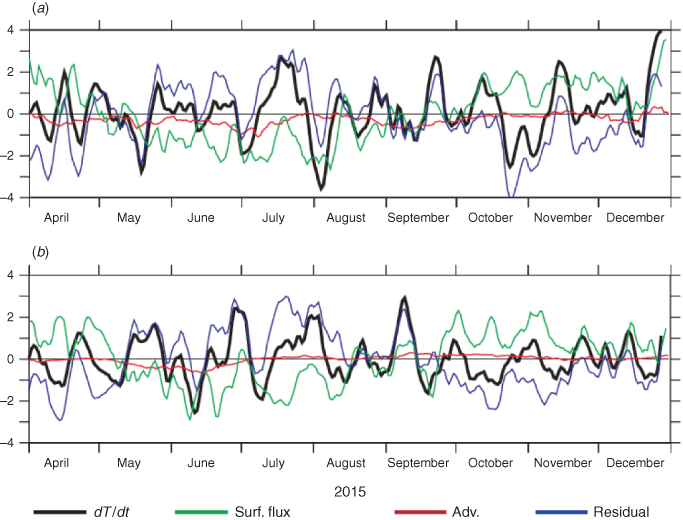
Figure 6 shows the mixed layer heat budget averaged over the dipole boxes in the western and eastern basin (Saji et al. 1999). Various terms in the mixed layer heat budget illustrate the processes controlling SST during the evolution of the 2015 pIOD event. In the eastern pole, the strong cooling tendency began at the end of July, but it was interrupted by several warming episodes before it experienced another strong cooling in October (Fig. 6a, black curve). The cooling was preceded by surface heat loss that was started from mid-July (Fig. 6a, green curve). The residual terms (associated with vertical entrainment) also play an important role for the onset of the cooling event in both late-July/early-August and in October episodes (Fig. 6a, blue curve). Previous modelling study has shown that vertical processes associated with upwelling and entrainment of subsurface water also play a role during the evolution of the 2006 pIOD event (Vinayachandran et al. 2007). Interestingly, starting from September the surface heat flux tended to warm the eastern pole reducing the cooling effect by the residual terms. In addition, we found that the horizontal advections play a minor role on the variations of the temperature tendency in the eastern pole (Fig. 6a, red curve).
In the western pole, the warming tendency was started in mid-July that was initiated mostly by the vertical process (e.g. vertical entrainment) (Fig. 6b, black and blue curves). Note that there was a good agreement between the temperature tendency and the vertical processes during July to mid-September 2015 indicating the important role of vertical process in regulating the SST in the western pole during the development phase of the pIOD. From September, major contribution of warming in the western pole was coming from the surface heat flux as the vertical processes tended to cool the SST (Fig. 6b, green curve). Similar to the eastern pole, the surface heat flux in the western pole tended to keep the SSTA warm, although the other oceanic processes have a cooling tendency.
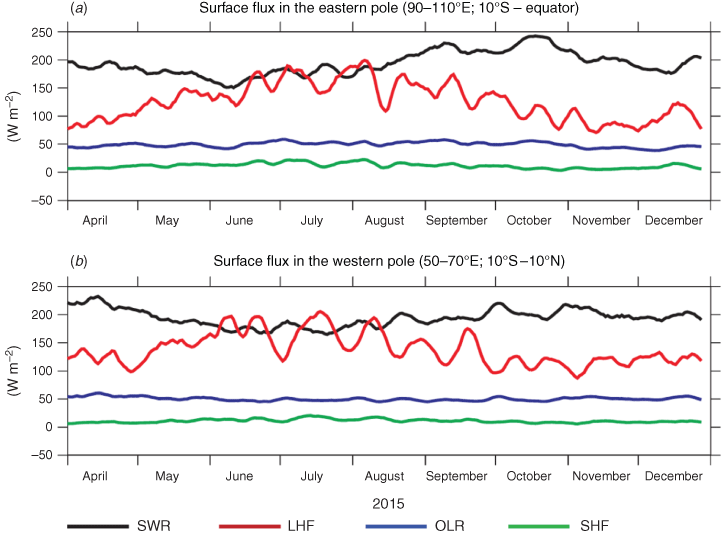
For further understanding the role of surface heat flux in controlling the SSTA variation during the 2015 pIOD event, we evaluate each term of surface heat flux both in the eastern and western pole (Fig. 7). As expected, the latent heat flux (QLH) and the shortwave radiation (QSWR) are the dominant terms for surface heat flux variation at both locations (Fig. 7a, b, black and red curves). In August, the QLH was gradually decreasing and continued to decrease until November. The total decrease was about 150 and 100 W m−2 in the eastern and western poles respectively. Note that reduced QLH in that region had induced SST warming there. The QSWR in the eastern pole revealed a gradual increase from August to October by about 100 W m−2, whereas that in the western pole showed a slight increased during August to October by about 50 W m−2. Thus, the increase of QSWR also led to warming tendency at both locations. However, we may propose here that the warming tendency were mostly associated with the latent heat loss both in the eastern and western poles. This is in agreement with a previous study that showed the important role of latent heat loss in regulating SST in the tropical Indian Ocean during the 1997 positive IOD event (Yu and Rienecker 2000).
4 Summary and conclusions
In this study we have examined the dynamical evolution of 2015 pIOD using available satellite and reanalysis data. A unique evolution of the 2015 pIOD event stimulates our understanding on the IOD evolutions as proposed by previous studies (Chambers et al. 1999; Saji et al. 1999; Vinayachandran et al. 2002; Feng and Meyers 2003; Murtugudde et al. 2000; Horii et al. 2008). It was suggested that during the evolution of typical pIOD event, the eastern pole experienced significant cooling compared to the warming in the western pole. The last strong typical pIOD event in 2006 revealed SST cooling in the eastern pole off Sumatera coast exceeding −2.5°C, whereas SST warming in the western pole only in the order of about 0.5°C (Vinayachandran et al. 2007). Interestingly, the situation was opposite in 2015 pIOD event (Fig. 1). Significant SST warming took place in the western pole off East African coast, which was exceeding 1.5°C during the peak phase in September, whereas the eastern pole only experienced slight cooling during off South Java coast during August–October (Fig. 2). Although the SSTA pattern did not show a clear positive dipole pattern, the anomalous Walker Circulation in deed revealed a change in respond to this 2015 SSTA pattern. Robust descending branch of the anomalous Walker Circulation was observed over the Maritime Continent during the peak phase of the 2015 pIOD event (Fig. 3). Meanwhile, over the western Indian Ocean basin an upward motion was observed. Note that, a strong El Niño also took place in the tropical Pacific during 2015–16 (Iskandar et al. 2017). Previous study has proposed that a unique SSTA pattern in the tropical Pacific associated with the El Niño Modoki event in 2015 had strengthen the Walker Circulation over the Indian Ocean (Liu et al. 2017).
Although the SSTA pattern did not reveal a clear dipole pattern, the D20 revealed a robust subsurface pIOD pattern (Fig. 4). Shallow (deep) D20 was observed in the eastern (western) equatorial Indian Ocean during the peak phase of the pIOD. This robust subsurface pIOD pattern indicated that the subsurface ocean response was largely wind driven. Another important characteristic revealed in this analysis is that the subsurface pIOD pattern lasted longer than the surface pattern (Fig. 5).
The role of air-sea heat flux on the evolution of the SSTA associated with the IOD events has been shown in previous studies, in particular during the termination of the event (Murtugudde et al. 2000; Horii et al. 2008). In order to examine the overall effect of each heat flux term (QSWR, QLWR, QSH and QLH) on the intensity of the cooling and warming SSTA, we calculated the evolution of each term in the eastern and western pole (Fig. 7). It is shown that the QLH and QSWR play dominant role on the SSTA evolution in both eastern and western poles. Significant reduction of QLH loss exceeding 100 W m−2 in both eastern and western poles had strongly induced SST warming. In addition, an increase of QSWR also contributes to the SST warming. We found that both reduced of QLH loss and increased QSWR acted to prevent further SST cooling in the eastern pole and strengthen the warming tendency in the western pole. Therefore, we proposed that the warming tendency in the tropical Indian Ocean associated with 2015 pIOD event was a direct response to the change of air-sea fluxes, mainly by significant reduced of QLH loss.
Author contributions
Conceptualisation – Iskhaq Iskandar; formal analysis – Putri Adia Utari and M. Yusup Nur Khakim; methodology – Putri Adia Utari and Iskhaq Iskandar; supervision – Iskhaq Iskandar; validation – Dedi Setiabudidaya and Iskhaq Iskandar; visualisation – Putri Adia Utari; writing – original draft, Putri Adia Utari and M. Yusup Nur Khakim; and writing: review and editing – Dedi Setiabudidaya and Iskhaq Iskandar.
Acknowledgements
This research was supported by the University of Sriwijaya under ‘Penelitian Unggulan Profesi – 2019’. The first author offers her thanks to the Ministry of Research, Technology and Higher Education, Republic of Indonesia, for the support under the ‘PMDSU Scholarship’. We thank two anonymous reviewers for their constructive and useful comments and suggestions.
References
Banzon, V., Smith, T. M., Chin, T. M., Liu, C., and Hankins, W. (2016). A long-term record of blended satellite and in situ sea-surface temperature for climate monitoring, modeling and environmental studies. Earth. Syst. Sci. Data 8, 165–176.| A long-term record of blended satellite and in situ sea-surface temperature for climate monitoring, modeling and environmental studies.Crossref | GoogleScholarGoogle Scholar |
Bonjean, F., and Lagerloef, G. S. E. (2002). Diagnostic model and analysis of the surface currents in the tropical Pacific Ocean. J. Phys. Oceanogr. 32, 2938–2954.
| Diagnostic model and analysis of the surface currents in the tropical Pacific Ocean.Crossref | GoogleScholarGoogle Scholar |
Boschat, G., Terray, P., and Masson, S. (2012). Robustness of SST teleconnections and precursory patterns associated with the Indian summer monsoon. Clim. Dyn. 38, 2143–2165.
| Robustness of SST teleconnections and precursory patterns associated with the Indian summer monsoon.Crossref | GoogleScholarGoogle Scholar |
Brainard, R. E., Oliver, T., Mcphaden, M. J., Cohen, A., Vanegas, R., Heenan, A., Vargas-Ãngel, B., Rotjan, R., Mangubhai, S., Flint, E., and Hunter, S. A. (2018). Ecological Impacts of the 2015/16 El Niño in the Central Equatorial Pacific. Bull. Am. Meteorol. Soc. 99, S21–S26.
| Ecological Impacts of the 2015/16 El Niño in the Central Equatorial Pacific.Crossref | GoogleScholarGoogle Scholar |
Chambers, D. P., Tapley, B. D., and Stewart, R. H. (1999). Amomalous warming in the Indian Ocean coincident with El Niño. J. Geophys. Res. 104, 3035–3047
De Boyer Montégut, C., Vialard, J., Shenoi, S. S. C., Shankar, D., Durand, F., Ethé, C., and Madec, G. (2007). Simulated seasonal and interannual variability of the mixed layer heat budget in the Northern Indian Ocean. J. Clim. 20, 3249–3268.
| Simulated seasonal and interannual variability of the mixed layer heat budget in the Northern Indian Ocean.Crossref | GoogleScholarGoogle Scholar |
Du, Y., Cai, W., and Wu, Y. (2013). A new type of the Indian Ocean Dipole since the mid-1970s. J. Clim. 26, 959–972.
| A new type of the Indian Ocean Dipole since the mid-1970s.Crossref | GoogleScholarGoogle Scholar |
Endo, S., and Tozuka, T. (2016). Two flavors of the Indian Ocean Dipole. Clim. Dyn. 46, 3371–3385.
| Two flavors of the Indian Ocean Dipole.Crossref | GoogleScholarGoogle Scholar |
Feng, M., and Meyers, G. (2003). Interannual variability in the tropical Indian Ocean: a two-year time-scale of Indian Ocean Dipole. Deep-Sea Res., II: Topical Stud. Oceanogr. 50, 2263–2284.
| Interannual variability in the tropical Indian Ocean: a two-year time-scale of Indian Ocean Dipole.Crossref | GoogleScholarGoogle Scholar |
Horii, T., Hase, H., Ueki, I., and Masumoto, Y. (2008). Oceanic precondition and evolution of the 2006 Indian Ocean dipole. Geophys. Res. Lett. 35, 1–6.
| Oceanic precondition and evolution of the 2006 Indian Ocean dipole.Crossref | GoogleScholarGoogle Scholar |
Horii, T., Ueki, I., Ando, K., and Mizuno, K. (2013). Eastern Indian Ocean warming associated with the negative Indian Ocean dipole: a case study of the 2010 event. J. Geophys. Res.: Oceans 118, 536–549.
| Eastern Indian Ocean warming associated with the negative Indian Ocean dipole: a case study of the 2010 event.Crossref | GoogleScholarGoogle Scholar |
Iskandar, I., Irfan, M., and Syamsuddin, F. (2013). Why was 2008 Indian Ocean Dipole a short-lived event? Ocean Sci. Journal, 48, 149–160
Iskandar, I. Utari, P. A., Lestari, D. O., Sari, Q. W., Setiabudidaya, D., Khakim, M. Y. N., Yustian, I., and Dahlan, Z. (2017). Evolution of 2015/2016 El Niño and its impact on Indonesia. In AIP Conference Proceedings.
Izumo, T., de Boyer Montégut, C., Luo, J. J., Behera, S. K., Masson, S., and Yamagata, (2008). The role of the Western Arabian Sea upwelling in Indian monsoon rainfall variability. J. Clim. 21, 5603–5623.
| The role of the Western Arabian Sea upwelling in Indian monsoon rainfall variability.Crossref | GoogleScholarGoogle Scholar |
Kawamura, R. (1998). A possible mechanism of the Asian Summer Monsoon-ENSO coupling. J. Meteorol. Soc. Jpn. 76, 1009–1027.
| A possible mechanism of the Asian Summer Monsoon-ENSO coupling.Crossref | GoogleScholarGoogle Scholar |
Kistler, R., Kalnay, E., Collins, W., Saha, S., White, G., Woollen, J., Chelliah, M., Ebisuzaki, W., Kanamitsu, M., Kousky, V., van den Dool, H., Jenne, R., and Fiorino, M. (1999). The NCEP–NCAR 50-year reanalysis!: monthly means CD-ROM and documentation. Bull. Am. Meteorol. Soc. 82, 247–268.
| The NCEP–NCAR 50-year reanalysis!: monthly means CD-ROM and documentation.Crossref | GoogleScholarGoogle Scholar |
Kumar, B. P., Vialard, J., Lengaigne, M., Murty, V. S. N., and McPhaden, M. J. (2012). TropFlux: air-sea fluxes for the global tropical oceans—description and evaluation. Clim. Dyn., 38, 1521–1543
Lebedev, K. V., Yoshinari, H., Maximenko, N. A., and Hacker, P. W. (2007). Velocity data assessed from trajectories of Argo floats at parking level and at the sea surface. IPRC Tech. Note 4, 20.
Lim, Y. K., Kovach, R. M., Pawson, S., and Vernieres, G. (2017). The 2015/16 El Niño event in context of the MERRA-2 reanalysis: A comparison of the tropical pacific with 1982/83 and 1997/98. J. Clim. 30, 4819–4842.
| The 2015/16 El Niño event in context of the MERRA-2 reanalysis: A comparison of the tropical pacific with 1982/83 and 1997/98.Crossref | GoogleScholarGoogle Scholar |
Liu, L., Yang, G., Zhao, X., Feng, L., Han, G., Wu, Y., and Yu, W. (2017). Why was the Indian Ocean Dipole weak in the context of the extreme El Niño in 2015? J. Clim. 30, 4755–4761.
| Why was the Indian Ocean Dipole weak in the context of the extreme El Niño in 2015?Crossref | GoogleScholarGoogle Scholar |
Murtugudde, R., McCreary, J. P., and Busalacchi, A. J. (2000). Oceanic processes associated with anomalous events in the Indian Ocean with relevance to 1997–1998. J. Geophys. Res.: Oceans 105, 3295–3306.
| Oceanic processes associated with anomalous events in the Indian Ocean with relevance to 1997–1998.Crossref | GoogleScholarGoogle Scholar |
Paek, H., Yu, J. Y., and Qian, C. (2017). Why were the 2015/2016 and 1997/1998 extreme El Niños different? Geophys. Res. Lett. 44, 1848–1856.
| Why were the 2015/2016 and 1997/1998 extreme El Niños different?Crossref | GoogleScholarGoogle Scholar |
Rao, S. A., Behera, S. K., Masumoto, Y., and Yamagata, T. (2002). Interannual subsurface variability in the tropical Indian Ocean with a special emphasis on the Indian Ocean Dipole. Deep-Sea Res. II: Topical Stud. Oceanogr. 49, 1549–1572.
| Interannual subsurface variability in the tropical Indian Ocean with a special emphasis on the Indian Ocean Dipole.Crossref | GoogleScholarGoogle Scholar |
Reynolds, R. W., Smith, T. M., Liu, C., Chelton, D. B., Casey, K. S., and Schlax, M. G. (2007). Daily high-resolution-blended analyses for sea surface temperature. J. Clim. 20, 5473–5496.
| Daily high-resolution-blended analyses for sea surface temperature.Crossref | GoogleScholarGoogle Scholar |
Saji, N. H., Goswami, B. N., Vinayachandran, P. N., and Yamagata, T. (1999). A dipole mode in the tropical Indian Ocean. Nature 401, 360–363.
| A dipole mode in the tropical Indian Ocean.Crossref | GoogleScholarGoogle Scholar |
Santoso, A., Mcphaden, M. J., and Cai, W. (2017). The defining characteristics of ENSO extremes and the strong 2015/2016 El Niño. Rev. Geophys. 55, 1079–1129.
| The defining characteristics of ENSO extremes and the strong 2015/2016 El Niño.Crossref | GoogleScholarGoogle Scholar |
Shinoda, T., Hendon, H. H., and Alexander, M. A. (2004). Surface and subsurface dipole variability in the Indian Ocean and its relation with ENSO. Deep-Sea Res., I 51, 619–635.
| Surface and subsurface dipole variability in the Indian Ocean and its relation with ENSO.Crossref | GoogleScholarGoogle Scholar |
Su, J., Zhang, R., Rong, X., Min, Q., and Zhu, C. (2017). Sea surface temperature in the subtropical pacific boosted the 2015 El Niño and hindered the 2016 La Niña. J. Clim. 31, 877–893.
| Sea surface temperature in the subtropical pacific boosted the 2015 El Niño and hindered the 2016 La Niña.Crossref | GoogleScholarGoogle Scholar |
Tao, L., Zhao, J., and Li, T. (2015). Trend analysis of tropical intraseasonal oscillations in the summer and winter during Trend analysis of tropical intraseasonal oscillations in the summer and winter during 1982–2009. Int. J. Climatol. 35, 3969–3978.
Tozuka, T., Endo, S., and Yamagata, T. (2016). Anomalous Walker circulations associated with two flavors of the Indian Ocean Dipole. Geophys. Res. Lett. 43, 5378–5384.
| Anomalous Walker circulations associated with two flavors of the Indian Ocean Dipole.Crossref | GoogleScholarGoogle Scholar |
Vialard, J., Foltz, G., McPhaden, M. J., Duvel, J.-P., and de Boyer Montégut, C. (2008). Strong Indian Ocean cooling associated with the Madden-Julian Oscillation in late 2007 and early 2008. Geophys. Res. Lett. 35, L19608
Vinayachandran, P. N., Iizuka, S., and Yamagata, T. (2002). Indian Ocean dipole mode events in an ocean general circulation model. Deep-Sea Res., II: Topical Stud. Oceanogr. 49, 1573–1596.
| Indian Ocean dipole mode events in an ocean general circulation model.Crossref | GoogleScholarGoogle Scholar |
Vinayachandran, P. N., Kurian, J., and Neema, C. P. (2007). Indian Ocean response to anomalous conditions in 2006. Geophys. Res. Lett. 34, 1–6.
| Indian Ocean response to anomalous conditions in 2006.Crossref | GoogleScholarGoogle Scholar |
Webster, P. J., Moore, A. W., Loschnigg, J. P., and Leben, R. R. (1999). Coupled ocean-atmosphere dynamics in the Indian Ocean during 1997–98. Nature 401, 356–360
Weller, E., Cai, W., Du, Y., and Min, S. K. (2014). flavors of the Indian Ocean Dipole using dominant modes in tropical Indian Ocean rainfall. Geophys. Res. Lett. 41, 8978–8986.
| flavors of the Indian Ocean Dipole using dominant modes in tropical Indian Ocean rainfall.Crossref | GoogleScholarGoogle Scholar |
Xue, Y., and Kumar, A. (2017). Evolution of the 2015/16 El Niño and historical perspective since 1979. Sci. China Earth Sci. 60, 1572–1588.
| Evolution of the 2015/16 El Niño and historical perspective since 1979.Crossref | GoogleScholarGoogle Scholar |
Yamagata, T., Behere, S. K., Luo, J. J., Masson, S., Jury, M. R., and Rao, S. A. (2004). Coupled ocean-atmosphere variability in the tropical Indian Ocean. Geophys. Monogr. Ser. 147, 189–211.
Yu, L., and Rienecker, M. M. (2000). Indian Ocean warming of 1997–1998. J. Geophys. Res.: Oceans 105, 16923–16939.
| Indian Ocean warming of 1997–1998.Crossref | GoogleScholarGoogle Scholar |

