

Experimental hydrophobicity parameters of perfluorinated alkylated substances from reversed-phase high-performance liquid chromatography
Pim de Voogt A B D , Lluis Zurano A , Peter Serné A and Joris J. H. Haftka A CA IBED – Earth Surface Science, Universiteit van Amsterdam, PO Box 94240, 1090 GE Amsterdam, the Netherlands.
B KWR Watercycle Research Institute, PO Box 1072, NL-3430 BB Nieuwegein, the Netherlands.
C Present address: IRAS, Utrecht University, PO Box 80.178, NL-3508 TD Utrecht, the Netherlands.
D Corresponding author. Email: w.p.devoogt@uva.nl
Environmental Chemistry - https://doi.org/10.1071/EN12132
Submitted: 3 September 2012 Accepted: 29 October 2012 Published online: 10 December 2012
Journal Compilation © CSIRO Publishing 2012 Open Access CC BY-NC-ND
Environmental context. Perfluorinated compounds are synthetic chemicals shown to be present in the blood of humans. To study how these contaminants get into our blood requires a good understanding of their physicochemical properties. We describe an alternative way to obtain values for how perfluorinated compounds distribute between water and fatty phases (mimicking e.g. gut content and gut wall), which is essential information for modelling and understanding the environmental fate of these chemicals.
Abstract. Capacity factors of perfluorinated alkylated substances were obtained from isocratic reversed-phase high-performance liquid chromatography–mass spectrometry experiments at different organic modifier strengths of the mobile phase. The resulting capacity factor v. modifier strengths plots were extrapolated to obtain capacity factors at 100 % water (k0) that can serve as indicators of the hydrophobicity of the perfluorinated acids. Values of log k0 were shown to increase linearly with the number of CF2 units in the fluorinated alkyl chain.
Introduction
The hydrophobicity of organic molecules is a pivotal molecular property that governs their behaviour in environmental and biological systems. It has been widely accepted as providing a good indicator of the distribution of analytes between environmental compartments such as water and sediments,[1,2] or partitioning of chemicals into biological membranes.[3–5] The hydrophobicity of neutral organic chemicals is often expressed by their octan-1-ol/water partition coefficient (Kow) which can be obtained from shake-flask or slow-stirring experiments in which the chemical’s concentration at equilibrium in the octanol and the aqueous phases is determined by chemical analysis. For surfactants the Kow is ill defined because their experimental determination is hampered by, for example, formation of emulsions and micelles. The use of chromatographic methods such as thin-layer chromatography[6] and reverse-phase high-performance liquid chromatography (HPLC)[4,7] for obtaining an estimation of Kow or hydrophobicity has been the subject of research since the 1950s in drug design and since the late 1970s in environmental chemistry.
Perfluorinated alkylated substances (PFASs) show persistence and long range transport in the environment and high concentrations of these compounds have been found in many environmental samples.[8] PFASs can bioaccumulate and have toxic effects.[9] However, their biotic and abiotic degradation pathways are thus far only marginally known.[10,11] In Canada and Europe, some PFASs, notably perfluorooctane sulfonate (PFOS) are under restrictions for meeting criteria of persistent organic pollutants (POPs) that are controlled under the Stockholm convention (see http://chm.pops.int/Programmes/New%20POPs/The%209%20new%20POPs/tabid/672/language/en-US/Default.aspx, accessed November 2012).
Many PFASs are surfactants[12] (showing surface active dipolar behaviour). This characteristic renders traditional experimental methods such as shake flask or slow stirring unsuitable to determine their Kow. The only experimentally determined partition coefficients reported for perfluorosulfonates and perfluoro carboxylates have been obtained by a voltammetric method.[5] To predict the partitioning behaviour of PFASs, mathematical models have been presented in the literature.[13] These relate distribution coefficients of these pollutants, such as e.g. air-to-water and octanol-to-water partitioning, to physicochemical or molecular properties of PFASs. The partition coefficients, in turn, are typically required for general environmental fate and transport models.[2] However, experimental partition coefficients for PFASs are largely missing for the reasons outlined above and therefore mathematical models like EPI Suite, ClogP, SPARC and COSMOtherm[13,14] applied to estimate or calculate these coefficients may suffer from poor calibration and lack of validation. The possibly resulting inaccurate partitioning data could lead to misinterpretations, erroneous risk assessments and incorrect policies to regulate this new generation of pollutants.
Ideally, for a reversed-phase liquid chromatography system the capacity ratio (log k′) of a compound obtained with a mobile phase consisting of pure water would best represent its hydrophobicity.[15] In addition, the extent of end-capping of the stationary phase is an important factor.[16,17] Because log k′ values in pure water can be very large and, consequently, determination of exact peak maxima difficult, log k′ is usually measured in methanol–water or acetonitrile–water mixtures. For a given stationary phase in reversed-phase HPLC, the relationship between the capacity factor of a solute and the volume fraction (φ) of the organic modifier in the mobile phase is given by[18]:

in which a and b are constants depending on the nature of the solute and the modifier, and the log k0 intercept represents the log k′ value extrapolated to φ = 0 (or a mobile phase consisting of pure water). Several authors have demonstrated[19–21] that for neutral compounds the quadratic term can be neglected if methanol is used as the organic modifier. Hence, the following equation results:

The slope –b represents the decrease in retention of the solute as a function of increasing organic modifier content. Extrapolation of the plot of log k′ v. φ yields the intercept at φ = 0, i.e. log k0, and the slope b. This slope depends on the chromatographic conditions (type of column, chemical composition, temperature, back pressure, etc.). It has been suggested[17] that, as an indicator of Kow, log k′ values obtained in a C18 HPLC column with methanol–water as mobile phase could be used at a single value of φ (above 0.25 but below 0.70 methanol) without extrapolation, because most of the curvature for methanol in Eqn 1 occurs at volume fractions of methanol below 25 % and above 70 %. It was argued that extrapolated k0 values determined from k′ values outside the φ = 0.25–0.70 range will therefore deviate from the true k0 value and give poor correlations to Kow. However, because the slope b is different for different solutes and hence the elution order of solutes can change with different values of φ[22] (even within the range of φ indicated above[20]), recording of the hydrophobicity at a single value of φ is not recommended.
The objectives of the work presented in this study were to employ reversed-phase HPLC to study the partitioning behaviour of PFASs into stationary phases commonly used in chromatography, and to obtain in this way quantitative information on their hydrophobicity. As in recent years stationary phases have become available that allow reversed-phase HPLC runs with a mobile phase consisting of pure water, we investigated such a stationary phase to evaluate its applicability for PFASs.
Experimental
Chemicals
Perfluorobutyl sulfonate (PFBS, 98 %), perfluorohexyl sulfonate (97 %), perfluorooctane sulfonamide (98 %), perfluorobutanoic acid (PFBA, 99 %), perfluorohexanoic acid (98 %), perfluorodecanoic acid (98 %), and perfluorododecanoic acid (96 %) were purchased from ABCR, Karlsruhe, Germany. Perfluoroheptanoic acid (96 %), perfluorooctanoic acid (PFOA, 96 %), perfluoroundecanoic acid (97 %) and perfluorotetradecanoic acid (99 %) were obtained from Acros, Geel, Belgium. Perfluorooctyl sulfonate (98 %) was purchased from Fluka, Buchs, Switzerland, 6 : 2 fluorotelomer sulfonate (6 : 2 FTS, 98 %) from Interchim, Montlucon, France, perfluorononanoic acid (97 %) from Aldrich, Milwood, WI, and uracil (2-oxy-4-oxypyrimidine, 99 %) from Sigma–Aldrich, Schnelldorf, Germany. CAS numbers, abbreviations used and compound characteristics are provided in Table S1 of the Supplementary material.
The solvents used were methanol of LC-MS grade (Biosolve, Valkenswaard, the Netherlands) and double distilled water (in-house production). The aqueous mobile phase used for the Lichrospher (Lich) column was buffered with phosphoric acid to pH values of 2.2, 2.4, 6.0 and 7.8. For the Aqua column, the pH values were set at 2.2 and 5.2. Investigating different pHs was considered necessary in order to study a possible effect of degree of dissociation, in view of the debate on actual pKa values of perfluorinated acids.[23] We expect, however, that at the different pHs investigated all acids will be in their ionic form, and hence that no appreciable effect of the pH on k′ will be apparent. The ionisation of the compounds studied was enhanced by adding salts of sodium acetate or ammonium acetate (both from Acros, Geel, Belgium) to the aqueous mobile phase. To avoid any contamination from glassware or from the chromatographic system, any contact with fluoropolymers was prevented at all times and polytetrafluorethylene material was avoided during sample treatment and analysis.
For the analyses, a standard mixture in methanol was used and this mixture was stored at 4 °C. Uracil was used for the determination of the dead time of the chromatographic system and methanol was the organic modifier in the mobile phase.
A solution of a mixture of 14 PFAS standards, containing 12 perfluorinated alkyl acids (PFAAs), a telomer acid and a neutral PFAS, was mixed with uracil for each isocratic condition. A blank consisting of only methanol was run before each injection of the standard mixture. The capacity factors of the PFASs studied were calculated under isocratic conditions for 11 methanol fractions (φMeOH) of 0 to 1 increasing by 0.1 for each sub-step. Finally, the average capacity factor was calculated from three injected samples.
Liquid chromatography–mass spectrometry (LC-MS)
Experiments were performed with a liquid chromatographic system from Thermo Separation Products (Thermo Scientific, Waltham, MA) consisting of a vacuum degasser, a P4000 gradient pump, a AS3000 auto-sampler and a SN4000 system controller. The analyses were performed with two different columns at a flow of 2 mL min–1 and at a constant temperature of 25 °C.
The chromatographic columns used were: Aqua C18 (150 × 2.0-mm internal diameter; Phenomenex, Utrecht, the Netherlands) with a particle diameter of 3 µm (p/no F-4311-B0). This column has a surface that can be 100 % ‘wetted’ with water because of the polar embedded group that allows this stationary phase to be run under 100 % aqueous conditions without loss of retention. The other column was a Lichrospher RP18 (125 × 2.0-mm internal diameter; Merck, Darmstadt, Germany) with a particle diameter of 3 µm (p/no 00E-3043-B0). A Phenomenex pre-column (C18; 2.0-mm internal diameter) was used to avoid any contamination from entering the analytical columns.
Mass spectrometric detection was performed using a Thermo Quest Finnigan AQA-MS detector (ThermoQuest, Breda, the Netherlands) in selected ion monitoring mode. MS data were collected and integrated using Xcalibur software. The ions monitored for each analyte are provided in Table S1. Example chromatograms are shown in Fig. S1. The GraphPad Prism program (version 3.02, http://www.graphpad.com) was applied for all statistical analyses and linear regression.
Quality of electrospray
In order to obtain capacity factors at high water fractions of the mobile phase, we studied the quality of the electrospray. For this experiment, solutions of PFOA and PFOS were injected directly to the electrospray ionisation (ESI)-MS system without a chromatographic column at all isocratic conditions (φMeOH = 1 to 0 in steps of 0.1). Batch injection analysis for optimising the MS were carried out using a KD Scientific (Antec, Zoeterwoude, The Netherlands) syringe pump equipped with a 1-mL Hamilton syringe (Hamilton, Bonaduz, Switzerland). The quality of the electrospray was maintained by installing an extra pump into the chromatographic system, see Fig. 1. This pump provided a constant flow of MeOH directly post-column in order to optimise the composition of the eluent entering the ESI interface. The flow of the additional pump was adjusted (<1 mL min–1) to ensure that no excessive contribution of methanol would reach the inlet of the ESI.

|
Results and discussion
Influence of mobile phase composition on signal intensity of the MS detector
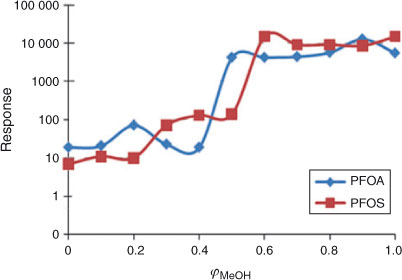
The linearity of the log k′ v. φMeOH relationship was tested over the whole range of φMeOH = 0 to 1. As expected, the electrospray is influenced by the composition of the mobile phase as it enters the LC-MS interface. At low values of φ, the electrophoretic mobility of the ions is low leading to inefficient charge separation and difficulties in producing a stable spray.[24] Fig. 2 shows the influence of the mobile phase composition on the signals of PFOA and PFOS detected by the mass selective detector. At low values of φ no appreciable signal was detected. No difference in signal intensity was observed when sodium acetate was used instead of ammonium acetate. The optimal composition for the operation of the electrospray appeared to be at values of φMeOH between 0.6 and 1.
|
As a consequence, when working at low values of φMeOH, post-column addition of methanol is required and this can be provided by the setup illustrated in Fig. 1.
Elution behaviour at low methanol fractions
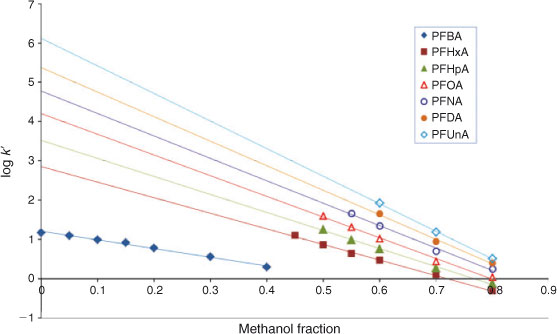
The elution behaviour of perfluorinated acids appears to be linear over a large range of φMeOH values. Fig. 3 shows the general picture of the log k′ v. φMeOH plots of the PFAAs as an example. First we looked at the elution behaviour at low methanol fractions in order to understand the behaviour over the whole range of solvent compositions. Capacity factors at low methanol fractions were therefore determined experimentally with the Aqua column and the log k0 value for PFBA was directly determined without requiring extrapolation. Due to a decreased quality of the electrospray (see previous section), the capacity factor of PFBA could only be determined by installing an additional pump in the system that increased the fraction of methanol in the eluent entering the LC-MS interface.
|
The compound PFBA has the lowest k0 value of all the PFASs tested, i.e. the shortest retention time. Retention times of PFAAs with longer fluorocarbon chains pose a problem in the method applied because the Xcalibur software is not able to create retention time windows longer than 200 min. At very low methanol fractions(φMeOH ≤ 0.25), the retention times of the larger homologues were much longer than the retention time window supplied by the software and log k0 values for these compounds could therefore not be determined directly experimentally, contrary to what was done for PFBA. Eqn 3 presents the results obtained for PFBA on the Aqua column at pH 2.2, where the intercept, 1.21, represents the value of log k0, r represents the correlation coefficient and n is the number of data points used in the regression. Values in parentheses represent standard errors. Note that in the case of PFBA the log k′ values could only be determined below methanol fractions of 0.4. At higher methanol fractions, PFBA elicited a very short retention time that could no longer be discerned from the uracil, and hence no results were obtained for PFBA under these conditions.

where n = 12, r = 0.996 and φ ranged from 0.0 to 0.4.
As can be seen from Eqn 3 and Fig. 3, for PFBA a linear relationship was observed between log k′ and φMeOH at very low methanol fractions.
Elution behaviour at high methanol fractions
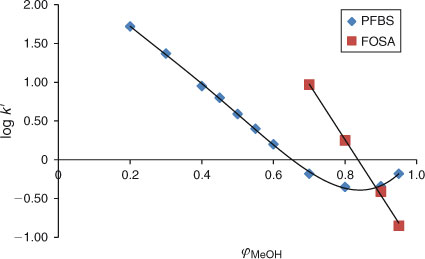
The experiments in this study have shown that at certain isocratic conditions in both analytical columns used, such as at high methanol fractions: 0.8 ≤ φMeOH ≤ 1, the relationship between the capacity factors of PFAAs and φMeOH becomes non-linear. This non-linear behaviour of PFAAs is illustrated in Fig. 4 for the example of PFBS. This type of behaviour was observed for all perfluorinated carboxylic and sulfonic acids (data not shown).
|
When the fraction of water in the mobile phase is increased, starting at φMeOH ≤ 0.8, the relationship becomes linear, see Fig. 4 for PFBS. Linear regression has therefore only been applied in this study for methanol fractions of 0 ≤ φMeOH ≤ 0.8 for all experiments. Because the elution behaviour of PFBA (see previous section) appeared to be linear (see Fig. 3), we assumed that the relationship between capacity factors and methanol fractions is linear from φMeOH 0.4 to 0. The plot for PFBS (Fig. 4) indeed shows that between φMeOH = 0.5 and 0.2 linearity is observed. It is therefore assumed that all other PFASs will elicit a similar elution behaviour and any non-linear effects are not expected in the range 0 ≤ φMeOH ≤ 0.8. This has allowed us to calculate the log k0 values of the PFASs studied by applying Eqn 2.
It is not well understood what type of interactions the PFASs can have with the stationary phase at the very high methanol fractions. We assume that at high methanol fractions, surfactants with ionic groups (carboxylate and sulfonate) probably prefer to interact with the silanol groups of the stationary phase rather than be dissolved in the mobile phase. The acidity of surfactants apparently plays an important role. The compound FOSA[25] is a neutral compound and for this compound linear behaviour can be observed at high methanol fractions (i.e. φMeOH > 0.8), see Fig. 4. The elution behaviour of this neutral compound is therefore linear over the whole range of methanol fractions that were possible to study.
The acidity of PFASs enables electronic and hydrogen bond interactions with the silanol groups in the stationary phase to occur[11,17,19,21] (instead of, or complementary to, van der Waals interactions). This non-linear behaviour may be enhanced at high methanol fractions in the mobile phase. The non-linear contribution to the elution behaviour could probably be minimised by changing the pH of the mobile phase to lower values than the acid dissociation constants of the PFASs studied to correct for ionisation of PFASs. The columns applied in this study (and also most other commercially available columns) unfortunately have a pH limitation because the stationary phase can dissolve at pH values lower than or close to 2, whereas the reported pKa values of, e.g. perfluorocarboxylic acids, vary between –0.2 and 3.5.[26,27]
It should be noted that in the guidelines of the Organisation for Economic Co-operation and Development (OECD), the principles and limitations to determine log Kow by HPLC have been stated.[21] According to the OECD guidelines, the method is not applicable to strong acids and bases, metal complexes, substances which react with the eluent or surfactants. The log Kow of acids can however be obtained by adjustment of the pH value to values below the pKa of the compounds studied.
General results of PFASs
The order of the PFASs eluting from the column remained the same over the whole range of the solvent compositions tested (0 ≤ φMeOH ≤ 0.8) despite clear differences in the slope of the φMeOH v. log k′ relationships. Indeed, it has been shown that for individual homologues a linear log k′ v. φMeOH dependence would lead to a fan-like shape of the log k′ v. φ plots with a common convergence point[21] (see Fig. 3). Hence, the capacity factor becomes higher when the chain length of the PFAS increases (see below and Fig. 3).
As stated above, the long retention times of long chain PFASs form a limitation to obtain an accurate value for the capacity factor at lower values of φMeOH. In Fig. 3 it is shown that not all capacity factors were measured for every PFAS due to long retention times and the inability of the software to handle these long retention times as has been mentioned above. Moreover, at long retention times peaks flatten out and it becomes difficult to accurately assess the apex of a peak. As a consequence, fewer capacity factors could be obtained experimentally for long chain PFASs compared with short chain PFASs. This is the reason why there is no data for perfluorododecanoic acid (PFDA) and perfluorotetradecanoic acid (PFTeA) at pH 5 and no data is present for PFTeA at pH 7, see Table 1.

|
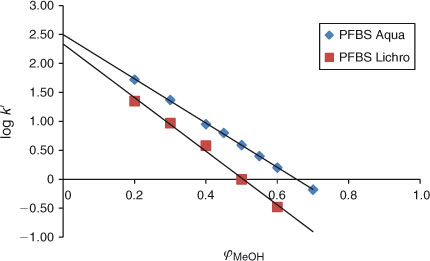
The results obtained with both columns were grouped according to the pH range used in the experiments (pH ~2.3, pH ~5–6 and pH 7.6). Table 1 provides the capacity factors extrapolated to φMeOH = 0. The second column in Table 1 lists data of the average of four different experiments performed at pH values of 2.2 and 2.4 using both analytical columns (see Table S2 for all separate results). The third table column is an average of two experiments performed at pH values of 5.2 and 6.0 using both analytical columns. Finally, the data in the fourth table column is from one single experiment performed at pH 7.6. The log k0 values determined for each analytical column are similar to each other (see Fig. 5, Table S2) and increase with increasing chain length of the PFASs.
|
Retention and length of the fluorocarbon chain
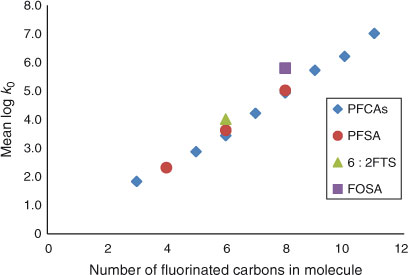
As can be seen from Fig. 5, the hydrophobicity of perfluorinated sulfonates, 6 : 2 FTS and perfluorinated carboxylates, expressed by their log k0 value, is linearly related to the number of fluorinated carbon atoms in the PFAS molecule. This is in agreement with earlier findings reported for water–methanol eluents.[28] For example for 6 : 2 FTS a log k0 value corresponding to six perfluorinated carbon atoms is found, rather than to eight carbons. This compound is not fully fluorinated and has four hydrogen atoms instead of fluorine atoms; its log k0 value is 1.1 log units lower than its C8 homologue PFOS. Obviously, the number of fluorine-attached carbon atoms of these compounds controls for a large part the partitioning behaviour in the chromatographic system and thereby the log k0 value which is shown in Fig. 6.
|
The resulting overall relationship can be expressed by Eqn 4 (R2 = 0.995, n = 12):

where CF is the number of carbon atoms with fluorine attached.
The contribution of each CF2 group to the increase in hydrophobicity is therefore equal to 0.66, a value that is close to the value of 0.61 derived from voltammetric measurements,[5] between values of 0.50 and 0.80 estimated by earlier model calculations (COSMOtherm and SPARC models respectively)[13] and again close to the average value (0.62) calculated recently with COSMOtherm.[14] One should bear in mind though, that such models can probably only properly estimate the partitioning properties of neutral, monomeric species.[14]
The hydrophobicity of FOSA, for which CF = 8, is slightly higher than the log k0 value predicted by Eqn 3. This can be ascribed to the neutral character of PFOSA that results in a slightly lower affinity for water, and to its amide group that enables additional hydrogen bonding with the stationary phase and may also slightly neutralise the strong electron-withdrawing effect[5] of the perfluoroalkyl chain.
Influence of pH of the mobile phase
With increasing pH of the mobile phase, the log k0 values show a small increase in the hydrophobicity overall (see Table 1). The log k0 values at pH 5.2 are approximately a half log unit higher and lower than their respective log k0 values at pH 2.2 and pH 7.6. The log k0 values are however not statistically different from each other (based on 95 % confidence intervals). A similar trend is not observed for sulfonic acids, see Table 1. As a conclusion, the pH of the aqueous mobile phase only slightly affects the log Kw of perfluorinated carboxylic acids irrespective of the chain length. The pKa value of non-fluorinated carboxylic acids is close to 5. This value seems to be rather constant for different carbon chain lengths and it is estimated that pKa values of perfluorinated carboxylic acids are also constant but much lower.[27]
Hydrophobicity
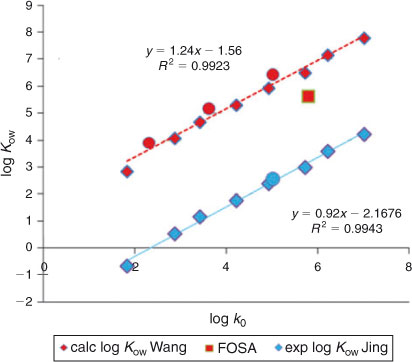
Most log Kow values reported for PFASs in the literature have been calculated using partitioning models. Apart from the experimental log P0′ values determined using voltammetry by Jing et al.,[5] Kelly et al. provided an overview table with log Kow values using original data calculated by Arp et al.[13] and correcting these because of ‘apparent overestimation’ (see table S3 of the supporting information of Kelly et al.[29]). Wang et al.[14] presented new results obtained with the COSMO-therm software. These calculated and experimental values have been summarised in Table S3. As can be seen from Table S3, values are available for the C4–C12 carboxylic acids, PFOS and FOSA. A strong linear relationship is observed between the log k0 values obtained in the present study and both the experimental and calculated log Kow values published (cf. Fig. 7). We conclude that the HPLC-derived hydrophobicity values obtained in the present study provide a robust set of indicators for the environmental partitioning behaviour of PFASs.
|
Acknowledgements
The authors are grateful to John R. Parsons and Wim Th. Kok from the University of Amsterdam for their valuable and highly appreciated advice.
References
[1] A. Sabljić, H. Güsten, H. Verhaar, J. Hermens, QSAR modelling of soil sorption. Improvements and systematics of log Koc vs. log Kow correlations. Chemosphere 1995, 31, 4489.| QSAR modelling of soil sorption. Improvements and systematics of log Koc vs. log Kow correlations.Crossref | GoogleScholarGoogle Scholar |
[2] R. S. Boethling, P. H. Howard, W. M. Meylan, Finding and estimating chemical property data for environmental assessment. Environ. Toxicol. Chem. 2004, 23, 2290.
| Finding and estimating chemical property data for environmental assessment.Crossref | GoogleScholarGoogle Scholar | 1:CAS:528:DC%2BD2cXnvVGrsrk%3D&md5=8e711043c74d12176834877bf6b9a983CAS |
[3] P. de Voogt, J. W. M. Wegener, J. C. Klamer, G. A. van Zijl, H. Govers, Prediction of environmental fate and effects of heteroatomic polycyclic aromatics by QSARs: the position of n-octanol/water partition coefficients. Biomed. Environ. Sci. 1988, 1, 194.
| 1:STN:280:DyaK3c%2FislSmug%3D%3D&md5=c08da3a4f53e3abd958df83aad68ea48CAS |
[4] S. Griffin, S. Grant Wyllie, J. Markham, Determination of octanol–water partition coefficient for terpenoids using reversed-phase high-performance liquid chromatography. J. Chromatogr. A 1999, 864, 221.
| Determination of octanol–water partition coefficient for terpenoids using reversed-phase high-performance liquid chromatography.Crossref | GoogleScholarGoogle Scholar | 1:CAS:528:DyaK1MXnsl2mu7c%3D&md5=8d0b693d1a228c1b3d40faa9e661eefeCAS |
[5] P. Jing, P. J. Rodgers, S. Amemiya, High lipophilicity of perfluoroalkyl carboxylate and sulfonate: implications for their membrane permeability. J. Am. Chem. Soc. 2009, 131, 2290.
| High lipophilicity of perfluoroalkyl carboxylate and sulfonate: implications for their membrane permeability.Crossref | GoogleScholarGoogle Scholar | 1:CAS:528:DC%2BD1MXht1Ohu7k%3D&md5=2ccd2e7bdfcc46bad253bae5dfc1166bCAS |
[6] P. de Voogt, G. A. van Zijl, H. Govers, U. A. Th. Brinkman, Reversed-phase thin-layer chromatography and structure-activity relationships of polycyclic (hetero)aromatic hydrocarbons. J. Planar. Chromatogr. 1990, 3, 24.
| 1:CAS:528:DyaK3cXmtVKhtbg%3D&md5=01c50e384b978ac40eccb44b5898175eCAS |
[7] T. Braumann, Determination of hydrophobic parameters by reversed-phase liquid-chromatography – theory, experimental techniques, and application in studies on quantitative structure–activity relationships. J. Chromatogr. A 1986, 373, 191.
| Determination of hydrophobic parameters by reversed-phase liquid-chromatography – theory, experimental techniques, and application in studies on quantitative structure–activity relationships.Crossref | GoogleScholarGoogle Scholar | 1:CAS:528:DyaL2sXktlWmsw%3D%3D&md5=e7b21f82f3af11054134e657dd72c2c8CAS |
[8] B. D. Key, R. D. Howell, C. S. Criddle, Fluorinated organics in the biosphere. Environ. Sci. Technol. 1997, 31, 2445.
| Fluorinated organics in the biosphere.Crossref | GoogleScholarGoogle Scholar | 1:CAS:528:DyaK2sXks1Cqsb0%3D&md5=02c4abaa87176789b5ccc63416a9e864CAS |
[9] F. Hekster, R. W. P. M. Laane, P. de Voogt, Environmental and toxicity effects of perfluoroalkylated substances. Rev. Environ. Contam. Toxicol. 2003, 179, 99.
| Environmental and toxicity effects of perfluoroalkylated substances.Crossref | GoogleScholarGoogle Scholar | 1:CAS:528:DC%2BD3sXnvVGmsrs%3D&md5=7b7df5f898e2c594d450fc35db1d2430CAS |
[10] J. R. Parsons, M. Sáez, J. Dolfing, P. de Voogt, Biodegradation of perfluorinated compounds. Rev. Environ. Contam. Toxicol. 2008, 196, 53.
| Biodegradation of perfluorinated compounds.Crossref | GoogleScholarGoogle Scholar | 1:CAS:528:DC%2BD1MXmtlynsQ%3D%3D&md5=09daaf86593d51cda4b77da9944504c4CAS |
[11] T. Frömel, T. P. Knepper, Biodegradation of fluorinated alkyl substances. Rev. Environ. Contam. Toxicol. 2010, 208, 161.
| Biodegradation of fluorinated alkyl substances.Crossref | GoogleScholarGoogle Scholar |
[12] K. Prevedouros, I. T. Cousins, R. C. Buck, S. H. Korzeniowski, Sources, fate and transport of perfluorocarboxylates. Environ. Sci. Technol. 2006, 40, 32.
| Sources, fate and transport of perfluorocarboxylates.Crossref | GoogleScholarGoogle Scholar | 1:CAS:528:DC%2BD2MXht1Gru7zK&md5=1e94f39eee912a131accc642e304dd43CAS |
[13] H. P. Arp, C. Niederer, K. U. Goss, Predicting the partitioning behavior of various highly fluorinated compounds. Environ. Sci. Technol. 2006, 40, 7298.
| Predicting the partitioning behavior of various highly fluorinated compounds.Crossref | GoogleScholarGoogle Scholar | 1:CAS:528:DC%2BD28XhtVWnsrnO&md5=5b614e40e563b938000e3dd7d319d46aCAS |
[14] Z. Wang, Z. M. MacLeod, I. T. Cousins, M. Scheringer, K. Hungerbühler, Using COSMOtherm to predict physicochemical properties of poly- and perfluorinated alkyl substances (PFASs). Environ. Chem. 2011, 8, 389.
| 1:CAS:528:DC%2BC3MXhtFaqsL3F&md5=15eb4f94095d30a477bd179b0f68e384CAS |
[15] T. Braumann, Determination of hydrophobicity parameters by reversed-phase liquid chromatography: theory, experimental techniques and application in studies on quantitative structure-activity relationships. J. Chromatogr. A 1986, 373, 191.
| Determination of hydrophobicity parameters by reversed-phase liquid chromatography: theory, experimental techniques and application in studies on quantitative structure-activity relationships.Crossref | GoogleScholarGoogle Scholar | 1:CAS:528:DyaL2sXktlWmsw%3D%3D&md5=e7b21f82f3af11054134e657dd72c2c8CAS |
[16] A. Bechalany, A. Tsantili-Kakoulidou, N. Tayar, B. Testa, Measurement of lipophilicity indexes by reversed-phase high-performance liquid-chromatography – comparison of 2 stationary phases and various eluents. J. Chromatogr. A 1991, 541, 221.
| Measurement of lipophilicity indexes by reversed-phase high-performance liquid-chromatography – comparison of 2 stationary phases and various eluents.Crossref | GoogleScholarGoogle Scholar | 1:CAS:528:DyaK3MXitVarsr4%3D&md5=62e73899577ebb17c88427818e8d3ac9CAS |
[17] W. J. Lambert, Modeling oil–water partitioning and membrane permeation using reversed-phase chromatography. J. Chromatogr. A 1993, 656, 469.
| Modeling oil–water partitioning and membrane permeation using reversed-phase chromatography.Crossref | GoogleScholarGoogle Scholar | 1:CAS:528:DyaK2cXivFeitbs%3D&md5=59c16f410087c06ecd9daeeb21705231CAS |
[18] P. J. Schoenmakers, H. A. H. Billiet, L. de Galan, Influence of organic modifiers on the retention behavior in reversed-phase liquid-chromatography and its consequences for gradient elution. J. Chromatogr. A 1979, 185, 179.
| Influence of organic modifiers on the retention behavior in reversed-phase liquid-chromatography and its consequences for gradient elution.Crossref | GoogleScholarGoogle Scholar | 1:CAS:528:DyaL3cXht1Whurg%3D&md5=7b737ccb5081f201cb01b1dea59b0be4CAS |
[19] W. E. Hammers, G. J. Meurs, C. L. de Ligny, Correlations between liquid chromatographic capacity ratio data on Lichrosorb-RP18 and partition coefficients in the octanol/water system. J. Chromatogr. A 1982, 247, 1.
| Correlations between liquid chromatographic capacity ratio data on Lichrosorb-RP18 and partition coefficients in the octanol/water system.Crossref | GoogleScholarGoogle Scholar | 1:CAS:528:DyaL38XlsFWgtL8%3D&md5=949543223ee718e6d49ec84b9af983a6CAS |
[20] P. de Voogt, J. W. M. Wegener, U. A. Th. Brinkman, Govers. Retention of neutral and basic heteroaromatic hydrocarbons in RPLC systems and its use in predictive studies. I. Nature and concentration of the organic modifier. Sci. Total Environ. 1991, 109–110, 69.
| Govers. Retention of neutral and basic heteroaromatic hydrocarbons in RPLC systems and its use in predictive studies. I. Nature and concentration of the organic modifier.Crossref | GoogleScholarGoogle Scholar |
[21] P. Jandera, Correlation of retention and selectivity of separation in reversed-phase high-performance liquid chromatography with interaction indices and with lipophilic and polar structural indices. J. Chromatogr. A 1993, 656, 437.
| Correlation of retention and selectivity of separation in reversed-phase high-performance liquid chromatography with interaction indices and with lipophilic and polar structural indices.Crossref | GoogleScholarGoogle Scholar | 1:CAS:528:DyaK2cXivVSqs7c%3D&md5=aebd1510e8e3505143e92f7394fada80CAS |
[22] B. Herbreteau, C. Graft, E. Voisin, M. Lafosse, L. Morin-Allory, Interpretation of the chromatographic behavior of perhydrogenated and perfluorinated polyoxyethylene surfactants by molecular modeling. Chromatographia 1999, 50, 490.
| Interpretation of the chromatographic behavior of perhydrogenated and perfluorinated polyoxyethylene surfactants by molecular modeling.Crossref | GoogleScholarGoogle Scholar | 1:CAS:528:DyaK1MXntlylsrg%3D&md5=6159c0bc5a2b185297e5f7d16d657850CAS |
[23] S. Rayne, K. Forest, K. J. Friesen, Computational approaches may underestimate pKa values of longer-chain perfluorinated carboxylic acids: Implications for assessing environmental and biological effect. J. Environ. Sci. Health A 2009, 44, 317.
| 1:CAS:528:DC%2BD1MXht1akurk%3D&md5=fa380cf170bb95f8ab3b8aa79bceddd6CAS |
[24] R. Kostiainen, T. J. Kauppila, Effect of eluent on the ionization process in liquid chromatography-mass spectrometry. J. Chromatogr. A 2009, 1216, 685.
| Effect of eluent on the ionization process in liquid chromatography-mass spectrometry.Crossref | GoogleScholarGoogle Scholar | 1:CAS:528:DC%2BD1MXktlyjsA%3D%3D&md5=fc742dfea47aee28e1f20bd3ca99377dCAS |
[25] R. C. Buck, J. Franklin, U. Berger, J. M. Conder, I. T. Cousins, P. de Voogt, A. A. Jensen, K. Kannan, S. A. Mabury, S. P. J. van Leeuwen, Perfluoroalkyl and polyfluoroalkyl substances in the environment: terminology, classification and origins. Integr. Environ. Assess. Manag. 2011, 7, 513.
| Perfluoroalkyl and polyfluoroalkyl substances in the environment: terminology, classification and origins.Crossref | GoogleScholarGoogle Scholar | 1:CAS:528:DC%2BC3MXhtF2jtrnM&md5=6b2ea97bccdec960ec31da6ebee2c3b9CAS |
[26] H. B. Krop, P. de Voogt, Environmentally relevant physicochemical properties of perfluorinated alkylated substances. Report PERFORCE-2: Improving the PFAS database 2008 (University of Amsterdam: Amsterdam).
[27] K. U. Goss, The pKa values of PFOA and other highly fluorinated carboxylic acids. Environ. Sci. Technol. 2008, 42, 456.
| The pKa values of PFOA and other highly fluorinated carboxylic acids.Crossref | GoogleScholarGoogle Scholar | 1:CAS:528:DC%2BD2sXhsVWqsLrO&md5=211b2f4a1a5c70c0dd538ee255c2bacbCAS |
[28] R. K. Gilpin, M. Jaroniec, S. Lin, Studies of the surface composition of phenyl and cyanopropyl bonded phases under reversed-phase liquid chromatographic conditions using alkanoate and perfluoroalkanoate esters. Anal. Chem. 1991, 63, 2849.
| Studies of the surface composition of phenyl and cyanopropyl bonded phases under reversed-phase liquid chromatographic conditions using alkanoate and perfluoroalkanoate esters.Crossref | GoogleScholarGoogle Scholar | 1:CAS:528:DyaK3MXmsVOit7w%3D&md5=367fc3572362cc16bb26dc033c8b3b57CAS |
[29] B. C. Kelly, M. G. Ikonomou, J. D. Blair, B. Surridge, D. Hoover, R. Grace, F. A. P. C. Gobas, Perfluoroalkyl contaminants in an arctic marine food web: trophic magnification and wildlife exposure. Environ. Sci. Technol. 2009, 43, 4037.
| Perfluoroalkyl contaminants in an arctic marine food web: trophic magnification and wildlife exposure.Crossref | GoogleScholarGoogle Scholar | 1:CAS:528:DC%2BD1MXlt1Shu7k%3D&md5=b97eaaad31104316726ce8ef55a0e9b9CAS |