

Photochemical reactions of methyl and ethyl nitrate: a dual role for alkyl nitrates in the nitrogen cycle
Shuzhong He A , Zhongming Chen A B and Xuan Zhang AA State Key Laboratory of Environmental Simulation and Pollution Control, College of Environmental Sciences and Engineering, Peking University, Haidian District, Beijing 100871, P. R. China.
B Corresponding author. Email: zmchen@pku.edu.cn
Environmental Chemistry 8(6) 529-542 https://doi.org/10.1071/EN10004
Submitted: 18 January 2010 Accepted: 16 September 2011 Published: 15 November 2011
Journal Compilation © CSIRO Publishing JYEAR Open Access CC BY-NC-ND
Environmental context. Alkyl nitrates are considered to be important intermediates in the atmospheric hydrocarbons–nitrogen oxides–ozone cycle, which significantly determines air quality and nitrogen exchange between the atmosphere and the Earth’s surfaces. The present laboratory study investigates reaction products of alkyl nitrates to elucidate their photochemical reaction mechanisms in the atmosphere. The results provide a better understanding of the role played by alkyl nitrates in the atmospheric environment.
Abstract. Alkyl nitrates (ANs) are important nitrogen-containing organic compounds and are usually considered to be temporary reservoirs of reactive nitrogen NOx (NO2 and NO) in the atmosphere, although their atmospheric fates are incompletely understood. Here a laboratory study of the gas-phase photolysis and OH-initiated reactions of methyl nitrate (CH3ONO2) and ethyl nitrate (C2H5ONO2), as models of atmospheric ANs, is reported with a focus on elucidating the detailed photochemical reaction mechanisms of ANs in the atmosphere. A series of intermediate and end products were well characterised for the first time from the photochemical reactions of methyl and ethyl nitrate conducted under simulated atmospheric conditions. Notably, for both the photolysis and OH-initiated reactions of CH3ONO2 and C2H5ONO2, unexpectedly high yields of HNO3 (photochemically non-reactive nitrogen) were found and also unexpectedly high yields of peroxyacyl nitrates (RC(O)OONO2, where R = H, CH3, CH3CH2,…) (reactive nitrogen) have been found as CH3C(O)OONO2 in the C2H5ONO2 reaction or proposed as HC(O)OONO2 in the CH3ONO2 reaction. Although the yields of HNO3 from the ANs under ambient conditions are likely variable and different from those obtained in the laboratory experiments reported here, the results imply that the ANs could potentially serve as a sink for reactive nitrogen in the atmosphere. The potential for this dual role of organic nitrates in the nitrogen cycle should be considered in the study of air quality and nitrogen exchange between the atmosphere and surface. Finally, an attempt was made to estimate the production of HNO3 and peroxyacyl nitrates derived from NOx by ANs as intermediates in the atmosphere.
Additional keywords: nitric acid, OH-initiated reaction, peroxyacetyl nitrate, photolysis.
Introduction
Oxides of nitrogen (NOx) (i.e. NO2 and NO) are usually considered as reactive nitrogen species and play an important role in atmospheric chemistry. The photolysis of NO2 can initiate a series of reactions and is the sole known anthropogenic source of ozone in the troposphere.[1] NOx can transform into a variety of inorganic and organic nitrogen-containing substances in the troposphere, including peroxynitric acid (HOONO2), dinitrogen pentoxide (N2O5), chlorine nitrate (ClONO2), nitric acid (HNO3), nitrous acid (HNO2), aerosol nitrate (NO3–), peroxyacyl nitrates (RC(O)OONO2, where R = H, CH3, CH3CH2,…) and alkyl nitrates (RONO2, ANs). These chemicals together with NOx are collectively termed as ‘odd nitrogen’, namely, NOy. However, the observed levels of NOy were greater than the sum of the individually measured species (ΣNOyi = NO, NO2, HNO3, NO3–(aerosol) and peroxyacetyl nitrate (PAN, CH3C(O)OONO2)), implying missing NOy components in the field NOy measurement.[2] Recently, ANs have come under increased scrutiny because the large abundances of ANs might represent the ‘missing NOy’ in the atmosphere.[2]
The mixing ratios of ANs lie in the range of tens to hundreds of parts per trillion by volume (pptv) in the air of polluted and remote regions. It should be noted that the ANs defined in the present study include monofunctional and multifunctional AN compounds. In polluted air masses, for example, in La Porte, Texas, the daytime mixing ratio of total straight chain alkyl nitrates (∑C1–C5) was found to range from 30 to 80 pptv[3]; a long-term observation in coastal New England indicated that the median mixing ratio of ∑C1–C5 was 23–25 pptv in winter and 14–16 pptv in summer[4]; the maximum mixing ratio of ∑C1–C5 was detected as 204 pptv in the Pearl River Delta, an industrial area of South China.[5] In remote continental air masses, mixing ratios of the C1–C10 ANs were observed as 10 to 200 pptv.[6–13] The measurements at a rural site in California over a full annual cycle showed that total ANs (∑ANs) were routinely 10–20 % of NOy.[2] Increasing evidence suggests that the biogenic volatile organic compounds, especially isoprene and terpenes, can significantly contribute to AN production, including simple and complex ANs with higher molecular weight and multifunctional structure.[14] The measured concentration of isoprene nitrates reached ~90 pptv in a forest site at Pellston, Michigan,[15] and as high as 150 pptv in rural Tennessee.[16] ANs were also detected in the lower stratosphere by the NASA ER-2 aircraft, covering a latitude range of 60°N to 2°S, 115°W to 155°W and altitudes to 20.5 km.[17] Methyl and ethyl nitrate account for ~20–40 % of the total light ANs.[4,5,13] Methyl and ethyl nitrate have been detected in Antarctica and their sum mixing ratio accounted for more than 50 % of the 70 ppt of NOy over Antarctica during the summer.[6]
To date, the determinations of the concentrations of atmospheric ANs are subject to uncertainties because of limitations of handling and measurement techniques. Nonetheless, the collective pool of measurements to date point to the fact that ANs may be a significant component of NOy in the atmosphere.
Tropospheric ANs appear to be mainly produced from the oxidation of parent hydrocarbons,[18,19] as follows:


The branching ratio of the RONO2 formation pathway (reaction 3b) can range from one percent to tens of percent, depending on the R group.[20] This pathway is important because it is the major route for the formation of ANs and terminates the cycle between NO and NO2. A possible alternative pathway for RONO2 formation under polluted conditions has been suggested by[21,22]:

where M represents the molecular N2 or O2 in air.
In a previous investigation, we established that the reaction of methyl hydroperoxide (CH3OOH) and ethyl hydroperoxide (CH3CH2OOH) with NO2 can respectively produce methyl nitrate and ethyl nitrate,[23,24] although the rate coefficients are merely ~10–20 cm3 molecule–1 s–1 at 293 K. The heterogeneous reaction of HCHO and HNO3 on concentrated sulfuric acid aerosols has also been suggested to be a pathway for methyl nitrate formation.[25] In addition to chemical formation, the oceanic source of ANs, particularly for methyl and ethyl nitrate, has been known for over a decade.[7,26–28] In this case, ANs may come from the photosynthesis of sea plants, bacterial or algal processes, or from transformations involving dissolved nutrient NO3–.[27] Biomass burning has been identified as a significant source of ANs.[29] Moreover, several ANs have long been used as explosives and vasodilator drugs against angina pectoris. For example, the explosive nitroglycerin is a triester of glycerin and nitrous acid. Methyl nitrate itself is highly explosive[30]; therefore, the production and use of ANs in this way are considered to be anthropogenic emissions.
The atmospheric fates of ANs determine their lifetimes and roles in atmospheric chemistry. Many of the simple ANs are thermally stable,[31,32] and only slightly soluble in water, so their removal by thermal decomposition or wet deposition[33] is expected to be minor, but their dry deposition accounts for a percentage for methyl nitrate.[4] Photolysis and OH-initiated oxidations thus become the dominant sinks for ANs in the atmosphere.
Rebbert[34] proposed three photolysis pathways for the photodissociation of C2H5ONO2:


Several studies have suggested that the dominant pathway for photolysis of ANs is through formation of NO2 and an alkoxy radical (reaction 6).[33,35–39]

However, most previous photolysis investigations were carried out in a He or N2 bath gas, neglecting the presence and importance of O2 in the real atmosphere. The reaction of ANs with OH radicals initiates a series of successive reactions in which ANs release products into the atmosphere:

The rate coefficients of methyl and ethyl nitrate reactions with OH radicals have been determined in several studies.[40–44] Two pathways for the reaction of ANs with OH have been proposed, namely, hydrogen-atom abstraction[41,43,44] and OH addition.[41] However, the specific products formed in the reaction of ANs with OH radicals are still unclear.
ANs are usually considered to be the temporary reservoir of reactive nitrogen species and they can regenerate NOx through photolysis and oxidation.[5,45] Because compared to NOx they have relatively long atmospheric lifetimes, ranging from several days to weeks,[22,46,47] ANs may be transported large distances to remote regions of the atmosphere, potentially providing a source of NOx to these areas and influencing O3 chemistry. Therefore, ANs play a significant role in the NOx–O3–HOx cycle in both polluted and remote atmospheres. However, to date, the current knowledge of the specific products and mechanisms for the transformation of ANs in the atmosphere has depended upon the speculations derived from the theory and limited experiments performed in the absence of O2, which thus do not simulate real atmospheric conditions. The relationship between ANs and NOx has been simplified in the current atmospheric models, possibly leading to large discrepancies in the simulation of the reactive nitrogen cycle. Detailed laboratory studies of the products and mechanisms in AN reactions under a simulated real atmosphere containing O2 are urgently needed to better understand their roles in air quality and nitrogen exchange between the Earth’s atmosphere and surface.
In the present study, we have selected methyl and ethyl nitrate as models of atmospheric ANs and have investigated their photochemical reactions under simulated atmospheric conditions. Our study is focussed on the specific products and mechanisms in the photolytic and OH-initiated reactions of ANs. Our experimental results have revealed a dual role for ANs in the reactive nitrogen cycle, thus providing useful information for atmospheric chemical models.
Experimental methods
Chemicals
Fuming nitric acid (95 %, Beijing Lisui Chemical Reagent Factory, Beijing, China), methanol (≥99.9 %, Fisher Chemical, Fair Lawn, NJ, USA), ethanol (≥99.9 %, Beijing Chemical Reagent Factory) N2 (≥99.999 %, Beijing Pryx Applied Gas Company Limited, Beijing, China) and O2 (≥99.999 %, Beijing Analytical Instrument Factory, Beijing, China) were used in this study. As methyl nitrate and ethyl nitrate are not commercially available, they were synthesised in our laboratory by the esterification of the corresponding alcohol and nitric acid with dehydration by sulfuric acid, and in the presence of a grain of urea, according to the procedures described by Desseigne et al.[48] The purities of the methyl and ethyl nitrate obtained were confirmed to be ≥95 % by checking for possible impurities such as NO2, CH3ONO and C2H5ONO, etc. using Fourier-transform infrared (FTIR) spectroscopy.
Instrumentation and methods
Laboratory simulations were carried out in a 28.5-L cylindrical quartz reaction chamber (Q-6-54X2-BA-AU model, Infrared Analysis Inc., Anaheim, CA, USA). This chamber was equipped with a digital thermometer, a piezometer to measure the gas pressure, a vacuum system and a White-mirror system. The equipment has been described in detail in our previous work.[49] A FTIR spectrometer (Nexus model, Thermo Nicolet, USA) was used to characterise the reactants and some of the products. There were five UV lamps (λmax = 254 nm, 40 W, low-pressure mercury lamp, Beijing Haidian Konghou Complex Factory, Beijing, China) and a stainless steel enclosure around the reactor. The FTIR facility was mounted with a KBr beam splitter and a liquid nitrogen-cooled mercury–cadmium–telluride (MCT) detector. FTIR spectra were recorded by co-adding 64 scans at 1 cm–1 spectroscopic resolution over the frequency region of 500–4000 cm–1. The reaction temperature was controlled at 298 ± 2 K and the total pressure of the gas mixture was controlled at ~1.01 × 10⁵ ± 1333 Pa (760 ± 10 Torr).
For the offline analysis of products by high performance liquid chromatography (HPLC) and ion chromatography (IC), gas (1.2 L) was drawn from the reactor by a pump and was collected with a Horibe tube in a cold trap of ethanol–liquid nitrogen at ~–90 °C. After the collection was completed, the sample in the Horibe tube was quickly eluted by acetonitrile (≥99.9 %, Tedia, Fairfield, OH, USA), and the eluate was immediately mixed with a 2,4-dinitrophenyhydrazine (DNPH, 97 %, DryWT, Alfa Aesar, Ward Hill, MA, USA) solution in acetonitrile to derivatise the carbonyl compounds. The resulting sample solution was kept in the dark for ~12 h at room temperature, followed by analysis with HPLC. Similarly, a H3PO4 (1 mM) solution or pure water (MilliQ system, Millipore, Billerica, MA, USA) was substituted for the acetonitrile to trap the peroxides or inorganic and organic acids, and these two types of compounds were then immediately determined by HPLC or IC. Carbonyl compounds were analysed as their DNPH derivatives by HPLC (Agilent 1100, Waldbronn Vogel, Germany). For a 1.2-L sample of gas, the detection limit for formaldehyde and acetaldehyde using the DNPH method is ~0.05 ppmv (parts per million by volume). Peroxides were analysed using a post-column derivatisation method by using another HPLC instrument (Agilent 1100), in which the peroxides oxidised hydroxyphenylacetic acid to produce a fluorescent dimer in a reaction catalysed by hemin. Acids were analysed using an IC instrument with an ED50 conductivity detector (ICS-2500 model, Dionex Corporation, Sunnyvale, CA, USA). The details of the sample processing and analysis are described in our previous work.[50–52] Blanks were sampled and analysed using the same method before the reaction.
Experimental procedures
Investigation of wall effect
In order to reduce interference from the reactions occurring on the chamber wall, the quartz reaction chamber was deactivated with OH radicals (the generation method is described in the OH-initiated oxidation section below) for more than 12 h beforehand. To investigate the wall effect, attenuation experiments of methyl nitrate and ethyl nitrate in pure N2 were performed in the chamber for a minimum of 12 h. The results of this experiment indicated that the wall loss of these two nitrates was negligible (i.e. <5 % loss over a 12-h period).
Photolysis
The reaction chamber was cleaned with N2 and evacuated four to five times before each experiment. Methyl nitrate (or ethyl nitrate) was then introduced into the evacuated reactor. After it had been evaporated completely, high-purity nitrogen or synthetic air (O2 : N2 = 1 : 4) was added to reach a total pressure of ~1.01 × 10⁵ Pa, resulting in the initial gaseous concentrations of 60–210 ppmv for methyl nitrate and 50–160 ppmv for ethyl nitrate. These values, which were approximately six orders of magnitude higher than those in the atmosphere, were used to better characterise the possible products formed. After the gases were homogenously mixed, the UV lamps were turned on and in-situ FTIR spectra were recorded to investigate the concentration changes of the reactants and products. The FTIR spectrometer collected a spectrum every 5 min during the reaction, allowing us to record reactant and product concentrations. The gaseous samples were drawn out of the reaction chamber and collected by a Horibe tube during the reaction, followed by HPLC and IC analysis. Two samplings were usually done at the reaction times of 40 and 80 min during each experiment and a 1.2-L sample of gas was drawn out for each sample. After each sampling process, N2 was quickly added into the reactor to keep the total pressure at ~1.01 × 10⁵ Pa, resulting in a slight dilution of the reactants and products. In order to obtain a uniform plot of the temporal evolution of reactants and products, the gas concentrations used in the plot, after each sampling process, were corrected by multiplying the corresponding concentrations measured in the reactor by the dilution ratio of 28.5/(28.5–1.2).
OH-initiated oxidation
For this experiment, OH radicals were generated by UV photolysis of O3 in the presence of water vapour:


The reactor was cleaned with N2 and evacuated four to five times before the experiment. Methyl nitrate (or ethyl nitrate) and water were introduced into the evacuated reactor in turn. After both had been evaporated completely, ozone in O2 gas, which was generated in a 5-L quartz cell beforehand, was added into the reactor, followed by addition of high-purity nitrogen to reach a total pressure of ~1.01 × 10⁵ Pa of synthetic air (O2 : N2 = 1 : 4). The initial concentrations of methyl nitrate and ethyl nitrate were the same as in the photolysis experiment described above. The initial concentration of O3 in the reactor was ~45 ppmv. The initial relative humidity in the reaction chamber was ~30 %. After the gases were homogenously mixed, the UV lamps were turned on, immediately generating OH radicals. The methods for determining the reactants and products were the same as in the photolysis experiment described above.
HNO3 loss
To estimate the actual yield of HNO3 in the OH-initiated reactions, we experimentally determined the loss rate of gaseous HNO3 in the reactor using the same conditions, including the humidity levels and UV irradiation, as used for the OH-initiated oxidation of CH3ONO2 or C2H5ONO2. In the HNO3 loss experiment, liquid fuming HNO3 was first introduced into the evacuated reactor and then liquid H2O was introduced. After the liquid H2O was evaporated completely, synthetic air was added to attain a total pressure of ~1.01 × 10⁵ Pa, resulting in a relative humidity of 30 % and the gaseous HNO3 concentrations were within 40–120 ppmv in the reactor. The HNO3 loss was monitored by FTIR spectroscopy at intervals of 5 min.
Results and discussion
Characterisation of products
Photolysis of CH3ONO2 and C2H5ONO2
In the standard FTIR spectrum of CH3ONO2 (Fig. 1a), the absorbance peaks can be assigned as follows[53]: 3014 cm–1, stretching vibration of methyl (group); 2965 cm–1, asymmetric stretching of methyl; 1469 cm–1, the bending of methyl; 1178 and 1139 cm–1, out of plane bend of methyl; 1675 cm–1, asymmetric stretching of NO2; 1291 cm–1, symmetric stretching of NO2 ; 1018 cm–1, stretching of C–O; 855 cm–1, stretching of N–O; 760 and 658 cm–1, out of plane bend of NO2.
|
C2H5ONO2 has a similar structure, and thus, most of its characteristic IR absorption bands are similar to those of CH3ONO2 (Fig. 1b): 3004 cm–1, stretching of methyl; 2996 cm–1, asymmetric stretching of methyl; 2939 cm–1, asymmetric stretching of methylene; 1652 cm–1, nitro asymmetric stretching; 1287 cm–1, nitro symmetric stretching; 1029 cm–1, stretching of C–O; 852 cm–1, stretching of N–O; 760 and 668 cm–1, out of plane bend of NO2. However, C2H5ONO2 has one more absorption band at 912 cm–1, which has not been assigned in this work.
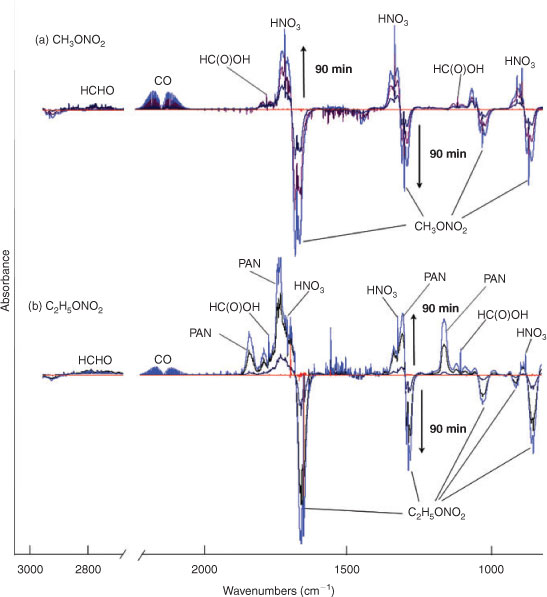
Fig. 2 shows the temporal evolution of FTIR spectra during the photolysis of (a) CH3ONO2 and (b) C2H5ONO2 in air (O2 : N2 = 1 : 4). Because the mixture of gases before photolysis was selected as the spectroscopic background, the negative absorbance represents the reactant consumption and the positive absorbance represents the product formation. As the aerobic reaction proceeded, the concentration of CH3ONO2 or C2H5ONO2 decreased and the products, which are indicated by the new peaks in the spectra, formed. On the basis of the subtraction analysis of the spectra, HNO3, HO2NO2, CO, HCHO and HC(O)OH were identified as the products in the photolysis of both CH3ONO2 and C2H5ONO2, with major absorption bands appearing at: 1711, 1326 and 879 cm–1 for HNO3; 1735, 1397, 1304 and 803 cm–1 for HO2NO2; 2229–2050 cm–1 for CO; 2926–2685 cm–1 for HCHO; and 1776 and 1105 cm–1 for HC(O)OH. Moreover, PAN was identified as a photolytic product of C2H5ONO2, with major bands at 1843, 1740, 1303 and 1164 cm–1. It is worth noting that the expected nitrogen-containing substances, including NO2, N2O5, NO, HONO, CH3ONO and C2H5ONO, were not detected when each of their standard spectra was used to make comparisons. However, HO2NO2, PAN and a non-reactive nitrogen-containing substance, namely HNO3, were found in these reactions conducted in air.
|
In the samples photolysed in air, we also identified peroxides, carbonyl compounds and acid ions using offline HPLC and IC as described in the experimental methods section. In addition to HCHO, HC(O)OH and HNO3 that were observed by in-situ FTIR spectroscopy as described above, hydrogen peroxide (H2O2) was detected as a product for the photolysis of both CH3ONO2 and C2H5ONO2. In C2H5ONO2 aerobic photolysis, four more products, CH3CHO, CH3C(O)OH, methyl hydroperoxide (MHP, CH3OOH) and peroxyacetic acid (PAA, CH3C(O)OOH), were detected.
We also investigated the UV photolysis of CH3ONO2 or C2H5ONO2 in pure N2 and found that the formed products included HCHO/CH3CHO, CO, HONO and NO, but excluded PAN, HNO3 and HO2NO2, products that were detected when the photolysis experiments were conducted in air. This result indicated that the presence of O2 will lead to a series of different nitrogen-containing products. Because the photolysis of CH3ONO2 and C2H5ONO2 in the pure N2 does not reflect the real atmosphere, we will not include any further discussion of this experiment.
OH-initiated oxidation of CH3ONO2 and C2H5ONO2
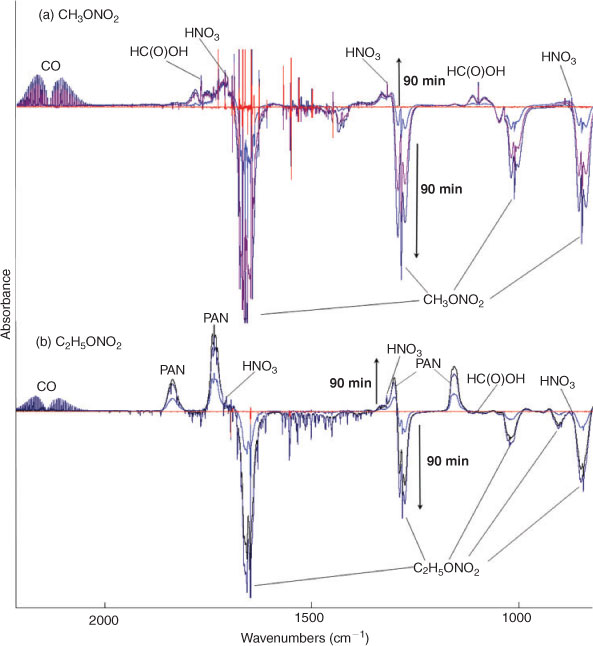
Fig. 3 shows the time series spectra of the OH-initiated oxidation of (a) CH3ONO2 and (b) C2H5ONO2 in air. The spectra of the mixture of gases obtained before the reaction was used as the spectroscopic background, resulting in negative absorbance for the reactant consumed and positive absorbance for the product formed. Based on the analysis of spectroscopic subtractions, HNO3, HO2NO2, CO, HCHO and HC(O)OH were detected as the main products for both CH3ONO2 and C2H5ONO2 reactions, and one more product, PAN, was also present for the C2H5ONO2 reaction. As in the photolysis system in the presence of O2, NO2, N2O5, NO, HONO, CH3ONO and C2H5ONO were also not detected in the OH-initiated oxidation of both methyl and ethyl nitrate.
|
Offline HPLC and IC were employed to further indentify the products formed. In addition to verification of the formation of HC(O)OH, HCHO and HNO3, which were detected by in-situ FTIR spectroscopy, this offline analysis revealed that H2O2 was produced in the CH3ONO2 reaction, and H2O2, CH3CHO, CH3OOH, CH3C(O)OOH and CH3C(O)OH were produced in the C2H5ONO2 reaction.
Quantification of products
Photolysis of CH3ONO2 and C2H5ONO2
We examined the temporal evolution of reactants and products in the UV photolysis of (a) ~200-ppmv CH3ONO2 and (b) ~150-ppmv C2H5ONO2 conducted in dry air (Fig. 4). The alkyl nitrate concentration decreased by 42 % at 40 min and 56 % at 80 min for CH3ONO2 and by 53 % at 40 min and 68 % at 80 min for C2H5ONO2. For both CH3ONO2 and C2H5ONO2 photolysis, the kinetic characterisations for several carbon-containing products were as follows: (i) the concentration of HCHO increased in the early part of the reaction and then decreased after ~40 min; (ii) the concentration of HC(O)OH increased gradually and then levelled to a constant value; and (iii) the concentration of CO increased steadily throughout the course of the study. For the nitrogen-containing products, the reaction intermediates were observed as follows: (i) the concentration of HO2NO2 remained at a low level, ~1–3 ppmv for CH3ONO2 photolysis and even lower for C2H5ONO2 photolysis; (ii) HNO3 increased gradually, approaching 82 and 62 ppmv for CH3ONO2 and C2H5ONO2 at 90 min; and (iii) the concentration of PAN in C2H5ONO2 photolysis reached a maximum at ~50 min, and levelled off at a constant value 38 ppmv.

|
The combined data obtained by FTIR, IC and HPLC analyses were used to estimate the yields of the products. In this study, a yield is defined as the ratio of the molar amount of a product formed versus the molar amount of the reactant consumed. The time series for observed yields of HNO3, HO2NO2 and PAN are displayed in Fig. 5. The yield of HNO3 was nearly constant throughout the reaction process, with ~76 % for CH3ONO2 photolysis and ~57 % for C2H5ONO2 photolysis. In order to estimate the wall effect of HNO3, we investigated the loss rate of gaseous HNO3 with ~100 ppmv in the reactor, under the same reaction conditions as the photolysis reaction of CH3ONO2 or C2H5ONO2. The result showed a loss of <5 % of HNO3 over 90 min, indicating that HNO3 adsorption onto the wall was minor under dry air conditions Thus, the yield of HNO3 observed by FTIR spectroscopy in the photolysis of CH3ONO2 or C2H5ONO2 was an accurate reflection of its actual yield. For CH3ONO2 photolysis, the yield of HO2NO2 reached 12 % at 5 min and decreased to 2 % at 90 min. For C2H5ONO2 photolysis, the yield of PAN remained at ~40 % throughout the reaction process. Peroxides were observed with low yields for both CH3ONO2 and C2H5ONO2 photolysis, probably because they are unstable and easily photodissociate by UV irradiation.
|
It is interesting that CH3C(O)OH was not detected by FTIR spectroscopy in either the photolysis or the OH-initiated oxidation of C2H5ONO2, but rather it was detected by IC at a level of ~40 ppmv, a much higher value than its detection limit by FTIR analysis. Moreover, the yield of CH3C(O)OH was found to be close to that of PAN which was detected by FTIR spectroscopy. We therefore propose that the CH3C(O)OH was a technical artefact produced by the hydrolysis of PAN collected in water for IC analysis, rather than by the reaction that occurred in the reactor.
The observed product yields and the carbon and nitrogen mass balances at 40 min are listed in Table 1. The experimental error represents 1σ (each experiment was repeated three to five times). It can be seen that the carbon balance was ~100 % within experimental error for the photolysis of both CH3ONO2 (113 ± 13 %) and C2H5ONO2 (110 ± 15 %), with major carbon products as HCHO, HC(O)OH and CO, whereas the C2H5ONO2 photolysis generated two more products, namely CH3CHO and PAN, both with high yields.

|
For C2H5ONO2 photolysis, the nitrogen balance observed by FTIR spectroscopy was ~100 % within experimental error (100 ± 12 %), with HNO3 and PAN as the main nitrogen-containing products; for CH3ONO2 photolysis, however, the nitrogen balance was only 79 ± 16 %, with HNO3 as the major product. To find the ‘missing nitrogen’ in this reaction, we employed IC to determine the HNO3 and the result showed that this HNO3 was higher than that detected by FTIR spectroscopy, affording a quantitative yield of HNO3, within experimental error. This result suggests that the unknown nitrogen-containing compound, not distinguished in the mixture by FTIR analysis, was hydrolysed into HNO3 during the sample preparation. By analogy with PAN formed in C2H5ONO2 photolysis, we tentatively consider this unknown nitrogen-containing compound as the homologue of PAN, namely, peroxyformyl nitrate (PFN, HC(O)OONO2). The formation of PFN in the irradiation of a HCHO + NO2 + Cl system in air was assumed by Gay et al. based on IR spectra,[54] but this was later corrected to be peroxy nitric acid by Hanst and Gay.[55] We could not identify PFN by FTIR spectroscopy because of the lack of its standard spectrum. We suggest that the difference between the yields of HNO3 detected by IC and FTIR analysis accounts for the yield of PFN. Noticeably, the carbon mass balance was ~100 % when only HC(O)OH was considered and PFN was not, as shown in Table 1. If PFN is added into this balance, the carbon mass balance will exceed 100 %, a condition that could not occur in the reaction. Unfortunately, it is difficult for us to quantify PFN and HC(O)OH simultaneously. For FTIR analysis, HC(O)OH might be overestimated by the absorption band overlap between the PFN and HC(O)OH, as both of them contain the HC(O) group. Contrastingly, for IC analysis, HC(O)OH might be produced by the hydrolysis of PFN in water. Obviously, the assumption of the formation of PFN is not convincing enough simply by the analogy with PAN, and further study is needed to identify this unknown nitrogen-containing compound.
OH-initiated oxidation of CH3ONO2 and C2H5ONO2
Fig. 6 shows the plot of the temporal evolution of reactants and products in the OH-initiated oxidation of (a) ~200-ppmv CH3ONO2 and (b) ~150-ppmv C2H5ONO2 in air with 30 % relative humidity. The alkyl nitrate concentration decreased by 53 % at 40 min and 74 % at 80 min for CH3ONO2, and 60 % at 40 min and 80 % at 80 min for C2H5ONO2. For both CH3ONO2 and C2H5ONO2 reactions, CO increased gradually with time; and HC(O)OH increased gradually and levelled off. For CH3ONO2, HCHO reached a maximum at 40 min and then decreased gradually, whereas for C2H5ONO2, HCHO was not evident in the FTIR spectra.

|
In the CH3ONO2 reaction, HO2NO2 was detected at low levels (~2 ppmv), and at even lower levels for the C2H5ONO2 reaction. PAN formed in the C2H5ONO2 reaction reached 59 ppmv at 90 min. HNO3 formed in both CH3ONO2 and C2H5ONO2 reactions was lower than that in their corresponding photolytic reactions, and obviously decreased with the reaction time. This result may imply that the rapid deposition of HNO3 or the formation of a complex of HNO3 with H2O would occur during the reaction because water vapour with 30 % relative humidity was present in the reactor; water was added to the chamber in order to generate OH. HNO3 is a ‘sticky’ molecule and is readily adsorbed onto surfaces, particularly if water is present.[56] In humid air, HNO3 can combine with H2O molecules to form (HNO3)x(H2O)y.[57] The loss rate of gaseous HNO3 is therefore much higher in humid air than in dry air.
The chemical fate of HNO3 was examined under the same conditions that were applied to those for the OH radical studies with the two nitrates, as fully described in the Experimental methods section. The result showed that the HNO3 could undergo a significant loss in the reactor under humid conditions. Combining the observed HNO3 yield and its rate of loss under the same conditions, we estimated the actual yield of HNO3 formed in the OH-initiated oxidation of CH3ONO2 and C2H5ONO2 (Fig. 7). The estimated actual yields remained almost constant, with ~50 % for the OH+ CH3ONO2 reaction and ~40 % for the OH+ C2H5ONO2 reaction, although the observed yields decreased gradually with reaction time because of the deposition of gaseous HNO3.

|
The yields of HO2NO2 and PAN from CH3ONO2 or C2H5ONO2 are also shown in Fig. 7. For the CH3ONO2 reaction, the yield of HO2NO2 decreased from 16 % at 1 min to 1 % at 70 min because of its instability (Fig. 7a). For the C2H5ONO2 reaction, the yield of PAN remained ~50 % throughout the reaction process. Peroxides were observed in the OH-initiated reactions but with a minor yield.
CO2 is potentially a product and should be estimated. Unfortunately, we could not detect its concentration directly by FTIR spectroscopy, because a part of the FTIR spectrometer’s optical path was exposed to the ambient air, resulting in an interference by ambient CO2. However, CO2 can be estimated by the kinetics of CO in the reactor, because CO2 is usually considered to be produced by the oxidation of CO. We investigated the respective oxidation rate of CO by O3 and OH radicals, under the same conditions as for the photolysis and OH-initiated oxidation of CH3ONO2 or C2H5ONO2. The result indicated that ~20 % of CO was oxidised by OH radicals in 60 min, whereas there was no obvious oxidation of CO in the CO + O3 reaction in 90 min. For the OH-initiated oxidation of CH3ONO2 or C2H5ONO2, the CO2 yield was then estimated using a linear fit on the basis of the observed CO concentration and OH+CO reaction rate (Table 1).
The yields of products and the carbon and nitrogen mass balances in the OH-initiated reactions are shown in Table 1. The carbon balance for reactions with both ANs approached 100 %, with high yields of CO, HCHO and HC(O)OH for the CH3ONO2 reaction, and high yields of CO and PAN for the C2H5ONO2 reaction. The results of nitrogen mass balance in the OH-initiated reactions were similar to the corresponding photolysis reactions, as follows: for the OH+C2H5ONO2 reaction, the main nitrogen-containing products were HNO3 and PAN; for the OH+CH3ONO2 reaction, HNO3 was detected as one main nitrogen-containing product, and PFN was proposed as another main nitrogen-containing product.
Reaction mechanisms based on observed products
Photolysis mechanism
For CH3ONO2 photolysis, two possible cleavage pathways exist that produce two different fragments, namely NO2 and ONO2, as follows:

If photolysis is dominated by the reaction 10a pathway and occurs in the absence of O2, HCHO, CO and HONO could be expected to form by the following reactions:


However, we observed HCHO, CO and HONO formation during CH3ONO2 photolysis in pure N2. The formation of HONO cannot be explained by the reaction 10b pathway. If the two pathways 10a and 10b coexist, HNO3 would be produced by the combination of ONO2 with CH3O or HCHO in the absence of O2:


However, this outcome is inconsistent with our experiment result which indicated no formation of HNO3 in the absence of O2. In summary, we suggest that the photolysis of CH3ONO2 follows the reaction 10a pathway exclusively. This is in agreement with the recent report for a NO2 quantum yield of unity from photodissociation of methyl and isopropyl nitrate.[58]
In the presence of O2, the H and HCO radicals formed from reactions 11 and 13b, will rapidly react with O2, resulting in the formation of HO2, H2O2 and OH (reactions 16–18), and the oxidisation of NO2 into HNO3 (reaction 20) and HO2NO2 (reaction 21). HC(O)O2 was reported to be the intermediate product in the HCO + O2 reaction, and it can decompose rapidly to CO and HO2 because of its instability (reactions 19).[59,60] In the present reaction system, we suggest that part of the HC(O)O2 reacts with NO2 to give HC(O)O2NO2 (PFN) before its decomposition (reaction 22):


Like CH3ONO2, C2H5ONO2 will undergo cleavage of the O–N bond, giving fragment pairs of CH3CH2O and NO2 (reaction 23). The subsequent set of reactions leads to the formation of HCHO, CH3CHO, CO, HNO3, HO2NO2, H2O2, etc. In addition, PAN, PAA and MHP are formed (reactions 28, 29a and 31).


For the photolysis of both CH3ONO2 and C2H5ONO2, formic acid was observed. It appears to be formed from HCHO and a HO2 radical[61]:


The above mechanisms agree well with the products observed in our experiments, which gave the observed carbon and nitrogen mass balances, although PFN was not directly identified.
The low level of the observed HO2NO2 can be explained as follows. First, we estimated the reaction rates of HO2 + NO2 and HO2 + HO2. The rate constants are 1.4 × 10⁻¹² cm3 molecule–1 s–1 for kHO2+NO2 and 2.9 × 10⁻¹² cm3 molecule–1 s–1 for kHO2+HO2 at 1 atm and 298 K.[62] Because of the lack of experimental values, the concentrations of NO2 and HO2 in the CH3ONO2 photolysis were estimated using the same box model method as that for C2H5ONO2 photolysis described below. The model output gave the concentrations of ~3.7 × 10¹¹ molecule cm–3 for HO2 and ~2.2 × 10¹² molecule cm–3 for NO2. Combining the concentrations with rate constants, the reaction rates are estimated as 1.1 × 10¹² molecule cm–3 s–1 for the HO2 + NO2 reaction and 0.4 × 10¹² molecule cm–3 s–1 for the HO2 + HO2 reaction. This result indicates that the formation of HO2NO2 will compete with that of H2O2. However, HO2NO2 will be rapidly lost by photodissociation,[63] thermal decomposition,[64] and reaction with OH,[65] resulting in its low photostationary state concentration. This is verified by the model, which gives its photostationary state concentration as ~3 ppmv.
As shown in Table 1, the observed yields of peroxides, including H2O2, MHP and PAA, are considerably low (~1 %) in the photolysis of C2H5ONO2, owing to their instability. CH3C(O)OH was not detected by FTIR spectroscopy, although it should be produced by the CH3C(O)O2 + HO2 reaction (reaction 29b). This outcome implies that the branching ratio of reaction 29b is minor compared with that of reaction 29a and 29c.[66,67]
Although our instrument did not detect the NO2 that was expected to form according to the proposed mechanism, we have simulated its concentration in the photolysis of C2H5ONO2 using a box model on the basis of the Carbon Bond Mechanism-Version IV (CBM-IV) developed by Gery et al.[68] In the present study, we modified the CBM-IV mechanism by deleting some irrelevant reactions and adding the C2H5ONO2-related reactions. We estimated the photon flux at 254 nm of the UV irradiation by the measured photolysis rate of C2H5ONO2 (its cross-section is known from the literature) and then estimated the photolysis rates of the other species using this photon flux. The experimental initial reactant concentrations, namely, 155 ppmv for C2H5ONO2 and 2 × 10⁵ ppmv for O2, were input into the model. Fig. 8 shows the model results for the concentration variations of C2H5ONO2 and the main nitrogen-containing products. The modelled concentrations of PAN (maximum ~80 ppmv) are higher than those measured in our experiments (maximum ~60 ppmv) and those of HNO3 are lower (modelled ~35 ppmv, measured ~50 ppmv). This discrepancy may arise from the uncertainties in the kinetic parameters used in the model. Several of the rate constants used in the model are limited and uncertain, including those for the formation of PAN (kPAN,f) and HNO3 (kHNO3,f). Obviously, decreasing kPAN,f or increasing kHNO3,f would improve the modelled results. It is evident that NO2 was produced and then was rapidly transformed into PAN and HNO3, resulting in a maximum level of ~2 ppmv for the photostationary state of NO2, and a much lower NO level. The NOx photostationary state was achieved at ~40 min after the photolysis reaction began. As a result, the FTIR analysis was not able to detect NOx at such a low level. Moreover, it is suggested that the initial excitation in the photodissociation of CH3ONO2 is located on the NO2 moiety, and most of the available energy is deposited in it.[69,70] It is worth mentioning that we carried out an additional experiment in which ~40 ppmv of NO2 was added to the CH3ONO2 photolysis system. The result showed that the production rate of HNO3 in this NO2-suplemented system had no obvious changes, compared with the control system containing no NO2. This result implies that the added NO2 reacts much more slowly than does the NO2 in the excited-state derived from the photodissociation of CH3ONO2. This outcome may also indicate that the reaction of excited-state NO2 (NO2*) to form HNO3 and peroxyacyl nitrates is competitive with its quenching. Therefore, we suggest that the NO2* fragment from the CH3ONO2 or C2H5ONO2 photolysis may have extra energy (in an electronically excited state), making it much more reactive than ground state NO2 in the atmosphere, resulting in the formation of more HNO3 and peroxyacyl nitrates (RC(O)OONO2, PAN and the homologue of PAN). To our knowledge, we have not found specific reports on the amount of extra energy in the NO2* formed in the photolysis of methyl and ethyl nitrates. Unfortunately, we currently cannot make an estimation on the extra energy in the NO2* and the dominant modes.
|
OH-initiated oxidation mechanism
In the OH-initiated oxidation of ANs, the OH radicals were produced by UV photolysis of O3 in the presence of water vapour. Because of the use of UV irradiation, the photolytic reaction should occur simultaneously. However, we observed that the consumption rate of CH3ONO2 or C2H5ONO2 in the OH-initiated oxidation was ~30 % higher than that in the corresponding photolysis, indicating that the OH-initiated oxidation was the dominant pathway in the reaction system.
For this study, the reactions of CH3ONO2 and C2H5ONO2 with OH radicals were carried out in simulated atmospheric conditions, and HNO3 was detected as a major product. The OH reaction has two different pathways, namely, addition and H-atom abstraction. As the H-atom abstraction could produce bifunctional organic nitrates such as carbonyl-nitrates,[71] rather than HNO3 or PAN, we think that this pathway should not predominate. Alternatively, the OH addition is possibly the dominant pathway in these reactions, resulting in the formation of an unstable adduct (reactions 37 and 38). This view is supported by Nielsen et al.[41]
The adduct has two routes for its decomposition: (1) the direct formation of HNO3, accompanied by the formation of the alkoxy radical (reactions 37a and 38a); and (2) formation of the excited NO2* and alkyl peroxides (reactions 37b and 38b). CH3OOH and C2H5OOH, which are formed in reactions 37b and 38b, will be rapidly transformed into other products by their photodissociation and reactions with OH, leading to their low photostationary state concentrations. HNO3, HO2NO2, PFN or PAN are produced in the subsequent reactions of NO2*. This mechanism is similar to the photolysis system described previously.
PAN was observed with a high yield in the OH-initiated oxidation of C2H5ONO2, and this implies that the excited NO2* was produced by the second decomposition pathway for the adduct (reactions 37b and 38b) because no evidence was reported for the formation of PAN by direct decomposition of the adduct. However, Nielsen et al.[41] suggested a pathway leading to the direct decomposition of the adduct into HNO3 (reactions 37a and 38a). These two routes for the adduct decomposition likely coexist and the branch ratio possibly approaches 1 : 1, considering the observed HNO3/peroxyacyl nitrates ratio of ~1 : 1, as seen in Table 1. Unfortunately, we cannot determine the relative contributions of these two channels in the present experimental study.


In summary, for the OH-initiated oxidation of ANs, there are two pathways to form HNO3, namely, direct OH-adduct decomposition and OH+NO2* reaction, whereas for the photolysis of ANs, the OH+NO2* reaction is the only pathway. We note that the yield of the OH+NO2* pathway leading to HNO3 could be different between the laboratory conditions presented in this paper and atmospheric conditions. In the atmosphere, whether NO2* competes effectively for OH to form HNO3 very much depends on the atmospheric composition and conditions. In the photolytic reaction, small concentrations of OH radicals were produced by a series of reactions after the cleavage of the alkyl nitrate O–N bond; in the OH-initiated reaction, the OH radicals were produced by the photolysis of O3 in the presence of water vapour (reactions 8 and 9). It is expected that the OH radicals in the OH-reaction are much more abundant than those in the photolysis. This can also explain the discrepancy regarding the CH3CHO and PAN concentrations observed between the photolysis and OH-initiated reaction of C2H5ONO2 (Table 1). As mentioned above, acetaldehyde is transformed into PAN through the OH-initiated reactions (reactions 26–28). The higher OH level in the OH-initiated reactions of C2H5ONO2 results in the lower CH3CHO level as well as higher PAN level relative to those in the photolytic oxidation reaction of C2H5ONO2.
Conclusions and environmental implications
Under simulated atmospheric conditions, we have for the first time carried out a laboratory study of the atmospheric photochemical reactions of CH3ONO2 and C2H5ONO2, which served as models of ANs. A series of intermediate and end products, including carbon- and nitrogen-containing compounds, were well characterised, and the carbon and nitrogen balances based on these observed compounds were ~100 %, within experimental error (1σ) for the reactions. Notably, for both photolysis and OH-initiated reactions of CH3ONO2 and C2H5ONO2, HNO3 was found to be a major nitrogen-containing product with a yield of ~50 % or more, whereas PAN was observed in C2H5ONO2 reactions and PFN was proposed as a product in CH3ONO2 reactions with significant yields. The detailed mechanisms of these reactions have been deduced based on the experimental results. Noticeably, we used a Hg lamp (λmax = 254 nm) as the light source because it can provide enough UV intensity to encompass the AN photolysis lifetime in one hour at a controlled temperature. We propose that this UV wavelength, which is shorter than that in the troposphere, would not significantly change the reaction mechanism of ANs, which is intensively concerned in the present study, although the reaction rates and the product yields would be different from that in the troposphere.
The present study has revealed that the photochemical reactions of CH3ONO2 and C2H5ONO2 in the atmosphere would ultimately produce PAN or PFN, a reactive nitrogen-containing substance, and HNO3, a photochemically non-reactive nitrogen-containing substance. It is expected that the higher-weight ANs might undergo a similar atmospheric fate. This finding implies that ANs may serve as not only a reservoir but also as a sink for reactive nitrogen in the atmosphere. Such a dual role for ANs in the nitrogen cycle should be considered in the models in regard to air quality and nitrogen exchange between atmosphere and surface.
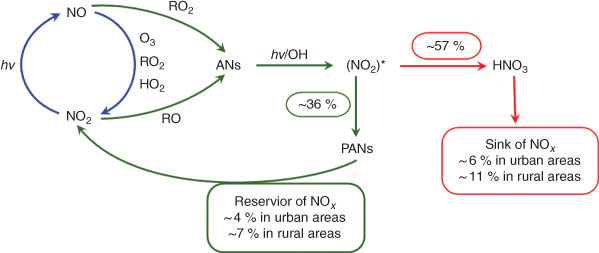
Herein, we have attempted to estimate the production of HNO3 and peroxyacyl nitrates derived from NOx by way of ANs as intermediates in the atmosphere on the basis of their yields obtained by our experiments. The average yields from CH3ONO2 and C2H5ONO2 photolytic and OH-initiated decompositions (Table 1) are 57 % for HNO3 and 36 % for peroxyacyl nitrates. We assume that these experimental yields approximate their yields in the real atmosphere. Recent measurements indicated that ∑ANs comprise a large fraction of NOy[2,3,14]; the result from the model analysis also suggested that ∑ANs represent a large fraction of NOy, with 5–42 % for a rural scenario and 2–16 % for an urban scenario.[72] Summarising the observed and model results, we suggest that ∑ANs comprise ~10 % of the NOy in urban areas and ~20 % in rural areas. As mentioned earlier, ANs in the continental atmosphere are mainly produced from the reactions of NOx. This means that 10 and 20 % of NOx is converted into ANs in urban and rural atmospheres. Combining the percentages of ANs in NOx transformation with HNO3 and PAN yields from ANs, we estimate here that ANs account for the sink and reservoir fractions of NOx by two scenarios: (i) in the urban atmosphere, HNO3 makes up ~6 % of the nitrogen sink and ~4 % of the nitrogen reservoir is composed of peroxyacyl nitrates; and (ii) in the rural atmosphere, HNO3 comprises ~11 % of the nitrogen sink and ~7 % of the nitrogen reservoir is peroxyacyl nitrates. This estimation is illustrated in Fig. 9. These sink and reservoir contributions are significant for the total NOx cycle, especially in rural areas.
|
Recently, a modelling study on global atmospheric chemistry pointed out that PAN has increased globally by 9 % from megacities under year 2000 conditions.[73] We hope our findings will be useful for a better understanding of this global PAN change.
Acknowledgements
The authors gratefully thank the National Natural Science Foundation of China (grants 40875072 and 20677002) for their financial support. The authors gratefully thank Dr John Orlando, National Center for Atmospheric Research of USA, for his supply of the nitric acid IR spectrum, and gratefully thank several anonymous reviewers because their helpful comments and suggestions greatly improved the paper.
References
[1] B. J. Finlayson-Pitts, J. N. Pitts, Tropospheric air pollution: ozone, airborne toxics, polycyclic aromatic hydrocarbons, and particles. Science 1997, 276, 1045.| Tropospheric air pollution: ozone, airborne toxics, polycyclic aromatic hydrocarbons, and particles.Crossref | GoogleScholarGoogle Scholar | 1:CAS:528:DyaK2sXjt12ls7s%3D&md5=f365eade2da0a89f1f58c141fe6ab513CAS |
[2] D. A. Day, M. B. Dillon, P. J. Wooldridge, J. A. Thornton, R. S. Rosen, E. C. Wood, R. C. Cohen, On alkyl nitrates, O3, and the ‘missing NOy’. J. Geophys. Res. 2003, 108, 4501.
| On alkyl nitrates, O3, and the ‘missing NOy’.Crossref | GoogleScholarGoogle Scholar |
[3] R. S. Rosen, E. C. Wood, P. J. Wooldridge, J. A. Thornton, D. A. Day, W. Kuster, E. J. Williams, B. T. Jobson, R. C. Cohen, Observations of total alkyl nitrates during Texas Air Quality Study 2000: implications for O3 and alkyl nitrate photochemistry. J. Geophys. Res. 2004, 109, D07303.
| Observations of total alkyl nitrates during Texas Air Quality Study 2000: implications for O3 and alkyl nitrate photochemistry.Crossref | GoogleScholarGoogle Scholar |
[4] R. S. Russo, Y. Zhou, K. B. Haase, O. W. Wingenter, E. K. Frinak, H. Mao, R. W. Talbot, B. C. Sive, Temporal variability, sources, and sinks of C1–C5 alkyl nitrates in coastal New England. Atmos. Chem. Phys. 2010, 10, 1865.
| Temporal variability, sources, and sinks of C1–C5 alkyl nitrates in coastal New England.Crossref | GoogleScholarGoogle Scholar | 1:CAS:528:DC%2BC3cXjsl2qs7Y%3D&md5=a9089f09df14f6b023f402d339e0426aCAS |
[5] I. J. Simpson, T. Wang, H. Guo, Y. H. Kwok, F. Flocke, E. Atlas, S. Meinardi, F. S. Rowland, D. R. Blake, Long-term atmospheric measurements of C1–C5 alkyl nitrates in the Pearl River Delta region of southeast China. Atmos. Environ. 2006, 40, 1619.
| Long-term atmospheric measurements of C1–C5 alkyl nitrates in the Pearl River Delta region of southeast China.Crossref | GoogleScholarGoogle Scholar | 1:CAS:528:DC%2BD28Xht1Giu78%3D&md5=4edd11c8ee1c6febf03ced6140fb76a8CAS |
[6] J. W. Bottenheim, L. A. Barrie, E. Atlas, The partitioning of nitrogen oxides in the lower Arctic troposphere during spring 1988. J. Atmos. Chem. 1993, 17, 15.
| The partitioning of nitrogen oxides in the lower Arctic troposphere during spring 1988.Crossref | GoogleScholarGoogle Scholar | 1:CAS:528:DyaK3sXmtV2nsrs%3D&md5=98e58791f0221d3597ccfa269dcf2102CAS |
[7] E. Atlas, W. Pollock, J. Greenberg, L. Heidt, A. M. Thompson, Alkyl nitrates, nonmethane hydrocarbons, and halocarbon gases over the equatorial Pacific Ocean during SAGA 3. J. Geophys. Res. 1993, 98, 16933.
| Alkyl nitrates, nonmethane hydrocarbons, and halocarbon gases over the equatorial Pacific Ocean during SAGA 3.Crossref | GoogleScholarGoogle Scholar | 1:CAS:528:DyaK2cXosFSltA%3D%3D&md5=49793ae2934704cf02d9bd642ba15e66CAS |
[8] K. Muthuramu, P. B. Shepson, J. W. Bottenheim, B. T. Jobson, H. Niki, K. G. Anlauf, Relationships between organic nitrates and surface ozone destruction during Polar Sunrise experiment 1992. J. Geophys. Res. 1994, 99, 25369.
| Relationships between organic nitrates and surface ozone destruction during Polar Sunrise experiment 1992.Crossref | GoogleScholarGoogle Scholar |
[9] B. A. Ridley, E. L. Atlas, J. G. Walega, G. L. Kok, T. A. Staffelbach, J. P. Greenberg, F. E. Grahek, P. G. Hess, D. D. Montzka, Aircraft measurements made during the spring maximum of ozone over Hawaii: peroxides, CO, O3, NOy, condensation nuclei, selected hydrocarbons, halocarbons, and alkyl nitrates between 0.5 and 9 km altitude. J. Geophys. Res. 1997, 102, 18935.
| Aircraft measurements made during the spring maximum of ozone over Hawaii: peroxides, CO, O3, NOy, condensation nuclei, selected hydrocarbons, halocarbons, and alkyl nitrates between 0.5 and 9 km altitude.Crossref | GoogleScholarGoogle Scholar | 1:CAS:528:DyaK2sXlvFKks74%3D&md5=ed7bbb4d0595144973bfbf990b0dfcf2CAS |
[10] A. E. Jones, R. Weller, A. Minikin, E. W. Wolff, W. T. Sturges, H. P. McIntyre, S. R. Leonard, O. Schrems, S. Bauguitte, Oxidized nitrogen chemistry and speciation in the Antarctic troposphere. J. Geophys. Res. 1999, 104, 21355.
| Oxidized nitrogen chemistry and speciation in the Antarctic troposphere.Crossref | GoogleScholarGoogle Scholar | 1:CAS:528:DyaK1MXmsFOgu7k%3D&md5=9412c7827508ae95335b7bdd05889ff6CAS |
[11] R. Talbot, J. Dibb, E. Scheuer, G. Seid, R. Russo, S. Sandholm, D. Tan, H. Singh, D. Blake, N. Blake, E. Atlas, G. Sachse, C. Jordan, M. Avery, Reactive nitrogen in Asian continental outflow over the western Pacific: results from the NASA transport and chemical evolution over the Pacific (TRACE-P) airborne mission. J. Geophys. Res. 2003, 108, 8803.
| Reactive nitrogen in Asian continental outflow over the western Pacific: results from the NASA transport and chemical evolution over the Pacific (TRACE-P) airborne mission.Crossref | GoogleScholarGoogle Scholar |
[12] N. J. Blake, D. R. Blake, A. L. Swanson, E. Atlas, F. Flocke, F. S. Rowland, Latitudinal, vertical, and seasonal variations of C1–C4 alkyl nitrates in the troposphere over the Pacific Ocean during PEM-Tropics A and B: oceanic and continental sources. J. Geophys. Res. 2003, 108, 8242.
| Latitudinal, vertical, and seasonal variations of C1–C4 alkyl nitrates in the troposphere over the Pacific Ocean during PEM-Tropics A and B: oceanic and continental sources.Crossref | GoogleScholarGoogle Scholar |
[13] N. J. Blake, D. R. Blake, B. C. Sive, A. S. Katzenstein, S. Meinardi, O. W. Wingenter, E. L. Atlas, F. Flocke, B. A. Ridley, F. S. Rowland, The seasonal evolution of NMHCs and light alkyl nitrates at middle to high northern latitudes during TOPSE. J. Geophys. Res. 2003, 108, 8359.
| The seasonal evolution of NMHCs and light alkyl nitrates at middle to high northern latitudes during TOPSE.Crossref | GoogleScholarGoogle Scholar |
[14] A. E. Perring, T. H. Bertram, P. J. Wooldridge, A. Fried, B. G. Heikes, J. Dibb, J. D. Crounse, P. O. Wennberg, N. J. Blake, D. R. Blake, W. H. Brune, H. B. Singh, R. C. Cohen, Airborne observations of total RONO2: new constraints on the yield and lifetime of isoprene nitrates. Atmos. Chem. Phys. 2009, 9, 1451.
| Airborne observations of total RONO2: new constraints on the yield and lifetime of isoprene nitrates.Crossref | GoogleScholarGoogle Scholar | 1:CAS:528:DC%2BD1MXntFKhu70%3D&md5=835ca6962e63669f8027b7c409047d78CAS |
[15] P. Giacopelli, K. Ford, C. Espada, P. B. Shepson, Comparison of the measured and simulated isoprene nitrate distributions above a forest canopy. J. Geophys. Res. 2005, 110, D01304.
| Comparison of the measured and simulated isoprene nitrate distributions above a forest canopy.Crossref | GoogleScholarGoogle Scholar |
[16] J. W. Grossenbacher, D. J. Barket, P. B. Shepson, M. A. Carroll, K. Olszyna, E. Apel, A comparison of isoprene nitrate concentrations at two forest-impacted sites. J. Geophys. Res. 2004, 109, D11311.
| A comparison of isoprene nitrate concentrations at two forest-impacted sites.Crossref | GoogleScholarGoogle Scholar |
[17] F. Flocke, E. Atlas, S. Madronich, S. M. Shauffler, K. Aikin, J. J. Margitan, T. P. Bui, Observations of methyl nitrate in the lower stratosphere during STRAT: implications for its gas phase production mechanisms. Geophys. Res. Lett. 1998, 25, 1891.
| Observations of methyl nitrate in the lower stratosphere during STRAT: implications for its gas phase production mechanisms.Crossref | GoogleScholarGoogle Scholar | 1:CAS:528:DyaK1cXktVSrtbo%3D&md5=6d34a3667c9a5e5e0b66165c04e5d1acCAS |
[18] K. R. Darnall, W. P. L. Carter, A. M. Winer, A. C. Lloyd, J. N. Pitts, Importance of RO2+NO in alkyl nitrate formation from C4–C6 alkane photooxidations under simulated atmospheric conditions. J. Phys. Chem. A 1976, 80, 1948.
| 1:CAS:528:DyaE28XkvFymtbY%3D&md5=74d2c1fed3a09f923450de4b60ea6c67CAS |
[19] R. Atkinson, S. M. Aschmann, W. P. L. Carter, A. M. Winer, J. N. Pitts, Alkyl nitrate formation from the NOx-air photooxidations of C2–C8 n-alkanes. J. Phys. Chem. A 1982, 86, 4563.
| 1:CAS:528:DyaL38XlvVOgtLg%3D&md5=89277f14bfa38ef7be682097848fdcf2CAS |
[20] D. A. Day, D. K. Farmer, A. H. Goldstein, P. J. Wooldridge, C. Minejima, R. C. Cohen, Observations of NOx, ΣPNs, ΣANs, and HNO3 at a rural site in the California Sierra Nevada Mountains: summertime diurnal cycles. Atmos. Chem. Phys. 2009, 9, 4879.
| Observations of NOx, ΣPNs, ΣANs, and HNO3 at a rural site in the California Sierra Nevada Mountains: summertime diurnal cycles.Crossref | GoogleScholarGoogle Scholar | 1:CAS:528:DC%2BD1MXhsFGitr%2FF&md5=d7055ac6a5487bda4098b37fb6dcbf58CAS |
[21] S. P. Sander, R. R. Friedl, A. R. Ravishankara, D. M. Golden, C. E. Kolb, M. J. Kurylo, M. J. Molina, G. K. Moortgat, H. Keller-Rudek, B. J. Finlayson-Pitts, P. H. Wine, R. E. Huie, V. L. Orkin, Chemical Kinetics and Photochemical Data for Use in Atmospheric Studies Evaluation Number 15, JPL Publication 06-2 2006 (Jet propulsion laboratory: Pasadena, CA).
[22] F. Flocke, T. A. Volz, H. J. Buers, W. Patz, H. J. Garthe, D. Kley, Long-term measurements of alkyl nitrates in southern Germany 1. General behavior and seasonal and diurnal variation. J. Geophys. Res. 1998, 103, 5729.
| Long-term measurements of alkyl nitrates in southern Germany 1. General behavior and seasonal and diurnal variation.Crossref | GoogleScholarGoogle Scholar | 1:CAS:528:DyaK1cXit1Smurk%3D&md5=f80180e48cdedd1d89781d89ec7f8bb1CAS |
[23] Z. M. Chen, C. X. Wang, Rate constants of the gas-phase reactions of CH3OOH with O3 and NOx at 293 K. Chem. Phys. Lett. 2006, 424, 233.
| Rate constants of the gas-phase reactions of CH3OOH with O3 and NOx at 293 K.Crossref | GoogleScholarGoogle Scholar | 1:CAS:528:DC%2BD28Xls1GrtLw%3D&md5=feb3152f4f38ce7e6f2a3bf023bea161CAS |
[24] C. X. Wang, Z. M. Chen, An experimental study for rate constants of the gas phase reactions of CH3CH2OOH with OH radicals, O3, NO2 and NO. Atmos. Environ. 2008, 42, 6614.
| An experimental study for rate constants of the gas phase reactions of CH3CH2OOH with OH radicals, O3, NO2 and NO.Crossref | GoogleScholarGoogle Scholar | 1:CAS:528:DC%2BD1cXhtFSqtrzJ&md5=d7e68e0d6ce630d6c247f0dc926b2f79CAS |
[25] S. M. Fan, D. J. Jacob, D. L. Mauzerall, J. D. Bradshaw, S. T. Sandholm, D. R. Blake, H. B. Singh, R. W. Talbot, G. L. Gregory, G. W. Sachse, Origin of thropospheric NOx over sub-Arctic eastern Canada in summer. J. Geophys. Res. 1994, 99, 16867.
| Origin of thropospheric NOx over sub-Arctic eastern Canada in summer.Crossref | GoogleScholarGoogle Scholar | 1:CAS:528:DyaK2cXmvVeqsb8%3D&md5=9eba09f420f1e411d7e38c6550c971ecCAS |
[26] J. G. Walega, B. A. Ridley, S. Madronic, F. E. Grahek, J. D. Shetter, T. D. Sauvain, C. J. Hahn, J. T. Merrill, B. A. Bodhaine, E. Robinson, Observations of peroxyacetyl nitrate, peroxyproprionyl nitrate, methyl nitrate and ozone during the Mauna Loa Observatory photochemistry experiment. J. Geophys. Res. 1992, 97, 10311.
| 1:CAS:528:DyaK3sXisFaltg%3D%3D&md5=f69bbcfa0eb300c550cf9f34c0926170CAS |
[27] A. L. Chuck, S. M. Turner, P. S. Liss, Direct evidence for a marine source of C1 and C2 alkyl nitrates. Science 2002, 297, 1151.
| Direct evidence for a marine source of C1 and C2 alkyl nitrates.Crossref | GoogleScholarGoogle Scholar | 1:CAS:528:DC%2BD38XmsVOhsr4%3D&md5=a551bb4713b191af948f69f361c3baacCAS |
[28] J. R. Barker, D. M. Golden, Master equation analysis of pressure-dependent atmospheric reactions. Chem. Rev. 2003, 103, 4577.
| Master equation analysis of pressure-dependent atmospheric reactions.Crossref | GoogleScholarGoogle Scholar | 1:CAS:528:DC%2BD3sXotlaqs7k%3D&md5=a0c5cade73d7572dfb188a04800cb825CAS |
[29] I. J. Simpson, S. Meinardi, D. R. Blake, N. J. Blake, F. S. Rowland, E. Atlas, F. Flocke, A biomass burning source of C1–C4 alkyl nitrates. Geophys. Res. Lett. 2002, 29, 2168.
| A biomass burning source of C1–C4 alkyl nitrates.Crossref | GoogleScholarGoogle Scholar |
[30] K. Ballschmiter, A marine source for alkyl nitrates. Science 2002, 297, 1127.
| A marine source for alkyl nitrates.Crossref | GoogleScholarGoogle Scholar | 1:CAS:528:DC%2BD38XmsVOiur0%3D&md5=4b1b0c4c908aae131e0bc27a5435517bCAS |
[31] M. A. Hiskey, K. R. Brower, J. C. Oxley, Thermal decomposition of nitrate esters. J. Phys. Chem. A 1991, 95, 3955.
| 1:CAS:528:DyaK3MXit1yhsL4%3D&md5=3f979935adcb2395eb446769794cb79bCAS |
[32] P. Politzer, J. M. Seminario, M. C. Concha, A. G. Zacarias, Density-functional investigation of some decomposition routes of methyl nitrate. Int. J. Quantum Chem. 1997, 64, 205.
| Density-functional investigation of some decomposition routes of methyl nitrate.Crossref | GoogleScholarGoogle Scholar | 1:CAS:528:DyaK2sXkvVSiu78%3D&md5=fabee11bbee52365830bd6787713719eCAS |
[33] W. T. Luke, R. R. Dickerson, L. J. Nunnermacker, Direct measurements of the photolysis rate cofficients and Henry’s Law constants of several alkyl nitrates. J. Geophys. Res. 1989, 94, 14905.
| Direct measurements of the photolysis rate cofficients and Henry’s Law constants of several alkyl nitrates.Crossref | GoogleScholarGoogle Scholar | 1:CAS:528:DyaK3cXltlGqtrY%3D&md5=4475b9a3b12cd86bf8ecd8c2d2aab270CAS |
[34] R. E. Rebbert, Primary processes in the photolysis of ethyl nitrate. J. Phys. Chem. A 1963, 67, 1923.
| 1:CAS:528:DyaF3sXks1Kruro%3D&md5=e0f3c575020104a210d60ccc8a8824ceCAS |
[35] P. Gray, G. T. Rogers, The explosion and decomposition of methyl nitrate in the gas phase. J. Chem. Soc., Faraday Trans. 1954, 50, 28.
| The explosion and decomposition of methyl nitrate in the gas phase.Crossref | GoogleScholarGoogle Scholar | 1:CAS:528:DyaG2cXlvFajsA%3D%3D&md5=72ac2a144ff65aba14f7f9ce3c07fcb2CAS |
[36] J. A. Gray, D. W. G. Style, The photolysis of methyl nitrate. J. Chem. Soc., Faraday Trans. 1953, 49, 52.
| The photolysis of methyl nitrate.Crossref | GoogleScholarGoogle Scholar | 1:CAS:528:DyaG3sXktlOmsA%3D%3D&md5=cff4a86e1c759bb0ead5e4416c801393CAS |
[37] A. M. Renlund, W. M. Trott, ArF laser-induced decomposition of simple energetic molecules. Chem. Phys. Lett. 1984, 107, 555.
| ArF laser-induced decomposition of simple energetic molecules.Crossref | GoogleScholarGoogle Scholar | 1:CAS:528:DyaL2cXltFegur4%3D&md5=db72402ad1b8cdbcb93ad834c661ac07CAS |
[38] L. Zhu, C. F. Ding, Temperature dependence of the near UV absorption spectra and photolysis products of ethyl nitrate. Chem. Phys. Lett. 1997, 265, 177.
| Temperature dependence of the near UV absorption spectra and photolysis products of ethyl nitrate.Crossref | GoogleScholarGoogle Scholar | 1:CAS:528:DyaK2sXmsVaiug%3D%3D&md5=624aae6872edd1e6c46b3d06edb11db7CAS |
[39] R. K. Talukdar, J. B. Burkholder, M. Hunter, M. K. Gilles, J. M. Roberts, A. R. Ravishankara, Atmospheric fate of several alkyl nitrates. Part 2: UV absorption cross-sections and photodissociation quantum yields. J. Chem. Soc., Faraday Trans. 1997, 93, 2797.
| Atmospheric fate of several alkyl nitrates. Part 2: UV absorption cross-sections and photodissociation quantum yields.Crossref | GoogleScholarGoogle Scholar | 1:CAS:528:DyaK2sXlsl2lt7s%3D&md5=0114ac94f1533f24b303c4d9fa1111c7CAS |
[40] J. S. Gaffney, R. Fajer, G. I. Senum, J. H. Lee, Measurement of the reactivity of OH with methyl nitrate: Implications for prediction of alkyl nitrate-OH reaction rates. Int. J. Chem. Kinet. 1986, 18, 399.
| Measurement of the reactivity of OH with methyl nitrate: Implications for prediction of alkyl nitrate-OH reaction rates.Crossref | GoogleScholarGoogle Scholar | 1:CAS:528:DyaL2sXkvFCjsw%3D%3D&md5=04fd998f93036403b257294dcf0ec017CAS |
[41] O. J. Nielsen, H. W. Sidebottom, M. D. J. Treacy, An absolute- and relative-rate study of the gas-phase reaction of OH radicals and Cl atoms with n-alkyl nitrates. Chem. Phys. Lett. 1991, 178, 163.
| An absolute- and relative-rate study of the gas-phase reaction of OH radicals and Cl atoms with n-alkyl nitrates.Crossref | GoogleScholarGoogle Scholar | 1:CAS:528:DyaK3MXktVOrsbs%3D&md5=0b91804ceaf8b2454b73f63064226385CAS |
[42] M. Kakesu, H. Bandow, N. Takenaka, Y. Maeda, N. Washida, Kinetic measurements of methyl and ethyl nitrate reactions with OH radicals. Int. J. Chem. Kinet. 1997, 29, 933.
| Kinetic measurements of methyl and ethyl nitrate reactions with OH radicals.Crossref | GoogleScholarGoogle Scholar | 1:CAS:528:DyaK2sXnvFelsr4%3D&md5=5705d334cd32b4bcc9f57f07dfc4f3d0CAS |
[43] D. E. Shallcross, P. Biggs, C. E. Canosa-Mas, K. C. Clemitshaw, M. G. Harrison, M. R. L. Alanon, J. A. Pyle, A. Vipond, R. P. Wayne, Rate constants for the reaction between OH and CH3ONO2 and C2H5ONO2 over a range of pressure and temperature. J. Chem. Soc., Faraday Trans. 1997, 93, 2807.
| Rate constants for the reaction between OH and CH3ONO2 and C2H5ONO2 over a range of pressure and temperature.Crossref | GoogleScholarGoogle Scholar | 1:CAS:528:DyaK2sXlsl2lt7g%3D&md5=f8c79171558d0696f12390c4275ba313CAS |
[44] R. K. Talukdar, S. C. Herndon, J. B. Burkholder, J. M. Roberts, A. R. Ravishankara, Atmospheric fate of several alkyl nitrates. Part 1: rate coefficients of the reactions of alkyl nitrates with isotopically labelled hydroxyl radicals. J. Chem. Soc., Faraday Trans. 1997, 93, 2787.
| Atmospheric fate of several alkyl nitrates. Part 1: rate coefficients of the reactions of alkyl nitrates with isotopically labelled hydroxyl radicals.Crossref | GoogleScholarGoogle Scholar | 1:CAS:528:DyaK2sXlsl2lt7o%3D&md5=91370936aeb1270ec0f8e62dbf4b574aCAS |
[45] E. Atlas, Evidence for ≥C3 alkyl nitrates in rural and remote atmospheres. Nature 1988, 331, 426.
| Evidence for ≥C3 alkyl nitrates in rural and remote atmospheres.Crossref | GoogleScholarGoogle Scholar | 1:CAS:528:DyaL1cXhtVSgtL0%3D&md5=89757601e76a4ea8b66e394c2fbee6cfCAS |
[46] K. C. Clemitshaw, J. Williams, O. V. Rattigan, D. E. Shallcross, K. S. Law, R. A. Cox, Gas-phase ultraviolet absorption cross-sections and atmospheric lifetimes of several C2–C5 alkyl nitrates. J. Photoch. Photobiol. A: Chem. 1997, 102, 117.
| Gas-phase ultraviolet absorption cross-sections and atmospheric lifetimes of several C2–C5 alkyl nitrates.Crossref | GoogleScholarGoogle Scholar |
[47] J. M. Roberts, S. B. Bertman, D. D. Parrish, F. C. Fehsenfeld, B. T. Jobson, H. Niki, Measurement of alkyl nitrates at Chebogue Point, Nova Scotia during the 1993 North Atlantic Regional Experiment (NARE) intensive. J. Geophys. Res. 1998, 103, 13569.
| Measurement of alkyl nitrates at Chebogue Point, Nova Scotia during the 1993 North Atlantic Regional Experiment (NARE) intensive.Crossref | GoogleScholarGoogle Scholar | 1:CAS:528:DyaK1cXktlektrY%3D&md5=1d7ace7e0052f07a7b798aa6eaa77457CAS |
[48] G. Desseigne, Process for the preparation of methyl nitrate. Memorial des Poudres 1948, 30, 59.
| 1:CAS:528:DyaG3cXjsl2itA%3D%3D&md5=0e93f3d4047b184f23bd8770cc2ca998CAS |
[49] Z. M. Chen, S. Li, F. Shi, X. Y. Tang, Study on the yield of peroxides from atmospheric reaction of CH3C(O)CH=CH2 with O3 by long path FTIR. Spectrosc. Spect. Anal. 2003, 23, 742.
| 1:CAS:528:DC%2BD3sXnt1eitLw%3D&md5=ee58b048d8c012f90b61a4b41fcb7ed2CAS |
[50] H. L. Wang, X. Zhang, Z. M. Chen, Development of DNPH/HPLC method for the measurement of carbonyl compounds in the aqueous phase: applications to laboratory simulation and field measurement. Environ. Chem. 2009, 6, 389.
| Development of DNPH/HPLC method for the measurement of carbonyl compounds in the aqueous phase: applications to laboratory simulation and field measurement.Crossref | GoogleScholarGoogle Scholar | 1:CAS:528:DC%2BD1MXhsFSkurnN&md5=687688139edc943662fad22098d6be83CAS |
[51] Z. M. Chen, C. Y. Jie, S. Li, H. L. Wang, C. X. Wang, J. R. Xu, W. Hua, Heterogeneous reaction of methacrolein and methyl vinyl ketone: kinetics and mechanisms of uptake and ozonolysis on silicon dioxide. J. Geophys. Res. 2008, 113,
| Heterogeneous reaction of methacrolein and methyl vinyl ketone: kinetics and mechanisms of uptake and ozonolysis on silicon dioxide.Crossref | GoogleScholarGoogle Scholar |
[52] Z. M. Chen, H. L. Wang, L. H. Zhu, C. X. Wang, C. Y. Jie, W. Hua, Aqueous-phase ozonolysis of methacrolein and methyl vinyl ketone: a potentially important source of atmospheric aqueous oxidants. Atmos. Chem. Phys. 2008, 8, 2255.
| Aqueous-phase ozonolysis of methacrolein and methyl vinyl ketone: a potentially important source of atmospheric aqueous oxidants.Crossref | GoogleScholarGoogle Scholar | 1:CAS:528:DC%2BD1cXnvVSksbo%3D&md5=8955468f9379153b73eeb4ab5d1cb87fCAS |
[53] J. D. C. Brand, T. M. Cawthon, The vibrational spectrum of methyl nitrate. J. Am. Chem. Soc. 1955, 77, 319.
| The vibrational spectrum of methyl nitrate.Crossref | GoogleScholarGoogle Scholar | 1:CAS:528:DyaG2MXit1OmtA%3D%3D&md5=695b9ce0a698891c0a75979844caa1a7CAS |
[54] B. W. Gay, R. C. Noonan, J. J. Bufalini, P. L. Hanst, Photochemical synthesis of peroxyacyl nitrates in gas phase via chlorine-aldehyde reaction. Environ. Sci. Technol. 1976, 10, 82.
| Photochemical synthesis of peroxyacyl nitrates in gas phase via chlorine-aldehyde reaction.Crossref | GoogleScholarGoogle Scholar | 1:CAS:528:DyaE1MXmtFGrsrs%3D&md5=80d814c12211b0e8acea694157e324d8CAS |
[55] P. L. Hanst, B. W. Gay, Photochemical reactions among formaldehyde, chlorine, and nitrogen dioxide in air. Environ. Sci. Technol. 1977, 11, 1105.
| Photochemical reactions among formaldehyde, chlorine, and nitrogen dioxide in air.Crossref | GoogleScholarGoogle Scholar | 1:CAS:528:DyaE1cXktFSnsA%3D%3D&md5=57cfa201d7020c9b269344853a972c7bCAS |
[56] B. J. Finlayson-Pitts, J. N. Pitts Jr, Chemistry of the Upper and Lower Atmosphere: Theory, Experiments, and Applications 2000 (Academic press: New York).
[57] K. A. Ramazan, L. M. Wingen, Y. Miller, G. M. Chaban, R. B. Gerber, S. S. Xantheas, B. J. Finlayson-Pitts, New experimental and theoretical approach to the heterogeneous hydrolysis of NO2: key role of molecular nitric acid and its complexes. J. Phys. Chem. A 2006, 110, 6886.
| New experimental and theoretical approach to the heterogeneous hydrolysis of NO2: key role of molecular nitric acid and its complexes.Crossref | GoogleScholarGoogle Scholar | 1:CAS:528:DC%2BD28Xhs1Cju78%3D&md5=07ec0ad41d634a62292a9c0c06f6f4d2CAS |
[58] P. G. Carbajo, A. J. Orr-Ewing, NO2 quantum yields from ultraviolet photodissociation of methyl and isopropyl nitrate. Phys. Chem. Chem. Phys. 2010, 12, 6084.
| NO2 quantum yields from ultraviolet photodissociation of methyl and isopropyl nitrate.Crossref | GoogleScholarGoogle Scholar | 1:CAS:528:DC%2BC3cXmvVWrs7Y%3D&md5=babdc4f835591cbed5eedc28dfd0046aCAS |
[59] J. W. Bozzelli, A. M. Dean, Hydrocarbon radical reactions with O2: comparison of allyl, formyll, and vinyl to ethyl. J. Phys. Chem. 1993, 97, 4427.
| Hydrocarbon radical reactions with O2: comparison of allyl, formyll, and vinyl to ethyl.Crossref | GoogleScholarGoogle Scholar | 1:CAS:528:DyaK3sXitlegsr0%3D&md5=b3b11d915892d3b7c7a215390ce0e377CAS |
[60] M. Martínez-Ávila, J. Peiró-García, V. M. Ramírez-Ramírez, I. Nebot-Gil, Ab inito study on the mechanism of the HCO + O2 → HO2 + CO reaction. Chem. Phys. Lett. 2003, 370, 313.
| Ab inito study on the mechanism of the HCO + O2 → HO2 + CO reaction.Crossref | GoogleScholarGoogle Scholar |
[61] F. Su, J. G. Calvert, J. H. Shaw, H. Niki, P. D. Maker, C. M. Savage, L. D. Breitenbach, Spectroscopic and kinetic studies of a new metastable species in the photo-oxidation of gaseous formaldehyde. Chem. Phys. Lett. 1979, 65, 221.
| Spectroscopic and kinetic studies of a new metastable species in the photo-oxidation of gaseous formaldehyde.Crossref | GoogleScholarGoogle Scholar | 1:CAS:528:DyaL3cXjtFyqsQ%3D%3D&md5=0493f0c2f6711ce0c13f0706be0fe73aCAS |
[62] R. Atkinson, D. L. Baulch, R. A. Cox, J. N. Crowley, R. F. Hampson, R. G. Hynes, M. E. Jenkin, M. J. Rossi, J. Troe, Evaluated kinetic and photochemical data for atmospheric chemistry: volume I – gas phase reactions of Ox, HOx, NOx and SOx species. Atmos. Chem. Phys. 2004, 4, 1461.
| Evaluated kinetic and photochemical data for atmospheric chemistry: volume I – gas phase reactions of Ox, HOx, NOx and SOx species.Crossref | GoogleScholarGoogle Scholar | 1:CAS:528:DC%2BD2cXnvFaqtrY%3D&md5=758708ae5c8bd98235897db33583dc97CAS |
[63] C. M. Roehl, S. A. Nizkorodov, H. Zhang, G. A. Blake, P. O. Wennberg, Photodissociation of peroxynitric acid in the near-IR. J. Phys. Chem. A 2002, 106, 3766.
| Photodissociation of peroxynitric acid in the near-IR.Crossref | GoogleScholarGoogle Scholar | 1:CAS:528:DC%2BD38XitFahsL4%3D&md5=03e3b42548dab5cc9bfa34556282b090CAS |
[64] R. A. Graham, A. M. Winer, J. N. Pitts, Pressure and temperature dependence of the unimolecular decomposition of HO2NO2. J. Phys. Chem. A 1978, 68, 4505.
| 1:CAS:528:DyaE1cXks1KjtrY%3D&md5=9c343ae86ff91292b65dcfc952a7dc90CAS |
[65] E. Jiménez, T. Gierczak, H. Stark, J. B. Burkholder, A. R. Ravishankara, Reaction of OH with HO2NO2 (peroxynitric acid): rate coefficients between 218 and 335 K and product yields at 298 K. J. Phys. Chem. A 2004, 108, 1139.
| Reaction of OH with HO2NO2 (peroxynitric acid): rate coefficients between 218 and 335 K and product yields at 298 K.Crossref | GoogleScholarGoogle Scholar |
[66] T. J. Dillon, J. N. Crowley, Direct detection of OH formation in the reactions of HO2 with CH3C(O)O2 and other substituted peroxy radicals. Atmos. Chem. Phys. 2008, 8, 4877.
| Direct detection of OH formation in the reactions of HO2 with CH3C(O)O2 and other substituted peroxy radicals.Crossref | GoogleScholarGoogle Scholar | 1:CAS:528:DC%2BD1cXhtlCnurrP&md5=ce43a9063d4f7fd61ee47326288667b0CAS |
[67] M. E. Jenkin, M. D. Hurley, T. J. Wallington, Investigation of the radical product channel of the CH3C(O)O2 + HO2 reaction in the gas phase. Phys. Chem. Chem. Phys. 2007, 9, 3149.
| Investigation of the radical product channel of the CH3C(O)O2 + HO2 reaction in the gas phase.Crossref | GoogleScholarGoogle Scholar | 1:CAS:528:DC%2BD2sXntlajtrY%3D&md5=3143e90162bb5f6516475c14cdea9690CAS |
[68] M. W. Gery, G. Z. Whitten, J. P. Killus, M. C. Dodge, A photochemical kinetics mechanism for urban and regional scale computer modeling. J. Geophys. Res. 1989, 94, 12925.
| A photochemical kinetics mechanism for urban and regional scale computer modeling.Crossref | GoogleScholarGoogle Scholar | 1:CAS:528:DyaK3cXlvFKrsL4%3D&md5=ac91feee86b94840cb78c2bdbffbfa4dCAS |
[69] X. F. Yang, P. Felder, R. Huber, Photodissociation of methyl nitrate in a molecular beam. J. Phys. Chem. A 1993, 97, 10903.
| 1:CAS:528:DyaK3sXmtFert70%3D&md5=223b01b4f6fa40297f3d15a6525f5e19CAS |
[70] Derro E. L., Murray C., Lester M. I., Marshall M. D., Photodissociation dynamics of methyl nitrate at 193 nm: energy disposal in methoxy and nitrogen dioxide products. Phys. Chem. Chem. Phys. 2007, 9, 262. [Published online ahead of print 20 November 2006]. 10.1039/B614152H
[71] R. Atkinson, J. Arey, Atmospheric degradation of volatile organic compounds. Chem. Rev. 2003, 103, 4605.
| Atmospheric degradation of volatile organic compounds.Crossref | GoogleScholarGoogle Scholar | 1:CAS:528:DC%2BD3sXosVChtrs%3D&md5=a5d811d04af80983dbe4577a0291967dCAS |
[72] D. J. Luecken, G. S. Tonnesen, J. E. Sickles, Differences in NOy speciation predicted by three photochemical mechanisms. Atmos. Environ. 1999, 33, 1073.
| Differences in NOy speciation predicted by three photochemical mechanisms.Crossref | GoogleScholarGoogle Scholar | 1:CAS:528:DyaK1MXhtFamtbg%3D&md5=7e3e3c9133dc2e82e36c9d026a9bdd57CAS |
[73] T. M. Butler, M. G. Lawrence, The influence of megacities on global atmospheric chemistry: a modelling study. Environ. Chem. 2009, 6, 219.
| The influence of megacities on global atmospheric chemistry: a modelling study.Crossref | GoogleScholarGoogle Scholar | 1:CAS:528:DC%2BD1MXht1CjurfJ&md5=27966ad89e603ca05d6d736efbe9812cCAS |