

Trends in rainfall associated with sources of air pollution
E.Keith BiggEnvironmental Chemistry 5(3) 184-193 https://doi.org/10.1071/EN07086
Submitted: 28 November 2007 Accepted: 13 April 2008 Published: 19 June 2008
Environmental context. Decreasing trends in rainfall over large areas of eastern and south-western Australia have resulted in critical water shortages. Three reasons have been suggested. The first is a change in atmospheric circulation as a result of greenhouse gas forcing. The second is that changes in land usage have affected surface moisture, albedo and cloud formation. Another, the subject of this study, is that airborne particulates associated with urban areas have acted to decrease the mean efficiency of rainfall, the growth of urban areas thereby causing an underlying decreasing trend in rainfall.
Abstract. Trends in rainfall in the 35 years 1970–2004 have been calculated for all 350 available rainfall stations having sufficiently complete records that lie between latitudes 26–30°S and longitudes 150–154°E. The area contains two major urban centers, Brisbane with a rapidly growing population approaching two million and the Gold Coast with a population of ~500 000. Statistically highly significant negative trends were found in the vicinity of Brisbane, with decreases exceeding 40% of mean daily rainfall in the 35 years, and in a smaller area inland from the Gold Coast. The spatial distribution of trends was consistent with aerosol production from human activities, the prevailing winds and losses due to the topography. A previously published observation using satellite data showed that cloud properties were affected by urban aerosols in a way that is likely to reduce precipitation. The results of this study reinforce the suggestion made then that monitoring of aerosol concentrations and properties and in-situ observations of rain formation processes in the area should be undertaken as a matter of urgency.
Introduction
Rainfall varies very widely from year to year in Australia, and known influences include the El Niño-Southern Oscillation (ENSO),[1] the ‘Indian Ocean dipole’ (an oscillation in sea surface temperature in the Indian Ocean[2]) and the Antarctic Oscillation or southern hemisphere Annular Mode (the difference in mean sea level pressure between latitudes 40°S and 65°S).[3] The short-term variability masks any underlying trends and unless the trends are large, they will have poor statistical significance. In spite of this difficulty, water shortages in many of the more populated parts of Australia and elsewhere in the world have led to studies of trends in rainfall[4,5] and attempts to attribute their causes. On the Australian scene, south-west Western Australia has received the most attention and explanations of decreasing trends in winter rainfall based on climate models have included changes in land usage,[6,7] circulation changes resulting from greenhouse gas forcing,[8] and a combination of these effects.[9] In parts of northern Australia rainfall shows increasing trends and an explanation has been given in terms of the effects on atmospheric circulation of increases in Asian aerosol.[10] An apparent steep decline in east coast rainfall from 1950 to 2005 is partly a result of starting the series in an unusually high rainfall period[5] but no cause of the residual decrease has yet been proposed.
In addition to the relatively large-scale effects considered in the works cited above, there have been several smaller scale rainfall trends attributed to urban effects[11–15] which may be partly dynamic, partly cloud-microphysical in origin. Satellite observations have shown clear indications of reduction in cloud drop size in polluted air that is consistent with observed decreases in precipitation of winter rainfall on downwind upslopes. Cloud microphysics effects that will alter the efficiency of precipitation have been invoked downwind from several cities,[16–19] including some in Australia.
A problem with attributing changes to aerosol intervention in the precipitation process is that in some circumstances addition of aerosols may be beneficial, in others harmful. For example, production of airborne particles on which ice will form in clouds (ice nuclei) at temperatures of about –10°C aids precipitation if the undisturbed concentration is less than that required for efficient precipitation but hinders it if that concentration is already at or beyond the optimum concentration. In clouds where the ice phase is not involved in precipitation, addition of giant (diameter, >1 μm) hygroscopic particles may initiate or increase precipitation, while adding large concentrations of smaller hygroscopic particles may hinder it. In addition to these differences, stratiform clouds with slowly cooling air may respond quite differently to vigorous cumulus clouds when a given aerosol is introduced. In Australia, studies of the rain-forming processes were abandoned 20 years ago and the present concentrations of potentially precipitation-influencing particles is not known at any site or for any season. Modelling[15] has revealed the complexity but cannot anticipate the overall result because the input parameters cannot be specified.
The aim of the present paper is to calculate a set of rainfall trends from all available sites in an area of south-east Queensland and north-eastern New South Wales that contain two rapidly expanding urban and industrial sources of aerosol to reveal their spatial distribution. The relation of this to urban areas and topography and what this reveals about causes will then be investigated.
The dataset and its manipulation
The Australian Bureau of Meteorology has produced a comprehensive dataset of daily rainfalls from all its reporting stations. In searching for trends that may be related to human activity, neither starting years nor finishing years should have had exceptional rainfall, and the intervening period should be one of continued growth of population and industry. Also the number of stations with valid records should be as great as possible. The compromise used here was to look at trends in rainfall from 1 January 1970 to 31 December 2004. If the very dry years of 2005–2007 had been included in the analysis they would have led to greater decreases than seen in 1970–2004 but the decline of El Niño that followed might eventually offset their effect.
Fluctuations in the raw data can be reduced by combining the data into annual daily average rainfalls. Few of the records are complete and years with more than one month of missing data were omitted altogether. Of the records, 44% had one or more missing years on this basis and stations with more than five were omitted. Only 10% had more than two missing years. The quality status of each daily observation is listed in the dataset and those not quality controlled were counted as missing data. Observations of accumulated rainfall for more than one day were common (weekends for example) and pose a problem in forming daily averages because the rainfall of intervening days is left blank in the Bureau’s dataset. Zeros had to be substituted for the blanks.
Linear regression lines were drawn through the annual amended averages for each station. The percentage change between 1970 and 2004 in mean daily rainfall for the 35 years, the correlation coefficient with the regression line and its statistical significance were then calculated. A complete list of these parameters for stations used, their geographical coordinates and omitted years is given in the Appendix. The area is bounded by latitudes 26–30°S and longitudes 150–154°E.
Results
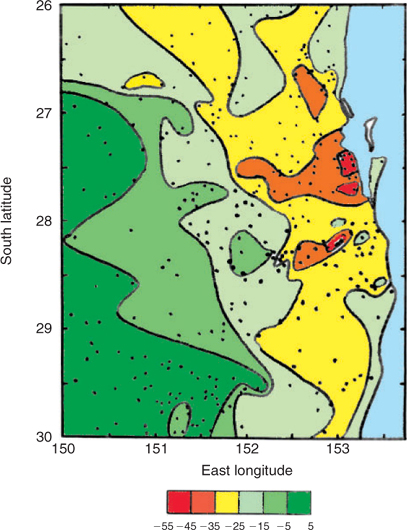
Fig. 1 shows contours of trends (expressed as a percentage change in mean daily rainfall from 1970 to 2004) at 10% intervals. It is immediately apparent that at this level of spatial resolution, trends are far from uniform even in areas where very similar meteorological conditions prevail. Statistical significance at the level of 0.05 or better (red, orange and half the yellow areas) applies to all the stations with trends from –30 to –55%.
|
A possible cause of the very large difference in trends between those near latitude 27.5°S, longitude 153°E and those west of longitude 152°E might be that the large short-term controls such as ENSO are different in the two regions, or that changes in them are the cause of the trends.
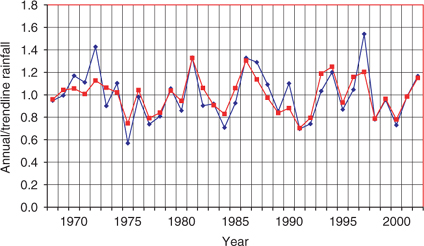
To test this, the average daily rainfall of all the stations in district 40 shown in Appendix A1 (almost entirely east of longitude 152°E) was calculated for each year and also for all stations in district 41 (almost entirely west of that longitude). Fig. 2 expresses this mean daily group rainfall for each year as a proportion of the mean trendline rainfall for each of the two groups separately. The similarity is strong, with only a few differences such as 1974 and 1999 where the eastern groups received proportionally more rain. The correlation coefficient is 0.84, variance 0.71. This implies that influences such as ENSO apply almost equally to the two regions. Even though the statistical significance is very poor in the western group, it is evidently still physically meaningful. The poor significance is simply a consequence of the shorter-term variations being large compared with the trend. The figure also suggests that long-term changes in ENSO (or other influence) intensity is not the main cause of the decreasing trends in rainfall.
|
The next question is whether these differences in trends are related to built-up areas. Rainfall is a maximum in summer, afternoon thunderstorms being the main source. About 60% of the 1500 hour winds in summer are from the east or north-east, so that effects should spread more towards the west and south-west than to the east. Time is also required for aerosol produced at the surface to enter clouds and influence rainfall so that effects may be displaced towards the west and south-west except in calm conditions.
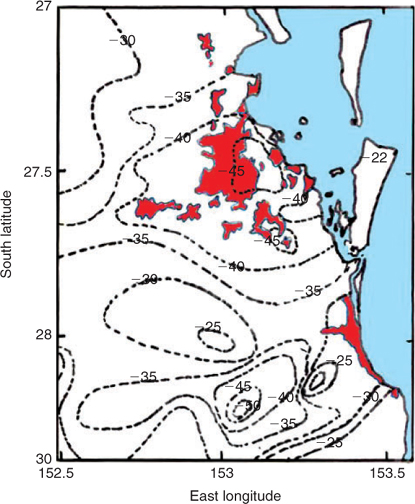
In Fig. 3, built-up areas at the end of the period are shown in red, the two major ones being metropolitan Brisbane with a population now approaching two million and the Gold Coast to the south of Brisbane (population 500 000).
|
Contours of trends are shown at a spacing of 5% instead of the 10% of Fig. 1. Decreases greater than 40% in 35 years extend ~50 km to the west-south-west of Brisbane. The decrease to the west-south-west of the Gold Coast begins ~30 km from the coast, and while maximum decreases are comparable to those downwind from Brisbane, the area they occupy is far less. The direction in which the decreases occur is consistent with the most common winds in the season of maximum rainfall.
Topography can be expected to influence rainfall trends if aerosols are involved in changing precipitation efficiency because enhanced precipitation as the prevailing winds traverse mountain barriers will result in loss of the cloud-active particles.
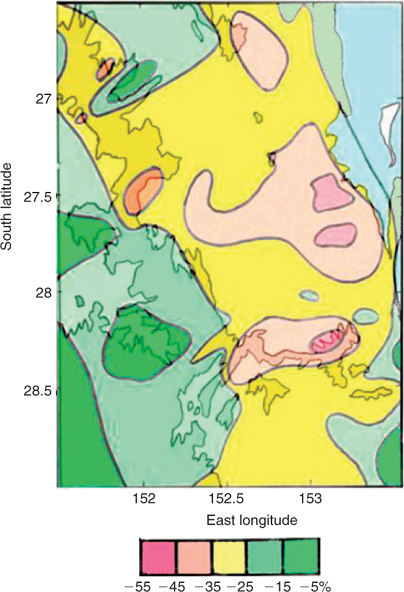
Fig. 4 examines this possibility, showing 500-m contours beneath the colour-coded trends in rainfall. Those of the main north–south Dividing Range closely parallel the contours of rainfall trends. An east–west spur of the range near latitude 28.3°S also appeared to have influenced the rainfall trends.
|
Discussion
While several observations[12–15] have shown that cities lead to increased thunderstorm activity in summer months, modelling has revealed[15] the complex interaction between dynamic and aerosol-induced influences on precipitation. Fig. 3 strongly indicates an urban effect on rainfall but it does not certainly point to aerosols as the main cause. Fig. 4, however, makes this seem more likely. The prevailing winds are perpendicular to the main Dividing Range and increased aerosol losses to cloud and precipitation in the rising air is to be expected. This is consistent with the orientation of the contours of trend with that of altitude contours. Where the winds are parallel to the high ground, as at latitude 28.3°S, the decreases remain large.
Modelling[15] has also shown that effects will be greatest where aerosol concentrations are least, for example, in onshore winds at the coast. In the area considered here, on or very close to the coast, the decreasing trends are least except in the vicinity of the coastal industrial area of Brisbane and the heart of the Gold Coast. Point Lookout on North Stradbroke Island (station 40175) ~50 km east of Brisbane has a trend of –22% compared with –45% over the industrial areas of Brisbane, while Tweed Heads (station 58056) at the south end of the Gold Coast has a trend of only –8%. Some urban effects would still be expected to the east of urban areas because not all rain falls from thunderstorms, not all surface winds are onshore and at upper levels in the cloud the winds are often from the west.
The apparent relationship between urban areas and decreasing trends in rainfall in this study cannot automatically be applied to other cities, where the meteorology, topography and aerosol properties may be quite different. Concentrations of both the undisturbed cloud-active particles and those produced by the cities may also differ from those in the present study. A preliminary treatment of trends in the vicinity of Sydney and Newcastle suggests very little, if any, decreasing trend in the actual metropolitan areas. There are substantial decreases inland, although smaller than those near Brisbane. In the case of Newcastle, the loss of its major industry (a steelworks) during the period may have influenced trends, while in Sydney, industry and population has tended to move further from the coast with time, possibly altering the coastal trends. In all cities, efforts to reduce aerosol emissions may have had an effect, but whether these will have resulted in an increased or decreased rainfall efficiency cannot be estimated in the absence of information on concentrations and properties of cloud-active particles throughout the study period.
Seeding thunderstorm clouds with large hygroscopic particles has had notable success in South Africa,[20] where aerosol concentrations appear to be generally much higher than in undisturbed regions of Australia. The success may have been due to the direct effects of the hygroscopic particles in initiating rainfall in a cloud that contains cloud drop concentrations too high for rainfall production by coalescence. Dynamic considerations[21] may also have been involved, but if research showed the method to be applicable in the Brisbane area, it may be possible to reduce the rainfall deficit by dispersing micrometre-sized hygroscopic particles over a wide area from ground-based generators. Assume that a concentration of 104 m–3 particles of 10–12 g would be sufficient to initiate precipitation. The amount then required in an area of 1000 km2 throughout a depth of 2 km is only 20 kg. Of course there would be logistic difficulties in obtaining the even concentration postulated, but in strongly convective situations, atmospheric mixing is rapid and this would help reduce the effects of point sources. Greater quantities than 20 kg would in fact be necessary because the size distribution of particles would inevitably be broader than the assumed diameter.
Conclusions
It seems likely that urban aerosol has affected precipitation efficiency in the region considered, although a contribution (perhaps positive, perhaps negative) from the dynamic effects of built-up areas may also be present. This strongly suggests the need for several areas of research. Measurement of in-situ aerosol concentrations and properties in rain-bearing situations in order to model their possible effects on clouds is one. Such a procedure has already been suggested[15,18] but its necessity was strongly disputed.[22] It would not be an easy task to make such observations, an undertaking that would require a considerable amount of aircraft time, and which is always difficult in built-up areas. Observations of the formation of storm and precipitation development in the clouds over built-up areas and comparison with those in nearby vegetated areas would be another necessary step to validate the models and apportion causes of changes to rainfall. This would require the use of quantitative radar measurements of precipitation.
Depending on what is found, it may be possible to alleviate the effects of urban aerosol by hygroscopic seeding of thunderstorms.
[1]
J. L. McBride ,
N. Nicholls ,
Seasonal relationships between Australian rainfall and the Southern Oscillation.
Mon. Weather Rev. 1983
, 111, 1998.
| Crossref | GoogleScholarGoogle Scholar |

[2]
N. H. Saji ,
T. Yamagata ,
Possible impacts of Indian Ocean dipole mode events on global climate.
Clim. Res. 2003
, 25, 151.
| Crossref | GoogleScholarGoogle Scholar |
[3]
H. H. Hendon ,
D. W. J. Thompson ,
M. C. Wheeler ,
Australian rainfall and temperature variations associated with the Southern Hemisphere Annular Mode.
J. Clim. 2007
, 20, 2452.
| Crossref | GoogleScholarGoogle Scholar |
[4]
[5]
N. Nicholls ,
Detecting and attributing Australian climate change: a review.
Aust. Meteorol. Mag. 2006
, 55, 199.
[6]
A. G. Pitman ,
G. T. Narisma ,
R. A. Pielke ,
N. J. Holbrook ,
Impact of land cover change on the climate of southwest Western Australia.
J. Geophys. Res. 2004
, 109, D18109.
| Crossref | GoogleScholarGoogle Scholar |
[7]
B. Timbal ,
J. M. Arblaster ,
Land cover change as an additional forcing to explain the rainfall decline in the southwest of Australia.
Geophys. Res. Lett. 2006
, 33, L07717.
| Crossref | GoogleScholarGoogle Scholar |
[8]
P. Hope ,
W. Drosdowsky ,
N. Nicholls ,
Shifts in the synoptic systems influencing southwest Western Australia.
Clim. Dyn. 2006
, 26, 751.
| Crossref | GoogleScholarGoogle Scholar |
[9]
B. Timbal ,
J. M. Arblaster ,
S. Power ,
Attribution of late twentieth century rainfall decline in southwest Australia.
J. Clim. 2006
, 19, 2046.
| Crossref | GoogleScholarGoogle Scholar |
[10]
L. D. Rotstayn ,
W. Cai ,
M. R. Dix ,
G. D. Farquhar ,
Y. Feng ,
P. Ginoux ,
M. Herzog ,
A. Ito ,
J. E. Penner ,
M. L. Roderick ,
M. Wang ,
Have Australian rainfall and cloudiness increased due to the remote effects of Asian anthropogenic aerosols?
J. Geophys. Res. 2007
, 112, D09202.
| Crossref | GoogleScholarGoogle Scholar |
[11]
P. V. Hobbs ,
L. F. Radke ,
S. E. Shumway ,
Cloud condensation nuclei from industrial sources and their apparent influence on precipitation in Washington State.
J. Atmos. Sci. 1970
, 27, 81.
| Crossref | GoogleScholarGoogle Scholar |
[12]
P. A. Huff ,
S. A. Changnon ,
Precipitation modification by major urban areas.
Bull. Am. Meteorol. Soc. 1973
, 54, 1220.
| Crossref | GoogleScholarGoogle Scholar |
[13]
R. Bornstein ,
Q. Lin ,
Urban heat islands and summertime convective thunderstorms in Atlanta: 3 case studies.
Atmos. Environ. 2000
, 34, 507.
| Crossref | GoogleScholarGoogle Scholar |
[14]
J. M. Shepherd ,
H. Pierce ,
A. J. Negri ,
Rainfall modification by major urban areas. Observations from spaceborne rain radar on the TRMM satellite.
J. Appl. Meteorol. 2002
, 41, 689.
| Crossref | GoogleScholarGoogle Scholar |
[15]
S. C. van den Heever ,
W. R. Cotton ,
Urban aerosol impacts on downwind convective storms.
J. Appl. Meteorol. Clim. 2007
, 46, 828.
| Crossref | GoogleScholarGoogle Scholar |
[16]
D. Rosenfeld ,
Suppression of rain and snow by urban and industrial pollution.
Science 2000
, 287, 1793.
| Crossref | GoogleScholarGoogle Scholar | PubMed |
[17]
A. Givati ,
D. Rosenfeld ,
Quantifying precipitation suppression due to air pollution.
J. Appl. Meteorol. 2004
, 43, 1038.
| Crossref | GoogleScholarGoogle Scholar |
[18]
D. Rosenfeld ,
A. Givati ,
Evidence of orographic precipitation suppression by air pollution induced aerosols in the western USA.
J. Appl. Meteorol. 2006
, 45, 893.
| Crossref | GoogleScholarGoogle Scholar |
[19]
D. Rosenfeld ,
I. M. Lensky ,
J. Peterson ,
A. Gingis ,
Potential impacts of air pollution aerosols on precipitation in Australia.
Clean Air and Environmental Quality 2006
, 40, 43.
[20]
G. K. Mather ,
Coalescence enhancement in large multi-cell storms caused by emissions from a Kraft paper mill.
J. Appl. Meteorol. 1991
, 30, 1134.
| Crossref | GoogleScholarGoogle Scholar |
[21]
E. K. Bigg ,
An independent evaluation of a South African hygroscopic cloud seeding experiment, 1991–1995.
Atmos. Res. 1997
, 43, 111.
| Crossref | GoogleScholarGoogle Scholar |
[22]
G. Ayers ,
Has air pollution suppressed rainfall over Australia?
Clean Air and Environ. Quality 2005
, 39, 51.
Appendix A1.
Columns: A, Bureau of Meteorology’s site identifying number; B, latitude, degrees; C, longitude degrees east; D, trend, change in 35 years expressed as a percentage of mean daily rain 1970–2004 for the site; E, correlation coefficient of the trend; F, statistical significance of the correlation; G, mean daily rainfall 1970–2004 (mm); H, years omitted from the analysis because of missing or bad data
