Extending methods for assessing fuel hazard in temperate Australia to enhance data quality and consistency
Bianca J. Pickering A * , Lauren T. Bennett
  A and Jane G. Cawson
  A
A
A
Abstract
Assessments of fuel (vegetation) are needed to predict fire behaviour. Broad visual methods support quick in-field management decisions but can be too imprecise to detect variations in fuel for other purposes.
We evaluated the utility of integrating more comprehensive fuel measurement techniques into an existing visual fuel hazard assessment method.
We developed an extended method for measuring fuel hazard, including line-intercept measurements and clearer tables for assigning fuel hazard scores, and compared it with the existing Overall Fuel Hazard Assessment Guide fourth edition, which is often used in temperate Australia. Methods were tested across 69 eucalypt woodland plots of the same broad fuel type.
The existing method estimated higher near-surface and elevated cover compared with the extended method, but less surface cover. Assigned hazard scores changed markedly when using the clearer hazard tables. Over half the plots had differences of one or more in hazard score for surface, near-surface and elevated fuel between the existing and extended methods.
The extended method provided a more methodical and consistent approach for assessing fuel hazard, but was more time-consuming than the existing method.
The extended method provides an alternative method for monitoring and research purposes when data quality is important.
Keywords: bushfire, fire management, fuel assessment, fuel hazard, fuel structure, Overall Fuel Hazard Assessment Guide, vegetation cover, vegetation monitoring.
Introduction
Fine fuels (i.e. live vegetation <3 mm diameter and dead vegetation <6 mm diameter) are key determinants of wildfire forward rates of spread and flame length (Hines et al. 2010; Keane 2015). Important properties of fine fuel include moisture content, horizontal and vertical continuity, dead to live ratio and load (dry mass) (Rothermel 1972; Cruz et al. 2018). These fuel properties vary spatially and temporally within and between different vegetation communities, influencing how fires behave across landscapes (Loudermilk et al. 2022). Fuel assessment methods must be capable of detecting these variations to better understand and quantify the influence of fuel on fire behaviour and associated environmental and socio-economic impacts, and to provide data that support informed decisions about wildfire mitigation and suppression strategies (Ottmar et al. 2007; Duff et al. 2017).
Fuels are often quantified directly in the field by fire managers and scientists who use the data for a range of purposes including rapid fuel evaluations during wildfires (Hines et al. 2010), assessing the effectiveness of fuel management (Fernandes and Botelho 2003), and developing and refining fire behaviour models (Cruz et al. 2014). Fuel assessment methods should be fit for purpose to ensure efficiencies in cost, time and effort (Duff et al. 2017). For instance, the greater cost, time and effort associated with detailed and accurate assessment methods can be justified when data are needed to detect relatively small spatial and temporal variations in fuel properties (e.g. sub-daily fluctuations in fuel moisture or seasonal fluctuations in fuel load) (Keane 2015). In contrast, a more time-efficient method is preferable when determining how much fuel is available to burn ahead of an approaching fire front. Methods also need to be practical to implement across different species compositions and structures, given that landscapes often encompass multiple vegetation communities.
Visual methods can be used to rapidly assess fuel properties in a vegetation community. A common method in North America is the visual matching of fuel conditions to photos that depict quantified fuel properties, which are associated with successional stages of vegetation communities (Scott and Burgan 2005; Wright and Vihnanek 2014). In contrast, in temperate Australia, visual guides are used to evaluate the amount and arrangement of fine fuel by fuel stratum irrespective of vegetation type (strata are surface, near-surface, elevated and bark in the most recent versions of these guides) (Gould et al. 2009; Hines et al. 2010; Department of Environment and Natural Resources 2012). Here, visual estimates of vegetation characteristics such as horizontal continuity, proportions of dead fuel, and bark type and quantity are used with litter-bed depth (the only measured variable) to determine a fuel hazard score per stratum (low, moderate, high, very high and extreme). These scores are used to indicate the potential contribution of each stratum to wildfire behaviour. For instance, the surface hazard score indicates how easily a surface fire could spread, and the bark hazard score indicates spotting potential.
Fuel assessment methods need to be regularly evaluated to ensure they remain fit for purpose. The Overall Fuel Hazard Assessment Guide fourth edition (OFHAG) (Hines et al. 2010) was designed as a rapid fuel assessment tool for forests, woodlands and shrublands in temperate Australia, but has since been used for additional purposes. For example, data generated from the OFHAG have been used for modelling post-fire fuel loads by strata (Duff et al. 2013) and in modelling fire behaviour (e.g. in the fire simulation software PHOENIX Rapidfire; Kington and Tolhurst 2019). Several studies have examined the reliability of the OFHAG and identified issues with linking hazard scores to fuel properties needed for fire behaviour models (e.g. fuel load: Volkova et al. 2016; McColl-Gausden and Penman 2017). Field observer expertise and the subjectivity of the OFHAG are highlighted as issues leading to inconsistency in the assignment of hazard scores among assessors (Watson et al. 2012; Spits et al. 2017). These inconsistencies are partially attributed to the visual nature of the assessments for each stratum and to ambiguities in the hazard tables that match fuel properties to hazard scores (Watson et al. 2012; Volkova et al. 2016). For example, in the surface fuel stratum, it is unclear which fuel property (depth vs cover) should take precedence when litter is shallow (assigned low hazard) but has high cover (assigned extreme hazard). In such instances, assessors are required to make subjective decisions to determine the final hazard score, which influences repeatability and uncertainty.
Whole-plot vegetation cover (e.g. across 20 × 20 m) is one of the main fuel properties visually estimated in the OFHAG (Gould et al. 2009; Hines et al. 2010). However, whole-plot cover estimates are known to vary widely between assessors depending on the composition and structure of the vegetation community and the assessor’s ability to delineate plot boundaries (Godínez-Alvarez et al. 2009; Prichard et al. 2019). Extensive training is required to ensure that data accuracy and precision are sufficient for detecting meaningful changes in fuel properties (Watson et al. 2012; Keane 2015). As an alternative to whole-of-plot visual cover estimates, a common quantitative method to assess vegetation cover is the line-point intercept method where vegetation is assessed along one or more transects using either a touch pole or making visual estimates of cover in small-area quadrats (Elzinga 1998). This method can be slower than a whole-plot visual assessment, but it is comparatively more precise and objective, likely making it a more robust method of data collection when accuracy in cover estimation is important (Korhonen et al. 2006; Cook et al. 2010; De Stefano et al. 2021).
In this study, we sought to evaluate the utility of integrating more comprehensive fuel measurement techniques into the OFHAG approach. We developed an ‘extended’ assessment method and tested it against the ‘existing’ assessment method (Hines et al. 2010) across 69 plots of woodland vegetation in south-eastern Australia. Specifically, we asked:
Is there agreement between fuel properties measured using the existing and extended assessment methods?
Is there agreement between hazard scores derived using the existing and extended fuel hazard tables?
To what extent do differences between the existing and extended assessment methods impact fuel hazard outcomes?
Materials and methods
Description of the existing assessment method
The existing assessment method in this study followed the OFHAG fourth edition (Hines et al. 2010) (Table 1). The OFHAG was designed for use predominantly in eucalypt forests, woodlands and shrublands in temperate Australia, and focuses on fine fuel arrangement as one of the main determinants of wildfire behaviour (Hines et al. 2010). In the OFHAG, fine live and dead fuel (<3 and <6 mm in diameter, respectively) are assessed across four strata: surface, near-surface, elevated and bark (Supplementary Appendix S1). Each fuel stratum is assigned a hazard score (low, moderate, high, very high, extreme) based on the combination of fuel properties described below and by using the hazard tables in the guide. Higher hazard scores are associated with increases in elements of fire behaviour where surface fuels give an indication of forward rate of spread, near-surface and elevated fuels indicate forward rate of spread and flame height, and bark fuels indicate spotting potential. The OFHAG does not consider midstorey and overstorey canopy, or duff (duff is largely absent in fire-prone vegetation in temperate Australia). Assessments are over a circular area of ~10-m radius for surface, near-surface and elevated fuel, and 20-m radius for bark fuel.
| Fuel metric | Method | |
|---|---|---|
| Existing assessment as per the Overall Fuel Hazard Assessment Guide, fourth edition (Hines et al. 2010) | ||
| Surface depth (mm) | Mean depth of surface fuel (leaves, bark, twigs and other organic debris on the forest floor) from measurements done in five locations across a 10-m radius plot using a fuel depth gauge (as per Hines et al. 2010) | |
| Surface cover, and near-surface and elevated cover (%) | Visual estimation of projective foliage cover for surface, near-surface and elevated fine fuel within a 10-m radius of the plot centre | |
| Near-surface and elevated percentage dead (%) | Visual estimation of the percentage near-surface and elevated fine fuel that is dead within a 10-m radius of the plot centre | |
| Bark availability | Qualitative visual assessment of amount of bark available for combustion, within a 20-m radius of the plot centre. Based on charring (blackened from past fire) or the degree of attachment of bark to a tree bole. Assessments are done per bark type (stringybark, ribbon bark, other bark), except where the bark type comprises less than 10% of trees at the plot. Note: charred bark and tightly held bark are less likely to burn | |
| Surface, near-surface, elevated and bark fuel hazard | A score of low, moderate, high, very high or extreme based on combining the fuel properties for each fuel stratum (e.g. surface depth and cover used to derive the surface hazard score) using the hazard tables outlined in the OFHAG (Hines et al. 2010). Bark hazard is assessed per bark type, with the highest hazard score allocated as the bark hazard for the plot | |
| Extended assessment method – measurements every 2 m along two intersecting 50-m transects that define a 25-m radius) circular plot (~0.2 ha) | ||
| Surface depth (mm) | Mean depth of surface fuel (leaves, bark, twigs and other organic debris on the forest floor) at measurement points. Points with no surface fuel were not included in this calculation (sum of depth/number of points with surface fuel). Surface depth was measured using a fuel depth gauge (as per Hines et al. 2010). Maximum number of measurement points is 52 | |
| Surface cover (%) | Number of points where surface cover was present divided by the total 52 measurements | |
| Near-surface and elevated cover (%) | Percentage projected fine fuel cover visually estimated within a 50-cm radius of each measurement point. Plot-level cover determined by averaging cover across the 52 measurements (total projective cover by point/52 ×100). Calculated separately for near-surface and elevated fuel strata | |
| Near-surface and elevated percentage dead (%) | Proportion of fine fuel that was dead, visually estimated within a 50-cm radius of each measurement point (total proportion dead by point/number of points with fuel present × 100). Calculated separately for near-surface and elevated fuel strata. Maximum number of measurement points is 52. | |
| Bark availability | Qualitative visual assessment of amount of bark available for combustion. Based on charring (blackened from past fire) or the degree of attachment of bark to a tree bole. Assessments are done per bark type (stringybark, ribbon bark and other bark). Note: charred bark and tightly held bark are less likely to burn | |
| Amount of bark (m2 ha−1) | Total tree basal area per plot used as a proxy for bark quantity, per bark type. A stem count of tree-like stems (>2 m in height) greater than 10-cm diameter at breast height (DBH – 1.3 m) within the 0.2 ha plot, and DBH (cm) of the most representative stem size used to determine the total tree basal area and divided by plot area. Where: total tree basal area (m2 ha−1) = π × (DBH/200)2 × stem count/0.2. | |
In the OFHAG, surface fuel consists of dead leaves, twigs and bark lying in a predominantly horizontal orientation on mineral soil. Surface fuel is assessed by measuring depth (from the top of the litter bed to the mineral soil underneath) and cover. Depth is measured with a fuel depth gauge (a 15-cm circular disk with a ruler through a slot in its centre; Supplementary Appendix S1) and is the average of five measurements per plot, with the measurement locations at the discretion of the assessor. Cover is estimated visually across the 10-m radius area.
Near-surface fuels are live and dead vegetation such as graminoids, forbs, small shrubs and juvenile woody plants. This stratum is vertically continuous and effectively in touch with the ground. It will be consumed in a surface fire. To assess near-surface fuel, assessors visually estimate the cover and percentage dead across the 10-m radius plot.
Elevated fuel includes taller shrubs and sapling trees. This fuel stratum is mainly upright in orientation, and can contain suspended leaves, bark or twigs. There is a clear gap between the elevated and surface and/or near-surface fuels, meaning a surface fire could pass underneath the elevated strata. Elevated fuel is assessed in much the same way as near-surface fuel, by visually estimating the cover and percentage dead across the 10-m radius plot. The guide also describes how easily a person could walk through the vegetation as an additional measure of elevated fuel density.
Bark fuel consists of bark on both the trunk and branches from the ground to canopy. Bark fuel is divided into three main types that characterise the trees of southern Australia: stringybark, ribbon or candle barks, and ‘other’ barks, which include smooth, platy, papery and coarsely fibrous barks. Bark is assessed by visually estimating the percentage char and determining the degree of bark attachment (i.e. hand pressure needed to remove bark). An assessment is done for each bark type when the type represents more than 10% of the trees within a 20-m radius of the plot centre.
Development of an extended assessment method
We extended the OFHAG to improve the consistency of estimates (Table 1, Supplementary Appendix S1). First, we formally delineated the plot boundary by using two 50-m transects (north–south, west–east, intersecting at the 25-m point) to define a circular plot of 0.20 ha.
Second, to ensure coverage of the full plot area, we instructed assessors to take fuel measurements systemically at 2-m intervals along each transect, providing a total of 52 measurement points per plot for each of the surface, near-surface and elevated fuel strata. Surface fuel cover and depth were captured at the exact point of intersection with the transect as per the point-intercept method (Elzinga 1998). Near-surface and elevated fuel cover and percentage dead were assessed in a projected 50-cm radius cylinder (centred at the transect point) to enable a larger proportion of the total plot to be assessed (~0.004 ha). Additionally, near-surface top height and elevated top and bottom heights were measured (Supplementary Appendix S1), but not analysed in this study.
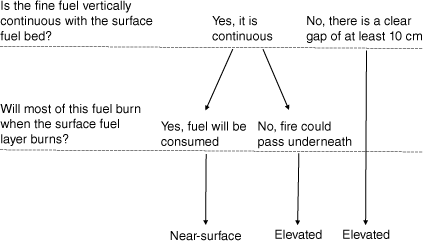
Third, to ensure consistency of definition of fuel strata, we developed a decision tree (Fig. 1) to help with the delineation of the near-surface and elevated strata – distinguishing near-surface from elevated fuel has been anecdotally noted as a consistent source of confusion for assessors in the OFHAG.
Decision tree developed in this study to reduce ambiguity in distinguishing between near-surface and elevated fuel strata.
Fourth, in addition to assessing bark structure as per the OFHAG, we estimated the quantity of bark fuel across the full 25-m radius plot. This was achieved by using a plot stem count and measuring the diameter at breast height (DBH; 1.3 m from ground) of the most representative stem (per bark type). The stem count and DBH were used to calculate total tree basal area to provide an estimate of the amount of bark (i.e. surface area of bark) by type. In comparison, the OFHAG does not consider the number of stems or stem size, only the percentage of trees exhibiting each of the bark types. For example, in the existing method, a plot with three large stringybark trees would have a higher bark hazard than a plot with three small stringybark trees, whereas the visual OFHAG would treat both plots equally.
All measurements were summarised per plot and then used to determine the fuel hazard score per fuel stratum.
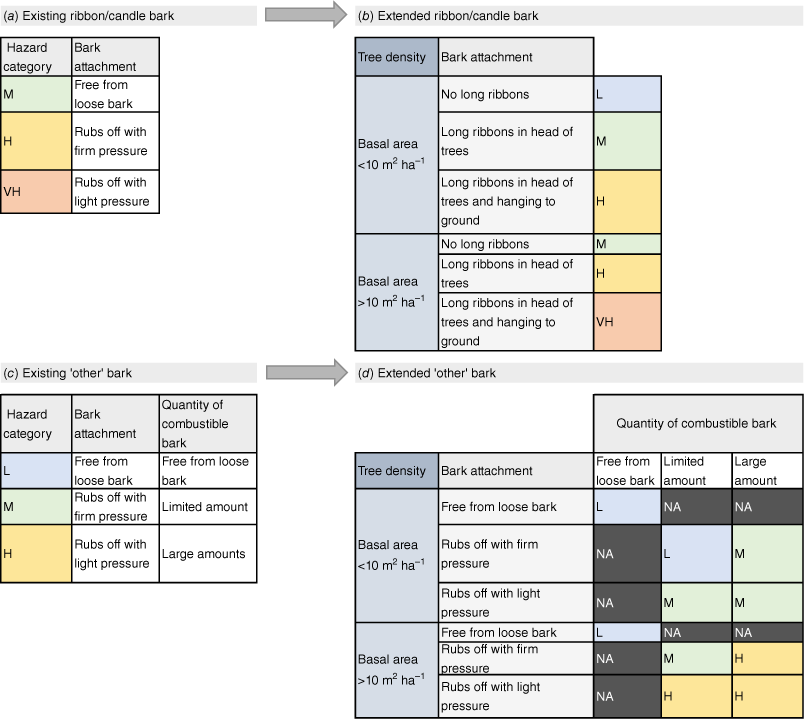
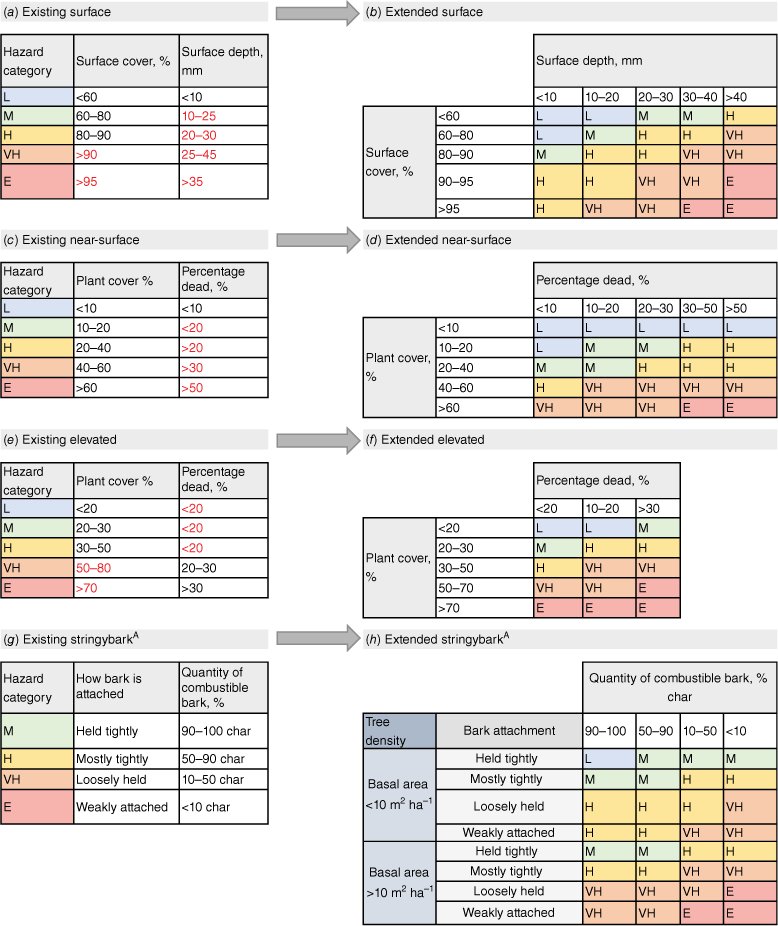
To reduce ambiguity in converting fuel properties to hazard scores, we refined the OFHAG hazard tables (Fig. 2, Appendix 1). Fig. 2 highlights the source of some of the ambiguities in the existing OFHAG for surface, near-surface and elevated fuel. As an example, hazard score assignment in the elevated stratum relies on set combinations of percentage plant cover and percentage dead; however, the ranges of each often overlap among hazard categories, making it unclear which final hazard score should be assigned. The tables also contain qualitative fuel strata descriptors, which potentially add further assessor bias to the assessment method. These include ill-defined descriptions of vegetation flammability and fuel thickness and descriptors about the ease with which an assessor can walk through the forest. Further research is needed to properly incorporate measures of flammability, leaf thickness and vegetation density into assessments of fuel hazard. For our extended method, we omitted these qualitative metrics. We thus extended the surface, near-surface, elevated and bark hazard tables to ensure that the measurement range of individual fuel properties did not overlap among hazards categories and that the combination of two fuel properties resulted in a clearly defined hazard score by strata and, where possible, used parts of the tables to only include quantitative measures of fuel. The conversion of fuel properties to hazard score occurred during the data analysis stage. These refined tables are herein referred to as the extended hazard tables (Fig. 2, Appendix 1).
Existing and extended hazard tables developed in this study: (a) existing surface; (b) extended surface; (c) existing near-surface; (d) extended near-surface; (e) existing elevated; (f) extended elevated; (g) existing stringybark; and (h) extended stringybark fuel strata. The existing hazard tables are a simplified version of those in the OFHAG fourth edn. (Hines et al. 2010). Red numbering highlights ambiguity where fuel property values overlap multiple hazard categories. Fuel hazard categories are L, low; M, moderate; H, high; VH, very high; and E, extreme. AThe stringybark hazard table is shown as a bark fuel example; see Appendix 1 for the ribbon or candle and ‘other’ bark hazard tables.
Field test to evaluate fuel assessment methods
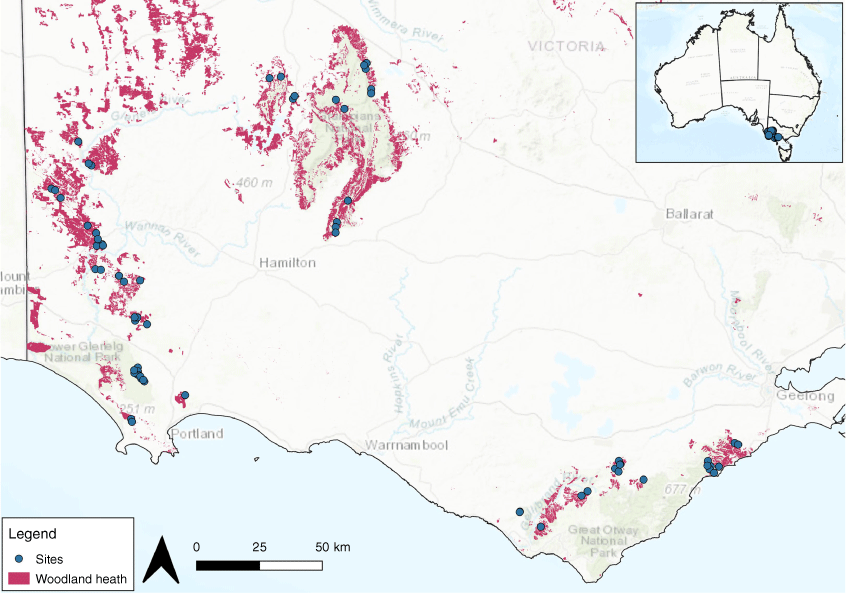
We established 69 plots in south-western Victoria, Australia (Fig. 3), spanning 272 km east–west (141.09°–144.19°E), 184 km north–south (37.00°–38.66°S), and 360 m in altitude (0–360 m above sea level (asl)) (Gallant et al. 2011). South-western Victoria has a temperate climate characterised by mild to warm dry summers (Bureau of Meteorology 2005) with the average annual rainfall across the plots ranging from 574 to 1188 mm year−1 (Fick and Hijmans 2017). Plots were selected to represent the range in a fuel type known locally as Woodland Heath (Fig. 4). Fire managers in this region have identified Woodland Heath as a priority for further research because of its widespread occurrence on public land and its high biodiversity value (Gazzard et al. 2020). It is often targeted for fuel reduction and ecological burning, and therefore the ability to accurately quantify fuel properties in this fuel type is of high importance.
Woodland heath fuel types in the south-west of Victoria, Australia. Images depict different woodland structures with (a) higher density of canopy species, presence of near-surface fuels and absence of elevated fuels; (b) higher density of canopy species, presence of shrubby elevated fuels; and (c) sparser density of canopy species and presence of near-surface and shrubby elevated fuels. Photographer credit: Chris Medlin.
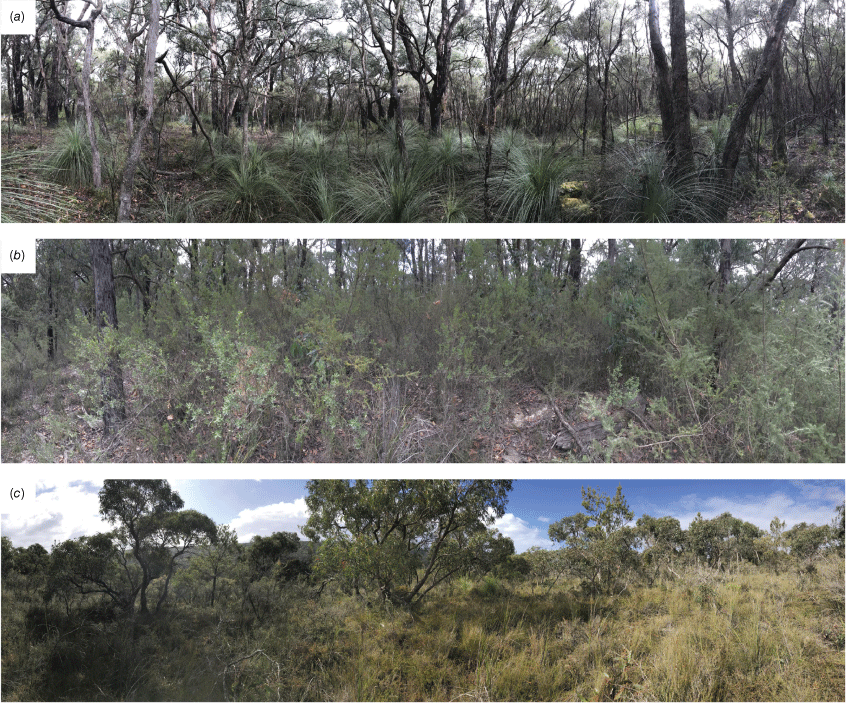
Our plots in the Woodland Heath fuel type include multiple vegetation types that are classified locally as Heathy Herb-rich Woodland, Heathy Woodland and Damp Heathy Woodland (Department of Environment Land Water and Planning 2021). These vegetation types commonly include an overstorey dominated by mixes of fire-tolerant eucalypts that are 10–15 m in height and a typical projective foliage cover of 10–20%. The eucalypts predominantly include stringybark trees (e.g. Eucalyptus obliqua (messmate stringybark), E. baxteri (brown stringybark)) and/or ribbon bark trees (e.g. E. viminalis (rough-barked manna-gum), E. ovata (swamp gum)) and/or ‘other’ bark trees (e.g. E. willisii (Jimmy’s shining peppermint)). Midstorey and understorey shrub species typically have narrow or ericoid leaves and have a foliage cover of 15–40% for medium shrubs and 15–20% for small shrubs. Medium shrub species commonly include Banksia marginata (silver banksia), Epacris impressa (common heath), Leptospermum myrsinoides (heath tea-tree), Leptospermum continentale (prickly tea-tree) and Correa reflexa (common correa). These shrubs often persist over a layer of grasses and graminoids, or a dense layer of bracken (Pteridium esculentum) (Department of Environment Land Water and Planning 2021). These vegetation types are grouped into the Woodland Heath fuel type because they exhibit similar fire behaviour (Kington and Tolhurst 2019).
Plots were selected using stratified random sampling to capture differing vegetation structures by encompassing a range of time since fire age classes (0.5–30 years since fire), fire severities (understorey burnt, canopy scorch and canopy burnt), and an aridity gradient (aridity index 1.7–3.4; Nyman et al. 2015) (Fig. 3). We omitted patches of vegetation smaller than 1.5 ha and ensured plots were located at least 10 m from roads and strategic fuel breaks to reduce edge effects. Plots within the same stratification unit were at least 1 km apart. A single set of assessments was completed at each plot by two assessors (n = 69). A plot centre co-ordinate was randomly selected for each plot and assessors were required to visually check that the plot’s vegetation and fire history matched expectations.
To enable comparisons between the existing and extended methods, assessors began by assessing the fuel in each plot using the existing method (outlined in the OFHAG). This was done from the plot centre, before assessors then undertook the extended assessment along the plot transects (Table 1, Supplementary Appendix S1). The existing assessment was completed first so that the assessment was not influenced by data collected for the extended method.
Assessors comprised local fire managers, with two members being lead assessors. At least one of these two members assessed every study site. A field-based training day was run to train staff in the extended field method and the lead assessors completed 2 days of field surveys together to standardise their assessment techniques. Assessments occurred over a 12-month period from April 2021 to April 2022.
Data analysis
Comparisons of the existing vs extended assessment methods were done in three stages: (1) a comparison of fuel properties, which focused on surface cover and depth, near-surface cover and percentage dead, and elevated cover and percentage dead; (2) a comparison of hazard tables by using fuel property data from the existing assessment method and comparing scores for those data derived from the existing hazard tables with those derived from the extended hazard tables for the surface, near-surface and elevated strata; and (3) an overall comparison of hazard scores derived from the full implementation of the existing vs extended assessment methods for all fuel strata (including bark). Fuel hazard scores (low, moderate, high, very high or extreme) were converted to integers from 1 to 5 and treated as pseudo-continuous.
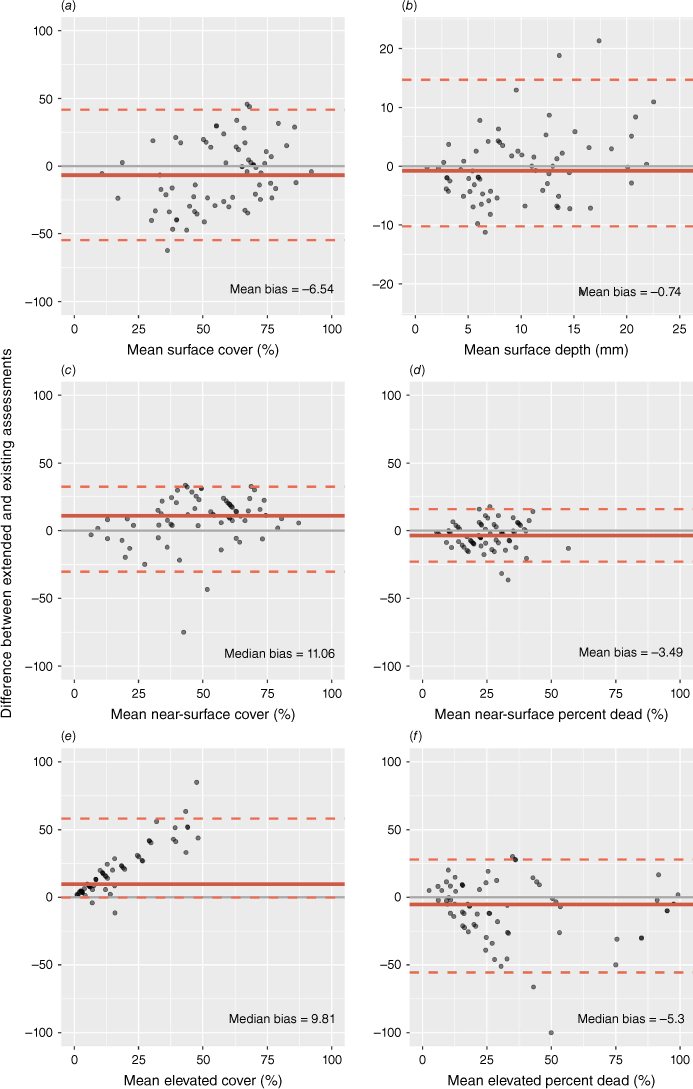
Bland–Altman plots were used for the comparison of fuel properties between assessment methods. Bland–Altman plots are a diagnostic tool for assessing the agreement between two methods of measurement by plotting the difference of two paired measurements against their mean (Twomey 2006; Giavarina 2015; Lehnert 2015). The Bland–Altman plots display the bias between the two methods by plotting the mean bias (normal difference distribution) or median bias (non-normal distribution) of the difference data and their limits of agreement (±1.96 s.d. for mean difference and 2.5th and 97.5th percentiles for median difference; Twomey 2006). Difference data were checked for normality using histograms, qq-plots and the Shapiro–Wilk test (Giavarina 2015) and results were used to determine whether mean or median bias was appropriate. Mean bias was used for surface cover, surface depth and near-surface percentage dead. Median bias was used for near-surface cover, elevated cover and elevated percentage dead.
One-to-one plots and Spearman’s correlation coefficient were used to assess the agreement between fuel hazard scores. Cohen’s kappa statistic (k ranging from −1 to +1) was used as an index of inter-rater agreement between two hazard scores (Cohen 1968; Gamer et al. 2019). These data were used to calculate misclassification errors between assessment methods by calculating absolute difference between raters (Gamer et al. 2019) as a difference of only one hazard score (e.g. low hazard vs a moderate hazard score), or as a difference of two or more hazard scores (e.g. low vs a high or very high hazard score). A difference of two or more hazard scores was considered misclassified.
The R statistical programming language, Version 4.1.0 (R Core Team 2016), was used for data processing and analysis, including the packages BlandAltmanLeh (Lehnert 2015), cowplot (Wilke 2020), irr (Gamer et al. 2019), scales (Wickham and Seidel 2022) and tidyverse (Wickham et al. 2019).
Results
The assessment methods were tested across a range of conditions, with overall fuel hazard scores spanning the full spectrum of conditions from low to extreme. Assessments took approximately 2 h to complete: 30 min for the existing method plus 1.5 h for the extended assessment. Anecdotally, assessors reported being more easily able to distinguish near-surface and elevated fuel after gaining some experience with the extended method.
Comparison of fuel properties measured with the existing and extended fuel assessment methods
The existing assessment method estimated a mean of 6.5% less surface cover and a median of 11% more near-surface cover than our extended assessment method (Fig. 5a, c). Surface fuel depth and near-surface percentage dead showed relatively strong average agreement between the two assessment methods (mean bias within 3.5%; Fig. 5b, d). However, individual plot differences for surface fuel depth were highly variable, sometimes exceeding 10 mm (Fig. 5b). For elevated fuel, the existing assessment method estimated a median of 9.8% more cover and 5.3% less dead fuel than the extended assessment method (Fig. 5e, f). Disagreement between the two methods for elevated cover increased with increasing cover up to a maximum of 85% difference (Fig. 5e).
Bland–Altman plot of differences between existing and extended assessment measurements for (a) surface cover, (b) surface depth, (c) near-surface cover, (d) near-surface percentage dead, (e) elevated cover, and (f) elevated percentage dead. Solid red, thick line represents mean or median bias and dashed lines represent the limits of agreement for the bias.
Comparison of the existing and extended hazard tables using data from the existing method
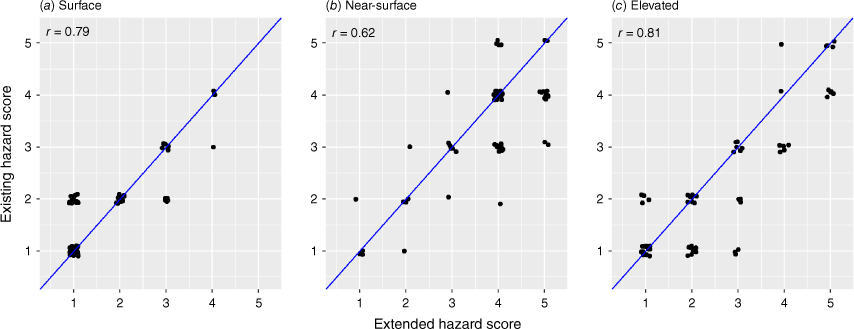
Fuel hazard scores derived using the existing vs extended hazard tables (i.e. both based on fuel property input data from the existing method) were strongly associated for the surface and elevated strata (Spearman’s correlation coefficient r = 0.79 and 0.81 respectively; Fig. 6a, c), and moderately associated for the near-surface stratum (r = 0.62; Fig. 6b). Despite the high correlation, there was an apparent bias for elevated fuel, with the existing hazard table producing scores that were up to three hazard scores lower than the extended hazard table (Fig. 6c). For near-surface hazard, there was considerable scatter around the 1:1 line, with scores varying by up to three classes (Fig. 6b).
Comparison of fuel hazard scores derived using the existing and extended hazard tables (both based on fuel property input data from the existing method) for (a) surface fuel hazard, (b) near-surface fuel hazard, and (c) elevated fuel hazard. Spearman’s correlation coefficient (r) is displayed. Data points are in black and have been jittered to show overlap. The blue line is a 1:1 line.
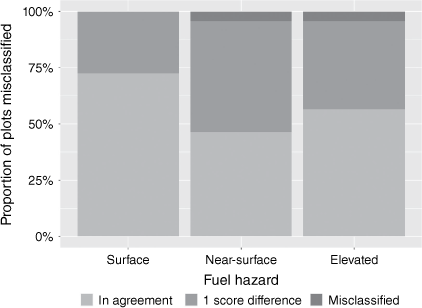
Surface fuels had the lowest misclassification rate, with misclassifications restricted to just one hazard score difference between the existing and extended hazard tables, which occurred 30% of the time (Fig. 7). The greatest misclassification rate was for near-surface fuel, with misclassification of two or more hazard scores occurring for 5% of plots, and a misclassification of one hazard score occurring for 50% of plots. Misclassification of the elevated fuel by two or more hazard scores also occurred for 5% of plots, while misclassification by one hazard score occurred for ~40% of the plots (Fig. 7).
Misclassification errors between the existing and extended fuel hazard tables as calculated using Cohen’s kappa statistic (k) (Cohen 1968). Differences of two or more hazard scores are labelled as misclassified.
Comparison of fuel hazard scores derived from the full implementation of the existing and extended assessment methods
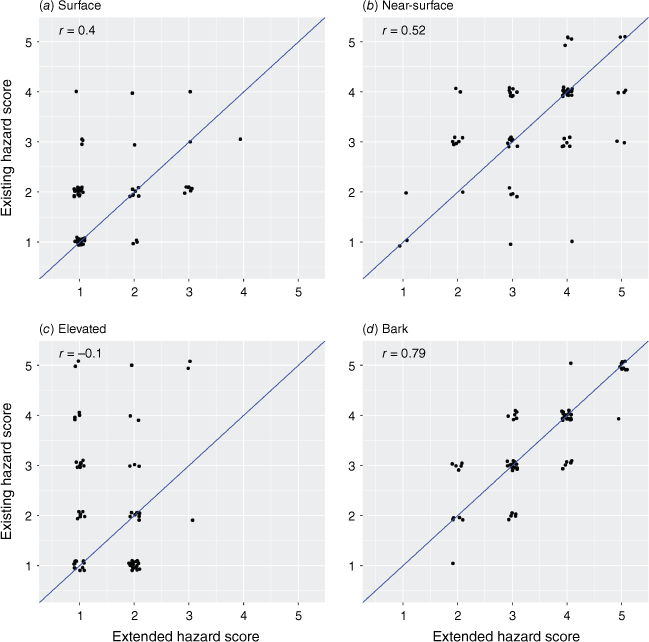
Fuel hazard scores derived from the full implementation of the existing and extended assessment methods were most strongly associated for bark (Spearman’s correlation coefficient r = 0.79; Fig. 8d), and moderately associated for the near-surface stratum (r = 0.52; Fig. 8b). The methods had fair agreement for surface hazard (r = 0.40; Fig. 8b) and poor agreement for elevated fuel hazard (r = −0.10; Fig. 8c), with the existing assessment method generally generating higher surface and elevated hazard scores compared with the extended method. Estimates of elevated hazard were up to four scores higher when determined using the existing compared with the extended assessment method (Fig. 8c).
One-to-one plots comparing the existing and extended fuel hazard scores derived from the full implementation of each method for (a) surface fuel hazard, (b) near-surface fuel hazard, (c) elevated, and (d) bark fuel hazard. Spearman’s correlation coefficient (r) is displayed. Data points are in black and have been jittered to show overlap. The blue line is a 1:1 line.
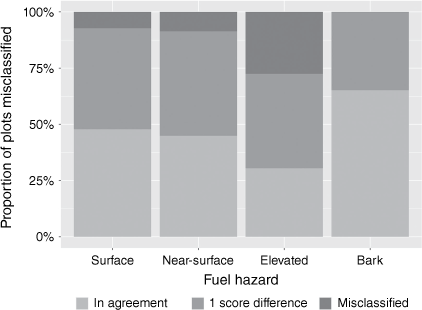
Bark fuel had the lowest misclassification rate, with misclassifications restricted to just one hazard score difference between the two assessments, which occurred approximately 35% of the time (Fig. 9). The greatest misclassification rate (70%) was in the elevated fuel, with a misclassification of two or more hazard scores occurring for 30% of plots, and a misclassification of one hazard score occurring for ~40% of plots. Misclassification of the surface and near-surface fuel occurred in approximately half the plots, with ~10–15% of these being misclassifications of two or more scores.
Misclassification errors between the existing and extended fuel hazard scores from the full implementation of each assessment method as calculated using Cohen’s kappa statistic (k) (Cohen 1968). Differences of two or more hazard scores are labelled as misclassified.
Discussion
Visual methods used for fuel hazard assessment have been criticised for their lack of objectivity and repeatability. Our comparisons of the existing and extended fuel assessments found differences between methods when measuring continuous fuel properties, which could have implications for predicting fire behaviour. These differences are compounded when grouping the detailed fuel property data into a broad hazard scoring system, at least partly owing to the subjective nature of the existing hazard tables. Therefore, we recommend using our extended method when data quality is critical. Despite the reduced subjectivity of the extended method over the existing method, it was more time-consuming. Thus, when time efficiency is a priority, the existing method might be preferred – although this study indicated potential for overestimation of elevated fuel hazard by the existing method when compared with the extended method that could have flow-on effects for predicting fire behaviour.
Comparison of fuel properties measured with the existing and extended fuel assessment methods
The discrepancy in visual cover estimates between the whole-plot existing method and the small-quadrat based extended method for near-surface and elevated fuel possibly reflects differences in the assessor’s field of view across a plot. In the existing method, assessors have an oblique vantage point when assessing fuel strata from a single fixed location near the plot’s centre. Features within view, such as gaps between vegetation, are effectively combined across different scales and with different degrees of accuracy, and this means that the spatial patchiness of the fuel cannot be properly viewed (Unwin 1975). Near-surface and elevated fuels likely appear more horizontally and vertically continuous from a single viewing location, making it more difficult to distinguish between strata in a consistent manner for the whole plot and leading to the perception of higher cover estimates. Additionally, it becomes more difficult to accurately measure cover as the size of an assessment area (i.e. the plot) increases (Elzinga 1998; Caratti 2006). Our extended assessment allowed assessors to systematically consider multiple small areas across an entire plot, allowing better visual distinction between gaps and a comparatively less biased assessment of fuel cover variation in space. The use of the decision tree (Fig. 1) at each of these points also potentially increased assessor consistency when distinguishing near-surface from elevated fuels, although we note that the separation of these fuel strata remains at least partly subjective.
The magnitude of difference in cover estimates between methods is likely to have implications for predicting fire behaviour. As elevated and near-surface cover increase, so too does the quantity and horizontal connectivity of the fuel, allowing easier flame propagation through and between fuel layers (Hines et al. 2010; Cruz 2021). Increasing involvement of these fuels in the flaming fire front results in increased fire rates of spread, intensity and the potential for crown fire (McArthur 1967; Cruz et al. 2021). Consequently, over- or underestimates of near-surface and elevated cover could lead to inaccurate predictions of fire impact (e.g. final fire footprint). Fire behaviour prediction systems calibrated using fuel inputs derived from the existing approach may need re-calibration if the extended approach is used to derive fuel inputs (e.g. the fire spread models within PHOENIX Rapidfire are calibrated against case study fires and use fuel hazard curves derived from the existing approach; Kington and Tolhurst 2019). Additionally, a 10% difference in near-surface and elevated cover between wet and dry eucalypt forest has been found to contribute to substantial differences in the near-ground microclimate, where less cover resulted in drier surface conditions and more days where surface fuels were available to burn (Pickering et al. 2021). Therefore, overestimation of cover could lead to underestimations of surface fuel bed availability (fuels are drier than the assessment indicates).
For surface fuel measurements, both assessments employed the same method for measuring surface depth but with different numbers of measurements (5 vs 52 respectively) and an ad hoc versus systematic sampling strategy. Nonetheless, the methods were in close agreement with a small mean bias. This reflects the smoothing of overall differences rather than the absence of differences between the two methods (i.e. there was substantial variability in estimated means at the site level but no directional bias) (Hamilton and Stamey 2007). This means that an increase in the number of points measured across the plot did not substantially improve measures of average surface depth in these vegetation types; however, it is likely that data confidence is stronger for the larger sample size. The extended method could be simplified by reducing the number of points assessed for fuel depth, marginally reducing the overall assessment time; however, the numbers of points by confidence level requires further research.
Comparison of the existing and extended hazard tables using data from the existing method
Variability in the hazard scores (e.g. differences of up to three hazard scores for near-surface and elevated fuel) derived using the existing vs extended hazard tables (with the same fuel property input data) likely highlight the subjective nature of the existing hazard tables. Clear benefits of using the extended tables include improved consistency in hazard score assignment and more flexible data processing, allowed for by the distinct fuel property categories. For instance, the use of terrestrial laser scanners for gathering precise fuel data (e.g. cover) is becoming an attractive complementary data collection technique (Wallace et al. 2020, 2022) and the extended tables provide a defined pathway for an automated system to translate such data to fuel hazard scores. Post-processing fuel property data could also allow assessors more time to collect quality fuel property information in the field rather than spending time deriving on-site hazard scores. This would also encourage the storage of the granular fuel data, resulting in a valuable data pool for further research. Additionally, the extended tables can be easily updated, and data re-analysed with advances in our understanding of how fuel properties contribute to fire behaviour.
Comparison of fuel hazard scores derived from the full implementation of the existing and extended assessment methods
There were large differences in fuel hazard (up to three hazard scores) between the existing and extended assessment methods when the detailed data (i.e. fuel properties) were combined into broad hazard scores per strata (i.e. low, moderate, high, very high and extreme). This highlights that initial differences between existing and extended fuel properties (less than one hazard score; Figs 2, 5) were exacerbated by the hazard tables and highlights the importance of reducing subjectivity at this stage. Differences in assessment outcomes could have far-reaching consequences when there is a requirement for accurate data. For instance, hazard assessments have been used to quantify long-term impacts of fuel management (Martorano et al. 2021; Pickering et al. 2022) and to develop fire behaviour models (Cheney et al. 2012). Inaccurate detection of spatial and temporal changes in fuel could propagate uncertainty in determining the effectiveness of fuel management and when making fire spread predictions. Furthermore, substantive over- or underestimation of fire spread predictions across a landscape could lead to erroneous communication of fire risk, which has the potential to undermine operational decision making and erode public confidence in emergency warnings (Mileti and Peek 2000; Ripberger et al. 2015; Benali et al. 2016).
Inconsistency in the existing assessment has been attributed to imprecision in visually estimating fuel properties and different interpretations of the hazard scores between teams of assessors (Watson et al. 2012; Spits et al. 2017). Extensive field training helps reduce variability among assessors (Lendon and Lamacraft 1976; Kelly et al. 2011). Our assessors attended a training day where the repeated assessment of each fuel element (at multiple points in the extended method) allowed for intense discussion of the definitions of each fuel stratum, allowing deeper thinking about the differences between fuel strata, with one assessor suggesting that this enhanced their visual estimation of fuel properties in the existing method. Additionally, field assessors in this study were experienced fire practitioners, and the same assessors were used across most plots, which likely enhanced their ability to apply the existing assessment consistently. Larger differences between the existing and extended methods might have occurred if there had been more variability in assessor knowledge and training.
The inclusion of tree basal area in our extended method aimed to improve the representation of plot-level bark fuel quantity. However, there was minimal advantage in this inclusion for bark hazard assessment in the Woodland Heath fuel type (misclassification of only one hazard class occurring 35% of the time; Fig. 9), which suggests the existing assessment of bark is adequate for determining bark hazard in this fuel type. This finding should be tested across a wider range of vegetation types with differing ratios of bark types and stem densities before its exclusion as an ancillary measure for hazard in the extended method. Furthermore, the collection of such data is likely useful for purposes beyond fuel hazard. For instance, information about bark quantity potentially gives insight about firebrand density and ease of containment when conducting a prescribed burn.
Implications
Broad visual assessments (i.e. the existing method) provide a time-efficient method for collecting data, but at the expense of data detail and quality. The extended method provided multiple ways to reduce subjectivity (although we note the need for further work to confirm repeatability) but took three times as long to implement in the field, making it inappropriate in some contexts, e.g. when assessing fuel in the path of a wildfire. However, it provides a good alternative when consistency is a priority and additional time can be afforded – for example, in monitoring and research programs for detecting changes in fuel over time or between treatments. In essence, the choice of method for fuel assessment should be aligned with the purpose of the assessment (Duff et al. 2017).
The extended method could also be used to improve understanding of the existing method and the consistency of its application. For example, it could be used within training programs for field assessors. Field assessors using the extended method in our study reported having a better understanding of the distinction between near-surface and elevated fuel strata, potentially making their assessments more consistent beyond the training period. In addition, some aspects of the extended method could be integrated into the existing method, such as systematically moving along real or imagined transects to enable estimates of cover to better represent conditions across the whole plot.
The extended method offers greater data flexibility, which is advantageous in the context of monitoring and research. Direct measures of fuel properties captured as part of the extended method (e.g. percentage cover, fuel height) could be used to parameterise existing (Cruz et al. 2015) or new fire behaviour models. Additional metrics could be added with relative ease where they are needed to achieve a purpose, e.g. to parameterise a particular fire behaviour model. The extended method will make it simpler to integrate fuel data derived from remote sensing (e.g. via terrestrial laser scanners) into future fuel hazard assessments by removing subjectivity from the hazard score tables. The direct measures of fuel would also likely be more harmonious with co-assessment of measurements to represent other vegetation values including habitat (e.g. Rode et al. 2013) and carbon stocks (e.g. Bennett et al. 2014), and so the extended method lends itself to better integration of fuel assessments with other ecological surveys.
Conclusions
The consistency of fuel hazard assessments is likely enhanced with the adoption of our extended assessment method. Its use as an assessor training tool allows for a deeper consideration of the fuel strata and the hazard tables will more easily integrate with emerging technology for hazard assessments (such as terrestrial laser scanners) and with multi-value vegetation assessments. The existing assessment method is useful for broad and rapid hazard assessment, but the extended method is more useful when collecting high quality, granular data that rely on methodical and repeatable measurements for detecting change in space and time.
Data availability
The data that support this study will be shared on reasonable request to the corresponding author.
Declaration of funding
This project was funded by the Victorian Government’s Integrated Forest Ecosystem Research program, a research partnership between the University of Melbourne and the Department of Energy, Environment and Climate Action.
Author contributions
B. J. P., L. T. B. and J. G. C.: conceptualisation. B. J. P., L. T. B. and J. G. C.: methodology. B. J. P.: formal analysis. B. J. P.: writing – original draft preparation. B. J. P., L. T. B. and J. G. C.: writing – review and editing; L. T. B. and J. G. C.: project administration. J. G. C.: funding acquisition. All authors have read and agreed to the published version of the manuscript.
Acknowledgements
We gratefully acknowledge the project leads from Department of Energy, Environment and Climate Action (DEECA), Chris Medlin and Julian Madigan who instigated this project and completed field measurements, and the DEECA staff who assisted with these measurements: Troy Jenkins, Hamish Martin, Mel Calwell, Peter Ashton, Tim Gazzard, Gafoor Muhumad, Alice Gower, Ruby Saint, Cobie Farmer, Irena Cassettari and Nicola Aylward. We acknowledge Kevin Tolhurst and Trent Penman who respectively provided feedback on bark hazard adjustments and the extended hazard tables. We thank the editor and reviewers for taking the time to review our manuscript and provide constructive feedback. This work was undertaken on the lands of the Dja Dja Wurrung, Djab Wurrung, Jardwadjali, Gulidjan, Gagubanud, Girai Wurrung, Dhauwurd Wurrung and Bindjali peoples.
References
Benali A, Ervilha AR, Sá ACL, Fernandes PM, Pinto RMS, Trigo RM, Pereira JMC (2016) Deciphering the impact of uncertainty on the accuracy of large wildfire spread simulations. Science of the Total Environment 569–570, 73-85.
| Crossref | Google Scholar | PubMed |
Bennett LT, Aponte C, Baker TG, Tolhurst KG (2014) Evaluating long-term effects of prescribed fire regimes on carbon stocks in a temperate eucalypt forest. Forest Ecology and Management 328, 219-228.
| Crossref | Google Scholar |
Bureau of Meteorology (2005) Climate classification of Australia. Available at http://www.bom.gov.au/climate/how/newproducts/images/zones.shtml [accessed 5 March]
Cheney NP, Gould JS, McCaw WL, Anderson WR (2012) Predicting fire behaviour in dry eucalypt forest in southern Australia. Forest Ecology and Management 280, 120-131.
| Google Scholar |
Cohen J (1968) Weighted kappa: Nominal scale agreement provision for scaled disagreement or partial credit. Psychological Bulletin 70, 213-220.
| Crossref | Google Scholar | PubMed |
Cook CN, Wardell-Johnson G, Keatley M, Gowans SA, Gibson MS, Westbrooke ME, Marshall DJ (2010) Is what you see what you get? Visual vs. measured assessments of vegetation condition. Journal of Applied Ecology 47, 650-661.
| Crossref | Google Scholar |
Cruz MG, Sullivan AL, Leonard R, Malkin S, Matthews S, Gould JS, McCaw WL, Alexander ME (2014) ‘Fire behaviour knowledge in Australia: A synthesis of disciplinary and stakeholder knowledge on fire spread prediction capability and application.’ (Bushfire Cooperative Research Centre: East Melbourne, Vic.)
Cruz M, Gould J, Hollis J, McCaw W (2018) A hierarchical classification of wildland fire fuels for Australian vegetation types. Fire 1, 13.
| Crossref | Google Scholar |
Cruz MG, Cheney NP, Gould JS, McCaw WL, Kilinc M, Sullivan AL (2021) An empirical-based model for predicting the forward spread rate of wildfires in eucalypt forests. International Journal of Wildland Fire 31, 81-95.
| Crossref | Google Scholar |
Department of Environment Land Water and Planning (2021) Bioregions and EVC benchmarks. Available at https://www.environment.vic.gov.au/biodiversity/bioregions-and-evc-benchmarks [accessed 13 September]
De Stefano A, Fowers B, Mealor BA (2021) Comparison of visual estimation and line-point intercept vegetation survey methods on annual grass-invaded rangelands of Wyoming. Invasive Plant Science and Management 14, 240-252.
| Crossref | Google Scholar |
Duff TJ, Bell TL, York A (2013) Predicting continuous variation in forest fuel load using biophysical models: a case study in south-eastern Australia. International Journal of Wildland Fire 22, 318-332.
| Crossref | Google Scholar |
Duff T, Keane R, Penman T, Tolhurst K (2017) Revisiting wildland fire fuel quantification methods: The challenge of understanding a dynamic, biotic entity. Forests 8, 351.
| Crossref | Google Scholar |
Fernandes PM, Botelho HS (2003) A review of prescribed burning effectiveness in fire hazard reduction. International Journal of Wildland Fire 12, 117-128.
| Crossref | Google Scholar |
Fick SE, Hijmans RJ (2017) WorldClim 2: new 1km spatial resolution climate surfaces for global land areas. International Journal of Climatology 37, 4302-4315.
| Crossref | Google Scholar |
Gallant J, Wilson N, Dowling T, Read A, Inskeep C (2011) SRTM-derived 1 second digital elevation models version 1.0. Available at http://pid.geoscience.gov.au/dataset/ga/72759 [accessed 3 January]
Gamer M, Lemon J, Fellows I, Singh P (2019) Various coefficients of interrater reliability and agreement. Available at https://CRAN.R-project.org/package=irr
Giavarina D (2015) Understanding Bland Altman analysis. Biochemia Medica (Zagreb) 25, 141-51.
| Crossref | Google Scholar | PubMed |
Godínez-Alvarez H, Herrick JE, Mattocks M, Toledo D, Van Zee J (2009) Comparison of three vegetation monitoring methods: Their relative utility for ecological assessment and monitoring. Ecological Indicators 9, 1001-1008.
| Crossref | Google Scholar |
Hamilton C, Stamey J (2007) Using Bland−Altman to assess agreement between two medical devices – don’t forget the confidence intervals! Journal of Clinical Monitoring and Computing 21, 331-333.
| Crossref | Google Scholar | PubMed |
Kelly AL, Franks AJ, Eyre TJ (2011) Assessing the assessors: Quantifying observer variation in vegetation and habitat assessment. Ecological Management and Restoration 12, 144-148.
| Crossref | Google Scholar |
Korhonen L, Korhonen KT, Rautiainen M, Stenberg P (2006) Estimation of forest canopy cover: a comparison of field measurement techniques. Silva Fennica 40, 577-588.
| Crossref | Google Scholar |
Lehnert B (2015) Plots (slightly extended) Bland-Altman plots. Available at https://cran.r-project.org/web/packages/BlandAltmanLeh/BlandAltmanLeh.pdf
Lendon C, Lamacraft RR (1976) Standards for testing and assessing range condition in central Australia. The Rangeland Journal 1, 40-48.
| Crossref | Google Scholar |
Loudermilk EL, O’Brien JJ, Goodrick SL, Linn RR, Skowronski NS, Hiers JK (2022) Vegetation’s influence on fire behavior goes beyond just being fuel. Fire Ecology 18, 9.
| Crossref | Google Scholar |
Martorano CA, Kane JM, Engber EA, Gibson J (2021) Long term fuel and understorey vegetation response to fuel treatments in oak and chaparral stands of northern California. Applied Vegetation Science 24, e12551.
| Crossref | Google Scholar |
McColl-Gausden SC, Penman TD (2017) Visual assessment of surface fuel loads does not align with destructively sampled surface fuels. Forests 8, 408.
| Crossref | Google Scholar |
Mileti DS, Peek L (2000) The social psychology of public response to warnings of a nuclear power plant accident. Journal of Hazardous Materials 75, 181-194.
| Crossref | Google Scholar | PubMed |
Nyman P, Smith HG, Sherwin CB, Langhans C, Lane PNJ, Sheridan GJ (2015) Predicting sediment delivery from debris flows after wildfire. Geomorphology 250, 173-186.
| Crossref | Google Scholar |
Ottmar RD, Sandberg DV, Riccardi CL, Prichard SJ (2007) An overview of the Fuel Characteristic Classification System — Quantifying, classifying, and creating fuelbeds for resource planning. Canadian Journal of Forest Research 37, 2383-2393.
| Crossref | Google Scholar |
Pickering BJ, Duff TJ, Baillie C, Cawson JG (2021) Darker, cooler, wetter: forest understories influence surface fuel moisture. Agricultural and Forest Meteorology 300, 108311.
| Crossref | Google Scholar |
Pickering BJ, Burton JE, Penman TD, Grant MA, Cawson JG (2022) Long-term response of fuel to mechanical mastication in south-eastern Australia. Fire 5, 76.
| Crossref | Google Scholar |
Ripberger JT, Silva CL, Jenkins-Smith HC, Carlson DE, James M, Herron KG (2015) False alarms and missed events: The impact and origins of perceived inaccuracy in tornado warning systems. Risk Analysis 35, 44-56.
| Crossref | Google Scholar | PubMed |
Spits C, Wallace L, Reinke K (2017) Investigating surface and near-surface bushfire fuel attributes: A comparison between visual assessments and image-based point clouds. Sensors 17, 910.
| Crossref | Google Scholar | PubMed |
Twomey PJ (2006) How to use difference plots in quantitative method comparison studies. Annals of Clinical Biochemistry 43, 124-129.
| Crossref | Google Scholar | PubMed |
Unwin KI (1975) The relationship of observer and landscape in landscape evaluation. Transactions of the Institute of British Geographers 66, 130-134.
| Crossref | Google Scholar |
Volkova L, Sullivan AL, Roxburgh SH, Weston CJ (2016) Visual assessments of fuel loads are poorly related to destructively sampled fuel loads in eucalypt forests. International Journal of Wildland Fire 25, 1193-1201.
| Crossref | Google Scholar |
Wallace L, Hally B, Hillman S, Jones SD, Reinke K (2020) Terrestrial image-based point clouds for mapping near-ground vegetation structure: Potential and limitations. Fire 3, 59.
| Crossref | Google Scholar |
Wallace L, Hillman S, Hally B, Taneja R, White A, McGlade J (2022) Terrestrial laser scanning: An operational tool for fuel hazard mapping? Fire 5, 85.
| Crossref | Google Scholar |
Watson PJ, Penman SH, Bradstock RA (2012) A comparison of bushfire fuel hazard assessors and assessment methods in dry sclerophyll forest near Sydney, Australia. International Journal of Wildland Fire 21, 755-763.
| Crossref | Google Scholar |
Wickham H, Seidel D (2022) scales: Scale functions for visualization. Available at https://CRAN.R-project.org/package=scales
Wickham H, Averick M, Bryan J, Chang W, McGowan L, François R, Grolemund G, Hayes A, Henry L, Hester J, Kuhn M, Pedersen T, Miller E, Bache S, Müller K, Ooms J, Robinson D, Seidel D, Spinu V, Takahashi K, Vaughan D, Wilke C, Woo K, Yutani H (2019) Welcome to the Tidyverse. Journal of Open Source Software 4, 1686.
| Crossref | Google Scholar |
Wilke CO (2020) Streamlined plot theme and plot annotations for ggplot2. Available at https://CRAN.R-project.org/package=cowplot
Appendix 1.Existing and extended hazard tables (Fig. A1).
Existing and extended hazard tables developed in this study: (a) existing ribbon bark; (b) extended ribbon bark; (c) existing ‘other’ bark; and (d) extended ‘other’ bark strata. The existing hazard tables are a simplified version of those in the OFHG fourth edn (Hines et al. 2010). Fuel hazard categories are L, low; M, moderate; H, high; VH, very high; and E, extreme. Extreme hazard cannot occur if only ribbon bark or ‘other’ bark is present. NA, rating not applicable to this class.
