Interaction between two parallel fire fronts under different wind conditions
Carlos Ribeiro A * , Luís Reis A , Jorge Raposo A , André Rodrigues A , Domingos Xavier Viegas A and Jason Sharples B C
A Univ Coimbra, ADAI, Departamento de Engenharia Mecânica, Rua Luís Reis Santos, Pólo II, 3030‐788 Coimbra, Portugal.
B School of Science, University of New South Wales (UNSW), Canberra, ACT, Australia.
C Bushfire and Natural Hazards Cooperative Research Centre, East Melbourne, Vic., Australia.
International Journal of Wildland Fire 31(5) 492-506 https://doi.org/10.1071/WF21120
Submitted: 24 August 2021 Accepted: 13 March 2022 Published: 20 May 2022
© 2022 The Author(s) (or their employer(s)). Published by CSIRO Publishing on behalf of IAWF. This is an open access article distributed under the Creative Commons Attribution-NonCommercial-NoDerivatives 4.0 International License (CC BY-NC-ND)
Abstract
Wildfires often exhibit complex and dynamic behaviour arising from interactions between the fire and surrounding environment that can create a rapid fire advance and result in loss of containment and critical fire safety concerns. A series of laboratory experiments involving the interaction of two parallel fire lines on a uniform fuel bed without slope under the influence of wind is presented and discussed. The two fire lines are initially separated by a certain distance (1, 2 m) and the subsequent fire spread is described. The results show that the pyroconvective interaction between the two fire lines and ambient wind modified the rate of spread of the approaching fire lines and their associated spread characteristics, independently of the distance between them. A physical interpretation of fire evolution based on the dynamic interaction between two parallel fire lines under wind flow is proposed. We use a dimensionless physical parameter, the Froude number. The results also demonstrated the existence of a wind flow velocity between 1 and 2 m s−1, corresponding to a Froude number between 0.2 and 0.4 for which the rate of approach of the two merging fire lines is a minimum.
Keywords: accelerating fires, convergent fire fronts, dynamic fire behaviour, extreme fire behaviour, fire behaviour, forest fires, merging fires, parallel fronts.
Introduction
Wildfire propagation is a complex phenomenon that is not fully understood. Over the last several decades, wildfire behaviour researchers have employed empirical and theoretical analyses with the main objective of predicting fire behaviour in the landscape. Pastor et al. (2003) and Sullivan (2009) provide a survey of this effort illustrating the complexity of the problem. Nowadays, it is possible to predict fire behaviour under a very limited set of conditions (Thomas et al. 2017), but beyond such conditions, predictive capability can be severely compromised. For example, fires burning under extreme conditions, which burn with great intensity and are subject to dynamic interactions between the fire and the surrounding environment, remain beyond the realms of reliable prediction. These fires can exhibit abrupt, rapid and unexpected changes in fire behaviour that endanger people’s lives and defy suppression efforts (Bowman et al. 2017).
The interaction of fires has been observed and studied by several authors. Brown and Davis (1973) noted that during prescribed burning, the fire fronts or even some parts of the fire near the plot edges are dangerous because runs with the highest rates of spread (ROS) on one side of the plot may develop, and the fire can jump out of the plot and a spot fire can occur. Johansen (1984) observed that in prescribed fires, the merging of spot fires caused a rapid spread of the fire and an increase in flame length, while Pyne (1984) noted that large fires attract small fires and multiple heads can burn out the intervening fuels and merge. Clark et al. (1996) highlighted the importance and the utility of developing a coupled atmosphere–fire model based on the basic equations of motion and thermodynamics and demonstrated the convergence pattern in the vicinity of linear fire lines as a result of air being drawn into the fire’s hot air column. In the absence of ambient wind and slope, a vertically oriented convective cell draws in low-level air equally from all sides. In the presence of wind, this dynamic is modified in a way that results in the evolution of the parabolic or conical shape of the fire line.
Morvan (2007) developed a numerical study to analyse the flame geometry and the potential for crown fire for wildfires propagating through shrubland fuels, and introduced a dimensionless physical parameter, the Froude number (Fr), that can be defined by the ratio between the inertial force due to the wind flow and buoyancy. He considered that, when the wind flow is less than 6 m s−1, the flame length increases, but beyond this value, if wind velocity increases, a sharp reduction in flame length is observed. He explained that this phenomenon can be related to the buoyancy flow due to the vertical expansion of the hot gases above the combustion zone and the inertial flow induced by the wind, and the ratio of these two forces can be represented using the dimensionless physical parameter, the Froude number.
Sullivan (2007) used a set of experimental field tests, conducted in the Northern Territory, Australia, in July and August 1986, to analyse the role of the convective Froude number and Byram’s energy criterion. He found that Byram’s energy criterion can be calculated as the inverse cube of the convective Froude number. Byram’s energy criterion (or the Byram number) is another non-dimensional physical parameter that relates the horizontal dynamic force produced by the wind flow and the vertical buoyant forces of the fire. However, Clark et al. (1996), Morvan (2007) and Sullivan (2007) consider only one linear fire line propagating perpendicular to the wind.
Viegas et al. (2012) studied the interaction and merging of two oblique and symmetric fire fronts that intersect at a single point (forming a ‘V’-shaped fire line) and developed a conceptual analytical model for the ROS of the vertex of the ‘V’. The merging of two fire fronts intersecting at a single point has been analysed by several authors during the last decade and this phenomenon has been described as a ‘junction fire’ (Sharples et al. 2013; Viegas et al. 2013a; Raposo et al. 2015, 2018; Sullivan et al. 2019). Recently, Filkov et al. (2020) developed a simple, fast and accurate method to track fire front propagation and quantify merging fire behaviour at field scales.
Morvan et al. (2011) numerically analysed the interaction between two parallel fire fronts using a flat grassland fuel bed, and a wind direction perpendicular to the fire lines, so that the propagation of fire was in opposite directions (one fire spreading as a head fire and the other as a back fire). This analysis was intended to reproduce the behaviour that can occur during fire suppression operations (i.e. ‘backburning’). They concluded that the interaction occurs only at a fairly short distance. In our literature survey, we did not find any study addressing the problem of two parallel fire lines under different wind conditions such as those analysed in the present paper.
Fig. 1 shows the estimated fire perimeter of wildfires that occurred in Quiaios, Portugal, on 15 October 2017. The first ignition happened in Quintã at 13:34 hours (see orange star in Fig. 1), and the main ignition occurred in Cova de Serpe 1 h later; in Fig. 1, the yellow star represents the approximate location of this ignition. The Cova de Serpe ignition produced a spot fire that spread parallel to the main fire under strong wind conditions on flat ground (cf. Viegas et al. 2019); in Fig. 1, the green star represents the approximate location of this spot fire. According to ground and aerial photos, the flanks of these fires spread for at least 7 km while remaining at a distance of 200 m apart before eventually merging – the orange region with ref. no. 20171015_1800 in Fig. 1 represents the estimated position of this fire perimeter between 16:00 and 18:00 hours. The present study aims to describe the process of two fire lines merging under a wind flow blowing parallel to the lines of fire, a process that is not well understood or even studied.
Physical problem
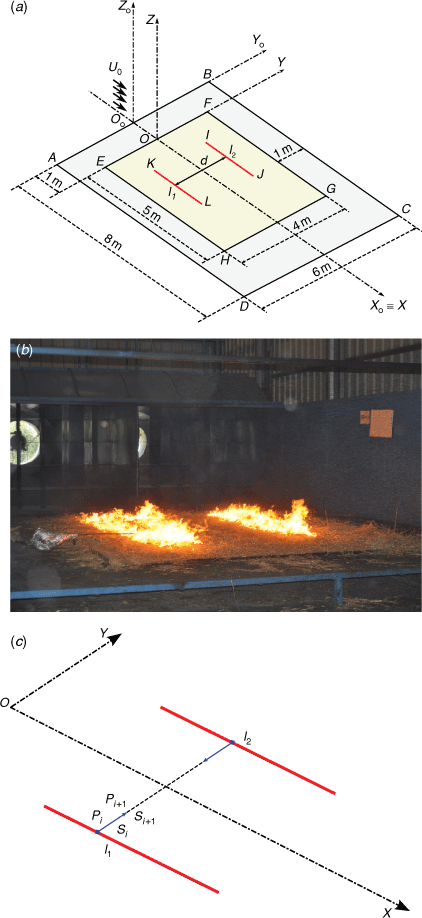
In the present study, it is assumed that two parallel fire lines are spreading on flat terrain and can interact with each other under the influence of wind flow. The two fire lines are separated initially by a distance d on a uniform fuel bed, as illustrated schematically in Fig. 2a. The Cartesian coordinate system OoXoYoZo is considered, in which OoZo is perpendicular to the ground. The study area is defined by ABCD and the fuel bed area is defined by EFGH. Line EF is shifted (1 m) in the OoXo axis. The fuel bed area is covered by a uniform layer of forest fuel able to support the spread of a surface fire.
|
We consider two linear fire fronts, each 2 m in length, defined by two straight lines (IJ and KL), symmetric in the OXZ plane, with a distance d between them, as shown in Fig. 2a. Henceforth, the linear fire lines IJ and KL will be referred to as l1 and l2, respectively. A uniform boundary layer-type flow is blowing parallel to the OXo axis with a characteristic velocity (U0), represented by black arrows in Fig. 2a. At time t0 = 0 s, the fire lines are ignited and are free to spread in all directions.
Material and methods
Laboratory experiments
The experimental study was carried out at the Combustion Tunnel (CT) of the Forest Fire Research Laboratory of the University of Coimbra in Lousã (Portugal). The CT has a working area of 6 × 8 m2, defined by ABCD in Fig. 2a. The fuel bed area was 4 × 5 m2, with side dimensions EF and GH of 4 m and, the other sides, FG and EH, of 5 m. To avoid boundary effects inside the wind CT, a gap of 1 m between the vertical walls of the combustion tunnel and the edges of the fuel bed (EF and GH) was left. The wind flow was produced by two fans with maximum power and flow velocity of 70 kW and 8 m s−1, respectively. The tests were performed with reference wind velocities of 0, 1, 2, 3, 4 and 5 m s−1. The reference wind velocity (U0) was measured in the OX axis with a KimoAMI 300 hot-wire probe (Kimo Instruments, Montpon-Ménestérol, France) 22 cm above the CT floor. More details can be seen in Fig. A1.
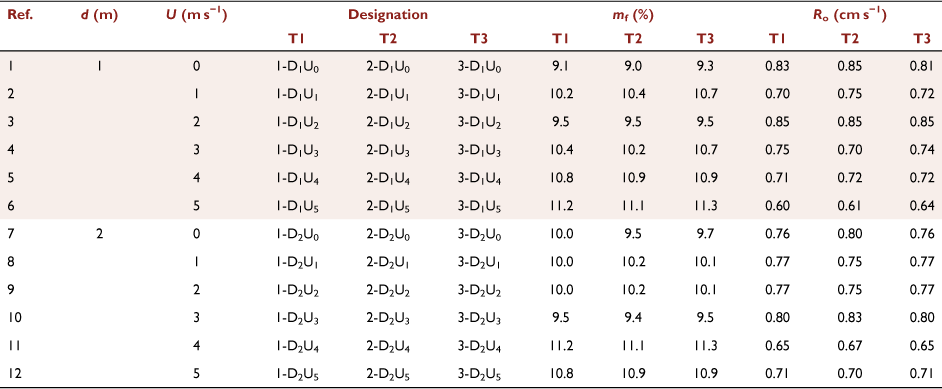
During the preparation of each test, the conditions of the fuel load and bulk density were controlled, and the air temperature (°C), relative humidity (%) and fuel moisture (mf) were monitored. The fuel bed for the experiments was composed of dry particles of straw (Avena sativa) with a constant load of 600 g m−2 (dry basis). The fuel bed height (hf) was measured at five random positions and on average was 0.07 m, and the packing ratio (βf), given by the ratio of the fuel bed bulk density (ρb) to the fuel particle density (ρp), was 0.029 (Viegas and Pita 2004; Xie et al. 2014; Raposo 2016; Raposo et al. 2018; Rodrigues et al. 2019). The fuel properties are approximately: particle surface-area-to-volume ratio (σf) 4734 m−1; bulk density (ρb) 7.5 kg m−3; fuel particle density (ρp) 258 kg m−3 and high heat of combustion (HHC) 18 kJ kg−1 (Catchpole et al. 1993; Almeida 2005; Àgueda et al. 2011). The fuel moisture content was measured twice for each test with an A&D ML50 moisture analyser: during preparation of the fuel bed and before ignition for each test. To ensure that the moisture content of the fuel in contact with ambient air did not change, the time between the preparation of the fuel bed and the beginning of the burn test did not exceed 10 min. The basic ROS Ro (cm s−1) of a linear fire front in a fuel bed with the same properties was measured for each series of tests using a 1 × 1 m2 horizontal fuel bed without wind. The corresponding values are given in Table 1. The ignition of the two fire lines (lines l1 and l2) was made by two persons to ensure that the lines started burning simultaneously. For this purpose, two wool threads soaked in a mixture of petrol (50%) and diesel fuel (50%) were used.
|
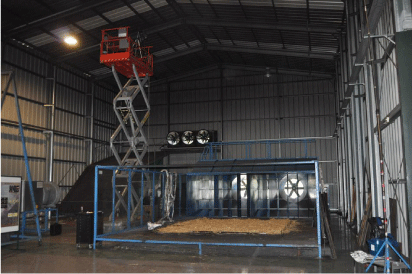
The tests were monitored and recorded with an infrared camera (FLIR SC660) and a video camera in the visible range. The parameters considered for the infrared camera were a temperature range between 300 and 1500°C, an emissivity value of 0.98 (Dlugogorski et al. 2014) and an acquisition rate of 15 Hz. A threshold of 350°C was used to avoid obstruction of the view by the plume of the fire. The two cameras were placed at the top of the lifting platform, shown top-left of Fig. 3, and each recording was in continuous mode. In order to avoid parallax errors, the angle between the infrared camera optical axis and the ground surface of the CT was approximately 90°. In order to reduce uncertainty, three replicate tests (T1, T2 and T3) were performed for each set of parameters, as shown in Table 1.
|
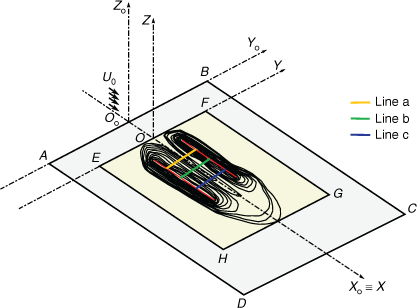
The infrared videos were used to obtain the fire contour perimeter at pre-defined times. The time between frames was adjusted for each test and was used to calculate the ROS of the interaction between the fire fronts. To determine the evolution of the fire front, the Cartesian coordinates of the frame points were used to calculate the instantaneous values of ROS at each point of the fire line. More details can be seen in Raposo et al. (2018) and Rodrigues et al. (2019). The interaction between the two fire lines was analysed along three reference lines (lines a, b and c), at a distance of 1.0, 1.5 and 2.0 m in relation to the OXYZ reference frame, measured in the OX axis. As an example, in Fig. 4, the isochrones of one of the tests (1-D1U3) are shown together with the reference lines that were used to analyse the fire spread.
|
Evaluation of the ROS of the approaching fires
The evaluation of the instantaneous ROS of the approaching lines (see Fig. 2a, c) is measured along each reference line a, b and c, according to Fig. 4. If Pi and Pi+1 are the positions of the fire line along the reference line and Si and Si+1 are the distances travelled by the fire line from the origin, then we estimate the instantaneous value Rj of the ROS in the OY direction with:

We calculate this value for time tj and at distance Sj given by:


As we intend to correlate the fire properties with Rj, they will be determined for the corresponding time tj for each time step. In the present study, in order to minimise the effect of the fuel moisture content mf on Rj, we use the non-dimensional ROS (Viegas 2006) calculated from:

where Ro represents the basic ROS (cm s−1) under no-slope and no-wind conditions. The basic ROS Ro is an intrinsic property of the fuel bed and depends mainly on the moisture content mf of the fuel particles (Catchpole et al. 2001; Martins Fernandes 2001; Alexander and Cruz 2013; Viegas et al. 2013b; Lopes et al. 2014; Xie et al. 2020).
In order to compare the results obtained for different values of initial separation d, we introduce a non-dimensional distance (S′), defined by:

where d is the pre-determined separation of the two fire lines (1 or 2 m). This analysis was made in both positive and negative OY directions. Assuming that the fire is spreading symmetrically, the average of the two values is taken to characterise each time step.
Balance between horizontal and vertical forces
The physical problem analysed in our work is related to the horizontal force provided by the wind flow and the vertical forces associated with the fire-induced buoyancy. We use the non-dimensional convective Froude number, Fr, to describe the ratio between these two forces, defined by:

where U0 is reference wind velocity (m s−1), g is acceleration due to gravity (9.81 m s−2) and L (m) is a length that characterises the size of the combustion area producing buoyancy. To estimate this parameter, we considered two options: (i) the average length L(tj) of the two fire lines measured along the OX axis at each time step; (ii) the square root of the burned area A(tj) of each fire line at each time step.
The average value of two fire line lengths l1 and l2 along the OX axis is defined by:

where tj is the time step defined in Eqn 2.
The square root of the average value of the two fire line areas is defined by:

In this equation, Bli is the width of each burned area and ci is a shape coefficient, which is equal to 1 if we assume that the shape of the fire is a rectangle.
The vertical forces associated with the Froude number were analysed with the two approaches: the fire length L and the square root of the burnt area L*. The values that we obtained were not significantly different and, for this reason, we used L, because it is easier to obtain.
Statistical analysis
In order to reduce uncertainty, three replicates (T1, T2 and T3) were performed for each set of parameters, as shown in Table 1 and all results presented in this study are the average of the three replicates. The error bars and the dashed line curves in the figures represent the ±95% confidence intervals.
We consider that the approaching ROS of two linear fire lines can be influenced by the wind flow (U0), which changes the flame geometry, the horizontal and vertical forces resulting from the wind flow and the vertical buoyant of the fire, respectively, and the gap distance (d) between the two fire lines. In order to check the combined influence of each variable, an analysis of variance (ANOVA) was carried out to test for the effects of the wind flow velocity (U0 = 0, 1, 2, 3 and 5 m s−1) and the distance between the parallel fire lines (d = 1 and 2 m). ANOVA is a statistical method for determining the existence of differences among several population means, which requires the analysis of different forms of variance associated with the random samples under study (see e.g. Devore 2010).
Results and discussion
Rate of spread analysis
When the fire lines are ignited, initially they are segments of a straight line, but when they spread under the influence of wind flow (horizontal forces) and buoyancy flow (vertical forces), they become curved and the spreading conditions may change along the OX axis with the development of the fire. Based on general observations of fire behaviour (IR camera, visual [ocular] and colour video observations) during the experiments, there was a large change on fire dynamics when the wind flow velocity (U0) was increased in comparison with the effect of changing the distance between the fronts (d).
In order to assess these dynamic changes, in each test we estimated the instantaneous value  for each reference line (lines a, b and c; Fig. 4) every 5 s from fire perimeter plots obtained with the IR camera. The non-dimensional instantaneous or local ROS
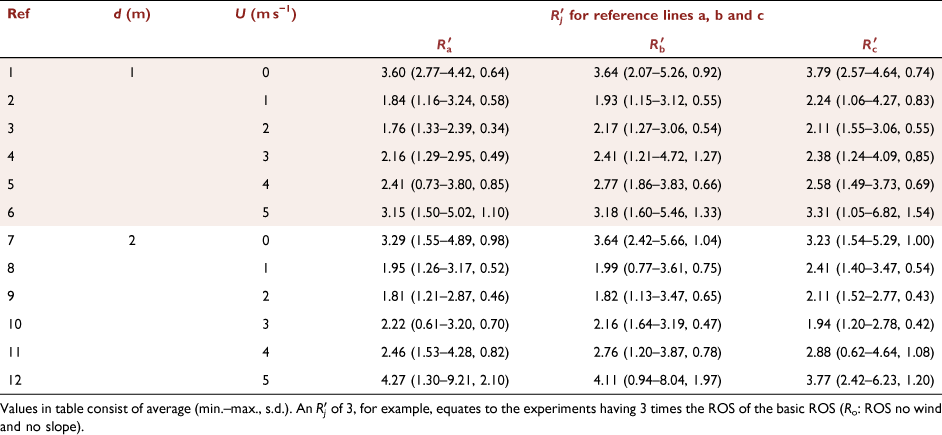
  was calculated according to Eqn 4. The basic ROS (Ro) for each set of parameters can be seen in Table 1. The average, minimum, maximum and s.d. values of non-dimensional ROS
  for the three experiments (T1, T2 and T3) and for each reference line (lines a, b and c) were calculated and are given in Table 2.
|
For the two fire lines at an initial distance d = 1 m, for all wind flow intervals considered, the average of non-dimensional ROS values ranged between 1.76 (U0 = 2 m s−1) and 3.79 (U0 = 0 m s−1). In contrast, for the two fire lines at an initial distance d = 2 m, the average ranged between 1.81 (U0 = 2 m s−1) and 4.11 (U0 = 5 m s−1) (Table 2). For each unique set of conditions tested, the non-dimensional ROS was generally largest for wind flow equal to U0 = 0 and 5 m s−1, and lowest for the wind flow U0 = 1 and 2 m s−1 (see Table 2).
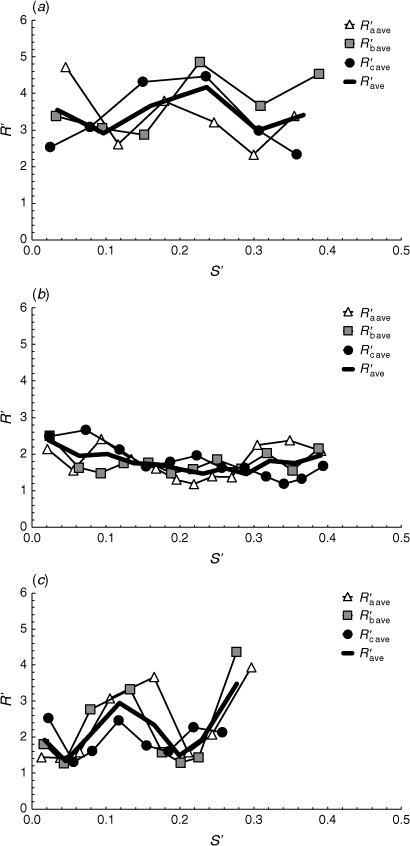
However, for clarity, in the following figures, we represent the mean of the results for the three repetitions run under the same conditions. The fire spread can be described as a function of either time or space (distance) (cf. Viegas et al. 2021); from now on, we use non-dimensional distance to analyse the evolution of the ROS of the two approaching fires, as this gives a better indication of the fire behaviour, as the distance between the fire lines is reduced to zero as S′ tends to 0.5.
In Fig. 5, the non-dimensional average ROS  values for each reference line a, b or c, with the configuration mentioned before, are plotted as a function of the non-dimensional distance S′. As can be seen, there no marked difference between the three lines in each test configuration and the average local ROS
  values for the three lines a, b and c can be used to estimate the local behaviour of the approaching fire lines for each set of values of d and U0. We used the same methodology as Viegas et al. (2021).
|
In Fig. 6, the average of the non-dimensional values of local ROS  with standard deviation bars (corresponding to 95% confidence intervals) are plotted as a function of the non-dimensional distance S′ for two tests performed with d = 1 and 2 m for each wind velocity value, U0 = 0, 1, 2, 3, 4 and 5 m s−1.
The behaviour of the approaching fires is non-monotonic (Viegas et al. 2021) in the sense that it is not constant and, on the contrary, the laterally spreading fire tends to decelerate or accelerate. Our results indicate that for both values of d considered, the behaviour is less dependent on the initial distance and more dependent on the ambient wind velocity, because the combination of wind flow velocity and buoyancy flow changes the approaching fires and dynamic fire behaviour.
We now present the results of the approaching fires along the OY axis that illustrate the changing behaviour of fire spread when the flow velocity is modified.
As shown in Fig. 6a (U0 = 0 m s−1), the value of R′ has two stages: first when S′ ~ 0–0.25, the  increases, because the flames lean over towards each other; then, the flames become more vertical and their length and height increase. After this,
  decreases until S′ ~ 0.5 because the flames are leaning over towards the burned area and the flames' length and height continue to decrease. The convective process between two fire lines during the first stage induces an acceleration during the approach of the fire; however, when the burned area increases, this convective process changes and a deceleration phase occurs.
For U0 = 1 m s−1 (Fig. 6b), the value of  has a relatively high initial value, less than R′ for U0 = 0 m s−1, but during the approaching fires, when S′ increases, the R′ value decreases.
However, for U0 = 2 m s−1 (Fig. 6c for this experimental setting), the approaching velocity is relatively constant. For both wind flow velocities (U0 = 1 and 2 m s−1), the convection flow is symmetrical on both sides of each fire front. In that case, the wind inhibits the interaction and the flames are almost vertical, and the buoyancy flow increases compared with the flow influenced by the wind. The ratio between vertical and horizontal forces tends to equilibrium and results in a minimum value of  (Figs 7, 8, respectively). However, for all burn times and distances, the flame height tends to be constant; see Fig. 9.
|
|
|
For U0 = 3, 4 and 5 m s−1 (Fig. 6d–f), the approaching velocity  generally tends to increase with the approaching fires, with marked oscillations (Fig. 6f). When U0 = 5 m s−1, the non-dimensional ROS in general increases because the flame depth and the amount of fuel that starts burning increase, influenced by the wind flow blowing between two fire lines. The higher wind speed increases turbulence, a highly important factor, decreasing the flame height, but increasing combustion processes.
Average values
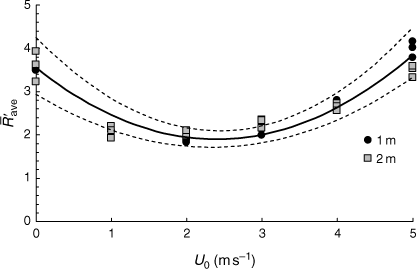
In order to assess the overall role of the parameters d and U in the interaction between the two lines, we estimate the average  values for each reference line and for each distance (d = 1 and 2 m). These values are plotted in Fig. 7 as a function of the wind flow velocity U0 (0–5 m s−1) for all tests performed. As can be seen, the values of
  show a similar trend with a marked minimum for wind velocity between U0 = 1 and 2 m s−1.
The set of data points was fitted by a quadratic law given by:

The correlation coefficient R2 for this fit is 0.891. Therefore, we consider that for the present experimental conditions, the non-dimensional ROS is independent of the distance between the fire lines and there is a wind velocity value between 1 and 2 m s−1 for which the ROS has an overall minimum value. Two-way ANOVA with replication indicated that the approaching fire  was significantly (P-value < 0.05) affected by the wind flow (U0), but the distance between two fire lines, for the range of experimental laboratory tests performed, did not significantlyaffect
  (P-value > 0.05).
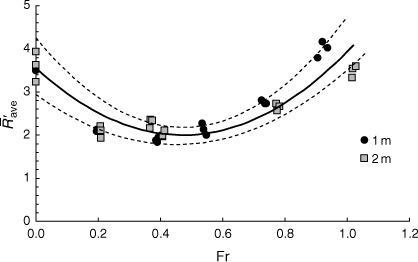
The ratio between the vertical forces induced by the buoyancy flow, which happens during the ascension of the hot gases, and the horizontal forces produced by the wind was calculated, according to Eqn 6. Fig. 8 shows the non-dimensional average  plotted as a function of the Froude number (Fr) for all tests performed. As can be seen in Fig. 8, the values of
  as a function of Fr have a similar trend, with a marked minimum for the same
  as for U0 = 1 and 2 m s−1. The set of data points was fitted by a quadratic law given by:

The correlation coefficient R2 for this fit is 0.788. Therefore, we consider that for the present experimental conditions, the ratio between horizontal and vertical force lines affecting the approaching ROS is independent of the initial distance between the fires. Two-way ANOVA with replication indicated that the Froude number was significantly (P-value < 0.05) affected by the wind flow (U0), but the distance between the two fire lines for the experimental laboratory tests performed did not significantly (P-value > 0.05) affect the Froude number.
Physical interpretation of fire evolution
Our experiments show that the average rate of lateral spread of two fire lines with parallel wind varies in a non-monotonic way with the wind velocity. In order to interpret this result, which to our knowledge is reported for the first time, we analysed in great detail the videos of these and other similar experiments in combination with the instantaneous values of the ROS to provide an explanation for the existence of a minimum value for the ROS.
We know that fire spread is always three-dimensional and the fluctuations of the fire and flow properties create cells of convection (Finney et al. 2015). In order to simplify our interpretation of the dynamic interaction between the fires, the fuel bed and the surrounding flow, to explain the non-monotonic or intermittent behaviour of fire, according Viegas et al. (2021), we consider the evolution of fire and flame properties along a given reference direction. As we are concerned with the phenomena that occur when two parallel fire lines interact affected by parallel wind flow, we consider a line parallel to the OY axis between the two fire lines.
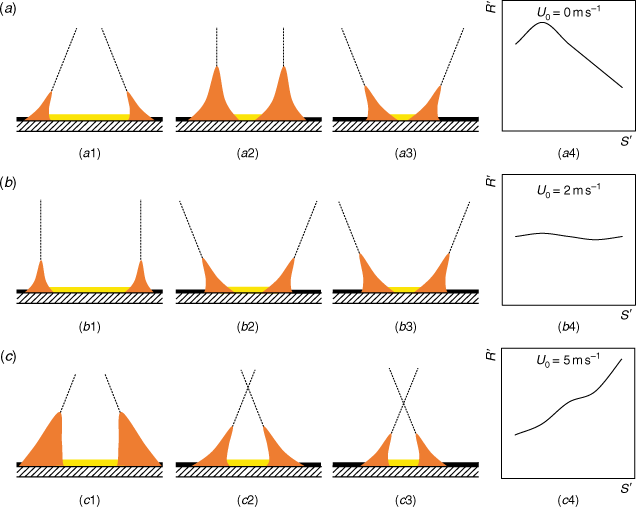
In Fig. 9, we present a physical interpretation of the fire spread properties for the three values of the flow velocity (U0 = 0, 2 and 5 m s−1) corresponding to the three fire spread regimes that were identified. For each flow velocity, we show three different stages when the fire fronts spread towards each other. The inset diagram shows the typical evolution of the ROS as a function of the local non-dimensional distance S′ between the fire lines, as given in Figs 5, 6.
As shown in each case, the flame geometry and size change during the fire fronts' advance in a way that depends on the flow velocity. These changes are associated with the role of horizontal and vertical forces that change the flame geometry (Morvan 2007; Balbi et al. 2020; Viegas et al. 2021) and, consequently, the ROS between the two parallel fire lines.
In the absence of wind, U0 = 0 m s−1 (Fig. 9a), there is no horizontal flow and buoyancy is the dominating factor. After the two fire lines start to burn, the flames lean towards each other (see Fig. 9a1), and the fire fronts quickly approach each other in this initial phase. After the increase of the burned area by each fire line, the residual heat of the burned area induces an indraft towards the burned areas, the flames become more vertical and the flame length and height increase (see Fig. 9a4). Then, the flames lean towards the burned fuel and spread with decreasing velocity. As the initial stage of acceleration is very strong in this case – absence of horizontal wind – the average ROS is relatively high in spite of the deceleration process that we have during the approach of the two fire lines.
For the wind flow U0 = 2 m s−1 (see Fig. 9b), in the first stage (Fig. 9b1), the flame is almost vertical and the convection flow is symmetrical on both sides of each fire front. In this case, the wind inhibits interaction and the flames are almost vertical. In the second and third stages (see Fig. 9b2, b3), the flames lean towards the burnt area and the flame length and height are constant because the residual heat from the burnt area is dominating the heat from the flames. This leads to stronger flow convergence over the burnt areas. In this case, therefore, most of the time the fire fronts spread as back fires with a relatively low value of ROS. As a consequence, the average value of the ROS is very low compared with the previous case.
For the wind flow U0 = 5 m s−1 (see Fig. 9c), the flames of each fire line lean towards each other, the flame angle decreases and the ROS increases during all stages (see Fig. 9c1–c3). As a consequence of this continuous acceleration, for this set of boundary conditions, the average value of ROS is also larger than in the previous case. This can be explained by the effect of the stronger wind intensifying the overall fire behaviour (including the two approaching flanks) and so the heat from the two approaching flame fronts can predominate over the residual heat from the burnt area, leading to stronger flow convergence between the two approaching fire lines. We confirmed the existence of similar behaviour of the fire associated with the typology of the flames and of the convective processes in other types of fires. One of these cases corresponds to the well-controlled experiments of junction fires described in Viegas et al. (2021). In their study, strong convective effects were observed during the evolution of fires initiated as two linear ignition lines intersecting at an angle of 30° and spreading on a slope of 30°. Specifically, near the intersection point, there was a strong convective movement towards the unburned area and a marked acceleration of the fire, while at the other end of the fire line, fire-induced convection inclined the flames towards the burned fuel, therefore reducing the ROS. At other points along the fire line, there was a balance of convection conditions and the ROS remained practically constant during the spread.
Conclusion
The interaction of two parallel fire fronts initially separated by a distance d spreading laterally in a parallel flow under different wind velocities was studied. Our experimental results obtained in a set of test conditions showed that the average ROS of the two approaching fires is independent of the initial distance between the lines but varies non-monotonically with the wind velocity.
In the absence of wind, the average ROS of the two approaching fires has a relatively high value that decreases with increasing wind velocity, reaching a minimum value for a range of relatively low values of wind velocity, and then increases with wind velocity. In the present tests, which were performed for wind velocities up to 5 m s−1, the minimum value of the ROS was obtained for wind velocities between 1 and 2 m s−1.
Based on analysis of the ROS of the fire and of the flame properties during the fire spread, a physical interpretation of the dynamics of fire spread is provided to justify the existence of this minimum value. The balance between fire-induced buoyancy and wind flow determines the angle and length of the flames, causing the fire to spread relatively rapidly in the absence of wind, owing to high initial acceleration. For relatively low values of wind speed, the ROS of the fire lines remains constant and relatively low. With increasing wind velocity, the flames lean towards the unburned fuel between the fire lines, accelerating their spread and increasing the average value of the ROS.
In future work, we intend to analyse in more detail the dynamic evolution of the fire and its interaction with the surrounding flow between the fire lines and the corresponding variation of the values of ROS between two parallel fire lines. The centre of convergence of the pyrogenic flow will be analysed and compared with numerical simulations. This will be performed for a wider range of laboratory experiments (with wind flow or slope influence) with standard fuel bed types and field experiments. To better compare with wildfire situations, it is also important to increase the scale factor of the dimension of the fire line length and of the distance between fire lines. Development of a mathematical model to interpret the present results and its application to the analysis of real fires will be addressed in future work.
Symbols
Data availability
Data are available only under request to the corresponding author: Carlos Ribeiro, carlos.ribeiro@adai.pt.
Conflicts of interest
The authors declare no conflict of interest.
Declaration of funding
The work reported in this article was carried out under the scope of projects Firestorm (PCIF/GFC/0109/2017), McFire (PCIF/MPG/0108/2017), IMfire (PCIF/SSI/0151/2018), SmokeStorm (PCIF/MPG/0147/2019) and SafeFire (PCIF/SSO/0163/2019), supported by the Portuguese National Science Foundation, Region (Centro 2020, Centro-01-0246-FEDER-000015) and European Union’s Horizon 2020 research and innovation programme under grant agreement No. 101003890, FirEUrisk – Developing A Holistic, Risk-Wise Strategy For European Wildfire Management. We thank the FCT Foundation for Science and Technology for the PhD grants of Carlos Ribeiro and André Rodrigues with references SFRH/BD/140923/2018 and SFRH/BD/138235/2018, respectively.
Author contributions
Conceptualisation: CR, JR and DXV; data curation: CR and BS;formal analysis: CR, BS and JR; methodology: CR, JR, LR and DXV;experimental test: CR, BS, LR, JR and AR; supervision: JR and DXV;writing – original draft: CR; writing – review and editing – CR, LR, JR, AR, DXV and JS.
Acknowledgements
The support given by Nuno Luís and Gonçalo Rosa in performing the laboratory experiments is gratefully acknowledged. Luis Mário Ribeiro and Tiago Rodrigues are thanked for collaboration with some images and statistical analysis, respectively.
References
Àgueda A, Pastor E, Pérez Y, Viegas DX, Planas E (2011) Fire intensity reduction in straw fuel beds treated with a long-term retardant. Fire Safety Journal 46, 41–47.| Fire intensity reduction in straw fuel beds treated with a long-term retardant.Crossref | GoogleScholarGoogle Scholar |
Alexander ME, Cruz MG (2013) Assessing the effect of foliar moisture on the spread rate of crown fires. International Journal of Wildland Fire 22, 415–427.
| Assessing the effect of foliar moisture on the spread rate of crown fires.Crossref | GoogleScholarGoogle Scholar |
Almeida MA de FB de (2005) Caracterização da combustibilidade de leitos florestais heterogéneos. Master's thesis. Universidade de Aveiro, Aveiro, Portugal. Available at http://hdl.handle.net/10773/4597
Balbi JH, Chatelon FJ, Morvan D, Rossi JL, Marcelli T, Morandini F (2020) A convective–radiative propagation model for wildland fires. International Journal of Wildland Fire 29, 723–738.
| A convective–radiative propagation model for wildland fires.Crossref | GoogleScholarGoogle Scholar |
Bowman DMJS, Williamson GJ, Abatzoglou JT, Kolden CA, Cochrane MA, Smith AMS (2017) Human exposure and sensitivity to globally extreme wildfire events. Nature Ecology and Evolution 1, 0058
| Human exposure and sensitivity to globally extreme wildfire events.Crossref | GoogleScholarGoogle Scholar |
Brown AA, Davis K (1973) ‘Forest Fire – Control and Use.’ (McGraw-Hill: New York, NY, USA)
Catchpole EA, Catchpole WR, Rothermel RC (1993) Fire behavior experiments in mixed fuel complexes. International Journal of Wildland Fire 3, 45–57.
| Fire behavior experiments in mixed fuel complexes.Crossref | GoogleScholarGoogle Scholar |
Catchpole EA, Catchpole WR, Viney NR, McCaw WL, Marsden-Smedley JB (2001) Estimating fuel response time and predicting fuel moisture content from field data. International Journal of Wildland Fire 10, 215–222.
| Estimating fuel response time and predicting fuel moisture content from field data.Crossref | GoogleScholarGoogle Scholar |
Clark TL, Jenkins MA, Coen J, Packham D (1996) A coupled atmosphere–fire model: convective feedback on fire-line dynamics. Journal of Applied Meteorology 35, 875–901.
| A coupled atmosphere–fire model: convective feedback on fire-line dynamics.Crossref | GoogleScholarGoogle Scholar |
Devore JL (2010) ‘Probability and Statistics for Engineering and the Sciences’. (Brooks/Cole: Boston, MA, USA)
Dlugogorski BZ, Hirunpraditkoon S, Kennedy EM (2014) Ignition temperature and surface emissivity of heterogeneous loosely packed materials from pyrometric measurements. Fire Safety Science 11, 262–275.
| Ignition temperature and surface emissivity of heterogeneous loosely packed materials from pyrometric measurements.Crossref | GoogleScholarGoogle Scholar |
Filkov A, Cirulis B, Penman T (2020) Quantifying merging fire behaviour phenomena using unmanned aerial vehicle technology. International Journal of Wildland Fire 30, 197–214.
| Quantifying merging fire behaviour phenomena using unmanned aerial vehicle technology.Crossref | GoogleScholarGoogle Scholar |
Finney MA, Cohen JD, Forthofer JM, McAllister SS, Gollner MJ, Gorham DJ, Saito K, Akafuah NK, Adam BA, English JD (2015) Role of buoyant flame dynamics in wildfire spread. Proceedings of the National Academy of Sciences 112, 9833–9838.
| Role of buoyant flame dynamics in wildfire spread.Crossref | GoogleScholarGoogle Scholar |
Johansen RW (1984) Prescribed burning with spot fires in the Georgia Coastal Plain. Georgia Forestry Commission 49, 1–8. http://www.treesearch.fs.fed.us/pubs/36481
Lopes S, Viegas DX, Teixeira de Lemos L, Viegas MT (2014) Equilibrium moisture content and timelag of dead Pinus pinaster needles. International Journal of Wildland Fire 23, 721
| Equilibrium moisture content and timelag of dead Pinus pinaster needles.Crossref | GoogleScholarGoogle Scholar |
Martins Fernandes PA (2001) Fire spread prediction in shrub fuels in Portugal. Forest Ecology and Management 144, 67–74.
| Fire spread prediction in shrub fuels in Portugal.Crossref | GoogleScholarGoogle Scholar |
Morvan D (2007) A numerical study of flame geometry and potential for crown fire initiation for a wildfire propagating through shrub fuel. International Journal of Wildland Fire 16, 511–518.
| A numerical study of flame geometry and potential for crown fire initiation for a wildfire propagating through shrub fuel.Crossref | GoogleScholarGoogle Scholar |
Morvan D, Meradji S, Mell WE (2011) Numerical study of the interaction between a head and a backfire propagating in grassland. Fire Safety Science 10, 459–470.
| Numerical study of the interaction between a head and a backfire propagating in grassland.Crossref | GoogleScholarGoogle Scholar |
Pastor E, Zárate L, Planas E, Arnaldos J (2003) Mathematical models and calculation systems for the study of wildland fire behaviour. Progress in Energy and Combustion Science 29, 139–153.
| Mathematical models and calculation systems for the study of wildland fire behaviour.Crossref | GoogleScholarGoogle Scholar |
Pyne SJ (1984) ‘Introduction to Wildland Fire: Fire Management in the United States.’ (John Wiley and Sons: New York, NY, USA)
Raposo JR, Cabiddu S, Viegas DX, Salis M, Sharples J (2015) Experimental analysis of fire spread across a two-dimensional ridge under wind conditions. International Journal of Wildland Fire 24, 1008
| Experimental analysis of fire spread across a two-dimensional ridge under wind conditions.Crossref | GoogleScholarGoogle Scholar |
Raposo JR, Viegas DX, Xie X, Almeida M, Figueiredo AR, Porto L, Sharples J (2018) Analysis of the physical processes associated with junction fires at laboratory and field scales. International Journal of Wildland Fire 27, 52–68.
| Analysis of the physical processes associated with junction fires at laboratory and field scales.Crossref | GoogleScholarGoogle Scholar |
Raposo JRN (2016) Extreme fire behaviour associated with merging of two linear fire fronts. PhD Thesis, Universidade de Coimbra, Coimbra, Portugal. Available at http://hdl.handle.net/10316/31020
Rodrigues A, Ribeiro C, Raposo J, Viegas DX, André J (2019) Effect of canyons on a fire propagating laterally over slopes. Frontiers in Mechanical Engineering 5, 402–409.
| Effect of canyons on a fire propagating laterally over slopes.Crossref | GoogleScholarGoogle Scholar |
Sharples JJ, Towers IN, Wheeler G, Wheeler V, Mccoy JA (2013) Modelling fire line merging using plane curvature flow. In ‘20th International Congress on Modelling and Simulation, 1–6 December 2013, Adelaide, Australia’. (Eds J Piantadosi, RS Anderssen, J Boland) pp. 256–262. (The Modelling and Simulation Society of Australia and New Zealand.) Available at https://www.mssanz.org.au/modsim2013/A3/sharples2.pdf
Sullivan AL (2007) Convective Froude number and Byram’s energy criterion of Australian experimental grassland fires. Proceedings of the Combustion Institute 31, 2557–2564.
| Convective Froude number and Byram’s energy criterion of Australian experimental grassland fires.Crossref | GoogleScholarGoogle Scholar |
Sullivan AL (2009) Wildland surface fire spread modelling, 1990–2007. 3: Simulation and mathematical analogue models. International Journal of Wildland Fire 18, 387
| Wildland surface fire spread modelling, 1990–2007. 3: Simulation and mathematical analogue models.Crossref | GoogleScholarGoogle Scholar |
Sullivan AL, Swedosh W, Hurley RJ, Sharples JJ, Hilton JR (2019) Investigation of the effects of interactions of intersecting oblique fire lines, with and without wind, in a combustion wind tunnel. International Journal of Wildland Fire 28, 704–719.
| Investigation of the effects of interactions of intersecting oblique fire lines, with and without wind, in a combustion wind tunnel.Crossref | GoogleScholarGoogle Scholar |
Thomas CM, Sharples JJ, Evans JP (2017) Modelling the dynamic behaviour of junction fires with a coupled atmosphere–fire model. International Journal of Wildland Fire 26, 331–344.
| Modelling the dynamic behaviour of junction fires with a coupled atmosphere–fire model.Crossref | GoogleScholarGoogle Scholar |
Viegas DX (2006) Parametric study of an eruptive fire behaviour model. International Journal of Wildland Fire 15, 169–177.
| Parametric study of an eruptive fire behaviour model.Crossref | GoogleScholarGoogle Scholar |
Viegas DX, Pita LP (2004) Fire spread in canyons. International Journal of Wildland Fire 13, 253–274.
| Fire spread in canyons.Crossref | GoogleScholarGoogle Scholar |
Viegas DX, Raposo JR, Davim DA, Rossa CG (2012) Study of the jump fire produced by the interaction of two oblique fire fronts. Part 1. Analytical model and validation with no-slope laboratory experiments. International Journal of Wildland Fire 21, 843–856.
| Study of the jump fire produced by the interaction of two oblique fire fronts. Part 1. Analytical model and validation with no-slope laboratory experiments.Crossref | GoogleScholarGoogle Scholar |
Viegas D, Raposo J, Figueiredo A (2013a) Preliminary analysis of slope and fuel bed effect on jump behavior in forest fires. Procedia Engineering 62, 1032–1039.
| Preliminary analysis of slope and fuel bed effect on jump behavior in forest fires.Crossref | GoogleScholarGoogle Scholar |
Viegas DX, Soares J, Almeida M (2013b) Combustibility of a mixture of live and dead fuel components. International Journal of Wildland Fire 22, 992–1002.
| Combustibility of a mixture of live and dead fuel components.Crossref | GoogleScholarGoogle Scholar |
Viegas DX, Almeida MA, Ribeiro LM, Raposo J, Viegas MT, Oliveira R, Alves D, Pinto C, Rodrigues A, Ribeiro C, Lopes S, Jorge H, Viegas CX (2019) ‘Análise dos Incêndios Florestais Ocorridos a 15 de outubro de 2017.’ (Centro de Estudos sobre Incêndios Florestais (CEIF/ADAI/LAETA))
Viegas DXFC, Raposo JRN, Ribeiro CFM, Reis LCD, Abouali A, Viegas CXP (2021) On the non-monotonic behaviour of fire spread. International Journal of Wildland Fire 30, 702–719.
| On the non-monotonic behaviour of fire spread.Crossref | GoogleScholarGoogle Scholar |
Xie X, Liu N, Viegas DX, Raposo JR (2014) Experimental research on upslope fire and jump fire. Fire Safety Science 11, 1430–1442.
| Experimental research on upslope fire and jump fire.Crossref | GoogleScholarGoogle Scholar |
Xie X, Liu N, Raposo JR, Viegas DX, Yuan X, Tu R (2020) An experimental and analytical investigation of canyon fire spread. Combustion and Flame 212, 367–376.
| An experimental and analytical investigation of canyon fire spread.Crossref | GoogleScholarGoogle Scholar |
Appendix 1. Laboratory experiments
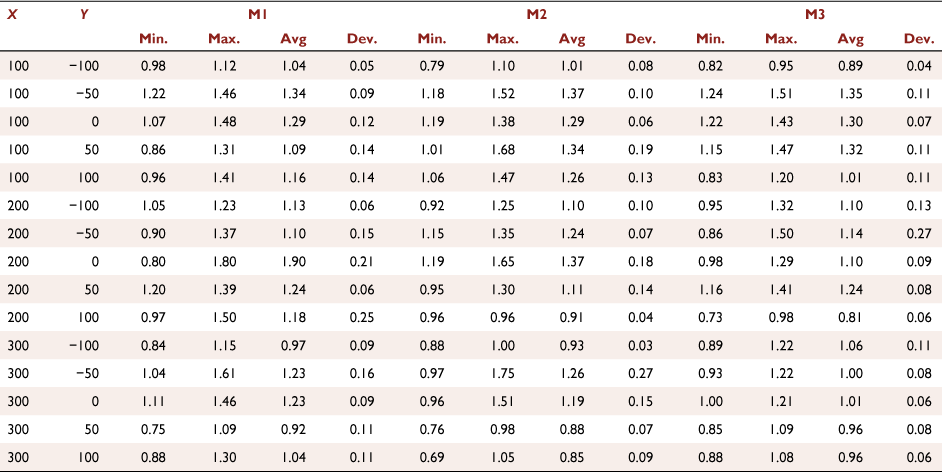
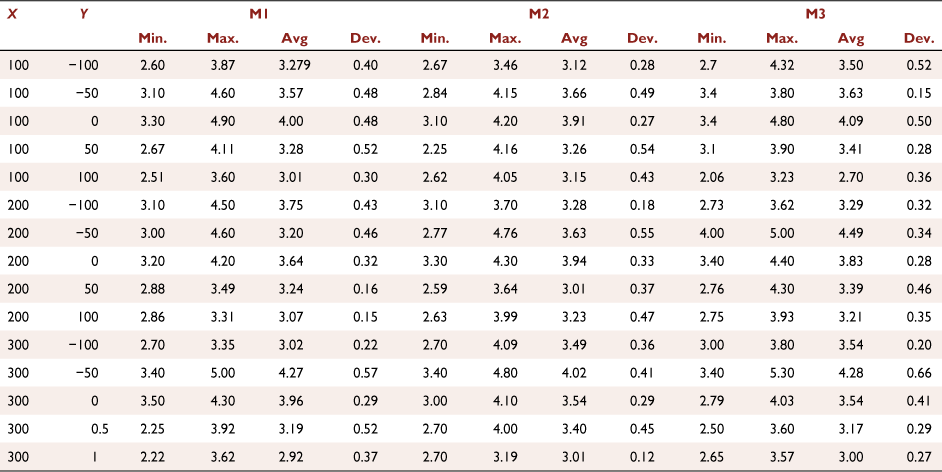
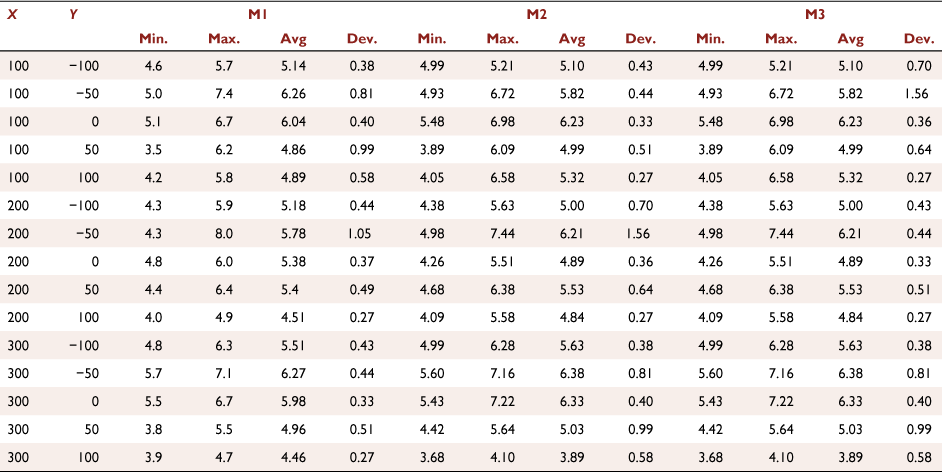
Laboratory experiments were carried out at the Forest Fire Research Laboratory of the University of Coimbra using an indoor CT. The fuel used in all tests was composed of dry particles of straw (Avena sativa) with a constant load of 600 g m−2 (dry basis). Inside the CT, the wind velocity was measured for wind velocities 1, 3 and 5 m s−1 in the OX axis at points Px,y where x and y are the coordinates relative to the referential OXY, with a KimoAMI 300 hot-wire probe 22 cm above the CT ground (OZ axis). Fig. A1a shows the positions where flow velocity was measured.
The values presented in Tables A1–A3 corresponds to the wind velocity values U0 of 1, 3 and 5 m s−1, respectively. In order to reduce uncertainty, three measurements (M1, M2 and M3) were performed for each set of parameters during 30 s for each position.
|
|
|


 for experiments at three reference lines (lines a, b and c).
 values for each reference line a, b or c as a function of the non-dimensional distance S′, together with the average ROS
  values. The fire fronts distance is d = 2 m. (a) U0 = 0 m s−1; (b) U0 = 2 m s−1; (c) U0 = 5 m s−1.
 with the 95% confidence intervals are shown in each case. (a) U = 0 m s−1; (b) U = 1 m s−1; (c) U = 2 m s−1; (d) U = 3 m s−1; (e) U = 4 m s−1 and (f) U = 5 m s−1.
 values of three replications performed and two distances d = 1and 2 m as a function of the wind flow velocity U0 (0–5 m s−1). The black curve represents the predicted
  as function of the wind flow velocity (U0) defined by
  , the s.d.
 values of three replications performed and two distances d = 1and 2 m as a function of the Froude number (Fr). The black curve represents the predicted
  as function of the Froude number defined by
  , the s.d.
