Development of gas signatures of smouldering peat wildfire from emission factors
Yuqi Hu A B and Guillermo Rein B *
B *
A Sichuan Fire Research Institution, Ministry of Emergency Management of China, Chengdu, 610036, China.
B Department of Mechanical Engineering, and Leverhulme Centre for Wildfires, Environment and Society, Imperial College London, SW7 2AZ, UK.
International Journal of Wildland Fire 31(11) 1014-1032 https://doi.org/10.1071/WF21093
Submitted: 21 July 2021 Accepted: 23 September 2022 Published: 9 November 2022
© 2022 The Author(s) (or their employer(s)). Published by CSIRO Publishing on behalf of IAWF. This is an open access article distributed under the Creative Commons Attribution 4.0 International License (CC BY).
Abstract
Smouldering peat fires are responsible for regional haze episodes and cause environmental, social and health crises. Owing to the unique burning characteristics of smouldering peat, identifying and detecting this kind of fire remains a challenge. This work explores smouldering peat gas signatures using emission factor (EF) data from literature. Systematic comparisons and statistical analyses were carried out to investigate 28 forms of EF combinations created from the four most abundant gas species: carbon dioxide (CO2), methane (CH4), carbon monoxide (CO) and ammonia, from smouldering peat, flaming savanna and grassland, agricultural residue and forest fires. Among the candidate gas signatures, the ratio of EF(CO2) to EF(CH4) for smouldering peat showed a significant improvement with statistically different ranges of values (134.6) compared to those from flaming savanna and grassland fire (940.2), agricultural residue fire (434.4 ), forest fire (368.8) and mixed burning peat fires (207.7). Additionally, we found that EF(CO2)/EF(CH4) is independent from fuel composition and could differentiate early ignition from the subsequent spread, making it the best gas signature among those analysed, including CO/CO2 ratio and the Modified Combustion Efficiency. This work presents the first scientific endeavour developing smouldering gas signatures, contributing to the scientific understanding and remote sensing and early detection of smouldering peat wildfires.
Keywords: detection, emissions, fire, haze, mitigation, peatland, smouldering, wildfire.
Introduction
Peatlands1 are the most widespread of all wetland types in the world, covering ~3% of the Earth’s land surface (Yu 2012). They are formed in water-saturated environments and are usually of high moisture contents2 (up to 300%) which serve as natural fire barriers (Turetsky et al. 2015). Natural droughts (e.g. El Niño) and human activities (e.g. agricultural drainage and peat harvesting) lower the water table in peatlands (Turetsky et al. 2015) and reduce the moisture content in peat (Kettridge et al. 2015), rendering them more vulnerable to fire. Uniquely, peat fire is dominated by smouldering combustion, a slow, low-temperature and flameless burning mode that differs from flaming combustion in terms of chemistry and heat transfer (Rein 2016). Smouldering combustion is sustained by the heat released when oxygen directly attacks the surface of a solid fuel, whereas flaming combustion dominates when the oxidation takes place in the gas phase (Rein 2016). As a result, smouldering peat spreads and produces fundamentally different emissions from flaming wildfires (for example, grass and savanna fires) observed on the Earth. Flaming forest fires occurring across the continents (for example, in California (Fig. 1)) typically show strongly buoyant smoke plumes of dark colour, and flames spreading above the ground with high temperatures (~1500°C) for short periods of time (in the order of minutes) (Rein 2013).

|
In contrast, smouldering peat fires are frequently observed in tropical, temperate and boreal regions across the globe, and are characterised by weakly buoyant smoke plumes with a light colour that accumulate near the ground (Wiggins et al. 2018). These fires have a lower peak temperature (in the range of 450–700°C) and propagate both horizontally and vertically, spreading in a creeping fashion (typically two orders of magnitude slower than flaming fire spread) that can last weeks or even months (Rein 2013; Wiggins et al. 2018). In the presence of a large quantity of peat, a smouldering fire can be initiated with a weak ignition source and sustained for very long periods of time despite fire-fighting attempts, extensive rains or weather changes (Rein 2013). For example, in Indonesia, where slash and burn, a traditional farming method in which natural vegetation is cut down and burned, is widely used for clearing the land for palm plantations or agriculture (Cochrane 2003). Heat generated from these flames ignites the peat underneath, initiating long-lasting and persistent smouldering fires (Rein 2013; Kettridge et al. 2015).
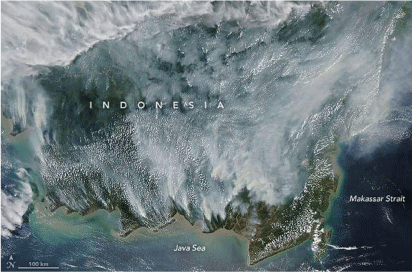
Emissions from smouldering peat fires, the largest fires on Earth in terms of fuel consumption, are an important contributor of atmospheric carbon that drives climate change (Rein 2013). For example, it is estimated that the 1997 Indonesian peatland fires emitted 0.81–2.57 Gt carbon, equivalent to 13–40% of mean annual global carbon emissions from fossil fuels (Page et al. 2002). Peat fires are also the dominant source of aerosols, causing regional haze episodes especially under dry weather (Wiggins et al. 2018). Haze is the large-scale atmospheric accumulation of peat fire smoke at low altitudes (Fig. 2) (Hu et al. 2018a). Driven by wind, these emissions can migrate long distances and evolve into transboundary haze episodes. Haze is notorious for inducing surges of health emergencies among local populations, disrupting shipping and aviation routes for weeks or even months, and posing a major threat to public health and property. Among the regions suffering from haze, Southeast Asian countries frequently experience exceptional haze in response to fire season fuelled by El Niño-induced drought (Smith et al. 2018; Wiggins et al. 2018). For example, more than 28 000 000 people in Indonesia were affected by the Southeast Asian Haze event in 2015, from which more than 140 000 people reported respiratory illness (Hu et al. 2018a). It is estimated that this haze event led to economic losses of up to US$35 billion. Despite the severe effects of haze on people’s health and property, it remains an unresolved environmental and health crisis and could evolve into regional disputes (Forsyth 2014).
|
Understanding the emission characteristics of peat burning can contribute to developing successful regional peat fire technologies (Rein 2016). Emission factor (EF), defined as the mass of species emitted per mass of dry fuel consumed (expressed as g kg−1), is widely used in atmospheric chemistry modelling to quantify fire emissions and understand their influence on the atmosphere and climate change (Hu et al. 2018a). Several EFs derived from both laboratory peat fire experiments, for example, in Christian et al. (2003), Stockwell et al. (2016) and Hu et al. (2018b, 2019) and field measurements from Huijnen et al. (2016), Stockwell et al. (2016), Smith et al. (2018) and Wooster et al. (2018) with diverse peat origins and burning conditions were reported in recent decades. Compilations of the EFs of the various gas species from Andreae and Merlet (2001) and Akagi et al. (2011) to the most recent of Hu et al. (2018a) and Andreae (2019) have greatly expanded the amount of available data for emission inventory and furthered the scientific understanding of pollution from biomass fires.
Peat fires are monitored routinely across the globe with remote sensing technologies (e.g. satellite-based active fire observation) that were developed for flaming fires, and thus could be ineffective to detect smouldering peat fires due to their lower temperature and underground burning characteristics (Rein 2013; Wooster et al. 2018; Christensen et al. 2019; Sofan et al. 2019). Being an important layer of wildfire protection of ecosystems, early detection of smouldering fires is critical in tackling peatland degradation and has attracted research interest to develop specific detection methods for smouldering. For example, there are studies investigating the feasibility using infrared cameras in drones to detect smouldering (Burke et al. 2019). In addition, particulate matter and levoglucosan were proposed as potential precursors and tracers of smouldering fires of wood and cotton (Madsen et al. 2018; Bluvshtein et al. 2020). Modified combustion efficiency (MCE), a signature for determining the importance of flaming or smouldering in a fire, is widely adopted in the literature to classify the combustion regimes of biomass burning (Christian et al. 2003; Akagi et al. 2011; Stockwell et al. 2014, 2016; Smith et al. 2018), but the validity of using MCE in differentiating smouldering peat remains incomplete (Hu et al. 2018a, 2019). In wildland, vegetation is commonly mixed. The co-existence of smouldering and flaming fires and the complex wildland environment pose a challenge of these signatures for fire identification.
In the present study, we study possible gas signatures for early detection of smouldering peat fire and differentiating this type of fire from flaming and the burning of the other wildfire fuels including grassland, forest and agricultural residue. This work consists of systematic exploration and statistical analysis of multiple combinations of gaseous species’ EFs collected from the literature.
Methods
Emission factor dataset
To develop gas signatures for smouldering peat, a dataset of EFs of gaseous species from the four biomass fires (peat, savanna and grassland, forest and agricultural residue fires) was first built. When selecting the species included in the dataset, three criteria were considered: (I) the magnitude of the species in terms of EFs; (II) the amount of the species’ EF data available in the literature; and (III) the difficulty of measuring the species. There are more than 100 trace gas species present in peat fire smoke plumes (Stockwell et al. 2015; Hu et al. 2018a). Among all the species detected and reported in the literature, carbon dioxide (CO2), carbon monoxide (CO) and methane (CH4) are the three most abundant gas species with EFs commonly larger than 10.0 g kg−1 (Stockwell et al. 2016; Hu et al. 2018b). Hu et al. (2019) found that the EFs of ammonia (NH3) from smouldering peat were 10–20 times larger than those from flaming biomass, making it an important gas species for smouldering fires. In contrast, the majority of the other species from peat fires are nitric oxide (NO as NOx), nitrogen dioxide (NO2), hydrogen cyanide (HCN), sulfur dioxide (SO2) and the non-methane organic compounds (NMOCs) which commonly have trace levels of EF-values (<1.0 g kg−1) with vast uncertainty and inter-study variability (Akagi et al. 2011; Andreae 2019). Furthermore, studies which measured and reported EF data for those trace gas species are very limited (n < 10), resulting in an insufficient amount of data for statistical analysis. In terms of measurement difficulty, CO2, CO, CH4 and NH3 can be measured more accurately and feasibly than the NMOCs in most biomass fire emission studies (Stockwell et al. 2014, 2016; Hu et al. 2018b; Smith et al. 2018). As a result, the EFs of CO2, CO, CH4 and NH3 were selected for inclusion in the dataset.
The EF data of CO2, CO, CH4 and NH3 from savanna and grassland, forest and agricultural residue fires were adopted directly from an updated compilation of EFs from Andreae (2019) which collected EFs from over 370 studies on various types of biomass burning. The EFs in the peat fire category were a combination from the peat fire EF compilation from Andreae (2019), a review on peat fire EFs (Hu et al. 2018a) and recent laboratory peat fire emission experiments (Hu et al. 2018b; Hu et al. 2019), jointly forming the most comprehensive up-to-date EFs dataset for peat fire.
In the literature, a carbon balance approach is widely used, especially in field measurements, to calculate EFi,c from biomass burning (Stockwell et al. 2016; Smith et al. 2018). This method entails the value of the fuel carbon content and assumes all carbon-containing emissions are measured (Eqn 1):

where EFi,c is the emission factor of species i calculated from the carbon balance approach (g kg−1), Fc is the carbon content of the fuel (%), MMi is the molar mass of species i (g mol−1), MMc is the atomic mass of carbon (12 g mol−1), Ci is the number of moles of species i and CT is the total number of moles of carbon emitted.
For experiments conducted in laboratories where the mass loss of peat sample can be measured, a mass loss approach is commonly used to calculate EFi,m (Eqn 2) (Rein et al. 2009; Hu et al. 2019):

where EFi,m is the emission factor of species i calculated from the mass loss approach (g kg−1),  is the mass flux of the released species i (g s−1 m−2) and
  is the mass loss rate (fuel consumption rate) of dry peat (g s−1 m−2).
In the compiled EF dataset, 20 independent peat fire studies that reported fire-averaged EFs were included, while 50, 39 and 85 studies were included for savanna and grassland, agricultural residue and forest fires, respectively. In total, 566 EF data of CO2, CO, CH4 and NH3 derived from these four fire fuels originated across tropical, temperate and boreal regions are included in the dataset. Those EFs are either from laboratory experiments or field measurements, which are mutually complementary and are equally important in terms of understanding of accidental wildfires (Christensen et al. 2019). Furthermore, both a carbon balance approach and a mass loss approach for calculating the EFs have been mutually verified in Hu et al. (2018b), thus all the EFi,c and EFi,m data collected from the literature were included in the dataset indiscriminately.
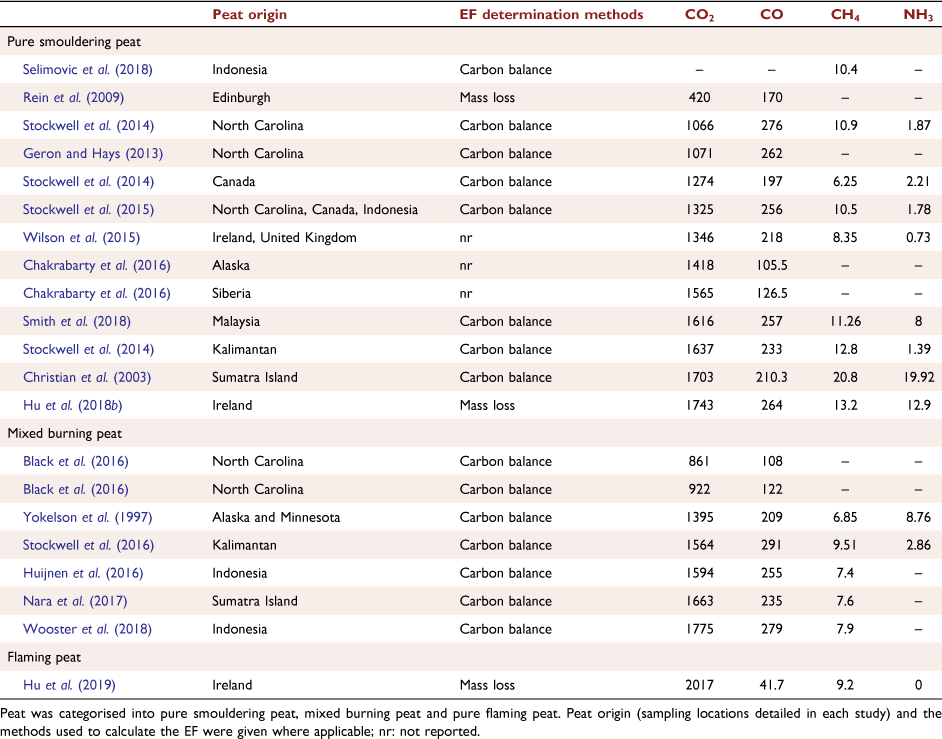
In some peat fire emission studies, a mixed burning of smouldering and flaming peat was observed in both laboratory experiments and field measurements (Huijnen et al. 2016; Stockwell et al. 2016; Hu et al. 2019). To distinguish pure smouldering peat, two sub-categories (mixed burning (n = 7) and pure smouldering (n = 13)) were defined and classified in the peat fire group for comparison purposes. Table 1 provides the categorised EFs of peat fires from the literature as well as the information of how these data were obtained. The information of the EFs from savanna and grassland, agricultural residue and forest fires were included and detailed in Andreae (2019) and the literature cited therein, and thus are not shown in this study.
|
EF comparisons and statistical analysis
Based on the EF dataset, four forms of EF combinations are proposed for systematic comparisons among biomass fires: (I) X (X refers to an individual chemical species (for example, CO2)); (II) X/Y (Y refers to another single chemical species (for example, CO2/CO)); (III) X/(X + Y) (for example, CO2/(CO2 + CO)); and (IV) (Z × Y)/(X × X) (Z refers to a third chemical species different from X and Y. For example, (CO × CH4)/(CO2 × CO2)).
The rationale of proposing these four formats of EF combinations are described as follows: for (I), individual EF of these four gas species has been complied in multiple review papers (for example, in Andreae (2019), Andreae and Merlet (2001) and Akagi et al. (2011)) but has not been compared statistically across fire types; for (II), the format of EF combinations was inspired by an important signature used in combustion, the CO to CO2 ratio (CO/CO2), which is regarded as an index of combustion incompleteness (Rein et al. 2009; Rein 2016); for (III), the format of EF combinations was inspired by the MCE whose calculation is built on the excess mole fractions of CO2 and CO (Ward and Radke 1993) (Eqn 3):

where Δ[CO2] and Δ[CO] are the excess mole fractions of CO2 and CO, respectively.
For (IV), flaming wildfire exhibits larger EF-values for CO2 (a complete combustion product) but smaller values for CO, CH4 and NH3 (typical incomplete combustion products) than those from smouldering peat fire (Akagi et al. 2011; Rein 2016; Andreae 2019). Inspired by this existing difference in terms of the species’ properties, EF combination (IV) was introduced to magnify the EF difference between complete and incomplete species. Because CO2 is the only complete combustion product among the four gas species selected, as such only CO2 was used for ‘X’ in EF combination (III) and (IV).
To conduct a systematic statistical comparison of the EF combinations, the reciprocal functions of types (II) to (IV) were included, resulting in a total number of 28 combinations of inter-category EFs with their expressions shown in Table 2. It is worth noting that even just for CO2, CO, CH4 and NH3, the forms and quantities of EF combinations can be endless. This work focuses on the four main types of EF combinations which have the advantage of simplicity in terms of expression forms and representativeness of biomass combustion characteristics.

|
Independent sample t-tests were conducted to statistically examine: (i) whether EFs from pure smouldering peat were significantly different from those of mixed burning peat and (ii) whether EFs from the combined ‘peat fire’ group (a combination of mixed burning peat and smouldering peat) were significantly different from the other three types of biomass fires included in this work. Briefly, t-test is a type of inferential statistics used to determine a significant difference between the means of two independent groups. It examines the null hypothesis (H0): all individual batch means are equal (µ1 = µ2) (Ellison et al. 2009). Specifically, five t-tests (two-tailed) with a significance/alpha level (a, the probability of making the wrong decision when H0 is true) of 0.05 (a = 0.05) were carried out with t-values and P-values calculated and reported for all EF combinations types (I) to (IV): (i) peat fire vs savanna and grassland fire; (ii) peat fire vs agricultural residue fire; (iii) peat fire vs forest fire; (iv) peat fire vs the combined ‘biomass fire’ group (a combination of savanna and grassland, forest and agricultural residue fires, excluding peat fire data); and (v) mixed burning peat vs pure smouldering peat.
Calculating t-values entails the average EF, the variance and the number of samples within each of the two compared groups. Overall, a t-value measures the size of the difference relative to the variation in the sample data (calculated difference represented in units of standard error) (Ellison et al. 2009). Generally, the larger the t-value is, the higher chance that no relationship exists between/among measured groups. The P-value is a measure of the probability that an observed difference could have occurred just by random chance. The P-value being less than the significance level (in this work, 0.05) means that the result is significant and therefore, the null hypothesis H0 can be rejected since the probability of H0 being true is very low (Ellison et al. 2009). In other words, P < 0.05 indicates a significant difference between the two compared fire categories. In this work, statistical analysis tool ‘QuickCalcs’ from GraphPad Software Inc. (2022) was used for calculating P-values from t-tests.
In addition, one-way analysis of variance (ANOVA) with a significance level of 0.05 was conducted among fire categories. ANOVA is a collection of methods for comparing multiple means across different groups, it examines the following hypotheses. The null hypothesis (H0): all individual batch means are equal (µ1 = µ2 = …µk); and the alternative hypothesis (Ha): at least one batch mean is not equal to the others. The results of ANOVA determine whether there is any significant difference between the means of three or more independent groups (Ellison et al. 2009). An ANOVA test computes a test statistic, the F-value, which is a ratio of variability between groups and variability within groups. The larger the F-value is, the higher chance that no relationship exists among measured groups. Similar to t-tests, in ANOVA test, P-value being smaller than the significance level (0.05 in this work) means that H0 can be rejected. In other words, P < 0.05 indicates that at least one fire category shows a significant difference in terms of the compared signature among the compared fire categories. ‘QuickCalcs’ (GraphPad Software Inc. 2022) was used for the determination of P-values, F-value and degrees of freedom (DF) between groups and within groups from ANOVA tests conducted in this work.
Results and discussion
Individual gas species
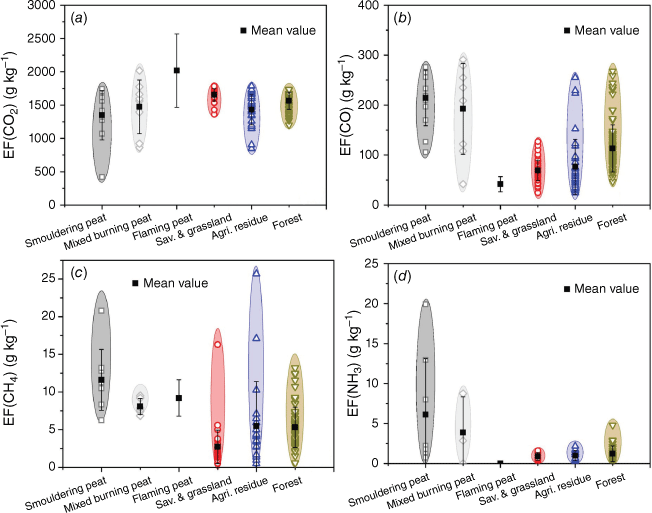
Individual gas species (CO2, CO, CH4 and NH3) were first compared among peat, savanna and grassland, agricultural residue and forest fires, forming an overview of the distribution, value range, variability and the mean values of the EFs (Fig. 3). To differentiate smouldering from mixed burning, the peat fire group was divided into three individual sub-groups: pure smouldering, mixed burning and a pure flaming groups. To the best knowledge of the authors, only one source of pure flaming peat EF data is available in the literature (Hu et al. 2019), and thus is included for comparison purposes.
The EFs of CO2, CO, CH4 and NH3 showed large variability for all fire types. To quantify the inter-fire EF differences, the number of data available (n), mean value and standard deviation (s.d.) of the EFs from the literature are summarised in Table 3. Averagely, peat fire exhibits a ~10% lower mean value of CO2 EF (1398.8 ± 378.3 g kg−1) and 123, 129 and 410% higher mean values of EFs of CO (205.8 ± 70.6 g kg−1), CH4 (10.2 ± 3.6 g kg−1) and NH3 (5.50 ± 6.29 g kg−1) than the other types of ‘biomass fires’ (the combined dataset of savanna and grassland, forest and agricultural residue fires), respectively. Within the peat fire category, the pure smouldering group showed an 8.5% lower CO2 EF but 11.4%, 43.6% and 57.8% higher EFs for CO, CH4 and NH3 from mixed burning peat, respectively. These findings correspond with the fact that peat fire is dominated by smouldering, which yields more incomplete combustion species than from flaming fires (Rein 2016). The only flaming peat EF data (Hu et al. 2019), on the other hand, showed a significantly higher EF of CO2 (56.2%) and lower EF of CO (80.0%), CH4 (20.6%) and NH3 (~100%)3 than those from smouldering peat. More studies on flaming peat are needed to improve understanding of the performance and influence of its EF data.

|
Table 4 summarises the statistical analysis results of the individual EF. CO2 showed a significantly different EF from peat fire (n = 20) than from savanna and grassland fire (n = 31) (P = 0.0045). However, the EF(CO2) did not differ between smouldering peat (n = 12) and mixed burning peat (n = 8) with P = 0.4905. Furthermore, CO2 did not differentiate peat fire from either forest fire or agricultural residue fire (P > 0.05). Compared with CO2, CO performed well in distinguishing peat fire from all the other biomass fire types with P < 0.0001. However, EF(CO) did not differ between smouldering peat (n = 12) and mixed burning peat (n = 8) (P = 0.5480). In contrast, CH4, a gas species with exceptionally high EF from fire compared to natural decomposition of biomass (Akagi et al. 2011; Turetsky et al. 2015), showed outstanding performance in distinguishing the following fire categories: pure smouldering peat (n = 9) from mixed burning peat (n = 6) (P = 0.027); the combination of peat fire (n = 15) from savanna and grassland fire (n = 49) (P < 0.0001), from forest fire (n = 73) (P < 0.0001), from agricultural residue fire (n = 21) (P = 0.0057) and from the other ‘biomass fire’ (n = 143) (P < 0.0001). NH3, a species found to be uniquely high from smouldering peat (Hu et al. 2018b; Hu et al. 2019), showed a significantly different EF from peat fire than from the other biomass fires (P < 0.05). Similar to CO, NH3 failed to differ smouldering peat (n = 8) from mixed burning peat (n = 3) (P = 0.5479), possibly due to its large EF variability within and between the two peat fire groups (Hu et al. 2018a; Smith et al. 2018). The P-values from the ANOVA tests were below 0.0001 for all four gas species, indicating that at least one type of fire (not necessarily peat fire) had a significantly different EF to the other fires.

|
There was significant variability of the EF of individual species within each fire type (Fig. 3). Individual gas species like CH4 showed ideal performance in differentiating pure smouldering peat from mixed burning peat and the other biomass fires. However, natural variability of the physical properties of the fuels (e.g. compositions, density and moisture content) can greatly affect the values of EFs reported in each study (for example, peats with higher carbon/nitrogen content have higher EFs values for carbonaceous/nitrogenous species) (Stockwell et al. 2016; Hu et al. 2018a; Smith et al. 2018). Furthermore, the wildland fuel map is randomly inhomogeneous and localised transient fire emissions are subjected to complex topography and changing weather (e.g. rainfall and wind) (Smith et al. 2018). As a result, large uncertainty can be introduced when using a single species in determining the types of wildland fires, thus individual species are not recommended as smouldering signatures.
EF ratio between two chemical species
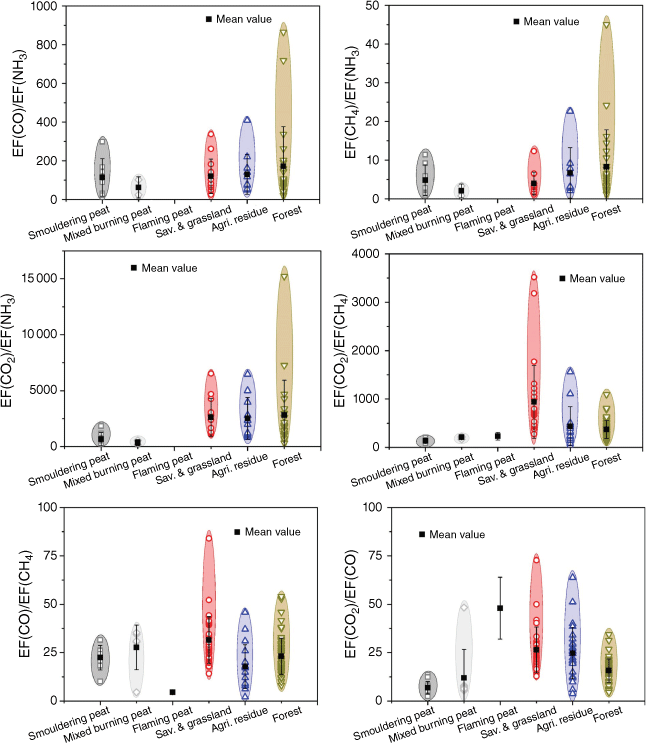
Dividing one chemical species by another, a dimensionless EF ratio (EF combination type (II)) is proposed. In this subsection, a total number of 12 EF ratios – EF(CO)/EF(NH3), EF(CH4)/EF(NH3), EF(CO)/EF(CH4), EF(CO2)/EF(NH3), EF(CO2)/EF(CH4), EF(CO2)/EF(CO) and their corresponding reciprocals – were generated, calculated and compared using the EF data from the literature. Fig. 4 shows the original six EF ratios. Qualitatively, the value ranges of EF(CO)/EF(NH3), EF(CH4)/EF(NH3) and EF(CO)/EF(CH4) from peat fire largely overlapped with savanna and grassland fire, agricultural residue fire and forest fire, while EF(CO2)/EF(NH3), EF(CO2)/EF(CH4) and EF(CO2)/EF(CO) from peat fire presented distinct value ranges.
The reciprocals of these six original EF ratios are shown in Fig. 5. Differing from the distribution of the original EF ratios, only the ranges of EF(NH3)/EF(CO2) and EF(CO)/EF(CO2) from peat fire differed significantly among the other fires. Statistical analysis was used to further investigate the performance of the proposed EF ratios.

|
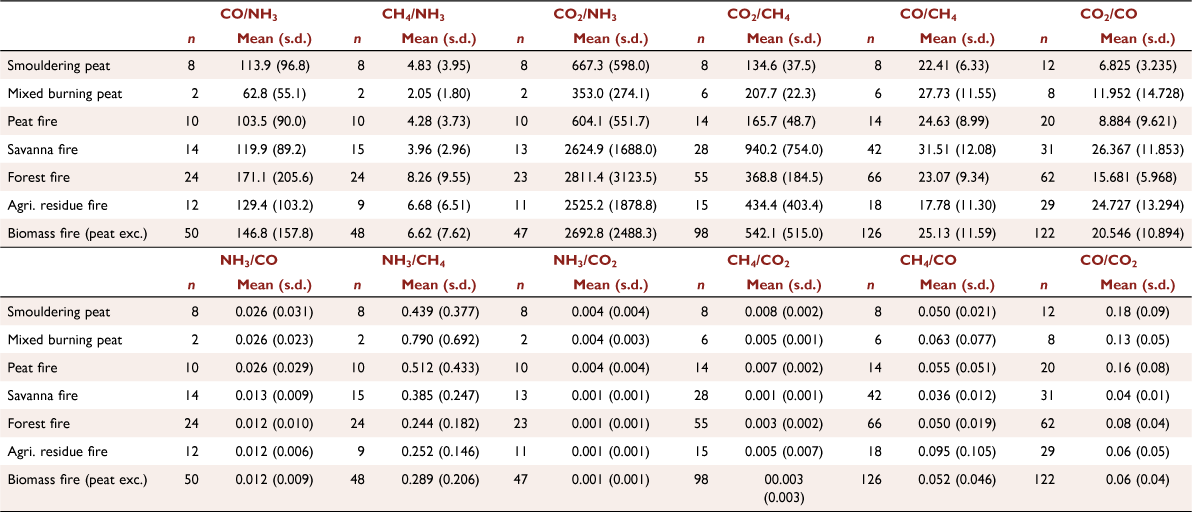
Table 5 summarises the number of data available, the mean value and the s.d. of 12 EF ratios from each fire category. Compared with the combination of all biomass fires (peat fire excluded) listed in this paper, all six original EF ratios from peat fire showed lower mean values: the percentage difference of mean values ranged from 2.01% (EF(CO)/EF(CH4)) to 126.71% (EF(CO2)/EF(NH3)). Six corresponding reciprocals of the EF ratios had higher mean values for peat fire than those for the other biomass fires, with percentage differences ranging from 5.61% (EF(CH4)/EF(CO)) to 120.0% (EF(NH3)/EF(CO2)).
|
When comparing peat fire with savanna fire, forest fire and agricultural residue fire, the mean values from peat fire were the smallest for EF(CO)/EF(NH3), EF(CO2)/EF(NH3), EF(CO2)/EF(CH4) and EF(CO2)/EF(CO). Peat fire had a larger mean value of EF(CH4)/EF(NH3) (4.28 ± 3.73) than for savanna fire (3.96 ± 2.96). The average of EF(CO)/EF(CH4) from peat fire (24.63 ± 8.99) was larger than those from forest fire (23.07 ± 9.34) and agricultural residue fire (17.78 ± 11.30), while the mean value of its reciprocal, EF(CH4)/EF(CO) (0.055 ± 0.051), was smaller than from agricultural residue fire (0.095 ± 0.105). The mean values of EF(NH3)/EF(CO), EF(NH3)/EF(CH4), EF(NH3)/EF(CO2), EF(CH4)/EF(CO2) and EF(CO)/EF(CO2) from peat fire were the largest among all fire types in this study.
Within the peat fire category, the mean values of EF(CO)/EF(NH3), EF(CH4)/EF(NH3) and EF(CO2)/EF(NH3) from the pure smouldering group exceeded those from the mixed burning group with percentage differences of 57.8%, 80.8% and 61.6%, respectively. In contrast, the reciprocals of EF(CO)/EF(NH3) and EF(CO2)/EF(NH3) showed equal mean values between the pure smouldering and mixed burning groups. It is worth noting that the amount of NH3 data available for mixed burning peat was limited (n = 3), and more experimental studies are needed to understand the rationale of NH3 emissions (Rein 2016; Hu et al. 2019).
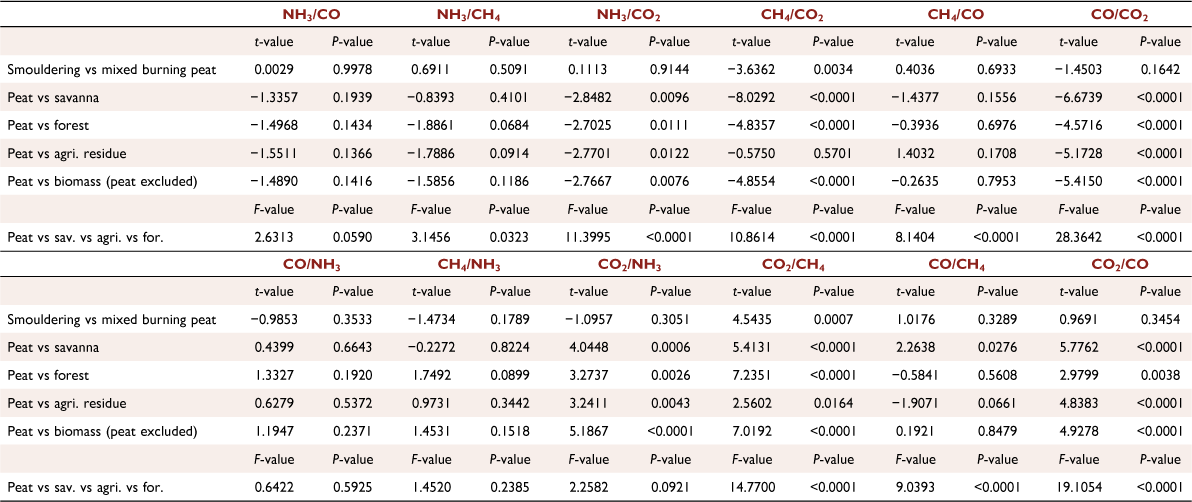
Table 6 summarises the results of the statistical analysis of the EF ratios. EF(CO)/EF(NH3), EF(CH4)/EF(NH3), EF(CO)/EF(CH4) and their three reciprocals, all failed to differentiate peat fire from the biomass fire group (peat excluded), as well as smouldering peat from mixed burning peat, with P > 0.1. EF(CO2)/EF(NH3), EF(CO2)/EF(CO) and their two reciprocals performed well in distinguishing peat fire from savanna fire, forest fire, agricultural residue fire or their combinations, with P < 0.05. These four signatures failed to show significantly different EF ratio values between smouldering peat and mixed burning peat (P > 0.1). However, EF(CH4)/EF(CO2) differentiated well between smouldering peat and mixed burning peat (P = 0.0034), and between peat fire and savanna fire (P < 0.001) and forest fire (P < 0.001), but failed to differentiate peat fire from agricultural residue fire (P = 0.5701).
|
Differing from the other EF ratios analysed above, EF(CO2)/EF(CH4) showed outstanding performance in differentiating smouldering (n = 8) from mixed burning (n = 6), with P = 0.0007. It distinguished peat fire (n = 14) well from savanna fire (n = 28) with P < 0.0001, from forest fire (n = 55) with P < 0.0001, from agricultural residue fire (n = 15) with P = 0.0164 and from the combination of all the other biomass fires (n = 98) with P < 0.0001, making it a promising gas signature for smouldering peat.
The EF ratio between two gaseous species leaves out the carbon content of the fuel, which is integral in the calculation of individual EF using the carbon balance approach detailed in Eqn 1, thus overcoming the limitation in terms of heterogeneous fuel properties (Hu et al. 2019). This advantage gives the EF ratio, particularly EF(CO2)/EF(CH4), a wide application as an effective gas signature in the wildland environment.
Modified EF ratios
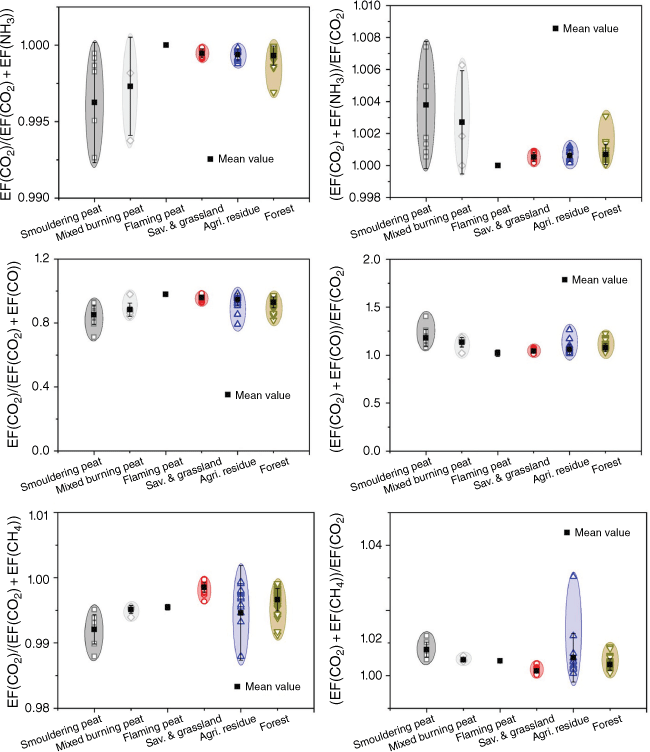
Following the expression form of the MCE, EF(CO2)/(EF(CO2) + EF(CO)) and its reciprocal were firstly proposed and examined. Replacing CO with CH4 and NH3, the two important gas species from smouldering peat (Akagi et al. 2011; Hu et al. 2018b), EF(CO2)/(EF(CO2) + EF(CH4)) and EF(CO2)/(EF(CO2) + EF(NH3)) were introduced. Together with their corresponding reciprocals, the values from the six forms of modified EF ratios were compared and are shown in Fig. 6. In general, peat fire groups showed distinct value ranges of the six signatures compared to those from savanna and grassland fire, agricultural residue fire and forest fire. Differing from EF(CO2)/(EF(CO2) + EF(CO)) and EF(CO2)/(EF(CO2) + EF(CH4)), which showed small variability, EF(CO2)/(EF(CO2) + EF(NH3)) and its reciprocal exhibited significant variability for the ratio values within the peat fire group. This was possibly because the EF of NH3 differed greatly among peat fire studies, with range 0.73–19.92 g kg−1 (Smith et al. 2018; Hu et al. 2019). Large variability was observed for EF(CO2)/(EF(CO2) + EF(CH4)) from agricultural residue fires.
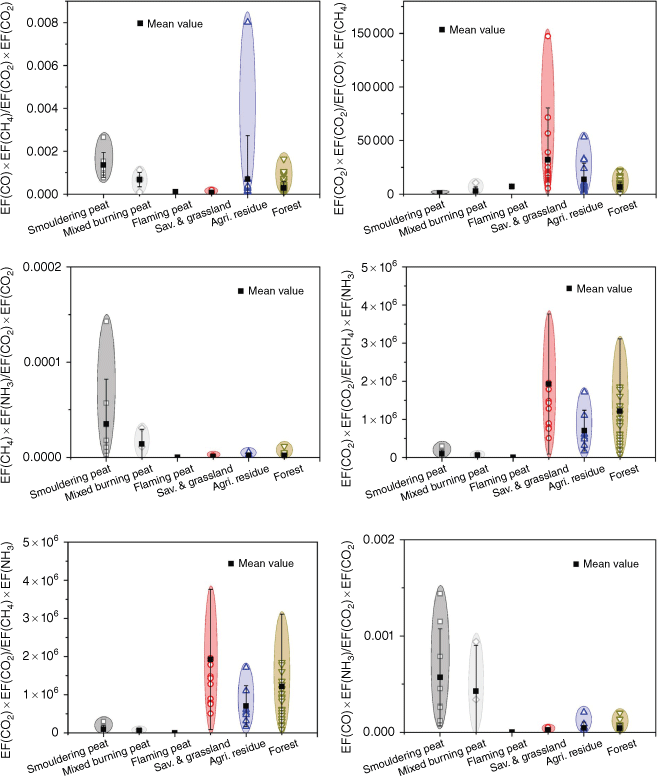
The performance of the six modified EF ratios from EF combinations (IV) differentiating fire types was examined and is shown in Fig. 7. The peat fire group showed value ranges distinct from those from savanna and grassland fire, agricultural residue fire and forest fire. Significant variability was observed for (EF(CH4) × EF(NH3))/(EF(CO2) × EF(CO2)) and (EF(CO) × EF(NH3))/(EF(CO2) × EF(CO2)) ratio values from peat fire. In contrast, when NH3 was used as part of the denominator, the range of the ratio values of (EF(CO2) × EF(CO2))/(EF(CH4) × EF(NH3)) and (EF(CO2) × EF(CO2))/(EF(CO) × EF(NH3)) decreased. This was possibly due to the higher degree of EF variability for NH3 among peat fire studies (the maximum EF(NH3) reported in the literature is ~27 times higher than the minimum EF(NH3), while for CO2, CO and CH4, the multiple difference between the maximum and minimum values in terms of the EFs are 4.0, 2.7 and 3.3, respectively) (Hu et al. 2019).
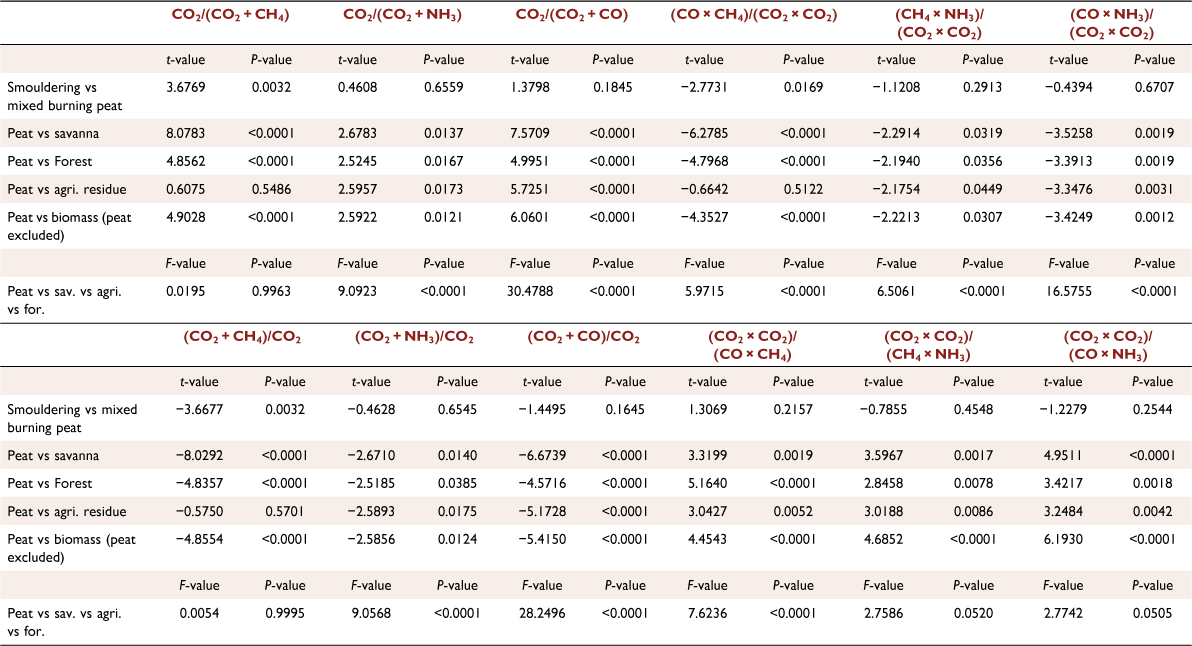
Table 7 summarises the mean values and s.d. from the 12 signatures (six EF ratios from EF combination type (III) and (IV), respectively). For six EF ratios from combination type (III), EF(CO2)/(EF(CO2) + EF(NH3)) and its reciprocal showed the same mean values (0.999 and 1.001, respectively) among savanna and grassland fire, agricultural residue fire and forest fire, while the values from peat fire differed between groups. This is because the EF(NH3) is 2–3 orders of magnitude smaller than for EF(CO2) (Akagi et al. 2011; Andreae 2019). For EF(CO2)/(EF(CO2) + EF(CO)), the mean value from the peat fire group (0.865) was the lowest among all fire groups and presented a ~8% smaller value than the combined biomass dataset of savanna fire, forest fire and agricultural residue fire. Within the peat fire group, the ratio mean values of EF(CO2)/(EF(CO2) + EF(NH3)), EF(CO2)/(EF(CO2) + EF(CH4)) and EF(CO2)/(EF(CO2) + EF(CO)) from pure smouldering peat were slightly smaller (~1.0–3.5%) than those from mixed burning peat.

|
For EF combination type (IV), the mean values of (EF(CO) × EF(CH4))/(EF(CO2) × EF(CO2)), (EF(NH3) × EF(CH4))/(EF(CO2) × EF(CO2)) and (EF(CO) × EF(NH3))/(EF(CO2) × EF(CO2)) from the peat fire group were at least one order of magnitude higher, while the reciprocals of these three EF ratios were at least one order of magnitude lower than those from the biomass fire group (peat excluded). Within the peat fire group, (EF(CO) × EF(CH4))/(EF(CO2) × EF(CO2)) and its reciprocal showed significantly different mean values (by one order of magnitude) between pure smouldering and mixed burning peat.
Table 8 summarises the performance of the 12 modified EF ratios. For EF combination type (III), EF(CO2)/(EF(CO2) + EF(CO)) and EF(CO2)/(EF(CO2) + EF(NH3)) showed significantly different ratio values from peat fire than those from the other biomass fires analysed (P < 0.05). However, these EF ratios failed to differentiate smouldering peat from mixed burning peat, with P > 0.5. In addition, EF(CO2)/(EF(CO2) + EF(CH4)) and its reciprocal differed between smouldering and mixed burning peat (P = 0.0032) but failed to distinguish between peat fire and agricultural residue fire, with P > 0.5.
|
For EF combination type (IV), (EF(CO) × EF(CH4))/(EF(CO2) × EF(CO2)) showed significantly different ratios between pure smouldering peat and mixed burning peat (P = 0.0169); however, it failed to differentiate peat fire from agricultural residue fire (P = 0.5122). The other five EF modified ratios performed well in distinguishing between peat fire and savanna and grassland fire, agricultural residue fire and forest fire (P < 0.05). Nevertheless, no significant difference was found between smouldering peat and mixed burning peat, with P > 0.05. As a result, EF ratios included in EF combination type (IV) are not recommended as smouldering peat signatures.
EF combinations for early identification of smouldering peat
As showed above, EF combinations like EF(CO2)/EF(CH4), EF(CO2)/(EF(CO2) + EF(CO)) and EF(CO2)/EF(CO) showed decent performance in distinguishing peat fires from the other types of biomass fires, while EF(CO2)/EF(CH4) was the only signature showing a significant difference between smouldering peat fire and mixed burning peat. This section further investigated the potentiality of proposed signatures for early identification of smouldering peat.
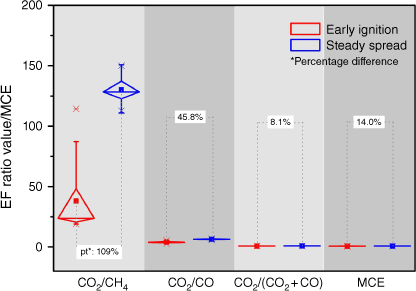
Fig. 8 shows the value ranges of EF(CO2)/EF(CH4), EF(CO2)/(EF(CO2) + EF(CO)), EF(CO2)/EF(CO) and the widely-adopted signature MCE, from an early ignition and a steady spread stage of smouldering peat. The segmented data are from Hu et al. (2018b), who experimentally measured transient emissions of smouldering peat. The mean value of EF(CO2)/EF(CH4) from the early fire ignition was 38.1 ± 26.7, while fire spreading had an average ratio of 130.0 ± 9.5, which lies within the inter-study ratio range (134.6 ± 37.5) of EF(CO2)/EF(CH4) shown in Table 4. The percentage difference between the early ignition and fire spreading reached 109%. In contrast, the mean values for the early ignition and spreading for EF(CO2)/EF(CO) were 4.0 ± 0.7 and 6.4 ± 0.3, respectively (percentage difference 45.8%), while for EF(CO2)/(EF(CO2) + EF(CO)), the mean values were 0.8 ± 0.03 and 0.9 ± 0.01, respectively (percentage difference 8.1%). For MCE, as reported in Hu et al. (2018b), the values ranged from 0.68 ± 0.04 (early ignition) to 0.79 ± 0.01 (steady spread), with a percentage difference of 14.0%. This comparison result indicates that EF(CO2)/EF(CH4) is the most promising signature in detecting early fire with its largest difference in ratio ranges to the subsequent fire spreading.
|
One possible reason for the superior performance of EF(CO2)/EF(CH4) in distinguishing early fire from fire spreading is that CO2 and CH4 show distinct transient emission evolution. In contrast, CO2 and CO which are included in EF(CO2)/(EF(CO2) + EF(CO)), EF(CO2)/EF(CO) and the MCE have similar emission trends. Specifically, heat from the early ignition generates pyrolysis fronts which release alkane species like CH4 from thermal decomposition (trace levels of CO2 and CO are emitted at this stage); while, when spreading steadily, exothermic char oxidation dominates the mass loss and emits a large quantity of CO2 and CO in an almost synchronous fashion (Rein et al. 2009; Hu et al. 2018b).
Eqn 1 for calculating individual EF, EF(CO2)/EF(CH4) can be simplified as below (Eqn 4):

where  is the molar mass of species CO2 (44 g mol−1),
  is the molar mass of species CH4 (16 g mol−1) and
  and
and  are the mole fractions of CO2 and CH4, respectively.
As mentioned above, natural variability of fuel composition (for example, carbon content) could directly affect EF especially in the field (Hu et al. 2018a; Smith et al. 2018). Similar to the various fire ratios used for identifying fire conditions in coal mines (Ray et al. 2004) and the MCE (Christian et al. 2003; Stockwell et al. 2016), mole fraction ratios of CO2 and CH4 can be calculated without entailing EF, thus giving this signature advantages over EF-based signatures.
It is worth noting that the performance of gas signatures in early smouldering fire identification is limited to the transient emission data from a single peat fire study (Hu et al. 2018b). More studies are needed to improve the reliability and applicability of EF(CO2)/EF(CH4) and other signatures like MCE (Hu et al. 2018a). However, the preliminary analysis shown here extends ideas on innovating early detection technologies for smouldering fire, and indicates the value of further research examining its effectiveness in practical use (Rein 2013; Wiggins et al. 2018).
Conclusion
Systematic comparisons and statistical analysis of 28 forms of EF combinations of CO2, CO, CH4 and NH3 created from the inspiration of commonly used combustion signatures (for example, CO/CO2 and the MCE) were carried out for peat, savanna and grassland, agricultural residue and forest fires. This novel framework enables, for the first time, the development of the best gas signature, EF(CO2)/EF(CH4), for smouldering peat from three main aspects. First, EF(CO2)/EF(CH4) benefits from its statistically distinguished ratio range (134.6 ± 37.5), which has 598.5% and 174.0% lower average than flaming fires and the other wildland fuel fires, respectively. Second, this signature possesses advantages over individual EF signatures in terms of its insusceptibility to fuel composition. Although this paper mainly focuses on EF, EF(CO2)/EF(CH4) applies to measurements of gas concentrations in the field, which strengthens its practicality in actual use. Third, it shows the best performance in distinguishing early ignition from the subsequent spreading of a smouldering peat fire among signatures including the widely-adopted MCE. In contrast, the worst three candidates for smouldering peat gas signature from the perspective of statistical difference with the other wildfires are EF(CO)/EF(NH3), EF(NH3)/EF(CO) and EF(CH4)/EF(NH3).
Limitations exist for the developed gas signature from this work: theoretically, there are endless EF combination types with higher complexity and more gas species which could be created for analysis; EF(CO2)/EF(CH4) is not necessarily the perfect gas signature for smouldering peat. A level of uncertainty exists for EF(CO2)/EF(CH4), but this is lower than for the MCE and the other analysed signatures. However, the limited peat fire EF data available for statistical analysis could affect the accuracy and reliability of the proposed signatures. This calls for more peat fire emission studies to advance scientific understanding of this little considered but important wildfire. Furthermore, the signature proposed in this work is not the ultimate solution for early smouldering peat detection. Developing a more comprehensive smouldering signature combining not only gas emission footprints but also the other combustion signatures (for example, infrared and particle emission characteristics) could further improve early fire detection technology.
This work provides scientific evidence demonstrating that the by-products of fires, i.e. emissions, when selected properly, can distinguish smouldering peat from the other wildfires and can also be applied for early detection. This is important as flaming wildfires have stronger thermal signatures, while the signals for smouldering fires are typically weak, and traditional wildfire detection technologies developed for flaming wildfires are much less effective for smouldering fires. In wildland where multiple types of wildfires co-exist, challenges remain for efficient early detection of smouldering fires, leading to missed time opportunities for early fire mitigation. The gas signatures developed from this work can contribute to developing tailored detection technologies for smouldering peat, consequently mitigating the smouldering-induced regional haze conundrum.
Data availability
The data that support this study is freely available in Hu and Rein (2022) Data Compilation of Emission Factors Supporting the Development of Gas Signatures of Smouldering Peat Wildfires (Version 1.0.0) [Dataset]. https://doi.org/10.5281/zenodo.7199335.
Conflicts of interest
The authors declare no conflicts of interest.
Declaration of funding
This study was funded by the European Research Council Consolidator Grant Haze (682587), the National Natural Science Foundation of China (52106184) and the SCFRI Basic Research Fund (20218801z).
References
Akagi SK, Yokelson RJ, Wiedinmyer C, Alvarado MJ, Reid JS, Karl T, Crounse JD, Wennberg PO (2011) Emission factors for open and domestic biomass burning for use in atmospheric models. Atmospheric Chemistry and Physics 11, 4039–4072.| Emission factors for open and domestic biomass burning for use in atmospheric models.Crossref | GoogleScholarGoogle Scholar |
Andreae MO (2019) Emission of trace gases and aerosols from biomass burning – an updated assessment. Atmospheric Chemistry and Physics 19, 8523–8546.
| Emission of trace gases and aerosols from biomass burning – an updated assessment.Crossref | GoogleScholarGoogle Scholar |
Andreae MO, Merlet P (2001) Emission of trace gases and aerosols from biomass burning. Global Biogeochemical Cycles 15, 955–966.
| Emission of trace gases and aerosols from biomass burning.Crossref | GoogleScholarGoogle Scholar |
Belyea LR, Clymo RS (2001) Feedback control of the rate of peat formation. Proceedings of the Royal Society of London. Series B: Biological Sciences 268, 1315–1321.
| Feedback control of the rate of peat formation.Crossref | GoogleScholarGoogle Scholar |
Black RR, Aurell J, Holder A, George IJ, Gullett BK, Hays MD, Geron CD, Tabor D (2016) Characterization of gas and particle emissions from laboratory burns of peat. Atmospheric Environment 132, 49–57.
| Characterization of gas and particle emissions from laboratory burns of peat.Crossref | GoogleScholarGoogle Scholar |
Bluvshtein N, Villacorta E, Li C, Hagen BC, Frette V, Rudich Y (2020) Early detection of smoldering in silos: organic material emissions as precursors. Fire Safety Journal 114, 103009
| Early detection of smoldering in silos: organic material emissions as precursors.Crossref | GoogleScholarGoogle Scholar |
Burke C, Wich S, Kusin K, Mcaree O, Harrison M, Ripoll B, Ermiasi Y, Mulero-Pázmány M, Longmore S (2019) Thermal-drones as a safe and reliable method for detecting subterranean peat fires. Drones 3, 23
| Thermal-drones as a safe and reliable method for detecting subterranean peat fires.Crossref | GoogleScholarGoogle Scholar |
Chakrabarty RK, Gyawali M, Yatavelli RLN, Pandey A, Watts AC, Knue J, Chen L-WA, Pattison RR, Tsibart A, Samburova V, Moosmüller H (2016) Brown carbon aerosols from burning of boreal peatlands: microphysical properties, emission factors, and implications for direct radiative forcing. Atmospheric Chemistry and Physics 16, 3033–3040.
| Brown carbon aerosols from burning of boreal peatlands: microphysical properties, emission factors, and implications for direct radiative forcing.Crossref | GoogleScholarGoogle Scholar |
Christensen EG, Hu Y, Restuccia F, Santoso MA, Rein G (2019) Experimental Methods and Scales in Smouldering Wildfires. In ‘Fire effects on soils properties’. (Eds P Pereira, J Mataix-Solera, X Ubeda, G Rein, A Cerda) pp. 267–280. (CSIRO Publishing: Melbourne)
Christian TJ, Kleiss B, Yokelson RJ, Holzinger R, Crutzen PJ, Hao WM, Saharjo BH, Ward DE (2003) Comprehensive laboratory measurements of biomass-burning emissions: 1. Emissions from Indonesian, African, and other fuels. Journal of Geophysical Research 108, 4719
| Comprehensive laboratory measurements of biomass-burning emissions: 1. Emissions from Indonesian, African, and other fuels.Crossref | GoogleScholarGoogle Scholar |
Cochrane MA (2003) Fire science for rainforests. Nature 421, 913–919.
| Fire science for rainforests.Crossref | GoogleScholarGoogle Scholar |
Ellison S, Barwick VJ, Farrant T (2009) ‘Practical statistics for the analytical scientist.’ (RSC Publishing: Cambridge)
| Crossref |
Forsyth T (2014) Public concerns about transboundary haze: A comparison of Indonesia, Singapore, and Malaysia. Global Environmental Change 25, 76–86.
| Public concerns about transboundary haze: A comparison of Indonesia, Singapore, and Malaysia.Crossref | GoogleScholarGoogle Scholar |
Geron C, Hays M (2013) Air emissions from organic soil burning on the coastal plain of North Carolina. Atmospheric Environment 64, 192–199.
| Air emissions from organic soil burning on the coastal plain of North Carolina.Crossref | GoogleScholarGoogle Scholar |
GraphPad Software Inc. (2022) ‘GraphPad QuickCalcs.’ (GraphPad Software: San Diego, CA, USA) Available at https://www.graphpad.com/quickcalcs
Hu Y, Rein G (2022) Data Compilation of Emission Factors Supporting the Development of Gas Signatures of Smouldering Peat Fires (Version 1.0.0) [Dataset].
| Crossref |
Hu Y, Fernandez-Anez N, Smith T, Rein G (2018a) Review of emissions from smouldering peat fires and their contribution to regional haze episodes. International Journal of Wildland Fire 27, 293–312.
| Review of emissions from smouldering peat fires and their contribution to regional haze episodes.Crossref | GoogleScholarGoogle Scholar |
Hu Y, Christensen EG, Restuccia F, Rein G (2018b) Transient gas and particle emissions from smouldering combustion of peat. Proceedings of the Combustion Institute 37, 4035–4042.
| Transient gas and particle emissions from smouldering combustion of peat.Crossref | GoogleScholarGoogle Scholar |
Hu Y, Christensen EG, Amin HMF, Smith TEL, Rein G (2019) Experimental study of moisture content effects on the transient gas and particle emissions from peat fires. Combustion and Flame 209, 408–417.
| Experimental study of moisture content effects on the transient gas and particle emissions from peat fires.Crossref | GoogleScholarGoogle Scholar |
Huijnen V, Wooster MJ, Kaiser JW, Gaveau DLA, Flemming J, Parrington M, Inness A, Murdiyarso D, Main B, van Weele M (2016) Fire carbon emissions over maritime south-east Asia in 2015 largest since 1997. Scientific Reports 6, 26886
| Fire carbon emissions over maritime south-east Asia in 2015 largest since 1997.Crossref | GoogleScholarGoogle Scholar |
Kettridge N, Turetsky MR, Sherwood JH, Thompson DK, Miller CA, Benscoter BW, Flannigan MD, Wotton BM, Waddington JM (2015) Moderate drop in water table increases peatland vulnerability to post-fire regime shift. Scientific Reports 5, 8063
| Moderate drop in water table increases peatland vulnerability to post-fire regime shift.Crossref | GoogleScholarGoogle Scholar |
Madsen D, Azeem HA, Sandahl M, van Hees P, Husted B (2018) Levoglucosan as a tracer for smouldering fire. Fire Technology 54, 1871–1885.
| Levoglucosan as a tracer for smouldering fire.Crossref | GoogleScholarGoogle Scholar |
Nara H, Tanimoto H, Tohjima Y, Mukai H, Nojiri Y, Machida T (2017) Emission factors of CO2, CO and CH4 from Sumatran peatland fires in 2013 based on shipboard measurements. Tellus B: Chemical and Physical Meteorology 69, 1
| Emission factors of CO2, CO and CH4 from Sumatran peatland fires in 2013 based on shipboard measurements.Crossref | GoogleScholarGoogle Scholar |
Page SE, Siegert F, Rieley JO, Boehm H-DV, Jaya A, Limin S (2002) The amount of carbon released from peat and forest fires in Indonesia during 1997. Nature 420, 61–65.
| The amount of carbon released from peat and forest fires in Indonesia during 1997.Crossref | GoogleScholarGoogle Scholar |
Ray SK, Singh RP, Sahay N, Varma NK (2004) Assessing the status of sealed fire in underground coal mines. Journal of Scientific & Industrial Research 63, 579–591.
| Assessing the status of sealed fire in underground coal mines.Crossref | GoogleScholarGoogle Scholar |
Rein G (2013) Smouldering fires and natural fuels. In ‘Fire phenomena and the Earth system: an interdisciplinary guide to fire science’. (Ed. CM Belcher) pp. 15–34. (John Wiley & Sons: Oxford)
Rein G (2016) Smouldering combustion. In ‘The SFPE handbook of fire protection engineering’. (Ed. MJ Hurley) pp. 581–603. (Springer: New York)
Rein G, Cohen S, Simeoni A (2009) Carbon emissions from smouldering peat in shallow and strong fronts. Proceedings of the Combustion Institute 32, 2489–2496.
| Carbon emissions from smouldering peat in shallow and strong fronts.Crossref | GoogleScholarGoogle Scholar |
Selimovic V, Yokelson RJ, Warneke C, Roberts JM, de Gouw J, Reardon J, Griffith DWT (2018) Aerosol optical properties and trace gas emissions by PAX and OP-FTIR for laboratory-simulated western US wildfires during FIREX. Atmospheric Chemistry and Physics 18, 2929–2948.
| Aerosol optical properties and trace gas emissions by PAX and OP-FTIR for laboratory-simulated western US wildfires during FIREX.Crossref | GoogleScholarGoogle Scholar |
Smith TEL, Evers S, Yule CM, Gan JY (2018) In situ tropical peatland fire emission factors and their variability, as determined by field measurements in Peninsula Malaysia. Global Biogeochemical Cycles 32, 18–31.
| In situ tropical peatland fire emission factors and their variability, as determined by field measurements in Peninsula Malaysia.Crossref | GoogleScholarGoogle Scholar |
Sofan P, Bruce D, Jones E, Marsden J (2019) Detection and Validation of Tropical Peatland Flaming and Smouldering Using Landsat-8 SWIR and TIRS Bands. Remote Sensing 11, 465
| Detection and Validation of Tropical Peatland Flaming and Smouldering Using Landsat-8 SWIR and TIRS Bands.Crossref | GoogleScholarGoogle Scholar |
Stockwell CE, Yokelson RJ, Kreidenweis SM, Robinson AL, DeMott PJ, Sullivan RC, Reardon J, Ryan KC, Griffith DWT, Stevens L (2014) Trace gas emissions from combustion of peat, crop residue, domestic biofuels, grasses, and other fuels: configuration and Fourier transform infrared (FTIR) component of the fourth Fire Lab at Missoula Experiment (FLAME-4). Atmospheric Chemistry and Physics 14, 9727–9754.
| Trace gas emissions from combustion of peat, crop residue, domestic biofuels, grasses, and other fuels: configuration and Fourier transform infrared (FTIR) component of the fourth Fire Lab at Missoula Experiment (FLAME-4).Crossref | GoogleScholarGoogle Scholar |
Stockwell CE, Veres PR, Williams J, Yokelson RJ (2015) Characterization of biomass burning emissions from cooking fires, peat, crop residue, and other fuels with high-resolution proton-transfer-reaction time-of-flight mass spectrometry. Atmospheric Chemistry and Physics 15, 845–865.
| Characterization of biomass burning emissions from cooking fires, peat, crop residue, and other fuels with high-resolution proton-transfer-reaction time-of-flight mass spectrometry.Crossref | GoogleScholarGoogle Scholar |
Stockwell CE, Jayarathne T, Cochrane MA, Ryan KC, Putra EI, Saharjo BH, Nurhayati AD, Albar I, Blake DR, Simpson IJ, Stone EA, Yokelson RJ (2016) Field measurements of trace gases and aerosols emitted by peat fires in central Kalimantan, Indonesia, during the 2015 El Niño. Atmospheric Chemistry and Physics 16, 11711–11732.
| Field measurements of trace gases and aerosols emitted by peat fires in central Kalimantan, Indonesia, during the 2015 El Niño.Crossref | GoogleScholarGoogle Scholar |
Turetsky MR, Benscoter B, Page S, Rein G, van Der Werf GR, Watts A (2015) Global vulnerability of peatlands to fire and carbon loss. Nature Geoscience 8, 11–14.
| Global vulnerability of peatlands to fire and carbon loss.Crossref | GoogleScholarGoogle Scholar |
Ward DE, Radke LF (1993) Emissions measurements from vegetation fires: a comparative evaluation of methods and results. In ‘Fire in the environment: the ecological, atmospheric, and climatic importance of vegetation fires’. (Eds PJ Crutzen, JG Goldammer) pp. 53–76. (John Wiley & Sons: Oxford)
Wiggins EB, Czimczik CI, Santos GM, Chen Y, Xu X, Holden SR, Randerson JT, Harvey CF, Kai FM, Yu LE (2018) Smoke radiocarbon measurements from Indonesian fires provide evidence for burning of millennia-aged peat. Proceedings of the National Academy of Sciences 115, 12419–12424.
| Smoke radiocarbon measurements from Indonesian fires provide evidence for burning of millennia-aged peat.Crossref | GoogleScholarGoogle Scholar |
Wilson D, Dixon SD, Artz RRE, Smith TEL, Evans CD, Owen HJF, Archer E, Renou-Wilson F (2015) Derivation of greenhouse gas emission factors for peatlands managed for extraction in the Republic of Ireland and the United Kingdom. Biogeosciences 12, 5291–5308.
| Derivation of greenhouse gas emission factors for peatlands managed for extraction in the Republic of Ireland and the United Kingdom.Crossref | GoogleScholarGoogle Scholar |
Wooster MJ, Gaveau DLA, Salim MA, Zhang T, Xu W, Green DC, Huijnen V, Murdiyarso D, Gunawan D, Borchard N, Schirrmann M, Main B, Sepriando A (2018) New tropical peatland gas and particulate emissions factors indicate 2015 Indonesian fires released far more particulate matter (but less methane) than current inventories imply. Remote Sensing 10, 495
| New tropical peatland gas and particulate emissions factors indicate 2015 Indonesian fires released far more particulate matter (but less methane) than current inventories imply.Crossref | GoogleScholarGoogle Scholar |
Yokelson RJ, Susott R, Ward DE, Reardon J, Griffith DWT (1997) Emissions from smoldering combustion of biomass measured by open-path Fourier transform infrared spectroscopy. Journal of Geophysical Research 102, 18865–18877.
| Emissions from smoldering combustion of biomass measured by open-path Fourier transform infrared spectroscopy.Crossref | GoogleScholarGoogle Scholar |
Yu ZC (2012) Northern peatland carbon stocks and dynamics: a review. Biogeosciences 9, 4071–4085.
| Northern peatland carbon stocks and dynamics: a review.Crossref | GoogleScholarGoogle Scholar |
1 Peat is a carbon-rich organic soil that contains at least 12% organic carbon (20% organic material) with less than 20–35% mineral content (Belyea and Clymo 2001; Turetsky et al. 2015).
2 Moisture content of peat is defined as the mass of water divided by the mass of a dried sample (%).
3 In Hu et al. (2019), no NH3 emission was detected from flaming peat, the EF of NH3 was reported as 0 g kg−1.


