

Spatial variability of water chemistry in the Ayeyarwady River Basin, Myanmar
An V. Vu A B * , John C. Conallin A , Lauren J. Stoot A C , Gregory S. Doran C , Lee J. Baumgartner A B , Katherine E. Doyle A B , Nathan Ning A , Zau Lunn D , Nyein Chan E , Nyi Nyi Tun F , Aye Myint Swe G and Bronwyn M. Gillanders H
A
B
C
D
E
F
G
H
Abstract
Understanding chemical properties and biogeochemical changes can help us answer difficult ecological questions. Water chemistry is often dynamic in large tropical rivers, particularly in deltas where sea tides and river hydrological regimes are extremely influential.
This study assessed the spatial variability of water chemistry by measuring the elemental concentrations of seven trace elements and strontium isotopes (87Sr:86Sr) in the Ayeyarwady River Basin in Myanmar.
Inductively Coupled Plasma Optical Emission Spectroscopy and multi-collector inductively coupled plasma mass spectrometry were used to quantify concentrations of trace elements and strontium isotopes at 50 sampling sites, covering 1700 km of the Ayeyarwady River. Data was grouped into regions for statistical analyses.
Three elements (Sr, Ca, and Mg) showed distinct longitudinal concentration profiles, which were higher at the coast but consistently lower in freshwater. For example, elemental concentrations at coastal areas were 22-, 63-, and 150-times higher than in freshwater further upstream for Ca, Sr, and Mg, respectively. Although, longitudinal concentration profiles of 87Sr:86Sr ratios varied along the Ayeyarwady River, they were not significantly different among regions.
Longitudinal profiles of dissolved elements varied significantly. In particular, three elements (Sr, Ca, and Mg) are good indicators to differentiate between marine and freshwater in the Ayeyarwady River.
Our findings provide important baseline information on water chemistry for future fish otolith (inner ear of bony fish) chemistry studies to track fish migrations in the basin.
Keywords: Ayeyarwady River, chemistry, Chindwin River, fish migration, microchemistry, strontium isotopes, trace element, variation.
Introduction
The Ayeyarwady River is a major tropical river in south-east Asia that originates in the Himalayan glaciers and flows over 2000 km to the Andaman Sea. The total catchment of the Ayeyarwady River Basin (ARB) is 413,710 km2, with most of the basin in Myanmar (91%) and minor parts in China and India (WLE 2022). The Ayeyarwady River is an important social and economic source for Myanmar (Baran et al. 2018). It has several major tributaries, with the largest being the Chindwin River, which joins the Ayeyarwady River near Myingyan Township. Mineral resources such as gold, silver, lead, jade, copper, zinc, oil, gas, coal, and sand are mined in certain parts of the ARB (Ketelsen et al. 2017; WWF 2017). Some anthropogenic impacts such as land use change, pollution, climate change have been identified in the ARB (Ketelsen et al. 2017). For example, an increase in heavy metals and other chemicals was observed in the basin (Piman et al. 2020; Krittasudthacheewa et al. 2021).
Understanding chemical properties and biogeochemical changes can help us answer difficult ecological questions. For example, variation in elemental concentrations in calcified structures such as fish otoliths (inner ear of bony fish), scales, spines, bones, and eye lenses (incorporated from ambient water) are commonly used to understand fish migrations across salinity gradients and habitat use (Campana 1999; Pouilly et al. 2014) because elemental concentrations often differ in between environments (e.g. fresh vs marine waters) or different habitats (e.g. mainstem vs tributary) (Gaillardet et al. 2003; Zimmerman 2005; Peucker-Ehrenbrink and Fiske 2019; Tang et al. 2024). Variation in chemical composition of each otolith layer reflects the surrounding environmental conditions at the time of layer formation, and provides insight into movements of fish between habitats or exposure to pollutants (Campana 1999; Walther and Limburg 2012; Limburg et al. 2015).
Analysis of ambient water chemistry is often required prior to or at the same time with otolith chemistry studies to interpret fish migrations correctly (Zimmerman 2005). Interpretation of otolith chemistry data must be based on water chemistry. Otolith chemistry studies without the support of water chemistry often rely on several assumptions. Water chemistry may vary in different river systems. For example, concentrations of strontium were often high in marine water and low in freshwater in many river systems (Zimmerman and Reeves 2000; Elsdon et al. 2008; Daverat and Martin 2016; Stoot et al. 2024) but the concentrations in a few rivers could be higher than those in marine water (Kraus and Secor 2004). Hence, understanding variation in water chemistry is critical for otolith studies. Chapman et al. (2015) estimated chemical and strontium isotope concentrations and fluxes in the ARB. Their study areas covered inland waters while marine waters were not included. This is a limitation for future otolith chemistry studies to examine connections of fishes between rivers and the ocean.
Water chemistry is often dynamic in large tropical rivers, particularly in deltas where the effects of sea tides and river hydrological regimes are extremely influential (Elsdon and Gillanders 2006; Crook et al. 2017; Vu et al. 2021). The objective of this study was to investigate the spatial variability of water chemistry in the ARB by measuring the elemental concentrations of seven trace elements (the most common elements used for reconstructing fish movements from otolith chemistry) and strontium isotopes (87Sr:86Sr) from coastal areas to the upper Ayeyarwady River in Myanmar, bordering with China and India. Our findings provide spatial records of water chemistry that can aid interpretation of future otolith chemistry studies in the ARB.
Materials and methods
Study area and water sampling
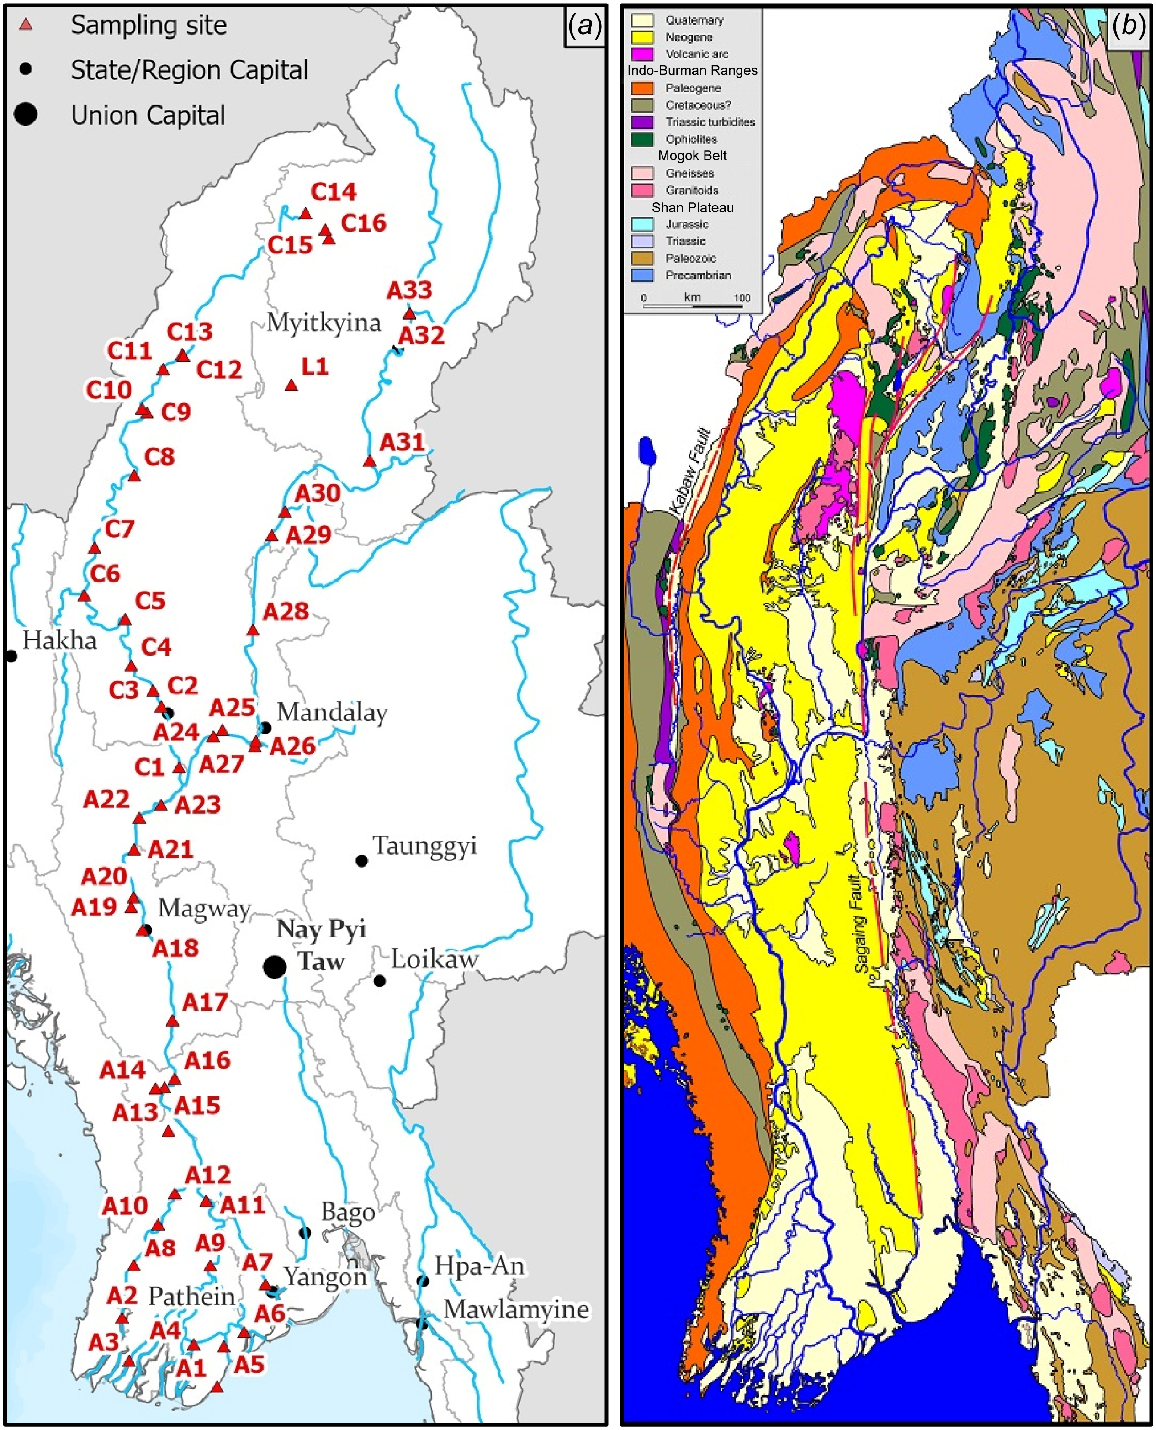
Water was sampled at 50 sites across the ARB (33 sites in the Ayeyarwady River; 16 sites in the Chindwin River, which a suspected spawning tributary for anadromous species; and one site at the Indawgyi Lake). Most of these sampling sites were located on the mainstem while nine sites were located on tributaries (Fig. 1). These sampling sites encompassed three broad regions of the ARB: (1) Ayeyarwady upstream (11 sites, A24–A33 and L1); (2) Ayeyarwady downstream (23 sites, A1–A23); and (3) Chindwin River (16 sites, C1–C16). At each sampling location, global positioning satellite (GPS) co-ordinates were recorded using a GPS instrument (Garmin 64). Three replicate river water samples were collected from just below the water surface at each site and one ‘blank’ sample was prepared (using deionised water) to detect contamination during the sampling process in the field. Water was then immediately filtered using 0.2 μm syringe filters (Sarstedt, Polyethersulfone membranes) into acid washed bottles containing high-grade nitric acid. Each sample ultimately contained 98 mL of filtered water and 2 mL of 65% nitric acid to preserve samples until analysis. Several field trips were conducted for water sampling in the Lower Ayeyarwady and Ayeyarwady Delta (October 2019) and the Middle, Upper Ayeyarwady, and Chindwin (October 2019–January 2020), covering a single season. In addition, existing hydrological data in 2019 (water level, rainfall, water temperature) were collected from the Hydrological and Metrological Department at three gauging stations (Hinthada, Mandalay, and Homalin) in the ARB.
Map of sampling sites for water chemistry (a) and the geography (b) of the Ayeyarwady River Basin. A, Ayeyarwady River; C, Chindwin River. For more details, see Supplementary material 1. The geology map was adapted from Garzanti et al. (2016).
Elemental analysis
For trace elements (Sr, Ba, Mg, Ca, Mn, Fe, Zn), water samples were initially tested using Inductively Coupled Plasma Optical Emission Spectroscopy (ICP-OES; 5110 SVDV ICP-OES, Agilent Technologies, Santa Clara, CA, USA). Except Zn these elements are often abundant. The concentration of Zn was low in the ARB, but it was still detected at all sampling sites. The limit of detection and limit of quantification of Zn were 0.0002 mg L−1 and 0.0006 mg L−1, respectively. Calibration was achieved using a 5% HNO3 matrix multi element standard (IntelliQuant Multi-element Standard #1, Agilent Technologies) containing 48 elements, and calibration standards were prepared using 1% HNO3 at 50 ppm, 10 ppm, 5 ppm, 1000 ppb, 100 ppb, 10 ppb, 1000 ppt, 100 ppt, and 10 ppt. To account for machine detection limits, a replicate of each site was used to make two dilutions (1/100 and 1/1000) using instrument grade water (18.20 μΩ) fixed with 1% nitric acid. Parent samples were run for all samples as well as 1/100 dilutions, which were used for samples that were predicted to have high salinity concentrations. To account for field contamination, a ‘blank’ sample was prepared using instrument grade water (18.20 μΩ) instead of river water.
For Sr isotope concentrations (87Sr:86Sr), a multi-collector inductively coupled plasma mass spectrometry (ICP MS, Thermo Scientific, High Resolution NEPTUNE, Bremen, Germany) was used. Purification of strontium for 87Sr:86Sr ratio analysis was conducted using custom columns packed with Eichrom Sr-spec resin (~300 μL column with ~1 mL reservoir). Samples were acidified to 2 M with triple-distilled HNO3 and (1–2 mL) loaded on to the columns. All solutions (samples and elution acids) were loaded onto the column on 0.3 mL aliquots to prevent disturbing the resin bed and to keep the resin wetted throughout chromatography. A waste beaker was placed under the column and 3 mL of 2 M HNO3 was then passed through the column to elute Rb. Following this, 4 mL of 2 M, 2 mL of 7 M, and then 0.3 mL of 2 M HNO3 was used to elute Ba and the matrix from the column. Finally, a clean 5.5-mL vial was placed under the column to collect the Sr cut, which was eluted using 5.3 mL of 0.02 M HNO3. The collected sample (5.3 mL) was then analysed directly by a multi-collector ICP MS. The 87Sr:86Sr ratio of the standard reference material SRM987 (NIST; www.nist.gov) with an absolute abundance ratio was 0.71034 ± 0.00026. To determine spatial patterns of water chemistry, sampling points were overlaid onto the map containing the Ayeyarwady and Chindwin Rivers. A Jenks Optimisation Method was used to classify and display the trace element and strontium 87Sr:86Sr values into colour-coded categories.
Data analysis
Data was grouped into the three regions for statistical analyses: (1) Ayeyarwady downstream (A1–A23); (2) Ayeyarwady upstream (A24–A33 and L1); and (3) Chindwin (C1–C16). Data from the coastal site (A1) was included purely for comparison, and not statistically analysed. This classification provides applications for future otolith studies to examine fish movements between different regions of the ARB. Differences in elemental concentrations and element:Ca ratios among regions were examined using univariate permutational analysis of variance (PERMANOVA) in Primer + Permanova ver. 7.0 (Anderson et al. 2008). Prior to analyses, data was log10(x + 1) transformed to reduce the influence of outliers and Euclidean distances were calculated among samples for all PERMANOVA tests. Pairwise comparisons were further tested wherever significant differences (P < 0.05) were found in the main tests. Variability in elemental concentrations and element:Ca ratios were additionally assessed by calculating coefficient of variation percentages for each region. We also investigated whether there were any correlations between elemental concentrations and element:Ca ratios, and distance from the coast, by running Spearman Rank correlations tests in SigmaPlot for Windows ver. 15.
Results
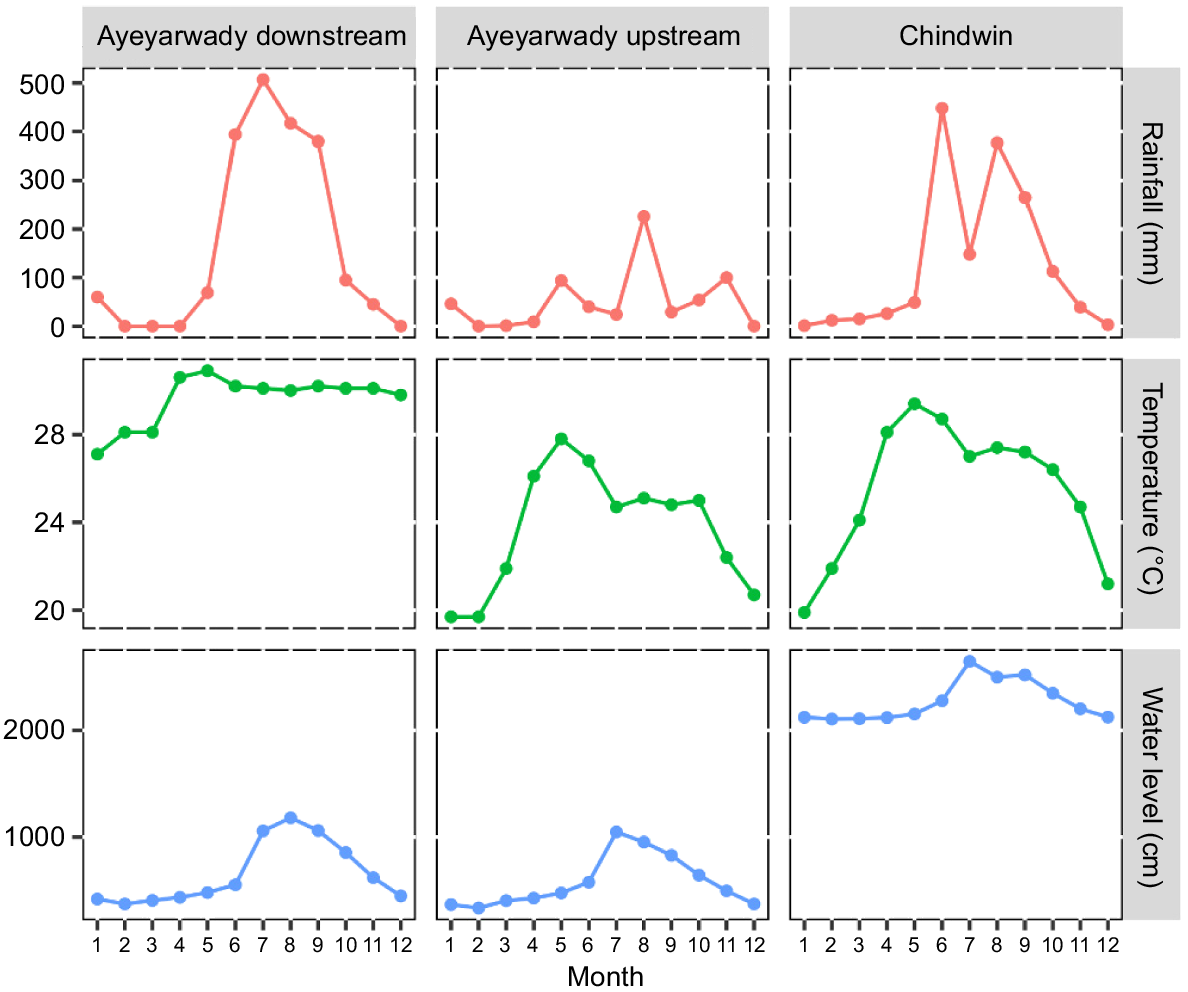
Hydrological regimes in 2019 varied seasonally in the ARB, with water levels substantially increasing at the beginning of the wet season (monsoon period, June–October) and decreasing during the dry season. This trend was observed in the ARB (Fig. 2). Water temperature was relatively stable all year round in the lower Ayeyarwady River while temperature in other regions varied between seasons.
Monthly (1 = January; 12 = December) variation in rainfall (mm), water temperature (°C), and water level (cm) patterns for the three regions of the Ayeyarwady River Basin in 2019. Water samples were collected between October 2019 and January 2020. Monthly data (temperature, rainfall and water level) for Ayeyarwady downstream, Ayeyarwady upstream, and Chindwin regions were from Hinthada, Mandalay, and Homalin stations, respectively. Data source: Hydrological and Metrological Department of Myanmar.
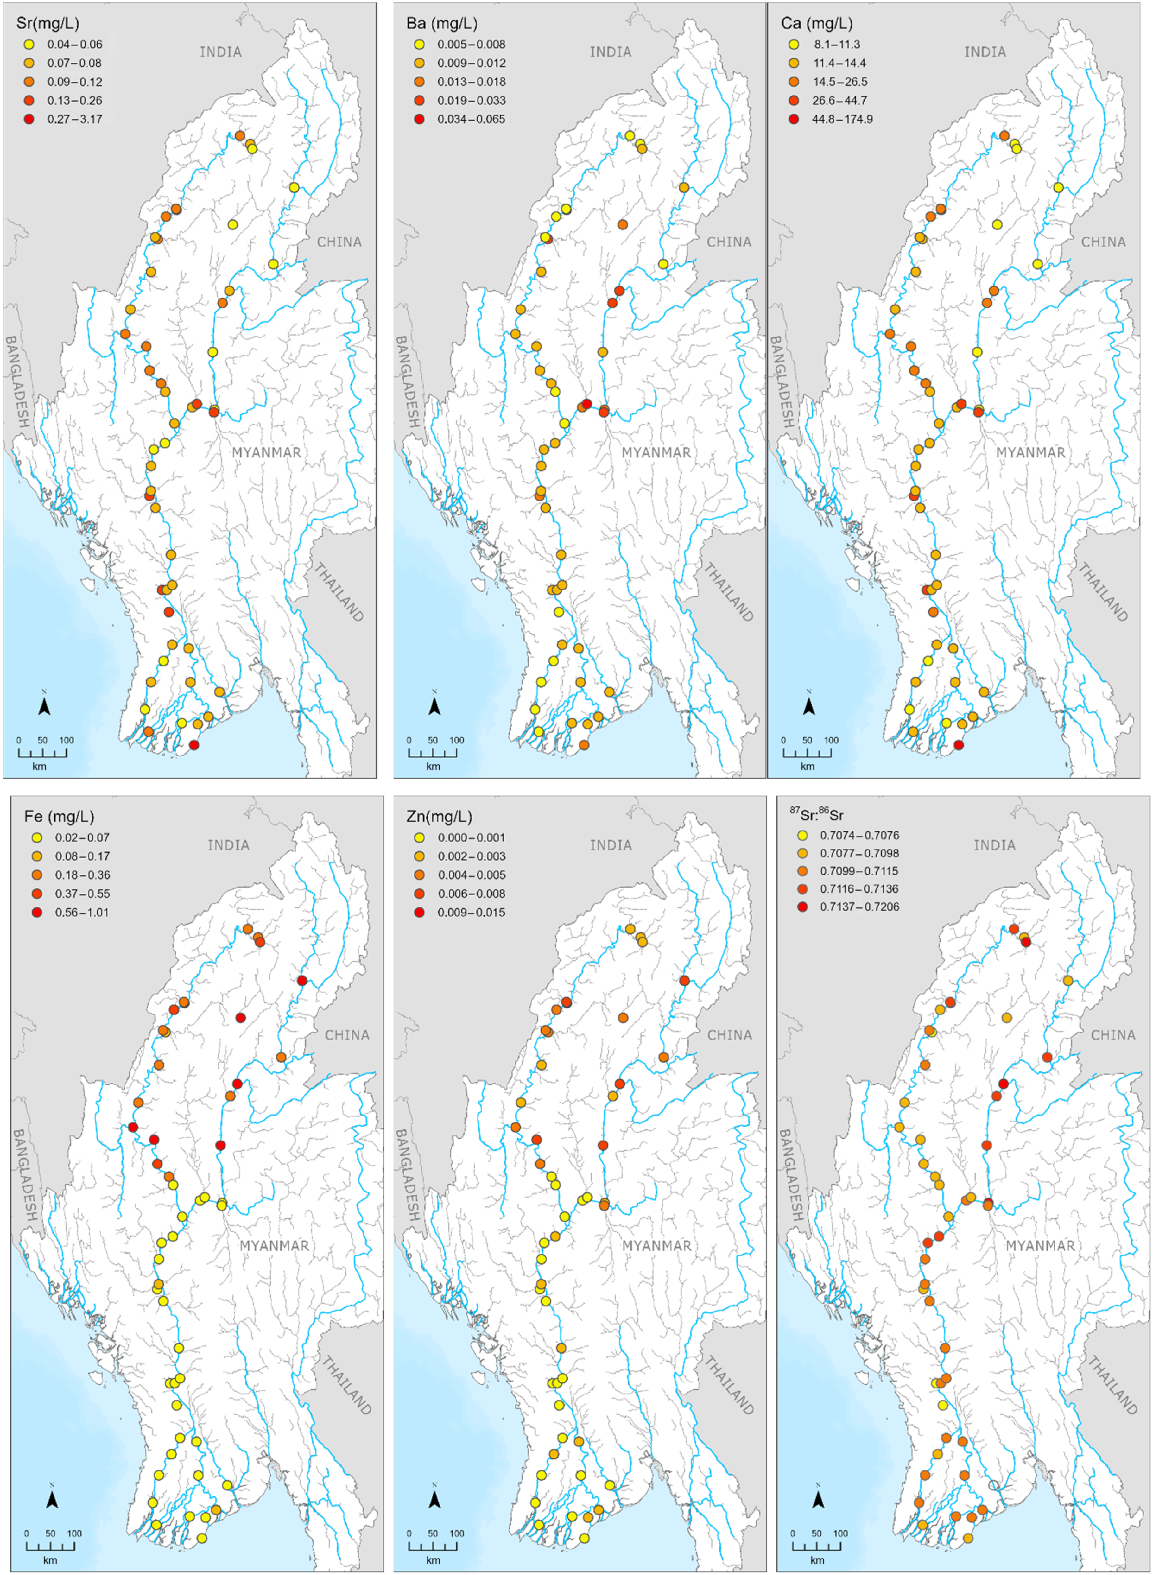
Trace element and strontium isotope concentrations greatly varied across the ARB (Fig. 3; raw data in Supplementary material 1). Some elements showed distinct variation in different parts of the ARB. For example, concentrations of Sr (3.17 mg L−1), Ca (174.90 mg L−1), and Mg (482.40 mg L−1) were very high in the coast (site A1) whereas these concentrations were very low in the Ayeyarwady River (0.05 mg L−1 for Sr; 8.10 mg L−1 for Ca; 3.21 mg L−1 for Mg at A33; Fig. 4). Additionally, some concentrations were substantially higher in the Chindwin River (e.g. 0.47 mg L−1 for Fe; 0.015 mg L−1 for Zn at C12) and Ayeyarwady upstream (e.g. 0.68 mg L−1 for Fe; 0.008 mg L−1 for Zn at A33) compared to the Ayeyarwady Delta (e.g. 0.03 mg L−1 for Fe; 0.001 mg L−1 for Zn at A10). Furthermore, concentrations of most elements were higher in tributaries. For instance, concentrations of Sr in tributaries were about 2−4 times higher than in the mainstem.
Spatial distribution of key trace elemental concentrations (Sr, Ba, Ca, Fe, Zn) and strontium isotopes (87Sr:86Sr) in the Ayeyarwady River Basin. Water was sampled from October 2019 to January 2020. Other elements and element:Ca maps are in Supplementary material 2.
Longitudinal profiles of elemental concentrations from the coast to the most upstream sampling site of the mainstem Ayeyarwady ( ) and Chindwin Rivers (
 ). Although we sampled water in both the mainstem and tributaries, only sampling sites from the mainstem were included in this graph to show longitudinal profiles. Water was sampled from October 2019 to January 2020 in the ARB. Ratios of element:Ca graphs are in Supplementary material 3.
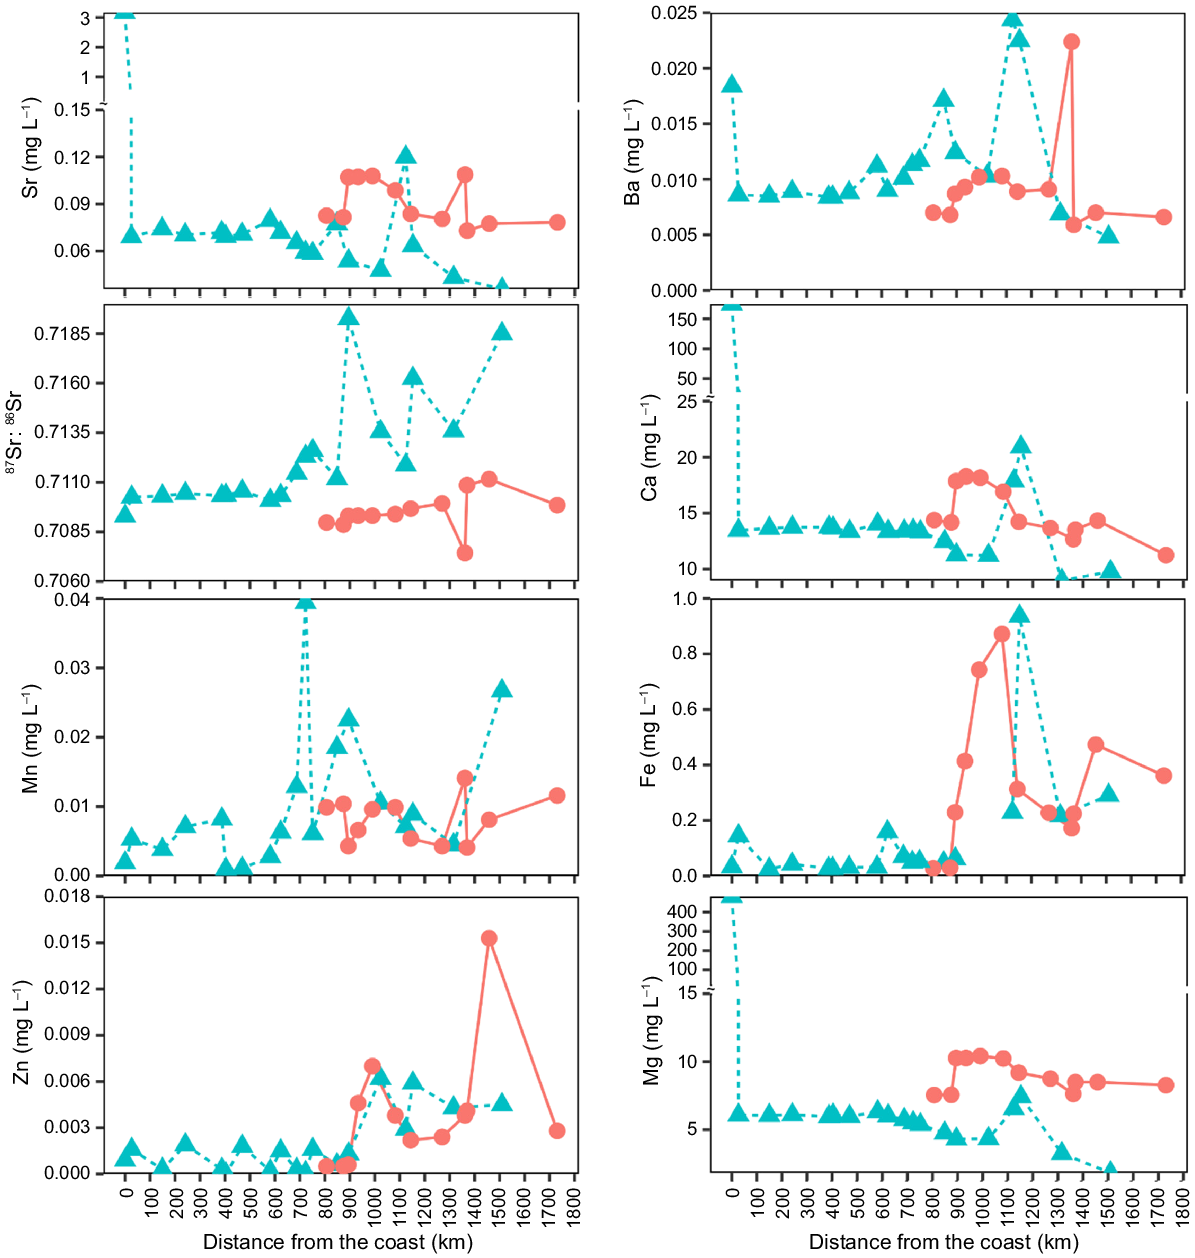
Variation of some trace element concentrations (e.g. Sr, Ca, and Mg) along the mainstem of the Ayeyarwady River and Chindwin River, from the coastline to upstream (1700 km) showed a distinct longitudinal decrease, with elevated concentrations at the coast which then declined as one travelled further inland (Fig. 4). For example, concentrations of Sr were 3.17 mg L−1 at the coast (A1), 63-times higher than concentrations at the site furthest upstream (A33). Concentrations of Ca and Mg at the coast (A1) were 22- and 150-times higher than upstream (A33), respectively. Some elements (Fe, Zn, and Mn) and ratios (Fe:Ca, Zn:Ca, and Mn:Ca) were significantly positively correlated with distance from the coast. It is important to note that concentrations of Ba were consistently low in the Ayeyarwady Delta (0.0080 mg L−1), but this concentration peaked at the coast (0.0184 mg L−1 at A1). Concentrations of Ba did not show clear longitudinal patterns along the mainstem of the Ayeyarwady River. It was unexpected that Ba concentrations were spiked at the coast (0.0184 mg L−1). For 87Sr:86Sr ratios, they were constantly lower in the Ayeyarwady downstream (0.7101 ± 0.0012) and Chindwin (0.7105 ± 0.0030), while these ratios were higher in the Ayeyarwady upstream (0.7129 ± 0.0037). These 87Sr:86Sr ratios were not significantly different among regions (P = 0.059).
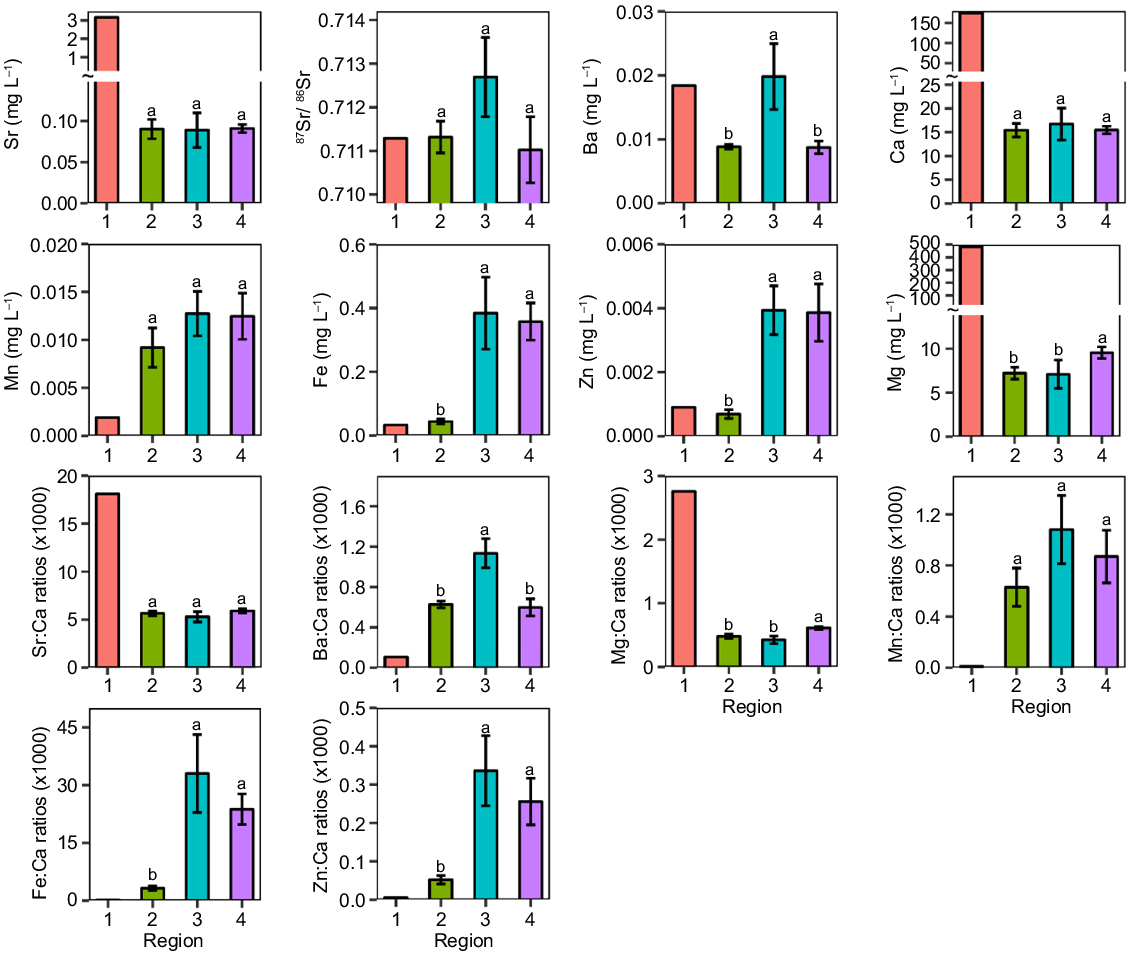
Concentrations of all elements were significantly different among regions (P < 0.05), except for Sr, 87Sr:86Sr, Ca, and Mn. Meanwhiles element:Ca ratios were significantly different among regions (P < 0.05; Table 1, Fig. 5), except Sr:Ca and Mn:Ca ratios. Concentrations of Fe, Zn, and Mn (including Fe:Ca, Zn:Ca, and Mn:Ca) were significantly associated with the distance from the coast (Fig. 4). Overall, coefficients of variation of Sr and Mg varied greatly, whereas the variation of 87Sr:86Sr was the lowest in the ARB (Table 2). Within regions of the ARB, variation was greatest for most elements and ratios in the Ayeyarwady upstream region (specifically for Ba, Ca, Fe, Mg, Sr, 87Sr:86Sr, Sr:Ca, Mg:Ca and Fe:Ca).
| Response variable | Main test | Pairwise tests | |||
|---|---|---|---|---|---|
| AD vs AU | AD vs Ch | AU vs Ch | |||
| Sr | 0.031 | n.s. | |||
| Ba | 6.138** | 2.805** | 0.005 | 2.237* | |
| Ca | 0.095 | n.s. | |||
| Fe | 15.984** | 4.135** | 7.769** | 0.478 | |
| Mg | 4.236* | 0.737 | 2.922** | 2.420* | |
| Mn | 0.828 | n.s. | |||
| Zn | 11.030** | 5.112** | 4.387** | 0.352 | |
| 87Sr:86Sr | 2.938 | n.s. | |||
| Sr:Ca | 0.763 | n.s. | |||
| Ba:Ca | 9.141** | 4.017** | 0.248 | 2.935** | |
| Mg:Ca | 7.545** | 0.951 | 3.532** | 3.622** | |
| Mn:Ca | 1.192 | n.s. | |||
| Fe:Ca | 11.053** | 3.890** | 6.679** | 0.511 | |
| Zn:Ca | 8.418** | 3.971** | 4.118** | 0.383 | |
AD, Ayeyarwady downstream; AU, Ayeyarwady upstream; Ch, Chindwin.
Pseudo F-ratios are presented for the main tests, and t-values are presented for the pairwise tests.
*P < 0.05; **P < 0.01. n.s., not significant.
Mean values of elements and element:Ca ratios in different regions are in Supplementary material 4.
Bar graphs showing mean (+ 1 s.e.) values of elements and ratios to calcium in different regions of the Ayeyarwady River Basin (Co, coast; AD, Ayeyarwady downstream; AU, Ayeyarwady upstream; Ch, Chindwin). Means for regions with the same superscript letter are not significantly different (P > 0.05). Mean values for Co samples were included for reference, and were not statistically analysed.
| Variable | Ayeyarwady downstream | Ayeyarwady upstream | Chindwin | Overall | |
|---|---|---|---|---|---|
| Sr | 61.0 | 78.4 | 21.6 | 288.5 | |
| Ba | 19.1 | 86.3 | 45.0 | 82.1 | |
| Ca | 43.6 | 66.5 | 20.6 | 124.5 | |
| Fe | 84.0 | 97.4 | 65.3 | 123.2 | |
| Mg | 44.0 | 75.6 | 27.4 | 385.4 | |
| Mn | 104.5 | 60.3 | 77.3 | 84.6 | |
| Zn | 91.5 | 64.3 | 92.6 | 116.5 | |
| 87Sr:86Sr | 0.2 | 0.5 | 0.4 | 0.4 | |
| Sr:Ca | 19.8 | 33.5 | 15.5 | 36.3 | |
| Ba:Ca | 25.2 | 42.1 | 57.0 | 53.6 | |
| Mg:Ca | 32.8 | 47.1 | 14.7 | 64.3 | |
| Mn:Ca | 112.0 | 81.9 | 94.7 | 99.7 | |
| Fe:Ca | 88.4 | 101.7 | 66.9 | 133.7 | |
| Zn:Ca | 97.7 | 90.3 | 94.7 | 129.1 |
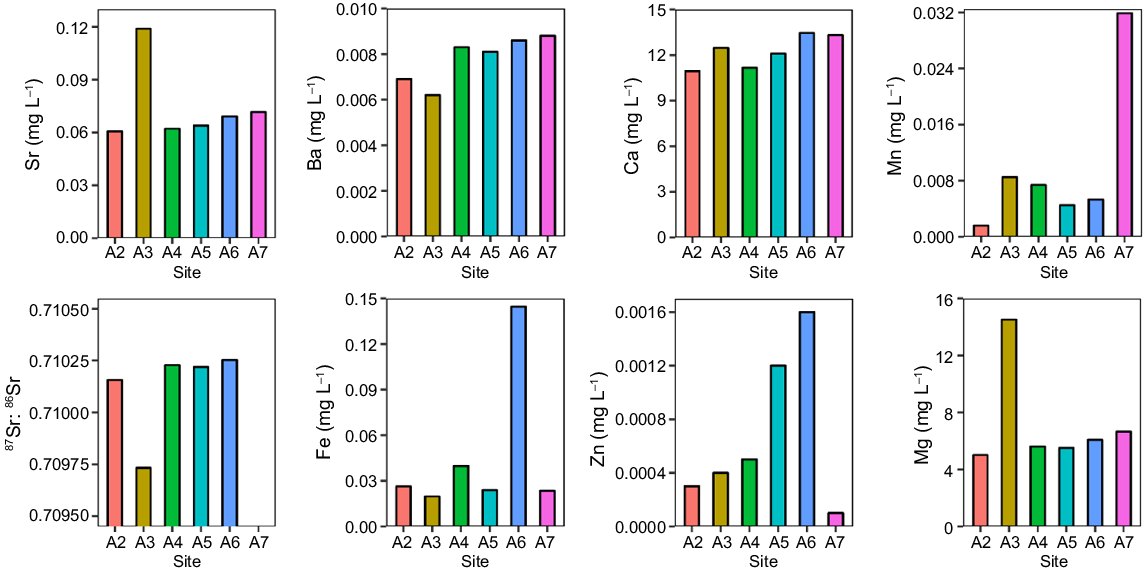
At the Ayeyarwady Delta, some elements (e.g. Ba and Ca) were relatively similar among river arms while other elements varied greatly among river mouths (Fig. 6). For example, concentrations of Sr, Mg, and Mn in site A3 were much higher than in other sites.
Discussion
Variation in elemental concentrations
Most trace element concentrations differed between fresh and marine waters. For example, Sr, Ca, and Mg showed clear differences along the mainstem from the coast to upstream. Concentration of Sr at the coast (3.17 mg L−1 at A1) were 63-times higher than the concentration further upstream (A33), which was similar to the 83-fold difference in Sr concentration observed between marine and fresh waters of the Mekong River (Vu et al. 2021), and is also similar to that observed for other river systems (He and Xu 2016; Tran et al. 2019; Stoot et al. 2024). In freshwater, concentrations of most trace elements such as Ba, Fe, Mg, and Zn were significantly different between regions of the ARB while concentrations of other trace elements (Sr, 87Sr:86Sr, Ca, and Mn) were not significantly different between regions (P > 0.05). For Fe and Zn, concentrations of these elements were higher in the Ayeyarwady upstream (Fe, 0.38 ± 0.37 mg L−1; Zn, 0.0039 ± 0.0025 mg L−1) and Chindwin (Fe, 0.36 ± 0.23 mg L−1; Zn, 0.0039 ± 0.0036 mg L−1) while these concentrations were low in the Ayeyarwady downstream (Fe, 0.04 ± 0.04 mg L−1; Zn, 0.0007 ± 0.0006 mg L−1). These trace elements and other heavy metals are likely discharged from mining operations in the upstream. Indeed, mineral resources such as gold, zinc, lead, and jade were mined in the Ayeyarwady upstream (Ketelsen et al. 2017), and these activities could contribute to higher concentrations of some heavy elements (e.g. Fe and Zn). Therefore, these mining activities raised a concern about pollution in the region (Krittasudthacheewa et al. 2021).
Myanmar was formed through the merging of various terrains at different geological periods. There are four major accreted terrains in Myanmar (Than et al. 2017). Additionally, the ARB is categorised into five hydro-ecological zones according to hydrology, geomorphology and ecology (Ketelsen et al. 2017). However, ratios of 87Sr:86Sr in water were not significantly different between regions of the ARB. This should reflect similar bedrock geology in the region. Ratios of 87Sr:86Sr in the lower Chindwin River (C1–C7) were lower (0.70926 ± 0.00027) in our study and close to that of the global ocean signature (0.70918 ± 0.00006). Another study sampling waters at Monywa (Chindwin River) also confirmed that 87Sr:86Sr ratios were lower (0.70903 ± 0.00029) in the area (Chapman et al. 2015). Overall, the Ayeyarwady River has the lowest value of 87Sr:86Sr ratios among the Himalayan–Tibetan region (Chapman et al. 2015). These authors also found seasonal variation in 87Sr:86Sr ratios in the ARB: peak at the onset of the flood season (June).
Hydrological regimes and climate exhibited strong seasonal variation in the Ayeyarwady River, suggesting that they play key roles in driving the variation in water chemistry in water chemistry in the region. Seasonal variation of some elements (e.g. Sr, 87Sr:86Sr, and Ca) were found in the ARB (Chapman et al. 2015). Impacts of hydrology on trace element concentrations were also found in other tropical rivers such as the Mekong and Amazon (Castello et al. 2015; Vu et al. 2021). For example, seasonal variation of elements (e.g. Mg, Ca, and Na) was related to variation in hydrological regime due to salt intrusion in the Mekong Delta (Vu et al. 2021). Similarly, ratios of 87Sr:86Sr were higher during the wet seasons in the Daly–Katherine River in Australia (Crook et al. 2017). Our study found that ratios of 87Sr:86Sr were usually different between rivers. For example, in the Ayeyarwady upstream, ratios of 87Sr:86Sr were 0.7136 in the Ayeyarwady River (A31), 0.7090 in the Mali Kha River (A33), and 0.7185 in the N’Mai River (A32). In addition, Chapman et al. (2015) found that 87Sr:86Sr ratios were 0.7142 ± 0.0013 at the Myitkyina (Ayeyarwady River, about 40 km downstream from A32 and A33). Mixing water from two river branches (A32 and A33) would cause the differences in water chemistry.
Other studies have shown distinct patterns of 87Sr:86Sr ratios (low at river mouth and high in fresh water) in other tropical rivers (Crook et al. 2017; Tran et al. 2021; Höpker et al. 2022). The ratios tend to be globally stable in the ocean (0.70918 ± 0.00006); however, they are often highly variable in river systems due to different river bedrock types (McArthur and Howarth 2004). Although, ratios of 87Sr:86Sr showed clear longitudinal concentration profiles in the ARB (constantly lower in the Ayeyarwady downstream, but higher in the upstream), they were not significantly different among regions (P > 0.05). The mean water 87Sr:86Sr was 0.7109 ± 0.0027 (range, 0.7074–0.7206) in the ARB. The concentration of these ratios in the ARB is slightly higher than in the Mekong River at 0.7102 ± 0.0011 (range, 0.7089–0.7139) (Tran et al. 2021), but much lower than in the Daly River catchment (Northern Territory, Australia) at 0.7334 ± 0.0218 (range, 0.7093–0.7806) (Crook et al. 2017). Some trace element concentrations (e.g. Sr, Ba, Ca, and Mg) significantly differed between the mainstem and tributaries (P < 0.05): the concentrations in tributaries were higher than in the mainstem. Similarly, another study showed that these ratios were substantially different between the mainstem (0.7198 ± 0.0078) and tributaries (0.7597 ± 0.0150) in the Daly River catchment (Crook et al. 2017).
The concentrations of trace elements varied considerably between river arms at the mouth, except for Ba and Ca. For example, concentrations of Sr and Mg in one river branch (A3) were much higher than in other branches (almost two and three times higher for Sr and Mg, respectively). River mouths are dynamic environments due to effects of both sea tides and river discharge. The Ayeyarwady River is strongly influenced by sea tides. Monsoon rains usually start in June to October, and water levels peak in July or August, when a large amount of river water is pushed to the sea. Meanwhile the dry season from November to May (winter and summer) results in the salt wedge moving further upstream into the delta. The Ayeyarwady Delta exhibited semidiurnal tidal regimes (two high and two low tides daily), which led to highly dynamic variation in water chemistry in the Ayeyarwady estuary. Hydrological regimes and salt penetration strongly exhibit seasonal and dynamic variation. Mean tidal ranges were observed over 3 m at the shoreline. Such dynamic variation was also observed in the Mekong estuary (Vu et al. 2021). Brackish water often penetrates about 80 km inland in the Ayeyarwady Delta, particularly during the dry season (Kravtsova et al. 2009; Sakai et al. 2021). Similarly, tidal range in the Mekong estuary was up to 3.74 m over a tidal cycle, hence brackish water was frequently pushed up to 50 km further inland (Gugliotta et al. 2017; Vu et al. 2021).
Although our study did not examine seasonal variation in trace element concentrations in the ARB, seasonal variation of water chemistry was found in the basin by other studies. For example, Chapman et al. (2015) showed that concentrations of some trace elements (e.g. Sr and Ca) in the dry season were relatively higher than the flood season, particularly at the Hinthada station (Ayeyarwady downstream) and Monywa station (Chindwin). This study also showed that elemental concentrations had a negative relationship with river discharge in the ARB. However, ratios of 87Sr:86Sr were relatively stable between seasons in the ARB, except the Ayeyarwady upstream (Chapman et al. 2015). Seasonal variation in water chemistry was also found in other river systems, particularly in tropical rivers (Fukushima et al. 2014; Crook et al. 2017; Vu et al. 2021). For example, there was a strong negative relationship between river discharge and Sr concentrations, while ratios of 87Sr:86Sr were positively related to river discharge (Crook et al. 2017; Peucker-Ehrenbrink and Fiske 2019). It is noted that large tropical rivers such as the Ayeyarwady, Mekong, Congo, and Amazon Rivers often exhibit strong seasonal variation in hydrology (Kravtsova et al. 2009; Castello et al. 2015; Laraque et al. 2020; Vu et al. 2021). Strong seasonal variation in hydrology is likely an important factor driving variation in water chemistry. Therefore, the concentrations of most trace elements (e.g. Sr, Ca, and Mg) in the dry season were higher than in the wet season, but 87Sr:86Sr ratios were higher in the wet season in the ARB (Chapman et al. 2015). Such trends were also observed in other tropical river systems (Crook et al. 2017; Vu et al. 2021).
Implications for fish migration studies
The ARB is home to over 600 fish species (Vidthayanon et al. 2005; Zöckler and Kottelat 2017), with many migratory species found in a wide range of environments (e.g. fresh, brackish, marine). Most knowledge of fish migration is anecdotal and based on local knowledge (Conallin et al. 2019). This is an important knowledge gap for fish migrations in the ARB. As a result, understanding fish migrations in the basin is crucial for better management and conservation. Otoliths and other calcified structures such as spines or eye lenses are widely used to reconstruct fish life histories, as these structures permanently incorporate trace elements from ambient water (Campana 1999; Elsdon and Gillanders 2006; Limburg et al. 2015). Therefore, it is suggested that variation in elements should be examined before such studies. Most common elements (Sr, including Sr:Ca; Ba, including Ba:Ca) and isotopes (87Sr:86Sr) as salinity proxies were used to trace fish movements and migrations (Walther and Limburg 2012). For example, life history strategies of many Mekong fishes were revealed by otolith chemistry, contributing to better management and conservation (Vu 2022).
Our study confirmed that Sr (including Sr:Ca) is the best indicator among elements to differentiate between marine and freshwater environments. For example, concentrations of Sr at a coastal site (A1) were 63-times higher than in a freshwater site further upstream (A33). Hence, these Sr concentrations show distinct longitudinal concentration profiles in the ARB. A recent study also showed that element:Ca ratios (e.g. Sr:Ca and Ba:Ca) were significantly different between spatial scales (up, middle, and downstream) or river orders (mainstem and tributary) in the upper Nu-Salween river (Tang et al. 2024). Ratios of 87Sr:86Sr could have more advantages over Sr and Ba for otolith chemistry studies (Crook et al. 2017), but we found that these 87Sr:86Sr ratios highly varied (0.7109 ± 0.0027; range, 0.7074–0.7206) in the ARB, lower in the Ayeyarwady downstream and Chindwin, and higher in the Ayeyarwady upstream. However, they were not significantly different among these regions (P > 0.05). Interestingly, we did not expect that concentrations of Ba at a coastal site (A1) would be over two times higher than in freshwater environments (A33). Although Walther and Thorrold (2008) suggested that using four markers such as Sr:Ca, Ba:Ca, 87Sr:86Sr, and d18O could geo-reference most fishes, we suggest that Sr (including Sr:Ca) alone or in combination with other elements as salinity proxies, should be used in otolith chemistry studies to understand fish connections in different salinity gradients in the ARB. The interpretation of fish movements using otolith chemistry data should be cautious because these suggested proxies varied seasonally to some extent (related to river discharge) (Chapman et al. 2015).
Declaration of funding
This study is supported by the Australian Centre for International Agricultural Research (grant number: ACIAR – FIS 041). Views and opinions expressed in this paper do not represent the views of the ACIAR. Additionally, ACIAR has no involvement in the data collection, manuscript preparation, or the decision to submit for publication.
Acknowledgements
We acknowledge Fauna and Flora International for organising fieldwork logistics and aiding in fieldwork. We thank the Department of Fisheries and Irrigation and Water Utilization Management Department staff for their data and information. We are grateful to Deanna Duffy, the Spatial Data Analysis Network, for making the sampling and elemental concentration maps. The Next Generation Water Engineering and River Management Hub is supported by the Australian Government Department of Education through the Regional Research Collaboration Program.
References
Campana SE (1999) Chemistry and composition of fish otoliths: pathways, mechanisms and applications. Marine Ecology Progress Series 188, 263-297.
| Crossref | Google Scholar |
Castello L, Isaac VJ, Thapa R (2015) Flood pulse effects on multispecies fishery yields in the Lower Amazon. Royal Society Open Science 2(11), 150299.
| Crossref | Google Scholar |
Chapman H, Bickle M, Thaw SH, Thiam HN (2015) Chemical fluxes from time series sampling of the Irrawaddy and Salween Rivers, Myanmar. Chemical Geology 401, 15-27.
| Crossref | Google Scholar |
Conallin JC, Baumgartner LJ, Lunn Z, Akester M, Win N, Tun NN, Nyunt MMM, Swe AM, Chan N, Cowx IG (2019) Migratory fishes in Myanmar rivers and wetlands: challenges for sustainable development between irrigation water control infrastructure and sustainable inland capture fisheries. Marine and Freshwater Research 70(9), 1241-1253.
| Crossref | Google Scholar |
Crook DA, Lacksen K, King AJ, Buckle DJ, Tickell SJ, Woodhead JD, Maas R, Townsend SA, Douglas MM (2017) Temporal and spatial variation in strontium in a tropical river: implications for otolith chemistry analyses of fish migration. Canadian Journal of Fisheries and Aquatic Sciences 74(4), 533-545.
| Crossref | Google Scholar |
Daverat F, Martin J (2016) Microchemical and schlerochronological analyses used to infer fish migration. In ‘An introduction to fish migration’. (Eds P Morais, F Daverat) pp. 149–168. (CRC Press: Boca Raton) 10.1201/b21321
Elsdon TS, Gillanders BM (2006) Temporal variability in strontium, calcium, barium, and manganese in estuaries: implications for reconstructing environmental histories of fish from chemicals in calcified structures. Estuarine, Coastal and Shelf Science 66(1-2), 147-156.
| Crossref | Google Scholar |
Elsdon TS, Wells BK, Campana SE, Gillanders BM, Jones CM, Limburg KE, Secor DH, Thorrold SR, Walther BD (2008) Otolith chemistry to describe movements and life-history parameters of fishes: hypotheses, assumptions, limitations and inferences. In ‘Oceanography and marine biology: an annual review. Vol. 46’. (Eds RN Gibson, RJA Atkinson, JDM Gordon) pp. 297–330. (CRC Press: Boca Raton) 10.1201/9781420065756
Fukushima M, Jutagate T, Grudpan C, Phomikong P, Nohara S (2014) Potential effects of hydroelectric dam development in the Mekong River Basin on the migration of siamese mud carp (Henicorhynchus siamensis and H. lobatus) elucidated by otolith microchemistry. PLoS ONE 9(8), e103722.
| Crossref | Google Scholar |
Gaillardet J, Viers J, Dupré B (2003) Trace elements in river water. Treatise on Geochemistry 5, 225-272.
| Crossref | Google Scholar |
Garzanti E, Wang J-G, Vezzoli G, Limonta M (2016) Tracing provenance and sediment fluxes in the Irrawaddy River basin (Myanmar). Chemical Geology 440, 73-90.
| Crossref | Google Scholar |
Gugliotta M, Saito Y, Nguyen VL, Ta TKO, Nakashima R, Tamura T, Uehara K, Katsuki K, Yamamoto S (2017) Process regime, salinity, morphological, and sedimentary trends along the fluvial to marine transition zone of the mixed-energy Mekong River delta, Vietnam. Continental Shelf Research 147, 7-26.
| Crossref | Google Scholar |
He S, Xu Y (2016) Spatiotemporal distributions of Sr and Ba along an estuarine river with a large salinity gradient to the Gulf of Mexico. Water 8, 323.
| Crossref | Google Scholar |
Höpker SN, Wu HC, Lucassen F, Sadio O, Brochier T, Nuworkpor IY, Kasemann SA, Merschel P, Westphal H (2022) Sr isotope ratios (87Sr/86Sr) in water and fish otoliths as estuarine salinity tracers: case studies from three NW African Rivers. Estuaries and Coasts 1780-1802.
| Crossref | Google Scholar |
Kraus RT, Secor DH (2004) Incorporation of strontium into otoliths of an estuarine fish. Journal of Experimental Marine Biology and Ecology 302(1), 85-106.
| Crossref | Google Scholar |
Kravtsova VI, Mikhailov VN, Kidyaeva VM (2009) Hydrological regime, morphological features and natural territorial complexes of the Irrawaddy River Delta (Myanmar). Water Resources 36(3), 243-260.
| Crossref | Google Scholar |
Krittasudthacheewa C, Bouckaert F, Apirumanekul C, Piman T, Vasconcelos VV, Maung W, Htwe KO, Aung MT (2021) Water quality in the Chindwin River Basin. In ‘Chindwin futures: natural resources, livelihoods, institutions and climate change in Myanmar’s Chindwin River Basin’. (Eds C Krittasudthacheewa, W Maung, L Lebel, R Daniel, V Hongsathavij) pp. 107–136. (Strategic Information and Research Development Centre: Petaling Jaya, Malaysia) Available at https://www.sei.org/wp-content/uploads/2021/09/chindwin-futures-e-book-small-size-for-download-sept-2021.pdf
Laraque A, N’kaya GDM, Orange D, Tshimanga R, Tshitenge JM, Mahé G, Nguimalet CR, Trigg MA, Yepez S, Gulemvuga G (2020) Recent budget of hydroclimatology and hydrosedimentology of the congo river in central Africa. Water 12(9), 2613.
| Crossref | Google Scholar |
Limburg KE, Walther BD, Lu Z, Jackman G, Mohan J, Walther Y, Nissling A, Weber PK, Schmitt AK (2015) In search of the dead zone: use of otoliths for tracking fish exposure to hypoxia. Journal of Marine Systems 141, 167-178.
| Crossref | Google Scholar |
McArthur JM, Howarth RJ (2004) Strontium isotope stratigraphy. In ‘A geologic time scale 2004’. (Eds AG Smith, FM Gradstein, JG Ogg) pp. 96–105. (Cambridge University Press: Cambridge) 10.1017/CBO9780511536045.008
Peucker-Ehrenbrink B, Fiske GJ (2019) A continental perspective of the seawater 87Sr/86Sr record: a review. Chemical Geology 510, 140-165.
| Crossref | Google Scholar |
Piman T, Krittasudthacheew C, Gunawardanaa SK, Shresthaa S (2020) Monitoring and modelling mining impacts on water quality in Chindwin River Basin, Myanmar. In ‘EGU General Assembly 2020, 4–8 May 2020’. (EGU2020-15824) 10.5194/egusphere-egu2020-15824
Pouilly M, Point D, Sondag F, Henry M, Santos RV (2014) Geographical origin of Amazonian freshwater fishes fingerprinted by ⁸⁷Sr/⁸⁶Sr ratios on fish otoliths and scales. Environmental Science & Technology 48(16), 8980-8987.
| Crossref | Google Scholar | PubMed |
Sakai T, Omori K, Oo AN, Zaw YN (2021) Monitoring saline intrusion in the Ayeyarwady Delta, Myanmar, using data from the Sentinel-2 satellite mission. Paddy and Water Environment 19(2), 283-294.
| Crossref | Google Scholar |
Stoot LJ, Baumgartner LJ, Butler GL, Thiem JD, Knowles BM, Doran GS (2024) Spatial variability in water strontium isotopes and trace metals from the Clarence River Basin, New South Wales, Australia. Hydrobiologia 851, 4371-4384.
| Crossref | Google Scholar |
Tang B, Ding C, Ding L, Zhao Y, Zhang M, Tao J (2024) Spatiotemporal variability and drivers of water microchemistry in the upper Nu-Salween river: with implications for fish habitat conservation. Environmental Research 252, 118754.
| Crossref | Google Scholar |
Tran NT, Labonne M, Hoang HD, Panfili J (2019) Changes in environmental salinity during the life of Pangasius krempfi in the Mekong Delta (Vietnam) estimated from otolith Sr:Ca ratios. Marine and Freshwater Research 70, 1734-1746.
| Crossref | Google Scholar |
Tran NT, Labonne M, Chung M-T, Wang C-H, Huang K-F, Durand J-D, Grudpan C, Chan B, Hoang HD, Panfili J (2021) Natal origin and migration pathways of Mekong catfish (Pangasius krempfi) using strontium isotopes and trace element concentrations in environmental water and otoliths. PLoS ONE 16(6), e0252769.
| Crossref | Google Scholar |
Vu AV (2022) Diversity in migration patterns of selected Mekong River fishes. Doctor of Philosophy, Charles Sturt University, Albury. Available at https://researchoutput.csu.edu.au/ws/portalfiles/portal/227418935/Diversity_in_migration_patterns_of_selected_Mekong_River_fishes_Full_PhD_Thesis.pdf
Vu AV, Baumgartner LJ, Doran GS, Mallen-Cooper M, Thiem JD, Howitt JA, Limburg KE, Gillanders BM, Cowx IG (2021) Variability in water chemistry in the Lower Mekong Basin: considerations for fish life history reconstruction. Estuarine, Coastal and Shelf Science 255, 107355.
| Crossref | Google Scholar |
Walther BD, Limburg KE (2012) The use of otolith chemistry to characterize diadromous migrations. Journal of Fish Biology 81(2), 796-825.
| Crossref | Google Scholar | PubMed |
Walther BD, Thorrold SR (2008) Continental-scale variation in otolith geochemistry of juvenile American shad (Alosa sapidissima). Canadian Journal of Fisheries and Aquatic Sciences 65(12), 2623-2635.
| Crossref | Google Scholar |
Zimmerman CE (2005) Relationship of otolith strontium-to-calcium ratios and salinity: experimental validation for juvenile salmonids. Canadian Journal of Fisheries and Aquatic Sciences 62, 88-97.
| Crossref | Google Scholar |
Zimmerman CE, Reeves GH (2000) Population structure of sympatric anadromous and nonanadromous Oncorhynchus mykiss: evidence from spawning surveys and otolith microchemistry. Canadian Journal of Fisheries and Aquatic Sciences 57, 2152-2162.
| Crossref | Google Scholar |