

Decision-science navigates trade-offs between environmental and socio-economic objectives for marine debris mitigation
Jutta Beher A * , Brendan Wintle B and Eric Treml A C D
A
B
C
D
Abstract
Marine litter is a growing global problem that impacts biodiversity and human societies alike. South-east Asia suffers significant impacts due to high biodiversity, dense human populations, and large volumes of plastics entering the marine environment, primarily through rivers.
Drawing on decision-theory principles, Structured Decision Making (SDM) can improve site selection for marine debris management by identifying the best options to reduce plastic exposure to species, ecosystems, and human populations in the marine and coastal environment, as well as an overall reduction of drifting plastic debris in the open ocean.
We combine an SDM framework with a plastic transport model and quantify benefits for environmental and social objectives across 542 locations covering 683 rivers along the coasts of south-east Asia in the biodiversity hotspot of the Coral Triangle. We modelled and quantified metrics for the reduction in volume and flow of plastics to all downstream coral reefs, key biodiversity areas, marine protected areas, and coastal communities.
No location is the best option across all objectives, but the multiple metrics help to navigate trade-offs across specific objectives. Despite 95% of all plastic debris remaining in circulation in the seascape after 2 months, several rivers contribute not only large volumes of plastic debris to the overall marine pollution but also large volumes of pollution downstream.
The increasing pollution of the marine environment with plastic debris can only be stopped by regulating and reducing the production of plastic products. However, as long as plastic debris is still circulating in the environment, the identification of these locations where the removal of plastic pollution will deliver the best outcomes for a set of important objectives will remain an important mitigation measure. The proposed framework effectively facilitates understanding existing trade-offs and can easily be adapted to include additional metrics or objectives. Using this framework enables decision-makers to develop a tailor-made prioritisation process for clean-up interventions in their unique socio-ecological contexts.
This new decision-science approach for identifying efficient spatial management strategies for plastic clean-up is transferable to any geography and has the capacity to enhance local-to-global plastic management.
Keywords: clean-up intervention, conservation planning, Coral Triangle, marine debris, plastic pollution, plastic transport model, river pollution, site selection, South-East Asia, Structured Decision Making.
Introduction
Plastic debris in the aquatic environment is a growing global problem. The current levels of financial costs of marine debris to national economies are significant and create an urgent need to find ways to reduce the impact of plastic pollution (McIlgorm et al. 2020). Damages from marine plastic to the economies across the Asia-Pacific have risen from an estimated USD1.3 billion in 2009 to USD10.8 billion in 2015 (McIlgorm et al. 2020). Losses of ecosystem services linked to marine plastic debris are estimated to be around 1–5% per year, which translates to USD3300–33,000 per tonne of debris, or USD500–2500 billion per year (Beaumont et al. 2019).
Plastic debris has been detected at every depth, from the surface down to the sediments of rivers and oceans (Williams and Simmons 1997; Cable et al. 2017; Lebreton et al. 2017; Bauer-Civiello et al. 2019; Choy et al. 2019; Barrett et al. 2020). Plastic debris entering the sea generally consists of a mix of micro and macro debris, with all pieces degrading over time (Chubarenko et al. 2020). All size classes of marine debris have the potential to interact with species and ecosystems, including injury and death (Wright et al. 2013; Fossi et al. 2014; Hall et al. 2015; Wilcox et al. 2015; Horton et al. 2017; Avery-Gomm et al. 2018a, 2018b; Lamb et al. 2018; Duncan et al. 2021; Pinheiro et al. 2023). In addition to the direct impact of plastic debris, there is a range of indirect impacts on ecosystems and species (Rech et al. 2018a, 2018b; MacLeod et al. 2021), and social values, including ecosystem services and human health (Beaumont et al. 2019; Campbell et al. 2019; Ragusa et al. 2021; Danopoulos et al. 2022).
Plastic production and pollution caused by mismanaged waste are projected to increase dramatically by 2030, resulting in over 6.3 billion tonnes of plastic waste being produced (Borrelle et al. 2020). Of the 20 million tonnes of plastic debris currently entering aquatic systems annually, 1.15–2.41 million tonnes enter through river systems (Lebreton et al. 2017; Borrelle et al. 2020). Active waste removal will remain essential to mitigate the impact of plastic debris leaking existing waste management streams into terrestrial and aquatic environments. However, there are limited resources to implement plastic waste removal, so understanding where the most effective places are to deploy removal efforts is essential.
Many studies quantify the volume of plastic debris that enters the aquatic environment (Geyer et al. 2017; Lebreton et al. 2017; Borrelle et al. 2020) and identify where it accumulates within the water column (Reisser et al. 2015; van Sebille et al. 2015; Hardesty et al. 2017; van Sebille et al. 2020). Other studies address the processes of prioritising the locations to remove large volumes of debris from the open ocean most efficiently (Sherman and van Sebille 2016). However, understanding the pathways from the source to the downstream sites where pollution impacts biodiversity and society is an emerging important field of research (Tessnow-von Wysocki et al. 2023). Despite promising first publications (Compa et al. 2019; Critchell et al. 2019), much more work is needed to include all relevant components of the problem. To better manage the plastic problem, we need the capacity to predict the entire plastic pathway, from the source of plastic debris entering the environment to the various downstream habitat destinations where the ecological and social impacts arise. Currently, no framework exists to quantify the predicted inflow of plastic debris to specific habitats downstream of the source of debris when selecting places for clean-up actions.
National governments, non-governmental organisations (NGOs) and local communities need to identify locations where the removal of plastic debris is feasible but also where the investment of time and budget are well justified. In many regions, thousands of locations can be selected for clean-up activities across the considered seascape. Assessing them all in detail is not possible and often, specific criteria are used to narrow down the options in a strategic way. Most plastic removal projects base their clean-up site selection on local characteristics, such as the existing volume of debris, the likelihood of waste mismanagement, local economies, and the level of support and motivation of local government (for example, https://plasticbank.com, https://theoceancleanup.com, https://ghostdiver.com, https://oceanconservancy.org/trash-free-seas/international-coastal-cleanup, https://seabinproject.com, https://cleancurrentscoalition.org, https://www.tangaroablue.org, https://marinedebris.noaa.gov/our-work/prevention, https://cleancurrentscoalition.org).
Unfortunately, none of these efforts use a formal prioritisation process based on sound decision-theory criteria and therefore lack the ability to consider the trade-offs between different objectives. A strategic site selection process that draws on insight from decision science can maximise positive outcomes for the environment and communities while minimising costs (time and money spent). A well designed site selection process can also capitalise on spatially explicit planning, robust decision science, and transparent risk analysis (Burgman 2005; Moilanen et al. 2006; Sarkar 2012; Widis et al. 2015; Sherman and van Sebille 2016).
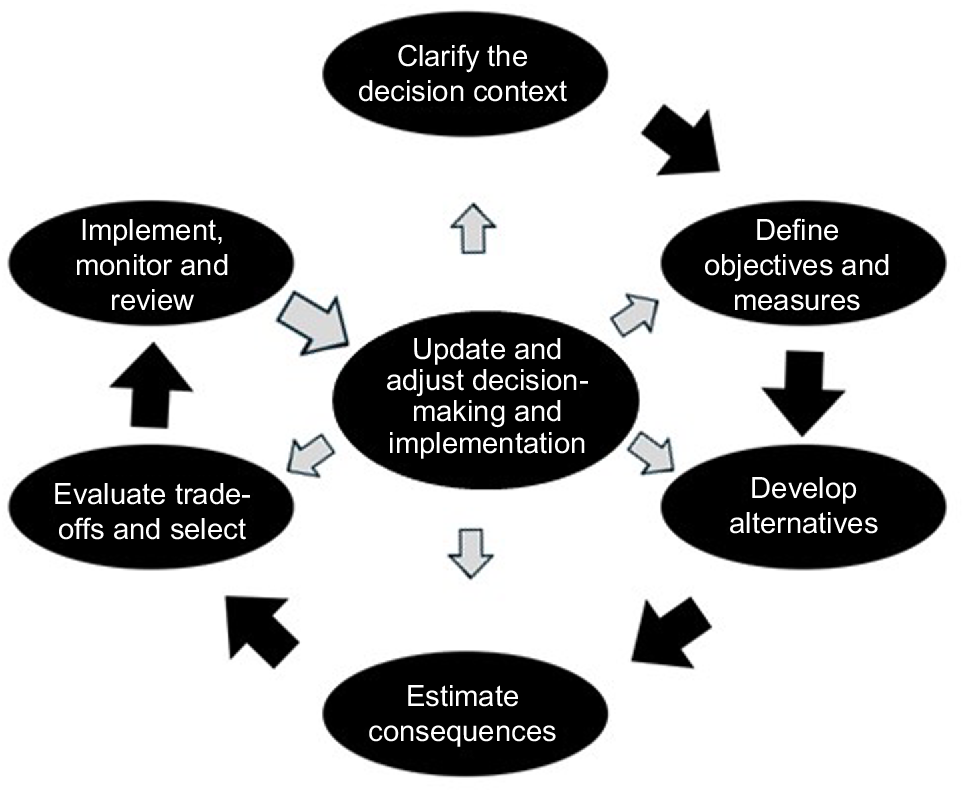
The framework of Structured Decision Making (SDM) (Gregory et al. 2012) has been developed to guide difficult decisions for environmental management and addresses many shortcomings of ad hoc prioritisation procedures (Game et al. 2013). The framework is also one important strategy to overcome the barrier of uncertainty when trying to inform policy (Rose et al. 2019), offering distinct steps that provide a transparent process of value-driven prioritisation (Fig. 1). In this paper, we apply SDM and spatially-explicit plastic debris modelling to achieve three main objectives:
Demonstrate the power and utility of Structured Decision Making in aiding in the marine plastic debris problem,
Create novel and quantitative metrics for evaluating the impact and feasibility of active debris removal, and
Illustrate this approach across the Southeast Asian seascape characterised by high biodiversity, dense human population, and high volumes of plastic pollution.
Structured Decision Making follows a stepwise planning strategy with the potential to feed gained insights back into future decisions of the same type. Adapted from Gregory et al. (2012).
Our research provides a blueprint on how to conduct a value-based site selection process for marine plastic mitigation in the form of clean-up interventions, including multiple social and ecological objectives and navigating trade-offs and co-benefits (Keeney 1992; Halpern et al. 2013).
Materials and methods
We apply the six steps of Structured Decision Making (SDM) (Fig. 1) to the problem of prioritising sites for removing plastic debris before it flows into the sea through clean-up interventions at source rivers (Silva et al. 2021). Below, we briefly describe each step of our application of SDM and then provide more details in subsequent sections.
Scoping of the decision context
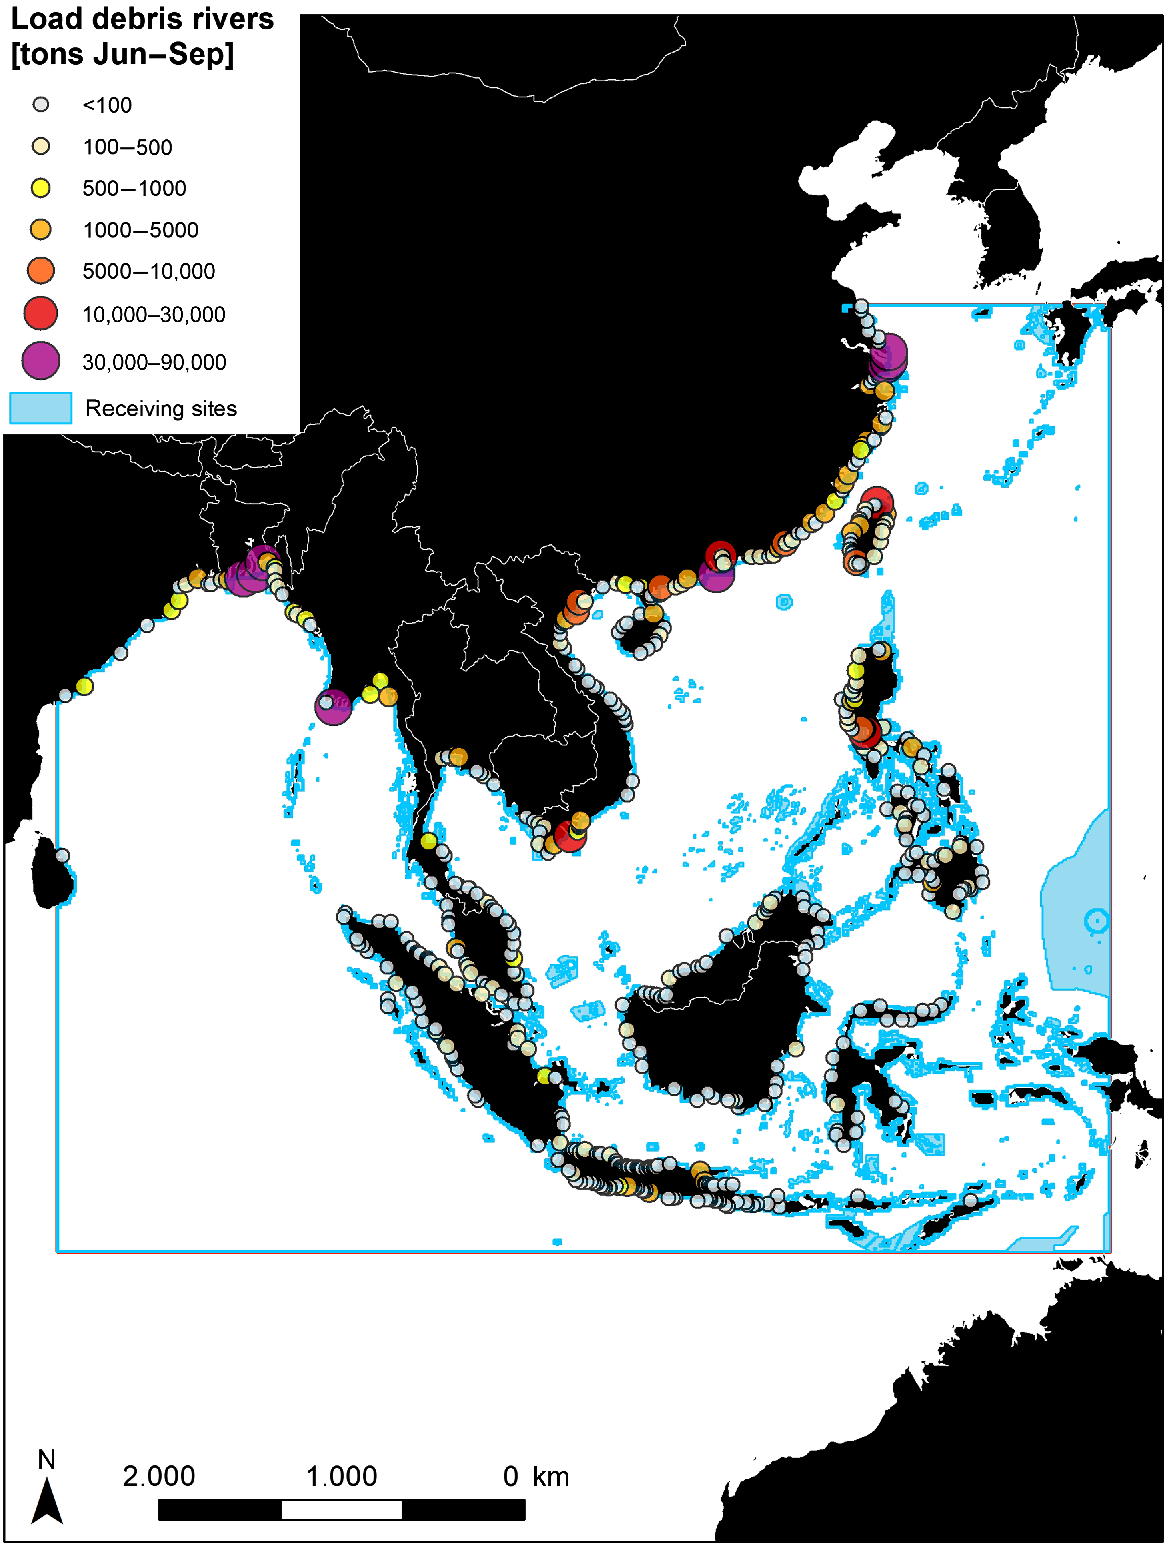
We expand the scope of current mitigation strategies that focus on volume reduction through clean-ups and include a focus on the downstream impact from specific sources. Our study is in south-east Asia, a global hotspot for population, pollution, and biodiversity. Over 90% of the global plastic discharge from rivers into the ocean comes from 122 rivers, of which the vast majority are located in this area (Lebreton et al. 2017). South-east Asia has also been identified as a global hotspot of oceanic plastic accumulation (Onink et al. 2021). The seascape around the Coral Triangle and the shoreline between the Bay of Bengal and the East China Sea (Fig. 2) is exceptionally biodiverse (Roberts et al. 2002). The population density in Asia is higher than in other parts of the world, and many Asian countries receive plastic imports from the international plastic waste industry, despite an often problematic waste management situation (Liang et al. 2021). The combination of large volumes of debris, high population density and high biodiversity creates the potential for high negative impacts. Conversely, there are also significant opportunities for interventions such as clean-ups, as well as likely trade-offs or co-benefits between environmental and socio-economic objectives. The UN listed the exploration of plastic debris trajectories within the seascape as one of the key challenges for the coming years. Furthermore, the movement and fate of plastic debris have emerged as one of the five most important research priorities for stakeholders in south-east Asia, along with environmental and socio-ecological impacts, possible solutions, description of pollution and regional policies (Omeyer et al. 2022).
Model domain in the Indian and Pacific Ocean. Receiving sites were delineated using available spatial data for coral reefs, marine protected areas, key biodiversity sites, and general coastline (UNEP-WCMC, WorldFish, World Resources Institute, The Nature Conservancy 2010; Birdlife International 2020; UNEP-WCMC and IUCN 2021). Volumes of plastic debris in rivers (symbolised by points) were summarised from Lebreton et al. (2017).
Our methods provide a quantitative overview of the key trade-offs for possible clean-up locations, helping to navigate the different benefits for ecological and social objectives and the political feasibility of implementation based on the geopolitical locations of source rivers and receiving sites (Galaiduk et al. 2020). Intercepting debris at a place with a small spatial footprint, like a river, is more cost-effective than targeting debris that has already reached the ocean (McIlgorm et al. 2020). As a result, The Clean Currents Coalition has launched an investment of 11 million dollars for trialling different methods to remove debris in nine rivers around the world (Silva et al. 2021), four of which are located in Asia.
Communication during the scoping phase of this modelling project validated the relevance of metrics and objectives for agencies that plan and conduct debris removal actions (personal communications with staff from Benioff Ocean Initiative and associated partners).
Defining objectives and metrics for site selection of mitigation actions
Clear and quantifiable objectives are essential for a targeted risk reduction of exposure of plastic debris to society and biodiversity. Candidate performance measures need to capture two relevant aspects of impact of a hazard like plastic debris, the type and the risk, in a clear and quantifiable way. The hazard type includes the presence of people and biodiversity that are susceptible to a negative impact at these sites. The likely exposure risk accrues from the volume of plastic debris and the passive transport routes from the river mouth to downstream sites.
The development of all relevant objectives require the consultation of key stakeholders in order to understand the values that matter in the decision-making process (Keeney 1992; Gregory et al. 2012). For example, communities likely value the onsite benefits of reduced exposure to plastic debris in their direct vicinity. However, NGOs and governments might also value comparing local impacts and ensuring equity across a larger region, and considering the feasibility of clean-up interventions as well as likely impacts downstream.
Here, we assume that the reason to mitigate marine plastic debris is to prevent a negative impact on both biodiversity and human society, while acknowledging that the feasibility of local clean-up interventions will vary for technical and political reasons. As a result, these assumptions require the development of multiple objectives.
Biodiversity is seen as valuable for its intrinsic value as well as its contribution to people in the form of ecosystem services. We defined ecological value through biodiversity and conservation-related features, such as species or habitats that are known to suffer negative impacts from plastic debris, in particular coral reefs, marine protected areas and key biodiversity areas. The related objective is to reduce the impact of plastic pollution on the currently existing features.
Demographic groups that live in polluted areas and depend on subsistence fisheries are particularly at risk of a negative impact of plastic debris on health and well-being. Large parts of the population in the Coral Triangle and south-east Asia depend highly on coral reefs (Burke 2011). Therefore, we quantify social value using population density as a proxy (Center For International Earth Science Information Network-CIESIN-Columbia University 2017). The related objective is to reduce the impact of pollution for as many people as possible.
Regarding technical and political constraints, we included two aspects of logistics: (1) minimise the number of rivers that would need to be cleaned to reduce the volume of inflowing plastic debris; and (2) minimise the political complexity related to the number of jurisdictions that are exposed to plastic pollution from a particular source (Galaiduk et al. 2020).
Based on these assumptions, we adopt the objectives of ‘maximise the benefits (for each of the socio-economic and environmental metrics), while minimising the constraints (feasibility-related metrics)’ to identify source rivers where management actions and clean-ups could be implemented. We developed multiple metrics to capture the important nuances of these objectives.
The contribution of clean-up actions towards our different objectives depends on how the impact is measured. We developed multiple metrics to capture the nuances of site-specific impacts of different clean-up locations at the source (Table 1). For site-specific impact downstream, two metrics of pollution were used: reduction expressed in total volume and expressed as a percentage. Both are needed to make an informed choice of relative benefits that a local clean-up intervention would provide. For example, when comparing two options that reduce the same amount of downstream pollution, the percentage can inform if the difference is likely of broader social and ecological relevance. At the same time, when two options provide the same percent reduction at a downstream site, the amount of volume can identify the more valuable option. As a transparent benchmark, we considered downstream impact within 2 months of plastic release, acknowledging the potential long-term benefits of reducing the volume of plastic debris at the source.
| Objective | Metric | Sub-objective (habitat types) | |
|---|---|---|---|
| General impact statistics | (t) Impact at source river, see Eqn 4 | ||
| (t) Downstream impact across all sites, see Eqn 3 | |||
| (%) Fraction of the river load that pollutes sites across system | |||
| (n) Sites impacted by this source | |||
| (km2) Area impacted (across all sites) | |||
| (n) Sites this source is the main source of pollution | |||
| Impact for environmental objectives | (t) Volumetric impact downstream, see Eqn 2 | Reef | |
| KBA | |||
| MPA | |||
| Coast | |||
| (%) Reduction in pollution across sites and area, see Eqn 1 | Reef | ||
| KBA | |||
| MPA | |||
| Coast | |||
| (n) Sites with reduced pollution | Reef | ||
| KBA | |||
| MPA | |||
| Coast | |||
| (km2) Area with reduced pollution | Reef | ||
| KBA | |||
| MPA | |||
| Coast | |||
| Impact for social objectives | (n) Impact of a river on number of people within 8 km2 vicinity | ||
| (n) River as main source of pollution for number of people within 8 km2 vicinity | |||
| Feasibility | (n) Technical feasibility: number of source rivers with large contribution to site pollution, width of estuary | ||
| (n) Political feasibility: number of EEZ impacted |
KBA, key biodiversity area; MPA, marine protected area.
In summary, trade-offs are expected between the precent reduction and total volume of reduction of pollution impacting individual downstream sites, the sum of all reduction across all downstream sites and the reduction of total plastic entering at the source. To quantify the magnitude and type of impact that a management action can have, and identify key trade-offs, we investigated 14 different metrics across four objectives (Table 1). The exact method to calculate more complex metrics is described in section Estimate consequences of alternative management actions in subsection Calculation of ecological impact.
Develop realistic alternatives
Across our study area, we use all major river mouths as potential plastic sources and management opportunities. We only included major rivers with a minimum input of 65 tonnes per year (Lebreton et al. 2017) to justify investment in long-term management (Benioff Ocean Initiative 2019), which resulted in 683 rivers in the region included in the model. These 683 rivers are estimated to discharge 700,000 tonnes of plastic into the ocean between June and September of each year (Lebreton et al. 2017). These volumes and time periods for all rivers were included in the model. For the Rivers Ganges and Yangtze with estuaries wider than 100 km, we divided the discharge among three equidistant points along the estuary to represent the geographic variation in flow. In total, 542 source cells in the model domain contained river mouths with plastic where clean-up interventions could take place resulting in downstream impacts.
Estimate consequences of alternative management actions with a plastic transport model
To quantify the consequence of clean-up intervention at all 542 locations, we calculated the 14 impact metrics aligned with our objectives (Table 1) by tracking the passive transport of plastic debris through ocean currents from these source locations through the seascape. We developed a plastic transport model to quantify downstream impact. We provide a more detailed description of data preparation in the Supplementary material S1.
The model domain (Fig. 1) was divided into a grid of 721 × 649 cells with an 8-km × 8-km resolution. We used publicly available spatially explicit data on reefs, protected areas and key biodiversity areas to create distinct sites of biodiversity value within the seascape (UNEP-WCMC, WorldFish, World Resources Institute, The Nature Conservancy 2010; Birdlife International 2020; UNEP-WCMC and IUCN 2021). Values for the area of all occurring features (coastline, reef, marine protected area, and key biodiversity area) were extracted for each cell, split for unique combinations of overlap, such as individual features (for example, the area covered by a reef), or any combination (for example, the area covered by a reef within a protected area). Neighbouring cells containing the same type of environmental features were aggregated to sites with a unique ID number. We included the general coastline in the delineation of sites as coastal areas function as a general sink for marine debris (Martin et al. 2020; Schernewski et al. 2020). This resulted in 4444 sites that could receive inflowing plastic debris. Of these, 617 sites contained key biodiversity areas, 1047 protected areas, 1701 reef, 2922 coastline, and 10 sites represented the borders of the modelled seascape. We assigned a social value to each site by extracting gridded population density within the boundaries of each site. We added the habitat properties and human population of a surrounding one-cell neighbourhood for each individual site to deal with the inherent limitation of cell size and placement of grid cell walls. Because of these limitations, results are not meant to be used at the scale of individual receiving sites but need to be interpreted at a more regional scale.
We developed a spatially explicit advection-transport model to quantify the impact of implementing clean-up actions at each of the 542 source rivers on pollution of the source site itself, the ocean, or downstream sites. Our model was based on: (1) the location of the rivers as the source of plastic debris; (2) the downstream sites for which inflow should be measured described in section The model domain; (3) the volume of debris that the source rivers discharge into the sea; (4) the characteristics of floating particles; (5) the dates of specific release events; and (6) drift time duration.
Over 70% of the debris carried by rivers to the Asian seascape each year gets discharged between May and October (Lebreton et al. 2017). We released a cloud of virtual plastic debris from each source river during each week of the months of June, July, August, and September for each year between 2005 and 2015, matching the time frame of the published debris data (Lebreton et al. 2017).
Following the release of the cloud of plastic debris, it was allowed to be transported downstream by ocean currents. We tracked the clouds of virtual plastic debris in 3-hourly time steps through the flow field (Treml et al. 2012, 2015; Waruszewski et al. 2018, see Supplementary material S2). Whenever any fraction of debris released from a source reached a receiving site, a connection between the source and the receiving site was recorded.
Model parameters of local-scale turbulence and the entrapment rate determined how much debris was caught on downstream habitat patches after a minimum drift time of 12 h to avoid overemphasis on settlement at the source locations. The entrapment rate included any interaction with wildlife, such as intake or entanglement, or settlement on habitats or beaches. Each simulation was stopped 60 days after the release date, and all debris ending up on downstream sites was tallied. We used a travelling period of up to 60 days to identify strong short-term impacts of pollution. A pilot run indicated travel distances over 2000 km are possible within this time frame. All recorded connections between source rivers and downstream sites of value within the tracked 60 days were recorded in a connectivity matrix and used for further analysis (see section Calculation of ecological impact).
Due to uncertainty in the volume of plastic inflow, entrapment rate, and the specific depth of debris in the water column during travel time in the ocean, we performed a simple sensitivity analysis with eight scenarios. Uncertainty around the volume of plastic debris in the source rivers was explored in one scenario for average and one scenario for high model estimates (Lebreton et al. 2017). Uncertainty around the depth of debris in the water column and the entrapment rate is a consequence of the variety of sizes and shapes of different items in a cloud of debris.
The uncertainty around the specific depth of plastic particles in the water column stems from the unknown composition of different sizes and buoyancy of plastic debris items. All size classes, from macro to nano debris, are likely to be present in the rivers at any point in time. In addition, the composition of different size classes will change over time as the shedding of smaller particles is an ongoing process. Knowledge of how particle size and shape determine the floating and mixing behaviour of individual units of debris in the water column can inform the choice of ocean current data at a specific depth (Chubarenko et al. 2016; Khatmullina and Chubarenko 2019). This uncertainty was explored with two scenarios: one using currents in the surface only (top 1 m), and a second using the top 25 m from the HYCOM ocean circulation model (Chassignet et al. 2007).
The uncertainty about how much debris was caught on downstream habitat patches was explored through one scenario assuming a higher entrapment rate of 30% per day and one scenario with a lower likelihood of 2% plastic settlement per day. The ensemble of eight scenarios produced source-to-destination links of marine debris for every release from every river for all weeks across all years.
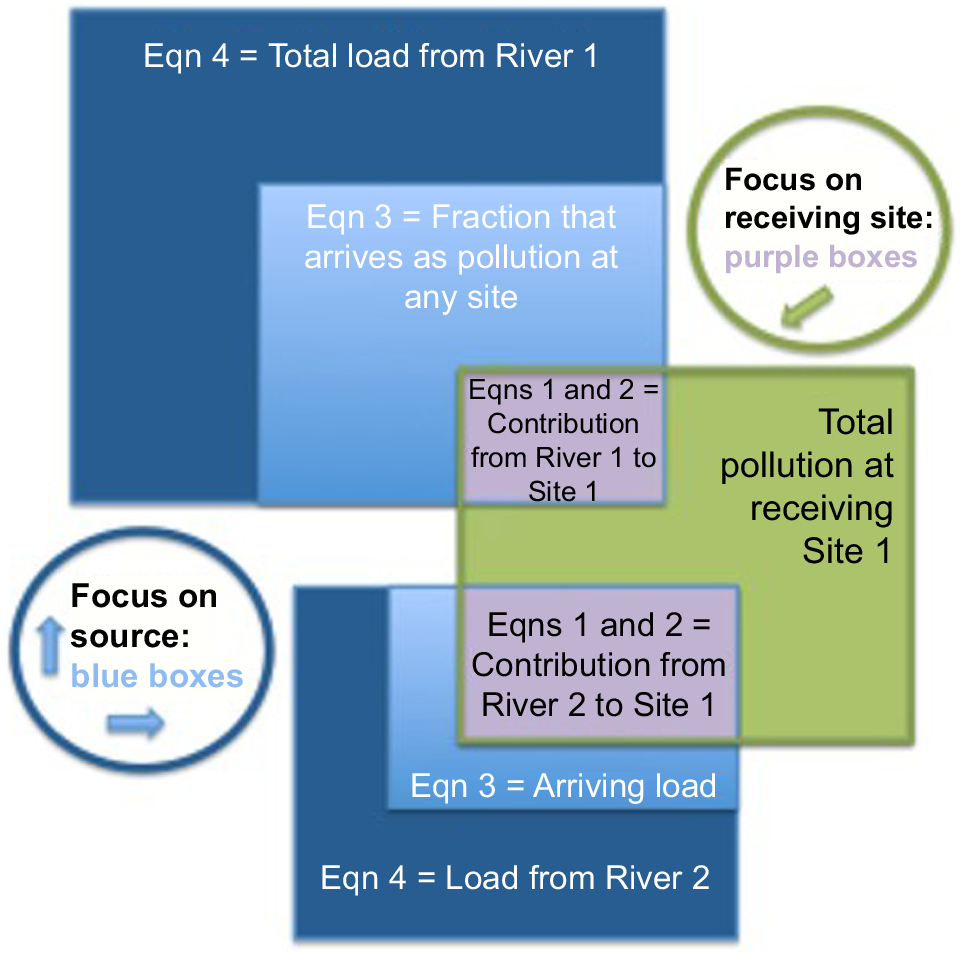
Based on the output of the advection transport model output, we calculated four metrics related to different strategies of prioritisation of clean-up interventions at source rivers (Eqns 1–4, Fig. 3).
Relative Impact (Eqn 1)
Prioritise source rivers that contribute large relative amounts of pollution to specific receiving sites by calculating the relative contribution this river made to the total pollution of any specific receiving site.
Volumetric Impact (Eqn 2)
Prioritise source rivers contributing a large volume (metric tonnes) to specific receiving sites by calculating the contribution this river makes to the total pollution of any specific receiving site.
Total downstream Impact (Eqn 3)
Prioritise source rivers contributing a large volume to the total downstream pollution across all receiving sites by summing up arrivals across all downstream sites.
Impact at source and open ocean (Eqn 4)
Prioritise source rivers with high load of debris by using available data on loads of plastic pollution in metric tonnes.
Example of metrics for different strategies to reduce the impact of plastic debris. Current mitigation planning focuses on source-centric metrics (in blue). Our study highlights the importance of including metrics for a specific type of impact downstream of the source of pollution. The conceptual diagram highlights that destination-centric metrics will rank sources based on a much smaller fraction of their total pollution load by counting only the volume of pollution accumulating at places of value. Each river is modelled with a specific total load of debris (Eqn 4), of which a specific fraction arrives via passive drift at a destination site within the modelled time (Eqn 3). Most sites receive debris from multiple rivers. Therefore, the contribution of a river to a specific site can be calculated as the contribution in percent (Eqn 1) or volume (Eqn 2) of one source to the total inflow of pollution at this specific receiving site.
We calculated each metric for the three environmental objectives (reduce the impact on reefs, protected areas and key biodiversity areas). For each source river, we could identify all downstream sites with the occurrence of each habitat type and the quantities of pollution that would accumulate there. Based on this information, we subset and ranked individual source sites for relative and volumetric impacts on each habitat type.
We expanded on the metrics for ecological impact to calculate the expected social impact by discounting Eqns 1–3 based on the relative number of people who would benefit from reduced exposure to pollution at each receiving site. Population density data were derived from a 5-km × 5-km grid of global population densities and summed up for an 8 km buffer around each receiving site. The size of the buffer equates to an expansion of each site of one additional grid cell into all directions, under the assumption that people in poverty who depend most on fishing and other ecosystem services can access the coastline within 8 km on foot on a daily basis (Burke 2011), and people visit closer sites more likely in their leisure time than sites that require longer travelling. Population density was relativised to the maximum value across sites in the seascape (240.595 people per km2 at one site). The social impact at receiving sites was calculated by multiplying impact metrics for biodiversity at these sites (metrics 1–3 above) by the relative population density within 8 km.
To identify which receiving sites were most feasible to manage, we used two metrics: one related to technical feasibility and one related to political feasibility. Regarding technical feasibility, we assumed that the less source rivers need to be cleaned up to reduce the inflowing plastic debris at a receiving site to a desired level, the less infrastructure and resources would be required to establish long-term management for waste removal. Therefore, we used the number of source rivers as a metric for technical feasibility.
We defined political feasibility as the trans-jurisdictional impact of debris dispersal and measured it by overlaying the impacted receiving sites of each source river with a map of the world’s Exclusive Economic Zones (Flanders Marine Institute (VLIZ), Belgium 2019). The overlay returned the number of countries that would be involved when managing the source of plastic debris to reduce impact at individual receiving sites, which we used as metric for political feasibility.
We discuss the implications for regional and international management options under the assumption that management for polluted sites is easier when fewer rivers contribute a large fraction of the total pollution at a receiving site and the source is located in the same jurisdiction. For our case study, we used the number of main pollution sources to the most polluted downstream sites in an intermediate step for selecting the most promising locations for clean-up interventions (see Supplementary material S3 and S4). The number of countries involved in planning and implementing a clean-up at relevant sources was used as a metric in the consequence table assessing the trade-offs between the selection of most promising locations (Tables 1 and Supplementary material S3 and S4).
Most metrics needed specific parameters to be calculated, which we produced using network analysis. Our networks consist of a set of nodes representing source rivers and receiving habitats or sites, and all the connections between them representing the volume of plastic flow from sources to destinations. Each scenario returned a set of adjacency matrices that showed: (1) the probability of a connection between a source node and a receiving site downstream; and (2) the relative volume of debris that drifted from each source to each receiving location.
The different matrices were used to create the network model depicting the source-destination dynamics of plastic debris across our seascape (Urban and Keitt 2001; Treml et al. 2015). We used the package igraph (Csardi and Nepusz 2006) in the software R (R Core Team 2020) to complete all network analysis (Fig. 3, Eqns 1–3).
The following parameters in our impact metrics were derived from the plastic transport model (see annotated R-code on figshare and Supplementary material for more details):
The probability of a connection between a source point (river mouth) and a receiving site. A connection was recorded whenever plastic particles from a source reached any receiving site location. The output is an adjacency matrix containing values for the probability of a connection. This parameter was used in the calculation for metrics regarding downstream impact in volume and percent of pollution.
The inflow of all debris from each source river to each individual destination site in tonnes per year. This metric was used to identify sites that receive large quantities of debris from specific rivers. The output was an adjacency matrix containing values for the strength of a connection.
The count of how many source rivers contribute to the pollution of each receiving site. The count was produced by summarising source locations for each receiving site from the adjacency matrices.
For the calculation of feasibility metrics, we derived:
Evaluating trade-offs to prioritise clean-up locations
The set of impact metrics allows an evaluation of the inherent trade-offs and co-benefits between the reduced impact on biodiversity, reduced impact on the coastal population, reduced inflow of debris into the ocean, and feasibility-related characteristics of clean-up sites. In order to evaluate key trade-offs and assess how assumptions and objectives impact the ranking of clean-up locations, we used a consequence table, which is a standard tool within SDM (Gregory et al. 2012). The table shows how well the alternative clean-up sites satisfy each objective and metric, highlighting the trade-offs across objectives. We present results from the average modelled flow across all release events in all years, depths, and settlement rates, for the average modelled load of rivers and a drift time of 60 days.
Implementation and monitoring
Through the framework presented here, managers across the seascape have the capacity to efficiently identify optimal management actions for reducing the impact of plastics. Although this sixth step is outside the scope of this study, management authorities can use the provided information, maps and concepts to understand the complexity of different options. Once they have made a choice and implemented a clean-up intervention at a site, they can re-enter the decision process with new information whenever monitoring results indicate that the expected benefits are not achieved, enabling a more adaptive management approach.
Results
Sixty days after entering the ocean during each release across all source rivers, the vast majority of the 700,083 metric tonnes of plastic debris remained adrift in the modelled seascape, 34,433 tonnes (5%) had entered receiving sites downstream, and only 641 tonnes had drifted out of the domain. The transport model identified 120,479 individual connections between source rivers and downstream sites with substantial differences in the volume of debris (Supplementary material S2 Fig. S1).
Ranking source rivers in parallel for each metric highlights not only locations that have a high impact for individual objectives but also those that rank high for multiple objectives. The parallel ranking can quickly narrow down options to a manageable quantity that deliver high impact for one or more objectives (Supplementary material S3 and S4).
Identifying locations for high impact mitigation actions
The parallel ranking and the comparison of the individual metrics for sources in general and main sources for most polluted sites in particular highlighted several sources for which clean-up interventions could provide large benefits for several objectives. In the following, we provide further detail of the decision process comparing multiple criteria for each of the following options for clean-up locations: the Modaomen Shudao Channel and the Yangtze River in China; the River Ganges in India and Bangladesh; the Irrawaddy River in Myanmar; the River Song Hau in Vietnam; and the Pasig River in the Philippines.
The Modaomen Shudao Channel in China (#146) provides co-benefits for all objectives except for the total sum of inflowing debris across all downstream sites. The channel carries the third largest load of pollution in the seascape. The three source points in the Yangtze River estuary (ID #195, 196 and 197) and the source points from the estuary of the River Ganges (#15, #16 and #17) carry the largest volume of plastic debris (impact at source, Eqn 4), but are not among the most relevant rivers for coral reefs or overall contribution to downstream pollution (Supplementary material S3).
The River Song Hau in Vietnam (#95) and Irrawaddy River in Myanmar (#29) rank highly for all objectives except for the total sum of inflowing debris across all downstream sites and either Key Biodiversity Areas or Marine Protected Areas. The Pasig River in the Philippines (#255) has the highest rank for impacting coral reefs, both for the most polluted reef site as well as pollution across all impacted reefs, and also ranks high in terms of volume of debris. Coral reefs started to appear from rank 45 of the most polluted sites (Supplementary material S4), where a small reef of 2.4 km2 within a site of 320 km2 in the Philippines was polluted by an annual inflow of 159 tonnes of plastic debris by the Pasig River draining into the Bay of Manila. The high value of coral reefs for biodiversity and many coastal communities can be used to justify the inclusion of the most important source of pollution for this ecosystem despite the lower ranking for some other objectives (Supplementary material S3).
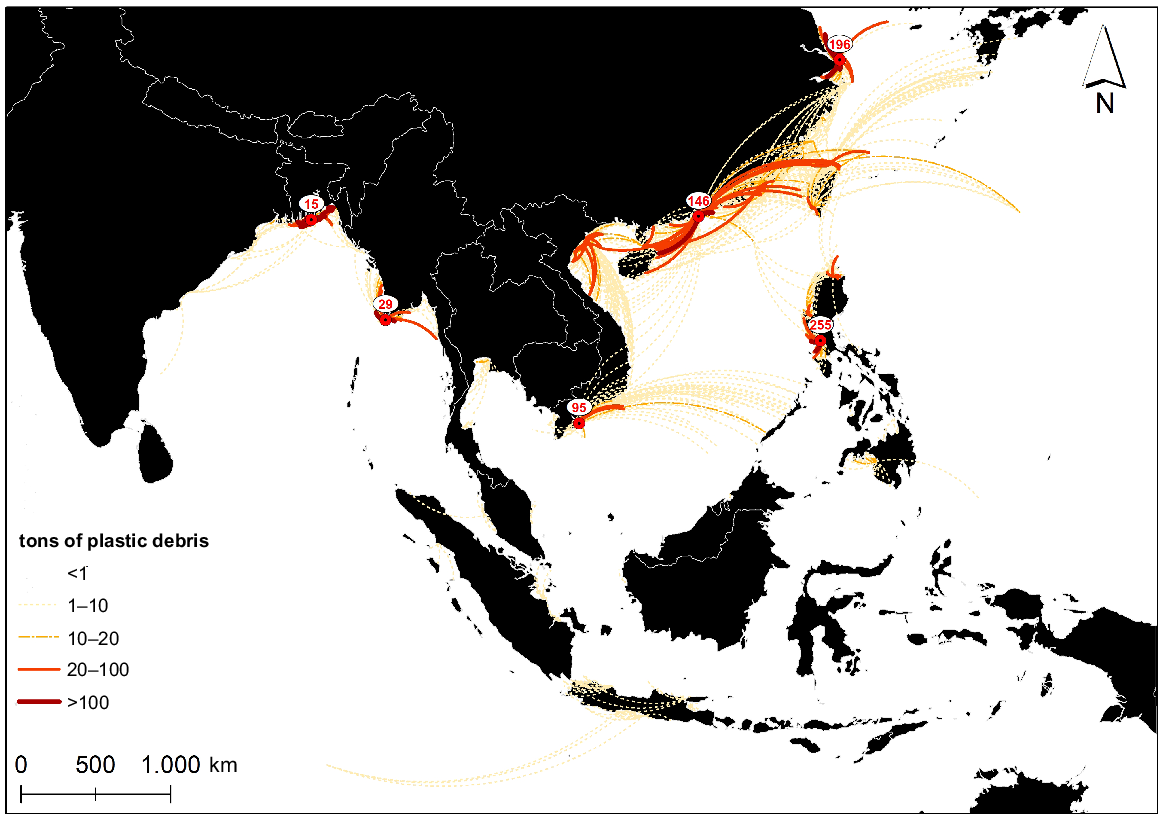
Mapping the trajectories of plastic debris from all source rivers to all downstream sites shows clear geographical patterns, with several sources standing out that impact the seascape with large volumes of debris over larger distances (Fig. 4). Tailor-made maps can help to understand the context for specific objectives. For example, mapping the top 30 sources, pathways, and impacted sites for different objectives (Tables S1 and S2 in Supplementary material S3 and S4) highlights differences and similarities between the different metrics (Fig. S2 Supplementary material S3) or habitat types (Fig. S3 Supplementary material S3).
Among the 542 source rivers, only a few stand out that contribute large amounts of pollution to individual downstream sites. Pollution is travelling substantial distances of several hundred kilometres within 2 months, especially along the coast of China. The six rivers that rank high for multiple objectives are all sources of the strongest pollution trajectories in the seascape, here marked up with their ID numbers. The strong pollution pathways out of the north of Vietnam are attributed to source rivers #123 and #126, which both rank high but for slightly fewer objectives than the six rivers analysed in more detail (see Table S2 Supplementary material S4).
The top 30 rivers that carried the highest load of debris (impact at source) were distributed in seven countries: the mainland in China, Taiwan, Thailand, India, Bangladesh, Myanmar, and the Philippines (Supplementary material S3, Fig. S2, panel a). The 30 rivers that contributed the most to downstream site pollution (total downstream impact across all sites) were distributed in five countries because the rivers with high load in India and Thailand were not contributing as much to downstream pollution compared to several additional rivers in China and Taiwan (Supplementary material S3, Fig. S2b). The most polluted sites (volumetric impact) were strongly clustered along the coast of Myanmar, Bangladesh and China, around the three rivers with the largest loads (Ganges, Yangtze, and Modaomen Shuidao Channel; Supplementary material S3, Fig. S2c). In contrast, the sites with the highest combination of pollution and human density were found throughout the entire seascape (Supplementary material S3, Fig. S2d), with some important sources with less total load.
The majority of the 30 most polluted sites for reefs, marine protected areas and the general coastline were located along China’s and north Thailand’s coast (Supplementary material S3, Fig. S2). Important additional countries or regions were the Philippines for reefs, key biodiversity areas and marine protected areas, Myanmar for reefs, key biodiversity areas and marine protected areas, the south of Thailand for reefs, Bangladesh for all but for reefs, Myanmar for all but the general coastline, and India for Marine protected areas (Supplementary material S3, Fig. S3). Some sites with reefs, marine protected areas, and the general coastline received high loads from source rivers several hundred kilometres away. For example, #146 pollutes reefs up and down the coastline with more than 20 tonnes of debris over a distance of over 700 km and almost 60 tonnes over a distance of over 200 km. River 255 has several strong connections to reef sites with a flow between 40 and 117 tonnes.
Feasibility related metrics: discharge and benefits by country
The Yangtze River (#196) and Modaomen Shudao Channel in China (#146), the River Song Hau in Vietnam (#95), the River Ganges in India and Bangladesh (#15), the Irrawaddy River in Myanmar (#29) and the Pasig River in the Philippines (#255) all impact additional jurisdictional zones, but to very different degrees (Fig. 5). The knowledge of international connections between sources of plastic debris and impacted habitats can be a key factor in fostering collaboration and meaningful strategic regional planning not confined by borders.
The six rivers that are important for multiple objectives are shown in panels (a)–(f). The Exclusive Economic Zones affected by their downstream pollution are in grey. The percent contribution of the total inflow of plastic debris to individual downstream receiving sites can be used to identify how the benefits are distributed across different jurisdictions.
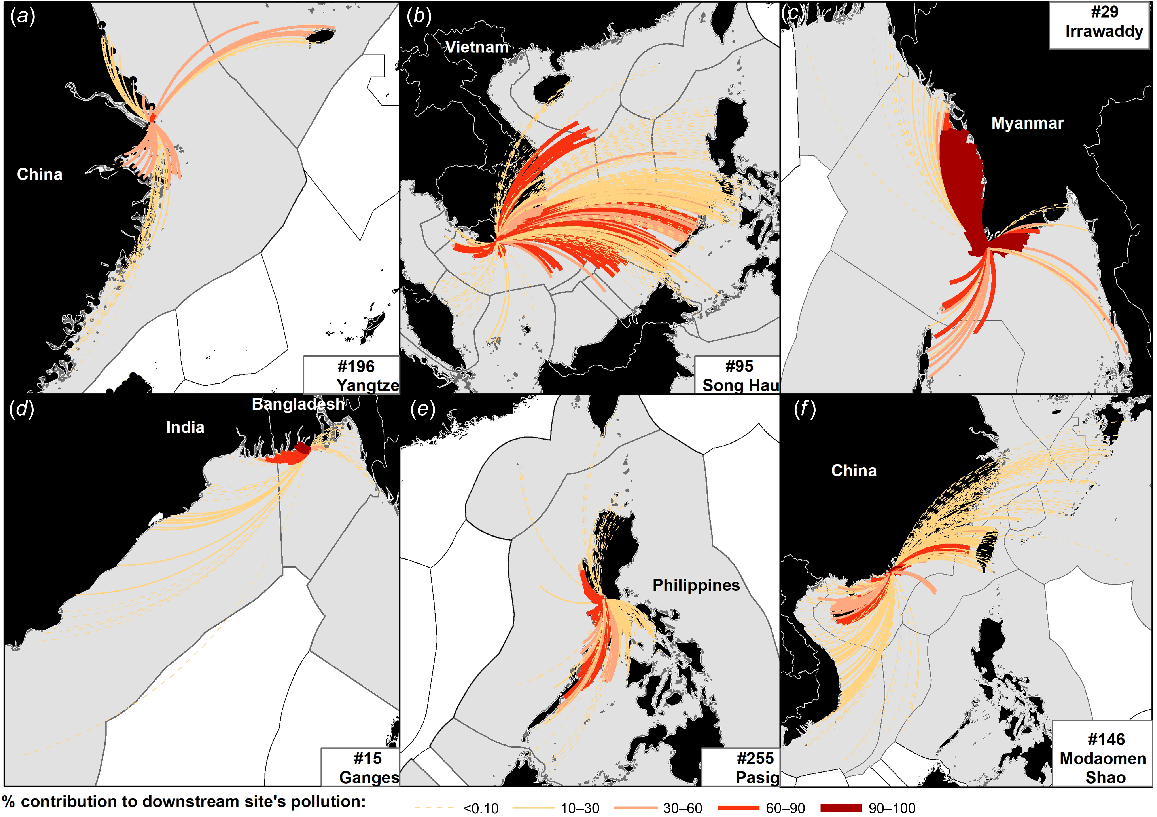
For example, even though carrying one of the highest loads of debris of all rivers in the seascape, the Yangtze River pollutes only sites within two Economic Exclusion Zones (EEZs), China and South Korea, contributing large fractions to the inflowing debris at multiple sites in both countries (Fig. 5a).
The River Son Hau in Vietnam (source ID #95) seems to be a less feasible case to target clean-up actions (Fig. 5b), as the pollution from the river gets scattered across ten different jurisdictions, contributing 60–90% of the inflowing plastic debris in many individual sites. Despite the large cuts in pollution inflow, it might not be tempting for Vietnam to invest in clean-up technology when most of the benefit is gained abroad.
Several sites in India receive 60–90% of the incoming debris from the Bangladeshi side of the River Ganges delta (source ID #15, Fig. 5c). As the River Ganges flows through both countries and the estuary stretches across the border, there might be opportunities and incentives for joint investment. If Bangladesh would aim to intercept debris at this specific location within the estuary, it could reap the most benefits within its own jurisdiction.
Meanwhile, the Pasig River (#255, Fig. 5d), draining into the Bay of Manila, primarily pollutes sites of value within the Philippines’ EEZ, with only weak connections to two other EEZs. Therefore, clean-ups at this location might provide a feasible and highly beneficial opportunity for this region to reduce plastic pollution levels for the environment and people.
Highlighting trade-offs with a consequence table
The most promising source rivers for management can be compared across all metrics in parallel to understand the trade-offs for all objectives and type of impact (Table 2). A detailed investigation across all metrics for the six candidate rivers suggests there is no clear best or worst option and therefore requiring managers to make trade-offs based on what they consider most important. The Yangtze River carries by far the greatest volume of debris and contributes the largest volume of debris into downstream sites. If reduced at this source, it could cut downstream pollution to all key biodiversity areas by 18% and the general coastline by 15%, yet other source rivers would be better at reducing impacts on coastal populations or coral reefs. The area and number of sites that benefit is also substantially smaller than the area that would benefit from other clean-up options. A clean-up intervention at the Ganges in India could reduce pollution into Marine Protected Areas by 16% (the single best benefit to MPAs) and into Key Biodiversity Areas by 8%. Meanwhile, River Song Hau in Vietnam would be the best option to benefit the highest number of sites (412) and the largest area overall, and also strongly benefits populations. However, these benefits are distributed over 10 nations, which might reduce the motivation of the Vietnamese government to invest in clean-up. In addition, the total volume at this source is relatively small compared to the other top-five rivers. Finally, the Pasig River and Modaomen Shao Channel rank second across multiple social and environmental objectives, as well as general statistics, however, with reduced technical challenges that are expected in the enormous estuaries of the Yangtze River and the River Ganges.
| Metric | Habitat type | 15 River Ganges (India/Bangladesh) | 29 Irrawaddy River (Myanmar) | 95 River Song Hau (Vietnam) | 146 Modaomen Shao Channel (China) | 196 Yangtze River (China) | 255 Pasig River (Philippines) | ||
|---|---|---|---|---|---|---|---|---|---|
| General impact statistics | Eqn 4: Impact at source river (t) | 35,420 | 31,242 | 16,893 | 59,003 | 82,921 | 25,992 | ||
| Eqn 3: downstream impact across all sites (t) | 1765 | 1460 | 527 | 2945 | 5508 | 1731 | |||
| Fraction of the river load that pollutes sites across system (%) | 5 | 5 | 3 | 5 | 7 | 7 | |||
| # sites impacted by this source | 69 | 110 | 412 | 396 | 95 | 238 | |||
| Area impacted (across all sites) (km2) | 32,768 | 31,104 | 213,056 | 163,200 | 38,656 | 113,344 | |||
| # sites this source is the main source of pollution | 18 | 75 | 175 | 82 | 35 | 106 | |||
| Impact for environmental objectives | Eqn 2: volumetric impact downstream (t) | Reef | <1 | 232 | 150 | 408 | 2 | 533 | |
| KBA | 1023 | 507 | 52 | 291 | 2331 | 287 | |||
| MPA | 1138 | 227 | 121 | 508 | 634 | 368 | |||
| Coast | 1443 | 1401 | 448 | 2791 | 4444 | 1695 | |||
| (%) Reduction in pollution across sites and area | Reef | <1 | 8 | 5 | 14 | <1 | 18 | ||
| KBA | 8 | 4 | <1 | 2 | 18 | 2 | |||
| MPA | 16 | 3 | 2 | 4 | 9 | 5 | |||
| Coast | 5 | 5 | 2 | 9 | 15 | 6 | |||
| # sites with reduced pollution | Reef | 2 | 45 | 232 | 103 | 6 | 120 | ||
| KBA | 35 | 22 | 35 | 96 | 34 | 27 | |||
| MPA | 21 | 8 | 82 | 106 | 23 | 39 | |||
| Coast | 65 | 87 | 277 | 333 | 79 | 206 | |||
| (km2) Area with reduced pollution | Reef | 256 | 5039 | 46,076 | 22,237 | 668 | 35,018 | ||
| KBA | 5970 | 3391 | 29,555 | 33,785 | 4309 | 27,624 | |||
| MPA | 7113 | 5013 | 53,262 | 27,767 | 5673 | 28,032 | |||
| Coast | 19,441 | 22,643 | 92,753 | 97,204 | 25,181 | 53,980 | |||
| Impact for social objectives | Impact on # of people within 8 km2 vicinity | 1,677,428 | 335,997 | 3,455,702 | 7,615,236 | 1,671,724 | 1,970,634 | ||
| Main source of pollution for # of people within 8 km2 vicinity | 421,905 | 155,384 | 673,479 | 2,213,270 | 654,750 | 846,403 | |||
| Feasibility | Technical feasibility | Only used for preselection based on downstream sites with highest pollution | |||||||
| Political feasibility: # EEZ impacted | 3 | 3 | 10 | 9 | 2 | 3 | |||
KBA, key biodiversity area; MPA, marine protected area.
Detailed benefit analysis for six potential high-impact rivers identified in Table S3 and Fig. 4. The consequences and trade-offs are clearly identified in this quantitative information on plastic debris pollution at the source and downstream sites for all different environmental and social objectives.
Dark blue, best options for each metric; mid blue, second best options for each metric, light blue third best option for each metric. Technical feasibility is greyed out as it was used during preselection of most promising options.
Rivers that are targeted through the Clean Currents Coalition (https://cleancurrentscoalition.org/coalition-projects) include the Assi River (Bangladesh: #9–18), the Song Hong River (Vietnam: #119–127), the Lat Phrao Canal (Thailand: #77–80), and the Citharum River (Indonesia: #441–442). The Assi River is a tributary to the Ganges, which appears in a high rank for all objectives except for coral reefs. However, due to the variability in debris load across the wide delta, it might be a challenging location to create targeted impacts for downstream sites.
Variability of ranks across different model parameters
We assessed the variability in the first 100 ranks based on rivers with high flows to a receiving site (volumetric impact, Eqn 2), rivers contributing high fractions of the inflowing plastic pollution at a receiving site (relative impact, Eqn 1) and rivers causing high inflow of plastic debris across all receiving sites (total downstream impact, Eqn 3) across six ‘sensitivity’ scenarios (shallow and deep currents, high and low settlement rate, mean and high estimates for modelled load of debris in rivers). Ranks based on the volumetric impact were stable across the first 100 ranks (Eqn 2, Supplementary Material S5 top). Most rivers appeared in the first 100 ranks in all scenarios and had low or no variability in these ranks. All six rivers appeared in the top ranks. Variability among ranks based on the relative impact (Eqn 1, Supplementary Material S5 middle) was higher, many rivers appeared only in some of the scenarios in the first 100 ranks, and only one of the rivers we examined appeared in the first 100 ranks. Variability among the first 100 ranks for the total downstream impact (Eqn 3, Supplementary Material S5 bottom) was highest, with most rivers only ranking in the first 100 ranks in few of the scenarios, and none of the selected rivers appeared in these top ranks. The results suggest that planning based on the flow of volume from source rivers to receiving sites might be the most robust metric when considering a range of likely parameters in the model.
Discussion
An important aspect of the SDM process is the well-defined metrics that show the nuances of different objectives with a clear and transparent method to navigate the trade-offs between them. As expected, prioritizing different objectives and metrics lead to different priority source sites for management. We found three main types of trade-offs for marine debris management in south-east Asia: (1) reducing total plastic vs reducing impact at specific downstream sites; (2) reducing the downstream impact on social vs environmental outcomes; and (3) reducing impact per se vs the feasibility (political and technical) of implementation. Each of these main trade-offs are described further, below.
The first trade-off is between reducing the volume of circulating debris in the open ocean vs reducing negative impacts in specific places of value. Within our model, approximately 5% of virtual plastic settles in destination habitat after 2 months, roughly matching estimates from previous studies, considering that only 1% of marine plastic debris is believed to be bound in surface waters (Eunomia Research & Consulting Ltd 2016). Therefore, targeting clean-up at locations carrying a high load to reduce the accumulation of large volumes of pelagic pollution seems to be a reasonable strategy. However, there are trade-offs with the downstream site-specific priorities. Several rivers that carry the highest volumes of pollution do not rank high for many other places or habitats of value. When the aim is to reduce the overall volume of marine debris and plastic pollution in general, regulating production in general seems to be a more feasible approach than trying to intercept large volumes along their trajectories after they enter the environment, as there is a direct correlation between production of plastic and plastic pollution (Cowger et al. 2024). Improvement of waste management infrastructure has emerged as a priority in national policies in the seascape, confirming the risk of repeated leakage of retrieved debris (Arifin et al. 2023). Indeed, the rivers we assessed in detail due to their large benefits for multiple objectives were located in China, Vietnam, and the Philippines, which ranked along with Indonesia as countries with the most mismanaged waste material (Jambeck et al. 2015). This introduces the risk that removal of debris is only temporary. At the same time, some rivers that are the main sources of pollution for specific sites or coastal populations are not necessarily among the rivers with the highest load in general, but management of these sites would have additional benefits that go beyond the amount of removed debris.
The second key type of trade-off is between reducing the impact across competing values (e.g. social vs environmental) at downstream sites. A clean-up intervention at River Song Hau would provide some of the greatest benefits to the coastal population as well as the numbers and area of downstream sites, especially coral reefs and marine protected areas (MPAs). However, this option provides much lower benefits for more ecologically meaningful metrics such site-specific plastic inflow (volume or percent) than a clean-up at the Irrawaddy River, Modaomen Shao Channel or Pasig River. A clean-up at the River Ganges would provide the best ecological meaningful benefits to MPAs and key biodiversity areas (KBAs) but some of the lowest benefits to reefs and human populations. A clean-up at the Pasig River would provide the highest reduction of percent and volume of plastic debris inflow to coral reefs, but at the same time, provide some of the lowest benefits to KBAs and marine protected areas among the assessed options. Despite the necessity for decision makers to navigate the trade-offs between competing objectives, the transparent and quantitative comparison of consequences makes this decision-making process clear and equitable, enabling a strategic investment into the most appropriate location and action.
The third general trade-off is between the best outcome across all or most objectives regarding downstream benefits vs the most feasible implementation (least political and technical challenges). Two rivers (Ganges and Yangtze) with the highest volume of debris would be clear priorities, yet provide lower benefits to coastal populations or coral reefs than several other options. These two rivers would also be technically challenging due to their wide estuaries stretching over hundreds of kilometres. However, they should also be politically feasible and tractable as the pollution destinations from these top sources are largely contained within their own Exclusive Economic Zone. In contrast, the source River Song Hau (Vietnam) or Modaomen Shao Channel (China) contribute plastic pollution to many downstream nations, making the source-destination impact management less politically feasible and motivating. Collaborations that account for these types of burden sharing of costs at the source relative to the downstream benefits will be key to achieving impacts on a meaningful ecological scale, as is the case regarding other cross-jurisdictional ecological challenges (Clark et al. 2023).
Implications of our study for identified priorities in the management of marine plastic debris in the Asian seascape
Movement patterns, dispersal pathways, and accumulation zones, as well as their variability, are highlighted as a current important knowledge gap and priority areas of research for marine plastic pollution in Asia (Omeyer et al. 2022). The urgent need to quantify expected impacts on several marine habitats and coastal populations, which could serve as a proxy for ecosystem services and degradation of seafood safety, is identified as another key area of research. Our study does not only provide workable examples and analysis pathways for the identified priorities, we also showcase how a rigorous framework can be applied to identify intervention locations with high impact for a combination of objectives, including the consideration of the geopolitical role of countries. In the following, we put our study in context of several countries.
For example, Indonesia experiences increasing environmental pressures and costs of marine plastic debris in the Coral Triangle and is one of the first nations to have a National Action Plan on marine plastic pollution. However, there seem to be no clear priorities or set processes for the selection of clean-up locations yet, and only few studies have investigated sources and trajectories of marine debris pollution that arrives in its jurisdiction (Purba et al. 2019).
Several rivers in Indonesia have been among the top source rivers of marine plastic debris in different studies (Lebreton et al. 2017; Meijer et al. 2021), and population and consumption growth, as well as severe problems with waste management, predict a worsening of plastic pollution in the future (Lestari and Trihadiningrum 2019). Published modelling for Jakarta suggests outgoing debris floats into the Indian Ocean, while incoming debris comes from Java, Sumatra, Kalimantan, and the Gulf of Thailand (Iskandar et al. 2021). In our study, several rivers in Indonesia ranked as high priorities for two objectives (contribution to site pollution and pollution that impacts people).
In Vietnam, only 10–15% of plastic waste gets recycled, with a generation of 3.7 million tonnes of plastic annually (Veettil et al. 2023). The government is dedicated to reducing the inflow of debris into the sea by 75% by 2030 and banning single-use plastics. The national strategy on marine debris management lists the monitoring and assessment of important sources of marine plastic debris as a key objective (VASI (Vietnam Administration of Seas and Islands) 2020). The River Song Hau in Vietnam emerges as one of the most impactful intervention locations for the largest number of sites and overall area that could benefit from a reduced inflow of plastic debris in our study. Other studies mention mangroves and seagrasses as important sinks of plastic debris. These additional habitat types could be integrated in the same way as the reefs, MPAs and KBAs in our analysis, which might identify additional rivers as a priority for clean-up actions than the ones we identified here (Harris et al. 2021; Veettil et al. 2023). We only have included area of extent as a parameter in our analysis, but habitat quality (e.g. based on environmental criteria) is often a key factor in prioritisation process for conservation. If information on the relative quality of habitats exists, it can be easily added as a relative weighting factor.
In the absence of national monitoring data, the national waste management in the Philippines is based on international estimates (Alindayu et al. 2023). Our results indicate that the management of inflow to coral reefs can be managed to a high degree by national actions; for example, intercepting pollution at the river mouth of the Pasig River, which could at the same time contribute to the collection of local data (Alindayu et al. 2023). Manila Bay was identified as the location with the highest accumulation of debris in a recent sampling effort, confirming the modelled hotspot (Gomez et al. 2023).
Thailand relies on mainly voluntary measures, which currently fail to mitigate the growing problems of plastic waste, and the country is not set up to provide commercial plastic recycling facilities (Marks et al. 2020). Transboundary partnerships are key to enabling effective policies and strategic action on the growing plastic waste problem (Marks et al. 2020). Our study showed clearly that not every clean-up intervention at a river with a high pollution load would provide the same direct short-term reduction of debris inflow at downstream sites of value. Learning how to assess direct benefits for different objectives could be an additional motivation for countries to invest in interception technologies at the source and inform international collaboration. Even though we did not explore a particular river from Indonesia or Thailand in full detail, the data and methods provided would make it easy to assess all options in the same way.
Improvements in the decision-making process for selecting clean-up sites
Compared to other methods that offer guidance during multi-objective prioritisation procedures for conservation management, such as portfolio theory (Beyer et al. 2018) or Pareto Ranking (Chollett et al. 2022), SDM has the advantage that it instructs decision-makers to investigate the information behind calculated ranks. A critical aspect in the context of mitigation options for marine plastic debris pollution is that SDM encourages decision makers to spend time developing a clear scope of the problem and relevant objectives and metrics. Exploring and defining different values and objectives produces relevant information about the different types of impact a clean-up effort can have beyond the removed volume of debris. This process helps to understand that multiple quantitative metrics are needed to fully understand the breadth of potential impacts and the related trade-offs for different clean-up locations. The importance of considering multiple metrics instead of single indicators to capture the different dimensions of the ecological context has been stated in other conservation contexts (Adams et al. 2021; Wyborn and Evans 2021).
The results of our case study highlight for the first time how important deliberation on different values, objectives and metrics is in the context of marine plastic debris by showing that the choice of different performance measures leads to a different ranking of clean-up locations. Our case study provides clear concepts for decision makers and planners to expand the current predominant focus on removing large volumes of debris by adding considerations on direct benefits to species and habitats downstream. As most species and ecosystems suffer from multiple impacts, reducing plastic pollution might bolster their ability to withstand other threats (Côté et al. 2016).
Constraints and uncertainty
Our study has several constraints for informing site selection for debris management. For informing real world management, additional analysis would be needed to explore a number of uncertainties, particularly model uncertainty and input parameter uncertainty (Regan et al. 2002; Rounsevell et al. 2021). The three main caveats in our analysis are model resolution, the physics of plastic dispersion in the water column, and plastic debris volumes at the sources.
The choice of data describing the ocean currents influences results because they are the driving force behind measuring trajectories. The first constraint of the HYCOM model is its resolution of 10 km2, which limits detail for the passages between islands throughout the Coral Triangle and does not account for tidal forcing or other small-scale aspects of ocean currents. Reruns with alternative current data in higher resolution would be required to quantify variation in results based on the choice of current data and might also provide better information on the differences we found in trajectories coming from different locations within the estuaries of the Yangtze River and the River Ganges. Particularly for coastal zones, additional exploration of the impact of resuspension rates at beaches and other shallow coastal zones would be needed to explore the robustness of the results.
The second constraint of our model regarding the physics of plastic dispersion includes the considered parameters for movement. While our model includes advection and dispersion, we have not accounted for windage, sinking, settling, beaching, refloating or biofouling and degradation that might change physical properties like size and shape over time, which in turn affect drift behaviour (Chubarenko et al. 2016; Khatmullina and Chubarenko 2019; van Sebille et al. 2020).
The third constraint is the reliance on one dataset on debris load in rivers. We could have tested alternative data sets, as done in other studies investigating the settlement of plastic debris (Meijer et al. 2021). Because we wanted to focus our study on the concept, it seemed more appropriate to include a general approach to investigating the robustness of results than adding detailed sensitivity and scenario testing of the chosen models and parameters that have been addressed elsewhere (Simons et al. 2013; Treml et al. 2015; Jones et al. 2016; Schlaefer et al. 2022).
Costs are a key factor in decision making, however, they differ across different countries based on currency, costs of materials, salary costs and the size and type of intervention that is chosen for intercepting debris (Silva et al. 2021). Willingness to pay studies are one example of already existing data on environmental costs in the region (Suryawan and Lee 2024; Suryawan et al. 2024a, 2024b). Alternatively, expert elicitation could provide an avenue to produce and use cost related data in a real-world application. Costs, as well as estimates for effectiveness of different interception technologies, can be added to the consequence table as a row but should be transferred into a comparable unit, for example purchasing power parity. For transparency, all impact metrics should be reported in real-world quantitative units (e.g. tonnes, km2) in order to be comparable across all alternative site locations.
The utility of prioritising locations for local clean-ups in a global context
Removing plastic debris that has already entered circulation pathways is a temporary and local mitigation strategy and is not comparable to a long-term strategy based on policies and regulations that can reduce the overall inflow into the environment (Bergmann et al. 2023; Cowger et al. 2024). Considering the socio-economic realities of increasing production and high rates of waste mismanagement, the production of new plastics needs to be reduced and regulated dramatically (Diana et al. 2022a; Stoett 2022). This is particularly important in countries with high waste exports, such as Japan, the United States or the Netherlands (Basel Action Network 2021). As the problem of pollution is linked to the mismanagement of waste, trade flows are an important aspect of the problem. A contentious report focusing on Asian countries was retracted because the aspect of international trade and hence the actual polluters were not reflected in the methods used, creating a misleading narrative (The Guardian 2022). Illegal trade (Interpol 2020) to countries with high rates of mismanaged waste, such as an estimated 70% for Thailand (Marks et al. 2020), creates doubts that salvaged volumes of debris will not enter the environment again.
An international movement to create a legally binding treaty to end plastic pollution by 2024, along with waste management and regulation, have been highlighted as an important avenue for change in impacted countries such as the Philippines, Indonesia, Malaysia, or China (Eisma-Osorio 2021; Yin 2021; Kamaruddin et al. 2022; UNEP 2022a). However, negotiations among countries on the exact details of the treaty are slow and influenced by industry (Diana et al. 2022a, 2022b; CIEL 2024). Despite the initiative, the production, use and disposal of conventional fossil fuel-based plastics are increasing and are forecast to grow to 19% of the global carbon budget until 2040 (Law et al. 2020; UNEP 2022b; Lee and Volvovici 2024). The growing production and waste streams drastically reduce the expected effectiveness of clean-ups, and the impacts on human health and the environment can be substantial (Human Rights Watch 2022).
Conclusions
Without more fundamental regulatory measures, any local management focusing on the clean-up of marine debris is likely to be dwarfed by the predicted growing inflow of mismanaged plastic waste into aquatic and terrestrial systems. However, as long as plastic debris from waste streams is likely to enter the environment, intercepting trajectories to downstream sites with high social or environmental value gains more weight than just removing high volumes, as removal is likely to be only temporary.
Our study highlights how SDM could be used to identify and navigate key trade-offs in the mitigation of multiple impacts of marine plastic debris. The insight into the variability of the most important social, technical, political, and environmental consequences of each possible intervention site demands rigorous thinking but also offers transparent and logical prioritisation. While it is unlikely to identify a clear ‘best’ river to mitigate pollution, the use of SDM guides decision-makers to identify meaningful metrics that reflect their values and provides a robust and intuitive process to understand the consequences of any site selection compared with the alternatives.
There are several important aspects to consider before our framework would be fit for application:
All important and interested stakeholders in the planning region should be invited or consulted. Our study provides some suggestions, but each planning context requires revisiting who should be invited and consulted during the scoping and planning.
Similarly, the set of important objectives and metrics to consider would need to be confirmed or updated based on the relevant socio-ecological context and specific values of the involved stakeholders. For example, metrics could be added or modified with local information on the relevance to their management goals, such as including the social value of small fishing villages that provide food to the region.
Data and models used in the analysis should reflect the most up-to-date options and best practices for the purpose. For example, since the time of our analysis, more accurate estimates of plastic debris in rivers have become available for the Asian seascape, and field-based observational data should always be considered where appropriate to produce more accurate estimates for pollution flows and impact on biodiversity (van Emmerik et al. 2019; Owens and Kamil 2020; Seo and Park 2020; Fauziah et al. 2021; Meijer et al. 2021; Iskandar et al. 2022; Roman et al. 2022). The hydrodynamic model to simulate plastic transport should reflect the seascape as accurately as possible, and ensembles could improve accuracy of predicted pathways and uncertainty.
The sensitivity analysis to explore uncertainty in the results should be based on the priorities of decision makers and the used data and models.
In summary, while our study should provide a clear conceptual framework and highlight likely regional priority areas for intervention, implementation will likely happen on the regional or national level, and revisiting and adjusting each step with the most relevant content for the specific socio-political and environmental context is highly advisable.
Data availability
Data and code used to produce results are available on figshare (https://doi.org/10.6084/m9.figshare.26491714.v1).
Declaration of funding
This study was conducted as part of a PhD at the University of Melbourne and was funded through the Australian Research Training Program Scholarship.
Acknowledgements
We thank Dianne McLean, Kay Critchell, Maria Beger, and Iliana Colette for valuable feedback on the manuscript. We also thank Win Cowgar from the University of California, Molly Morse from the Benioff Ocean Initiative, and Erika Scelfo from TerraCycle for the helpful engagement in the early stages of our study. This research was supported by the University of Melbourne’s Research Computing Services, Spartan HPC, and the Petascale Campus Initiative.
References
Adams VM, Visconti P, Graham V, Possingham HP (2021) Indicators keep progress honest: a call to track both the quantity and quality of protected areas. One Earth 4, 901-906.
| Crossref | Google Scholar |
Alindayu RC, II, Licnachan LOC, Luzadas RL, Ignacio PSP, Onda DFL (2023) Moving towards open data, public access, and information sharing to combat marine plastics pollution in the Philippines and the Southeast Asian region. Ocean & Coastal Management 243, 106771.
| Crossref | Google Scholar |
Arifin Z, Falahudin D, Saito H, Mintarsih TH, Hafizt M, Suteja Y (2023) Indonesian policy and researches toward 70% reduction of marine plastic pollution by 2025. Marine Policy 155, 105692.
| Crossref | Google Scholar |
Avery-Gomm S, Provencher JF, Borrelle SB (2018a) Linking plastic ingestion research with marine wildlife conservation. Science of the Total Environment 637–638 1492-1495.
| Crossref | Google Scholar |
Avery-Gomm S, Provencher JF, Liboiron M, Poon FE, Smith PA (2018b) Plastic pollution in the Labrador Sea: an assessment using the seabird northern fulmar Fulmarus glacialis as a biological monitoring species. Marine Pollution Bulletin 127, 817-822.
| Crossref | Google Scholar | PubMed |
Barrett J, Chase Z, Zhang J, Holl MMB, Willis K, Williams A, Hardesty BD, Wilcox C (2020) Microplastic pollution in deep-sea sediments from the great Australian bight. Frontiers in Marine Science 7, 576170.
| Crossref | Google Scholar |
Basel Action Network (2021) Global export data, 2021 annual summary. Available at https://www.ban.org/plastic-waste-project-hub/trade-data/global-export-data-2021-annual-summary
Bauer-Civiello A, Critchell K, Hoogenboom M, Hamann M (2019) Input of plastic debris in an urban tropical river system. Marine Pollution Bulletin 144, 235-242.
| Crossref | Google Scholar | PubMed |
Beaumont NJ, Aanesen M, Austen MC, Börger T, Clark JR, Cole M, Hooper T, Lindeque PK, Pascoe C, Wyles KJ (2019) Global ecological, social and economic impacts of marine plastic. Marine Pollution Bulletin 142, 189-195.
| Crossref | Google Scholar | PubMed |
Benioff Ocean Initiative (2019) River plastic pollution: considerations for addressing the leading source of marine debris. Available at https://www.researchgate.net/publication/345026035_RIVER_PLASTIC_POLLUTION_Considerations_for_addressing_the_leading_source_of_marine_debris
Bergmann M, Arp HPH, Carney Almroth B, Cowger W, Eriksen M, Dey T, Gündoğdu S, Helm RR, Krieger A, Syberg K, et al. (2023) Moving from symptom management to upstream plastics prevention: the fallacy of plastic cleanup technology. One Earth 6, 1439-1442.
| Crossref | Google Scholar |
Beyer HL, Kennedy EV, Beger M, Chen CA, Cinner JE, Darling ES, Eakin CM, Gates RD, Heron SF, Knowlton N, et al. (2018) Risk-sensitive planning for conserving coral reefs under rapid climate change. Conservation Letters 11, e12587.
| Crossref | Google Scholar |
Borrelle SB, Ringma J, Law KL, Monnahan CC, Lebreton L, McGivern A, Murphy E, Jambeck J, Leonard GH, Hilleary MA, et al. (2020) Predicted growth in plastic waste exceeds efforts to mitigate plastic pollution. Science 369, 1515-1518.
| Crossref | Google Scholar | PubMed |
Burgman M (2005) ‘Risks and decisions for conservation and environmental management.’ 1st edn. (Cambridge University Press) 10.1017/CBO9780511614279
Cable RN, Beletsky D, Beletsky R, Wigginton K, Locke BW, Duhaime MB (2017) Distribution and modeled transport of plastic pollution in the Great Lakes, the world’s largest freshwater resource. Frontiers in Environmental Science 5, 45.
| Crossref | Google Scholar |
Campbell ML, Peters L, McMains C, de Campos MCR, Sargisson RJ, Blackwell B, Hewitt CL (2019) Are our beaches safe? Quantifying the human health impact of anthropogenic beach litter on people in New Zealand. Science of The Total Environment 651, 2400-2409.
| Crossref | Google Scholar | PubMed |
Center For International Earth Science Information Network-CIESIN-Columbia University (2017) Gridded population of the world, Version 4 (GPWv4): population density, Revision 11. Available at https://doi.org/10.7927/H49C6VHW
Chassignet EP, Hurlburt HE, Smedstad OM, Halliwell GR, Hogan PJ, Wallcraft AJ, Baraille R, Bleck R (2007) The HYCOM (HYbrid Coordinate Ocean Model) data assimilative system. Journal of Marine Systems 65, 60-83.
| Crossref | Google Scholar |
Chollett I, Escovar-Fadul X, Schill SR, Croquer A, Dixon AM, Beger M, Shaver E, Pietsch McNulty V, Wolff NH (2022) Planning for resilience: incorporating scenario and model uncertainty and trade-offs when prioritizing management of climate refugia. Global Change Biology 28, 4054-4068.
| Crossref | Google Scholar | PubMed |
Choy CA, Robison BH, Gagne TO, Erwin B, Firl E, Halden RU, Hamilton JA, Katija K, Lisin SE, Rolsky C, et al. (2019) The vertical distribution and biological transport of marine microplastics across the epipelagic and mesopelagic water column. Scientific Reports 9, 7843.
| Crossref | Google Scholar |
Chubarenko I, Bagaev A, Zobkov M, Esiukova E (2016) On some physical and dynamical properties of microplastic particles in marine environment. Marine Pollution Bulletin 108, 105-112.
| Crossref | Google Scholar | PubMed |
Chubarenko I, Esiukova E, Khatmullina L, Lobchuk O, Grave A, Kileso A, Haseler M (2020) From macro to micro, from patchy to uniform: analyzing plastic contamination along and across a sandy tide-less coast. Marine Pollution Bulletin 156, 111198.
| Crossref | Google Scholar |
CIEL (2024) Plastics treaty talks in ottawa sacrifice ambition for compromise. Available at https://www.ciel.org/news/outcome-plastics-negotiations-inc4-ottawa/
Clark BL, Carneiro APB, Pearmain EJ, Rouyer M-M, Clay TA, Cowger W, Phillips RA, Manica A, Hazin C, Eriksen M, et al. (2023) Global assessment of marine plastic exposure risk for oceanic birds. Nature Communications 14, 3665.
| Crossref | Google Scholar |
Compa M, Alomar C, Wilcox C, van Sebille E, Lebreton L, Hardesty BD, Deudero S (2019) Risk assessment of plastic pollution on marine diversity in the Mediterranean Sea. Science of The Total Environment 678, 188-196.
| Crossref | Google Scholar | PubMed |
Côté IM, Darling ES, Brown CJ (2016) Interactions among ecosystem stressors and their importance in conservation. Proceedings of the Royal Society B: Biological Sciences 283, 20152592.
| Crossref | Google Scholar |
Cowger W, Willis KA, Bullock S, Conlon K, Emmanuel J, Erdle LM, Eriksen M, Farrelly TA, Hardesty BD, Kerge K, et al. (2024) Global producer responsibility for plastic pollution. Science Advances 10, eadj8275.
| Crossref | Google Scholar |
Critchell K, Hamann M, Wildermann N, Grech A (2019) Predicting the exposure of coastal species to plastic pollution in a complex island archipelago. Environmental Pollution 252, 982-991.
| Crossref | Google Scholar | PubMed |
Csardi G, Nepusz T (2006) The igraph software package for complex network research. InterJournal, Complex Systems 1695, 1-9.
| Google Scholar |
Danopoulos E, Twiddy M, West R, Rotchell JM (2022) A rapid review and meta-regression analyses of the toxicological impacts of microplastic exposure in human cells. Journal of Hazardous Materials 427, 127861.
| Crossref | Google Scholar |
Diana Z, Vegh T, Karasik R, Bering J, D. Llano Caldas J, Pickle A, Rittschof D, Lau W, Virdin J (2022a) The evolving global plastics policy landscape: an inventory and effectiveness review. Environmental Science & Policy 134, 34-45.
| Crossref | Google Scholar |
Diana Z, Reilly K, Karasik R, Vegh T, Wang Y, Wong Z, Dunn L, Blasiak R, Dunphy-Daly MM, Rittschof D, et al. (2022b) Voluntary commitments made by the world’s largest companies focus on recycling and packaging over other actions to address the plastics crisis. One Earth 5, 1286-1306.
| Crossref | Google Scholar | PubMed |
Duncan EM, Broderick AC, Critchell K, Galloway TS, Hamann M, Limpus CJ, Lindeque PK, Santillo D, Tucker AD, Whiting S, et al. (2021) Plastic pollution and small juvenile marine turtles: a potential evolutionary trap. Frontiers in Marine Science 8, 699521.
| Crossref | Google Scholar |
Eisma-Osorio R-L (2021) Navigating in a sea of plastics: a critical reflection on the legal responses in the Philippines to marine plastic debris. Korea Legislation Research Institute’s KLRI Journal of Law Legislation 11, 63-96.
| Crossref | Google Scholar |
Eunomia Research & Consulting Ltd (2016) Plastics in the marine environment. Available at www.eunomia.co.uk
Fauziah SH, Rizman-Idid M, Cheah W, Loh K-H, Sharma S, M.R N, Bordt M, Praphotjanaporn T, Samah AA, Sabaruddin JSB, et al. (2021) Marine debris in Malaysia: a review on the pollution intensity and mitigating measures. Marine Pollution Bulletin 167, 112258.
| Crossref | Google Scholar |
Flanders Marine Institute (VLIZ), Belgium (2019) Maritime boundaries geodatabase: maritime boundaries and exclusive economic zones (200NM). Available at https://doi.org/10.14284/386
Fossi MC, Coppola D, Baini M, Giannetti M, Guerranti C, Marsili L, Panti C, de Sabata E, Clò S (2014) Large filter feeding marine organisms as indicators of microplastic in the pelagic environment: the case studies of the Mediterranean basking shark (Cetorhinus maximus) and fin whale (Balaenoptera physalus). Marine Environmental Research 100, 17-24.
| Crossref | Google Scholar | PubMed |
Galaiduk R, Lebreton L, Techera E, Reisser J (2020) Transnational plastics: an Australian case for global action. Frontiers in Environmental Science 8, 115.
| Crossref | Google Scholar |
Game ET, Kareiva P, Possingham HP (2013) Six common mistakes in conservation priority setting. Conservation Biology 27, 480-485.
| Crossref | Google Scholar | PubMed |
Geyer R, Jambeck JR, Law KL (2017) Production, use, and fate of all plastics ever made. Science Advances 3, e1700782.
| Crossref | Google Scholar |
Gomez NCF, Cragg SM, Ghiglione J-F, Onda DFL (2023) Accumulation and exposure classifications of plastics in the different coastal habitats in the western Philippine archipelago. Environmental Pollution 337, 122602.
| Crossref | Google Scholar |
Hall NM, Berry KLE, Rintoul L, Hoogenboom MO (2015) Microplastic ingestion by scleractinian corals. Marine Biology 162, 725-732.
| Crossref | Google Scholar |
Halpern BS, Klein CJ, Brown CJ, Beger M, Grantham HS, Mangubhai S, Ruckelshaus M, Tulloch VJ, Watts M, White C, et al. (2013) Achieving the triple bottom line in the face of inherent trade-offs among social equity, economic return, and conservation. Proceedings of the National Academy of Sciences 110, 6229-6234.
| Crossref | Google Scholar |
Hardesty BD, Lawson TJ, van der Velde T, Lansdell M, Wilcox C (2017) Estimating quantities and sources of marine debris at a continental scale. Frontiers in Ecology and the Environment 15, 18-25.
| Crossref | Google Scholar |
Harris PT, Westerveld L, Nyberg B, Maes T, Macmillan-Lawler M, Appelquist LR (2021) Exposure of coastal environments to river-sourced plastic pollution. Science of The Total Environment 769, 145222.
| Crossref | Google Scholar |
Horton AA, Walton A, Spurgeon DJ, Lahive E, Svendsen C (2017) Microplastics in freshwater and terrestrial environments: evaluating the current understanding to identify the knowledge gaps and future research priorities. Science of The Total Environment 586, 127-141.
| Crossref | Google Scholar | PubMed |
Human Rights Watch (2022) ‘Its as if they are poisoning us’ – the health impacts of plastic recycling in Turkey. Available at https://www.hrw.org/sites/default/files/media_2022/09/turkey0922web_0.pdf
Iskandar MR, Surinati D, Cordova MR, Siong K (2021) Pathways of floating marine debris in Jakarta Bay, Indonesia. Marine Pollution Bulletin 169, 112511.
| Crossref | Google Scholar |
Iskandar MR, Cordova MR, Park Y-G (2022) Pathways and destinations of floating marine plastic debris from 10 major rivers in Java and Bali, Indonesia: a Lagrangian particle tracking perspective. Marine Pollution Bulletin 185, 114331.
| Crossref | Google Scholar |
Jambeck JR, Geyer R, Wilcox C, Siegler TR, Perryman M, Andrady A, Narayan R, Law KL (2015) Plastic waste inputs from land into the ocean. Science 347, 768-771.
| Crossref | Google Scholar | PubMed |
Jones BT, Solow A, Ji R (2016) Resource allocation for Lagrangian tracking. Journal of Atmospheric and Oceanic Technology 33, 1225-1235.
| Crossref | Google Scholar |
Kamaruddin H, Maskun , Patittingi F, Assidiq H, Bachril SN, Al Mukarramah NH (2022) Legal aspect of plastic waste management in Indonesia and Malaysia: addressing marine plastic debris. Sustainability 14, 6985.
| Crossref | Google Scholar |
Khatmullina L, Chubarenko I (2019) Transport of marine microplastic particles: why is it so difficult to predict? Anthropocene Coasts 2, 293-305.
| Crossref | Google Scholar |
Lamb JB, Willis BL, Fiorenza EA, Couch CS, Howard R, Rader DN, True JD, Kelly LA, Ahmad A, Jompa J, et al. (2018) Plastic waste associated with disease on coral reefs. Science 359, 460-462.
| Crossref | Google Scholar | PubMed |
Law KL, Starr N, Siegler TR, Jambeck JR, Mallos NJ, Leonard GH (2020) The United States’ contribution of plastic waste to land and ocean. Science Advances 6, eabd0288.
| Crossref | Google Scholar |
Lebreton LCM, van der Zwet J, Damsteeg J-W, Slat B, Andrady A, Reisser J (2017) River plastic emissions to the world’s oceans. Nature Communications 8, 15611.
| Crossref | Google Scholar |
Lee J, Volvovici V (2024) Countries fail to reach agreement in UN plastic talks. Reuters. Available at https://www.reuters.com/business/environment/over-100-countries-back-plastic-treaty-caps-talks-reach-fierce-finish-2024-11-30/
Lestari P, Trihadiningrum Y (2019) The impact of improper solid waste management to plastic pollution in Indonesian coast and marine environment. Marine Pollution Bulletin 149, 110505.
| Crossref | Google Scholar |
Liang Y, Tan Q, Song Q, Li J (2021) An analysis of the plastic waste trade and management in Asia. Waste Management 119, 242-253.
| Crossref | Google Scholar | PubMed |
MacLeod M, Arp HPH, Tekman MB, Jahnke A (2021) The global threat from plastic pollution. Science 373, 61-65.
| Crossref | Google Scholar | PubMed |
Marks D, Miller MA, Vassanadumrongdee S (2020) The geopolitical economy of Thailand’s marine plastic pollution crisis. Asia Pacific Viewpoint 61, 266-282.
| Crossref | Google Scholar |
Martin C, Baalkhuyur F, Valluzzi L, Saderne V, Cusack M, Almahasheer H, Krishnakumar PK, Rabaoui L, Qurban MA, Arias-Ortiz A, et al. (2020) Exponential increase of plastic burial in mangrove sediments as a major plastic sink. Science Advances 6, eaaz5593.
| Crossref | Google Scholar |
Meijer LJJ, van Emmerik T, van der Ent R, Schmidt C, Lebreton L (2021) More than 1000 rivers account for 80% of global riverine plastic emissions into the ocean. Science Advances 7, eaaz5803.
| Crossref | Google Scholar |
Moilanen A, Wintle BA, Elith J, Burgman M (2006) Uncertainty analysis for regional-scale reserve selection. Conservation Biology 20, 1688-1697.
| Crossref | Google Scholar | PubMed |
Omeyer LCM, Duncan EM, Aiemsomboon K, Beaumont N, Bureekul S, Cao B, Carrasco LR, Chavanich S, Clark JR, Cordova MR, et al. (2022) Priorities to inform research on marine plastic pollution in Southeast Asia. Science of The Total Environment 841, 156704.
| Crossref | Google Scholar |
Onink V, Jongedijk CE, Hoffman MJ, van Sebille E, Laufkötter C (2021) Global simulations of marine plastic transport show plastic trapping in coastal zones. Environmental Research Letters 16, 064053.
| Crossref | Google Scholar |
Owens KA, Kamil PI (2020) Adapting coastal collection methods for river assessment to increase data on global plastic pollution: examples from India and Indonesia. Frontiers in Environmental Science 7, 208.
| Crossref | Google Scholar |
Pinheiro HT, MacDonald C, Santos RG, Ali R, Bobat A, Cresswell BJ, Francini-Filho R, Freitas R, Galbraith GF, Musembi P, et al. (2023) Plastic pollution on the world’s coral reefs. Nature 619, 311-316.
| Crossref | Google Scholar | PubMed |
Purba NP, Handyman DIW, Pribadi TD, Syakti AD, Pranowo WS, Harvey A, Ihsan YN (2019) Marine debris in Indonesia: a review of research and status. Marine Pollution Bulletin 146, 134-144.
| Crossref | Google Scholar | PubMed |
R Core Team (2020) R: a language and environment computing. Available at https://www.r-project.org/
Ragusa A, Svelato A, Santacroce C, Catalano P, Notarstefano V, Carnevali O, Papa F, Rongioletti MCA, Baiocco F, Draghi S, et al. (2021) Plasticenta: first evidence of microplastics in human placenta. Environment International 146, 106274.
| Crossref | Google Scholar |
Rech S, Borrell Pichs YJ, García-Vazquez E (2018a) Anthropogenic marine litter composition in coastal areas may be a predictor of potentially invasive rafting fauna. PLoS ONE 13, e0191859.
| Crossref | Google Scholar |
Rech S, Thiel M, Borrell Pichs YJ, García-Vazquez E (2018b) Travelling light: fouling biota on macroplastics arriving on beaches of remote Rapa Nui (Easter Island) in the South Pacific Subtropical Gyre. Marine Pollution Bulletin 137, 119-128.
| Crossref | Google Scholar | PubMed |
Regan HM, Colyvan M, Burgman MA (2002) A taxonomy and treatment of uncertainty for ecology and conservation biology. Ecological Applications 12, 618-628.
| Crossref | Google Scholar |
Reisser J, Slat B, Noble K, du Plessis K, Epp M, Proietti M, de Sonneville J, Becker T, Pattiaratchi C (2015) The vertical distribution of buoyant plastics at sea: an observational study in the North Atlantic Gyre. Biogeosciences 12, 1249-1256.
| Crossref | Google Scholar |
Roberts CM, McClean CJ, Veron JEN, Hawkins JP, Allen GR, McAllister DE, Mittermeier CG, Schueler FW, Spalding M, Wells F, et al. (2002) Marine biodiversity hotspots and conservation priorities for tropical reefs. Science 295, 1280-1284.
| Crossref | Google Scholar | PubMed |
Roman L, Hardesty BD, Schuyler Q (2022) A systematic review and risk matrix of plastic litter impacts on aquatic wildlife: a case study of the Mekong and Ganges River Basins. Science of The Total Environment 843, 156858.
| Crossref | Google Scholar |
Rose DC, Amano T, González-Varo JP, Mukherjee N, Robertson RJ, Simmons BI, Wauchope HS, Sutherland WJ (2019) Calling for a new agenda for conservation science to create evidence-informed policy. Biological Conservation 238, 108222.
| Crossref | Google Scholar |
Rounsevell MDA, Arneth A, Brown C, Cheung WWL, Gimenez O, Holman I, Leadley P, Luján C, Mahevas S, Maréchaux I, et al. (2021) Identifying uncertainties in scenarios and models of socio-ecological systems in support of decision-making. One Earth 4, 967-985.
| Crossref | Google Scholar |
Sarkar S (2012) Complementarity and the selection of nature reserves: algorithms and the origins of conservation planning, 1980–1995. Archive for History of Exact Sciences 66, 397-426.
| Crossref | Google Scholar |
Schernewski G, Radtke H, Hauk R, Baresel C, Olshammar M, Osinski R, Oberbeckmann S (2020) Transport and behavior of microplastics emissions from urban sources in the Baltic Sea. Frontiers in Environmental Science 8, 579361.
| Crossref | Google Scholar |
Schlaefer J, Carter A, Choukroun S, Coles R, Critchell K, Lambrechts J, Rasheed M, Tol S, Grech A (2022) Marine plant dispersal and connectivity measures differ in their sensitivity to biophysical model parameters. Environmental Modelling & Software 149, 105313.
| Crossref | Google Scholar |
Seo S, Park Y-G (2020) Destination of floating plastic debris released from ten major rivers around the Korean Peninsula. Environment International 138, 105655.
| Crossref | Google Scholar |
Sherman P, van Sebille E (2016) Modeling marine surface microplastic transport to assess optimal removal locations. Environmental Research Letters 11, 014006.
| Crossref | Google Scholar |
Silva J, Morse M, Tamayo-Cañadas V (2021) Plastic waste capture in rivers: An inventory of current technologies. Benioff Ocean Initiative. Available at https://cleancurrentscoalition.org/wp-content/uploads/2021/06/Plastic-Waste-Capture-in-Rivers_Benioff-Ocean-Initiative_2021_reduced.pdf
Simons RD, Siegel DA, Brown KS (2013) Model sensitivity and robustness in the estimation of larval transport: a study of particle tracking parameters. Journal of Marine Systems 119–120, 19-29.
| Crossref | Google Scholar |
Stoett P (2022) Plastic pollution: a global challenge in need of multi-level justice-centered solutions. One Earth 5, 593-596.
| Crossref | Google Scholar |
Suryawan IWK, Lee C-H (2024) Importance-performance dynamics and willingness to pay in coastal areas for climate-adaptive Marine Debris Management. Regional Studies in Marine Science 77, 103596.
| Crossref | Google Scholar |
Suryawan IWK, Sianipar IMJ, Lee C-H (2024a) Reshaping marine debris management post-COVID-19: integrating adaptive attributes for enhanced community engagement. Ocean & Coastal Management 253, 107149.
| Crossref | Google Scholar |
Suryawan IWK, Suhardono S, Lee C-H (2024b) Boosting beach clean-up participation through community resilience hypothetical scenarios. Marine Pollution Bulletin 207, 116853.
| Crossref | Google Scholar |
Tessnow-von Wysocki I, Wang M, Morales-Caselles C, Woodall LC, Syberg K, Carney Almroth B, Fernandez M, Monclús L, Wilson SP, Warren M, et al. (2023) Plastics treaty text must center ecosystems. Science 382, 525-526.
| Crossref | Google Scholar | PubMed |
The Guardian (2022) NGO retracts ‘waste colonialism’ report blaming Asian countries for plastic pollution. The Guardian, 15 September. Available at https://www.theguardian.com/environment/2022/sep/15/ocean-conservancy-ngo-retracts-2015-waste-colonialism-report-blaming-five-asian-countries-for-most-plastic-pollution
Treml EA, Roberts JJ, Chao Y, Halpin PN, Possingham HP, Riginos C (2012) Reproductive output and duration of the pelagic larval stage determine seascape-wide connectivity of marine populations. Integrative and Comparative Biology 52, 525-537.
| Crossref | Google Scholar | PubMed |
Treml EA, Ford JR, Black KP, Swearer SE (2015) Identifying the key biophysical drivers, connectivity outcomes, and metapopulation consequences of larval dispersal in the sea. Movement Ecology 3, 17.
| Crossref | Google Scholar |
UNEP (2022a) Draft resolution: end plastic pollution: towards an international legally binding instrument. Available at https://wedocs.unep.org/bitstream/handle/20.500.11822/38522/k2200647_-_unep-ea-5-l-23-rev-1_-_advance.pdf?sequence=1&isAllowed=y
UNEP (2022b) Our planet is choking on plastic. Available at https://www.unep.org/interactives/beat-plastic-pollution/ [accessed 8 October 2022]
UNEP-WCMC, WorldFish, World Resources Institute, The Nature Conservancy (2010) Global Distribution of Coral Reefs. 1.33 GB. Available at https://doi.org/10.34892/t2wk-5t34
Urban D, Keitt T (2001) Landscape connectivity: a graph-theoretic perspective. Ecology 82, 1205-1218.
| Crossref | Google Scholar |
van Emmerik T, Loozen M, Van Oeveren K, Buschman F, Prinsen G (2019) Riverine plastic emission from Jakarta into the ocean. Environmental Research Letters 14, 084033.
| Crossref | Google Scholar |
van Sebille E, Wilcox C, Lebreton L, Maximenko N, Hardesty BD, van Franeker JA, Eriksen M, Siegel D, Galgani F, Law KL (2015) A global inventory of small floating plastic debris. Environmental Research Letters 10, 124006.
| Crossref | Google Scholar |
van Sebille E, Aliani S, Law KL, Maximenko N, Alsina JM, Bagaev A, Bergmann M, Chapron B, Chubarenko I, Cózar A, et al. (2020) The physical oceanography of the transport of floating marine debris. Environmental Research Letters 15, 023003.
| Crossref | Google Scholar |
VASI (Vietnam Administration of Seas and Islands) (2020) National action plan for management of marine plastic debris by 2030. VASI, Hanoi, Vietnam. Available at https://www.undp.org/vietnam/publications/national-action-plan-management-marine-plastic-litter-2030
Veettil BK, Hua NTA, Van DD, Quang NX (2023) Coastal and marine plastic pollution in Vietnam: problems and the way out. Estuarine, Coastal and Shelf Science 292, 108472.
| Crossref | Google Scholar |
Waruszewski M, Kühnlein C, Pawlowska H, Smolarkiewicz PK (2018) MPDATA: third-order accuracy for variable flows. Journal of Computational Physics 359, 361-379.
| Crossref | Google Scholar |
Widis DC, BenDor TK, Deegan M (2015) Prioritizing wetland restoration sites: a review and application to a large-scale coastal restoration program. Ecological Restoration 33, 358-377.
| Crossref | Google Scholar |
Wilcox C, Van Sebille E, Hardesty BD (2015) Threat of plastic pollution to seabirds is global, pervasive, and increasing. Proceedings of the National Academy of Sciences 112, 11899-11904.
| Crossref | Google Scholar |
Williams AT, Simmons SL (1997) Estuarine litter at the river/beach interface in the bristol channel, United Kingdom. Journal of Coastal Research 13, 1159-1165.
| Google Scholar |
Wright SL, Thompson RC, Galloway TS (2013) The physical impacts of microplastics on marine organisms: a review. Environmental Pollution 178, 483-492.
| Crossref | Google Scholar | PubMed |
Wyborn C, Evans MC (2021) Conservation needs to break free from global priority mapping. Nature Ecology & Evolution 5, 1322-1324.
| Crossref | Google Scholar | PubMed |
Yin R (2021) Legal practice and future prospects of marine plastic debris management in China. In ‘Marine plastic pollution and the rule of law’. (Eds LY Sulistiawati, R-L Eisma-Osorio) pp. 262–285. (Konrad Adenaeur Stiftung, Ltd., Korea Legislation Research Institute, Asia-Pacific Centre for Environmental Law-National University of Singapore, and University of Cebu School of Law)