

Recognising spatial distribution shifts in southern beech Nothofagus in the Island of New Guinea in response to climate change
Zahra Salsabila Rosmaitsa A * , Teguh Husodo A and Angga Yudaputra B
A
B
Abstract
The Island of New Guinea hosts the highest diversity of Nothofagus species within the distribution range of this genus. According to modelled predictions, climate change will likely affect the distribution and existence of the genus Nothofagus in future.
Research efforts on how climate change influences the distribution patterns in Nothofagus in New Guinea are therefore needed. The objective of this study is to understand the impact of climate change on suitable distribution areas of Nothofagus in New Guinea.
The Random Forest (RF) algorithm was used to understand the potential distribution change of Nothofagus in the Island of New Guinea under climate change scenarios. Occurrence records and climatic, topographical and edaphic spatial layers were used as inputs for model prediction of distribution change of Nothofagus in New Guinea. The CNRM-CM6-1-HR Global Climate Model (GCM) with climatic scenarios, and Shared Socio-economic Pathway (SSP) 1–2.6 and SSP 5–8.5 were used to elucidate the potential distribution of Nothofagus under future climate change scenarios.
We found 328 presence records from 14 Nothofagus species in New Guinea. Results indicated that areas predicted to be suitable and highly suitable compared to current predictive distribution areas were reduced by ~9.24% in extent of the area using the SSP 1–2.6 climate scenario and 20.93% using the SSP 5–8.5 climate scenario.
The predictive model indicates that the potential future distribution of Nothofagus will decrease from the current potential distribution.
Knowledge of how climate change could influence the distribution patterns of Nothofagus will be useful for protecting these species in future. Furthermore, our findings are valuable for the discovery of unknown subpopulations in the predicted suitable regions.
Keywords: climate change, conservation, distribution, endemic plant, New Guinea, Nothofagus, Random Forest, species distribution modelling.
Introduction
Climate change is a change in climatic properties such as precipitation, temperature, wind patterns and humidity over a certain period caused by anthropogenic factors such as industrialisation, motorised transportation and mechanised farming, and natural factors such as solar radiation, long-term changes in the earth’s orbital elements and volcanicity (Ondiko et al. 2022). Climate change poses potential threats to Earth’s biodiversity (Kappelle et al. 1999). Biodiversity patterns and processes such as composition, distribution, formation, migration and extinction are predicted to change in response to climate change. Species with narrow distribution ranges and specific habitat requirements, and endemic species may be particularly vulnerable to extinction (Muluneh 2021; Sun et al. 2021). Studies related to the impact of climate change on Nothofagus include research on Nothofagus pumilio in northern Patagonian (Reiter et al. 2024), Nothofagus species in New Zealand (Mathias et al. 2023), Nothofagus obliqua in south-central Chile (Urrutia-Jalabert et al. 2021), and Nothofagus dombeyi forests in northern Patagonia, Argentina (Molowny-Horas et al. 2017) show a negative response to climate change, with increased vulnerability, reduced growth, and higher mortality rates across the species.
Southern beech, Nothofagus, is a relatively small genus comprising 37 species of deciduous and evergreen forest trees (Baldwin et al. 2018) (Fig. 1). The first record of Nothofagus was from Antarctic pollen during the early Campanian, late Cretaceous, making Nothofagus one of the oldest extant angiosperm genera in the fossil record (Weston and Hill 2013). Nothofagus species are distributed in both temperate and tropical biomes, constituting a major component of forests in the southern part of South America (Argentina and Chile) and Australasia (Australia, New Caledonia, New Guinea, New Zealand and Tasmania) (Vento et al. 2024). Nothofagus has economic value as a timber source that can be used for construction materials, the manufacture of household goods or crafts and fuelwood, and also has ornamental value in horticulture (Baldwin et al. 2018). Due to the useful wood, 11 species of Nothofagus (~30%) are listed as globally threatened. The restricted distribution ranges and declines in populations also make these species prone to extinction (Baldwin et al. 2018). The primary threats to Nothofagus are deforestation and logging, followed by modification of natural systems, such as increases and alteration in fire regimes (Baldwin et al. 2018). Repeated severe fires over a short interval can cause Nothofagus species to experience local post-fire regeneration failure if time between fires is insufficient to recover the seed bank (Harvey and Enright 2022). Climate change represents a growing threat to Nothofagus, with habitat shifting, droughts and extreme temperatures as major threats (Baldwin et al. 2018). Approximately 27% of the species diversity in Nothofagus in Indonesian Papua and 17% in Papua New Guinea is threatened (Baldwin et al. 2018).
Morphological characteristics of the habit, bark and leaves of Nothofogus species. (a) Nothofagus pullei. (b) Nothofagus starkenborghiorum.
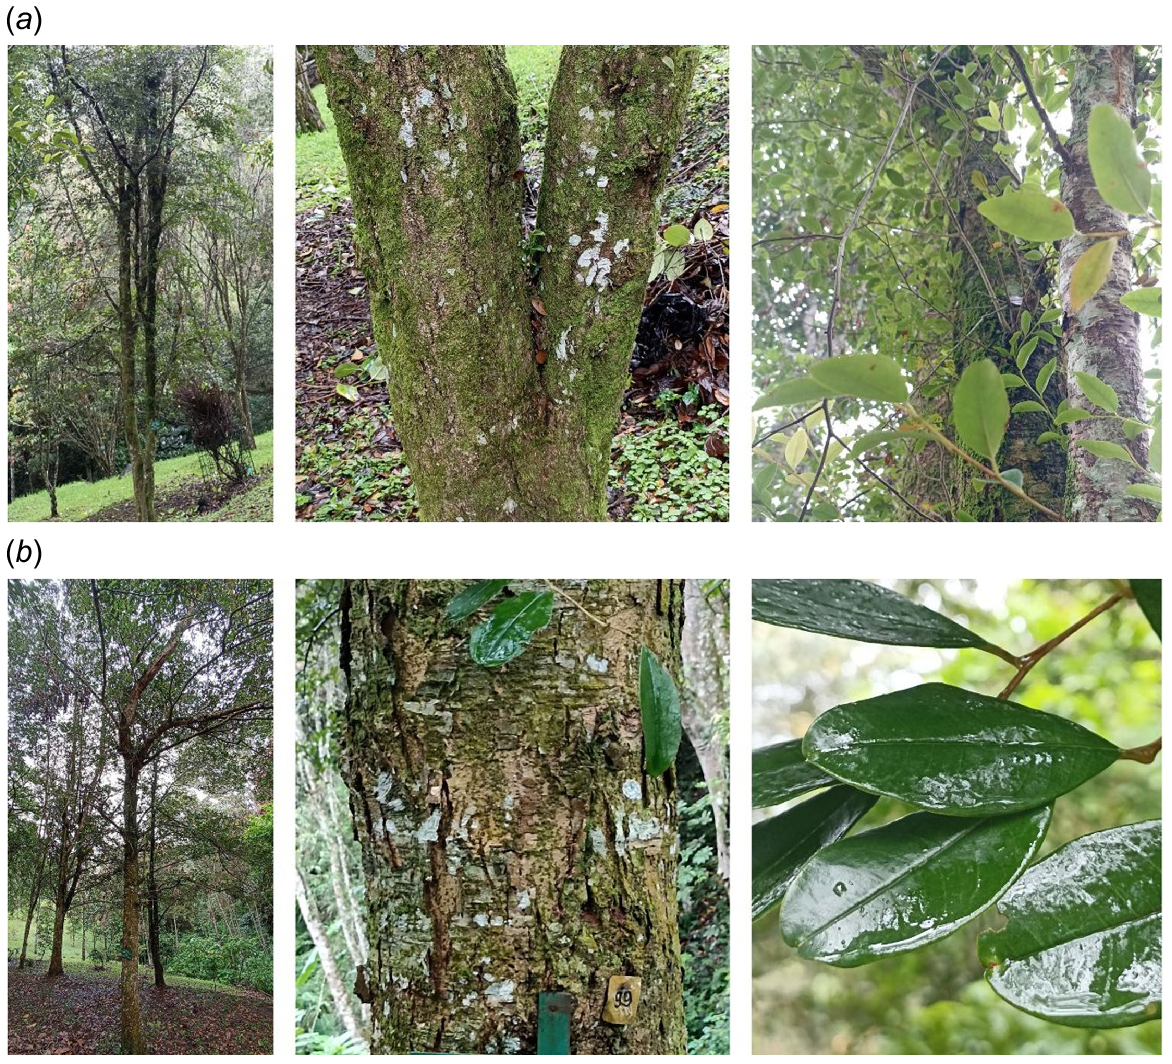
Nothofagus species are distributed across seven countries in both temperate and tropical biomes, with Papua New Guinea and Indonesia (14 species), and Chile and Argentina (10 species) as centres of diversity (Baldwin et al. 2018). Twelve species occur in Indonesian Papua and thirteen in Papua New Guinea (Baldwin et al. 2018), showing the latter to host the highest diversity of Nothofagus species. Nothofagus records have been found in the Island of New Guinea since the late Miocene (Romero 1986). Nothofagus species found in New Guinea have the N. brassii pollen-type and two-parted cupules that distinguish these from other species (Paull and Hill 2003). Nothofagus species occur from 600 to 3100 m above sea level but most often dominate mid-montane forests between 1500 and 2800 m above sea level and dominate a dense forest with uniform canopy at 30–40 m altitude (Read et al. 1990). Nothofagus species in New Guinea favour annual average temperatures ranging from 10.6 to 23.5°C and annual rainfall of 1762–7733 mm (Marshall and Beehler 2007). Information regarding the conservation of Nothofagus species in New Guinea is lacking, therefore a study recognising the regions in New Guinea that are suitable for the species under current and future climate scenarios would be useful for employing an appropriate conservation strategy and searching for new populations in predicted suitable habitats.
Materials and methods
Data collection
Validated Nothofagus species names recorded in distribution data in the Island of New Guinea were checked using Plants of the World Online (POWO). Occurrence records of these species were derived from the Global Biodiversity Information System (GBIF) (GBIF.Org 2024) and The International Union for Conservation of Nature (IUCN) database (IUCN 2024). Coordinates of occurrence records were used to view current land cover conditions and coordinates located outside forest areas and in water bodies were eliminated, resulting in 328 presence records from reliable sources.
Spatial data preparation
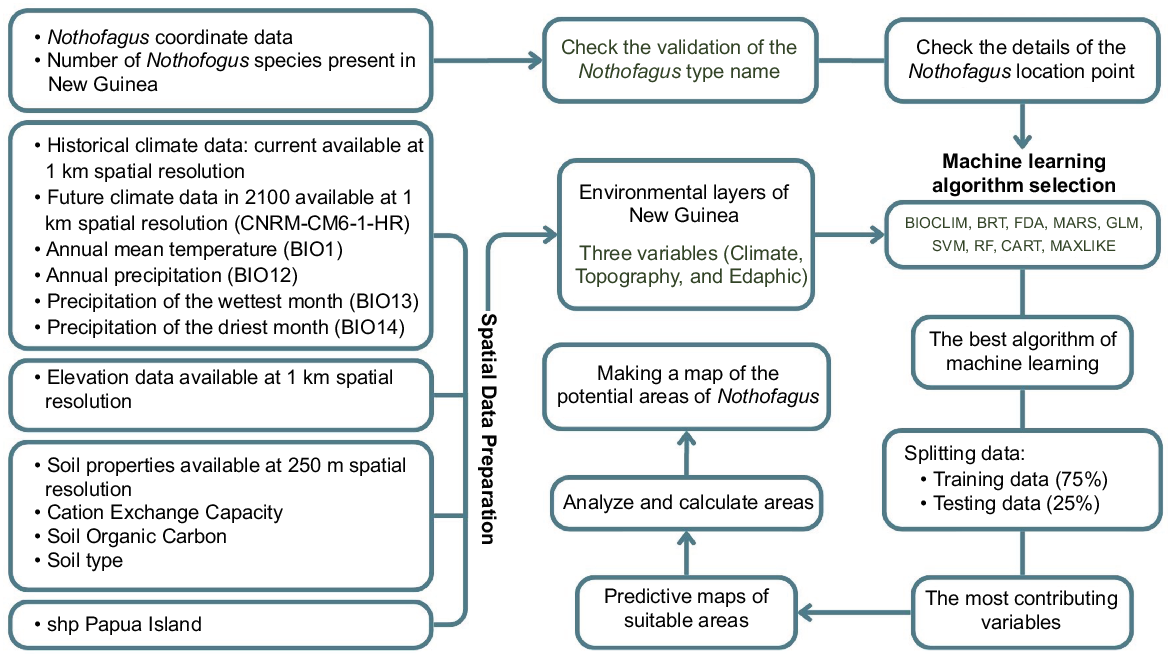
Spatial climatic, topographical and edaphic layers were used as inputs for the model to predict the distribution change of Nothofagus in New Guinea. Current and future climate data are available at 30 arcseconds (~1 km) resolution. Current climate data including mean annual temperature, annual precipitation, precipitation of wettest month and precipitation of driest month were extracted from WorldClim ver. 2.1 climate data for 1970–2000 (Fick and Hijmans 2017). The CNRM-CM6-1-HR Global Climate Model (GCM) with climatic scenarios SSP 1–2.6 and SSP 5–8.5 in the period 2081–2100 was used to predict the future potential distribution of Nothofagus (Fick and Hijmans 2017). Edaphic data with 60–100 cm in depth were extracted from SoilGrids global database ver. 2.0 powered by ISRIC – World Soil Information. These data, available at 250 m spatial resolution, included Soil Organic Carbon (SOC), Cation Exchange Capacity (CEC) and soil type (Poggio et al. 2021). The elevation layer was derived from Shuttle Radar Topography Mission (SRTM) available at 30 arcseconds spatial resolution (~1 km) (SRTM 2013).
Model building and validation
Nine algorithms of machine learning, namely BIOCLIM, BRT, FDA, MARS, GLM, SVM, RF, CART and MAXLIKE were selected to obtain the best model for predicting the potential suitable distribution of Nothofagus. The best algorithm was used to generate predictive maps of current and future potential suitable areas that may change under climate change. After several repetitions, results showed that the Random Forest (RF) model outperformed other algorithms in achieving the desired outcome. The area under the curve (AUC) (Wang et al. 2022) and True Skill Statistic (TSS) (Stephenson 2000) were used to evaluate the performance of model prediction. The value of AUC has a range between 0 and 1; the closer the AUC value was to one, the more accurately the predictive model distinguished between presence and absence predictions (Fang et al. 2022). The TSS had the range from −1 to +1 in which the value of +1 indicated perfect agreement and the value of zero or less indicated that the performance was no better than random chance (Yudaputra 2020).
Eight environmental variables (Table 1) and 328 presence records were used as inputs for the nine algorithms. The data were split into training data for model building and testing data for model evaluation with a proportion of 75%:25%. In total, 1640 background points were set as input of the algorithms. The resulting predictive maps of current and future potential distribution areas were classified into four potential habitat categories (unsuitable, less suitable, suitable and highly suitable areas) and the total areas for each category were calculated (Fig. 2).
| Environmental variables | Current | Future (SSP 1–2.6) | Future (SSP 5–8.5) | |
|---|---|---|---|---|
| Annual mean temperature (BIO1) (°C) | 3.6–27.7 | 5.4–29.3 | 8.6–32.6 | |
| Annual precipitation (BIO12) (mm) | 1202–7322 | 1331–8061 | 1429–9007 | |
| Precipitation of the wettest month (BIO13) (mm) | 192–1080 | 194–1170 | 219–1110 | |
| Precipitation of the driest month (BIO14) (mm) | 12–506 | 12–542 | 10–551 | |
| Cation Exchange Capacity (CEC) (mmol(c) kg−1) | 0–526 | 0–526 | 0–526 | |
| Soil Organic Carbon (SOC) (dg kg−1) | 0–3733 | 0–3733 | 0–3733 | |
| Soil type | 0–23 | 0–23 | 0–23 | |
| Elevation (m) | −26–4634 | −26–4634 | −26–4634 |
Results
We found 328 presence records of 14 Nothofagus species in New Guinea. Presence records for each species included the following: Nothofagus brassii (n = 10), N. carrii (n = 29), N. crenata (n = 6), N. flaviramea (n = 37), N. grandis (n = 53), N. nuda (n = 2), N. perryi (n = 30), N. pseudoresinosa (n = 11), N. pullei (n = 68), N. resinosa (n = 20), N. rubra (n = 37), N. starkenborghiorum (n = 21), N. stylosa (n = 1) and N. womersleyi (n = 3) (GBIF.Org 2024; IUCN 2024). Fourteen species were found across the Island of New Guinea (Fig. 3), in parts of Indonesian Papua and Papua New Guinea (Table 2). Most of the presence records of Nothofagus species were located along the highlands of the Island of New Guinea, crossing almost the entire island.

| Species | Occurrence records | Indonesian Papua | Papua New Guinea | |
|---|---|---|---|---|
| Nothofagus brassii | 10 | 6 | 4 | |
| Nothofagus carrii | 29 | 4 | 25 | |
| Nothofagus crenata | 6 | 1 | 5 | |
| Nothofagus flaviramea | 37 | 9 | 28 | |
| Nothofagus grandis | 53 | 3 | 50 | |
| Nothofagus nuda | 2 | 2 | ||
| Nothofagus perryi | 30 | 30 | ||
| Nothofagus pseudoresinosa | 11 | 1 | 10 | |
| Nothofagus pullei | 68 | 10 | 58 | |
| Nothofagus resinosa | 20 | 5 | 15 | |
| Nothofagus rubra | 37 | 15 | 22 | |
| Nothofagus starkenborghiorum | 21 | 3 | 18 | |
| Nothofagus stylosa | 1 | 1 | ||
| Nothofagus womersleyi | 3 | 1 | 2 |
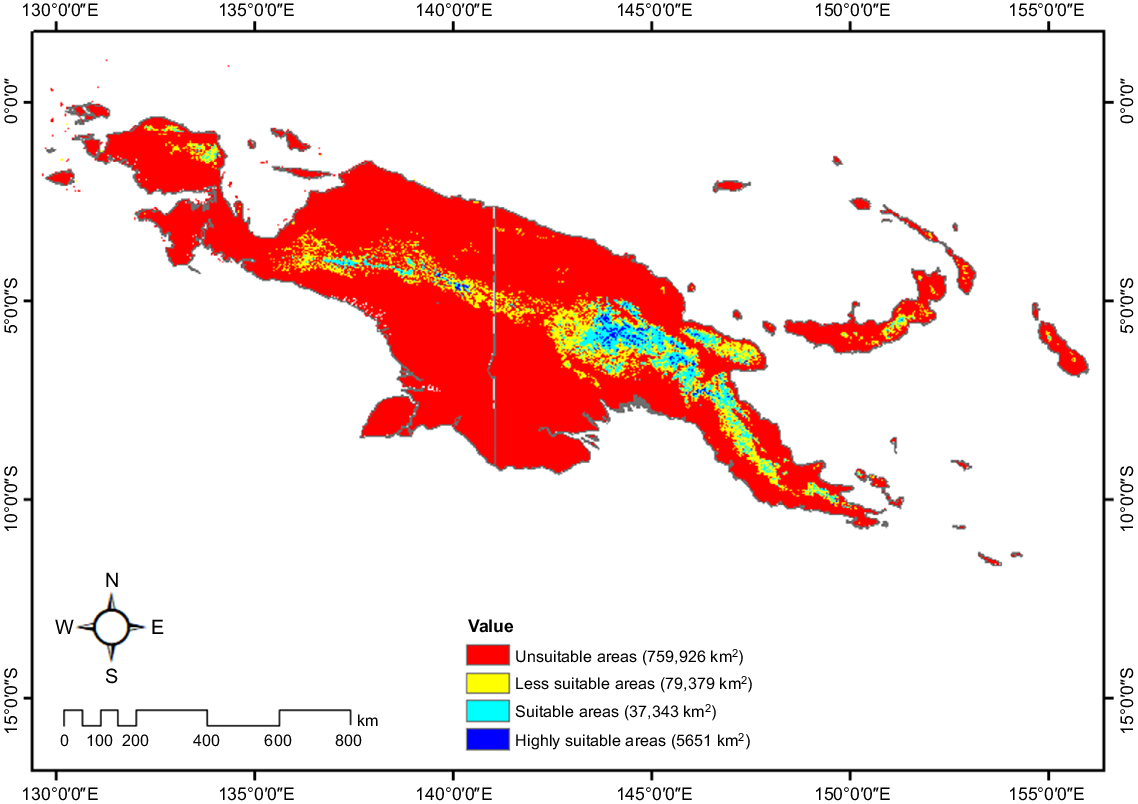
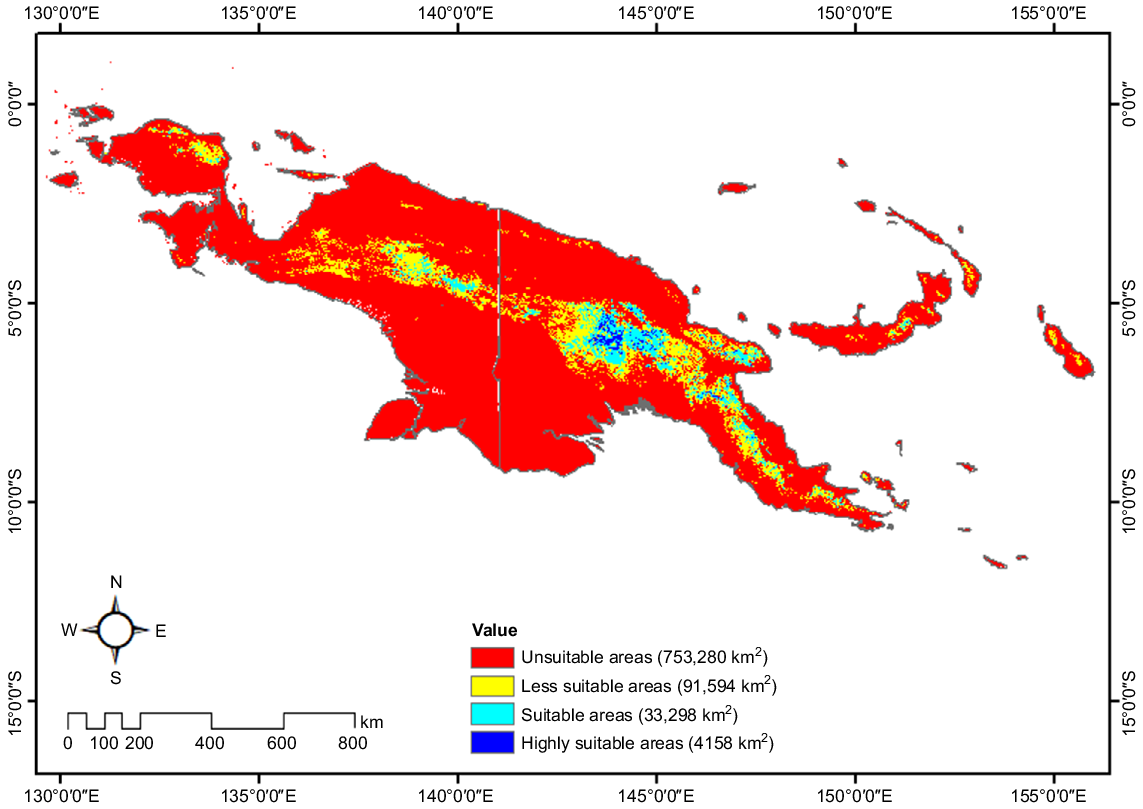
RF outperformed the other algorithms in predicting the potential suitable distribution of Nothofagus based on the AUC and TSS evaluation metrics. RF predicted the current potential distribution (unsuitable, less suitable, suitable and highly suitable) of Nothofagus covering 882,321 km2 of the Island of New Guinea. The current predictive map showed that the percentage of each potential distribution category included unsuitable, less suitable, suitable and highly suitable accounted for 84.5%, 10.13%, 4.76% and 0.61% (Fig. 4) of the total area, respectively, reflecting the proportion obtained for each suitability category based on the prediction model. In the period 2081–2100, using the SSP 1–2.6 climate scenario, the potential distribution of the species including unsuitable, less suitable, suitable and highly suitable covering the area of the Island of New Guinea accounted for percentages 86.13%, 9%, 4.23% and 0.64%. The predicted future potential distribution was located in the highlands of New Guinea (Fig. 5). In the period 2081–2100, using the second future climate scenario, SSP 5–8.5, the potential distribution of the species including unsuitable, less suitable, suitable and highly suitable covering the area of the Island of New Guinea accounted for percentages 85.37%, 10.38%, 3.77% and 0.47%. The predicted future potential distribution was located in the highlands of New Guinea, similar to the predictive distribution using SSP 1–2.6 scenario (Fig. 6).

Predictive future potential distribution (2100) of Nothofagus in the Island of New Guinea using the SSP 1–2.6 climate scenario.
Predictive future potential distribution (2100) of Nothofagus in the Island of New Guinea using the SSP 5–8.5 climate scenario.
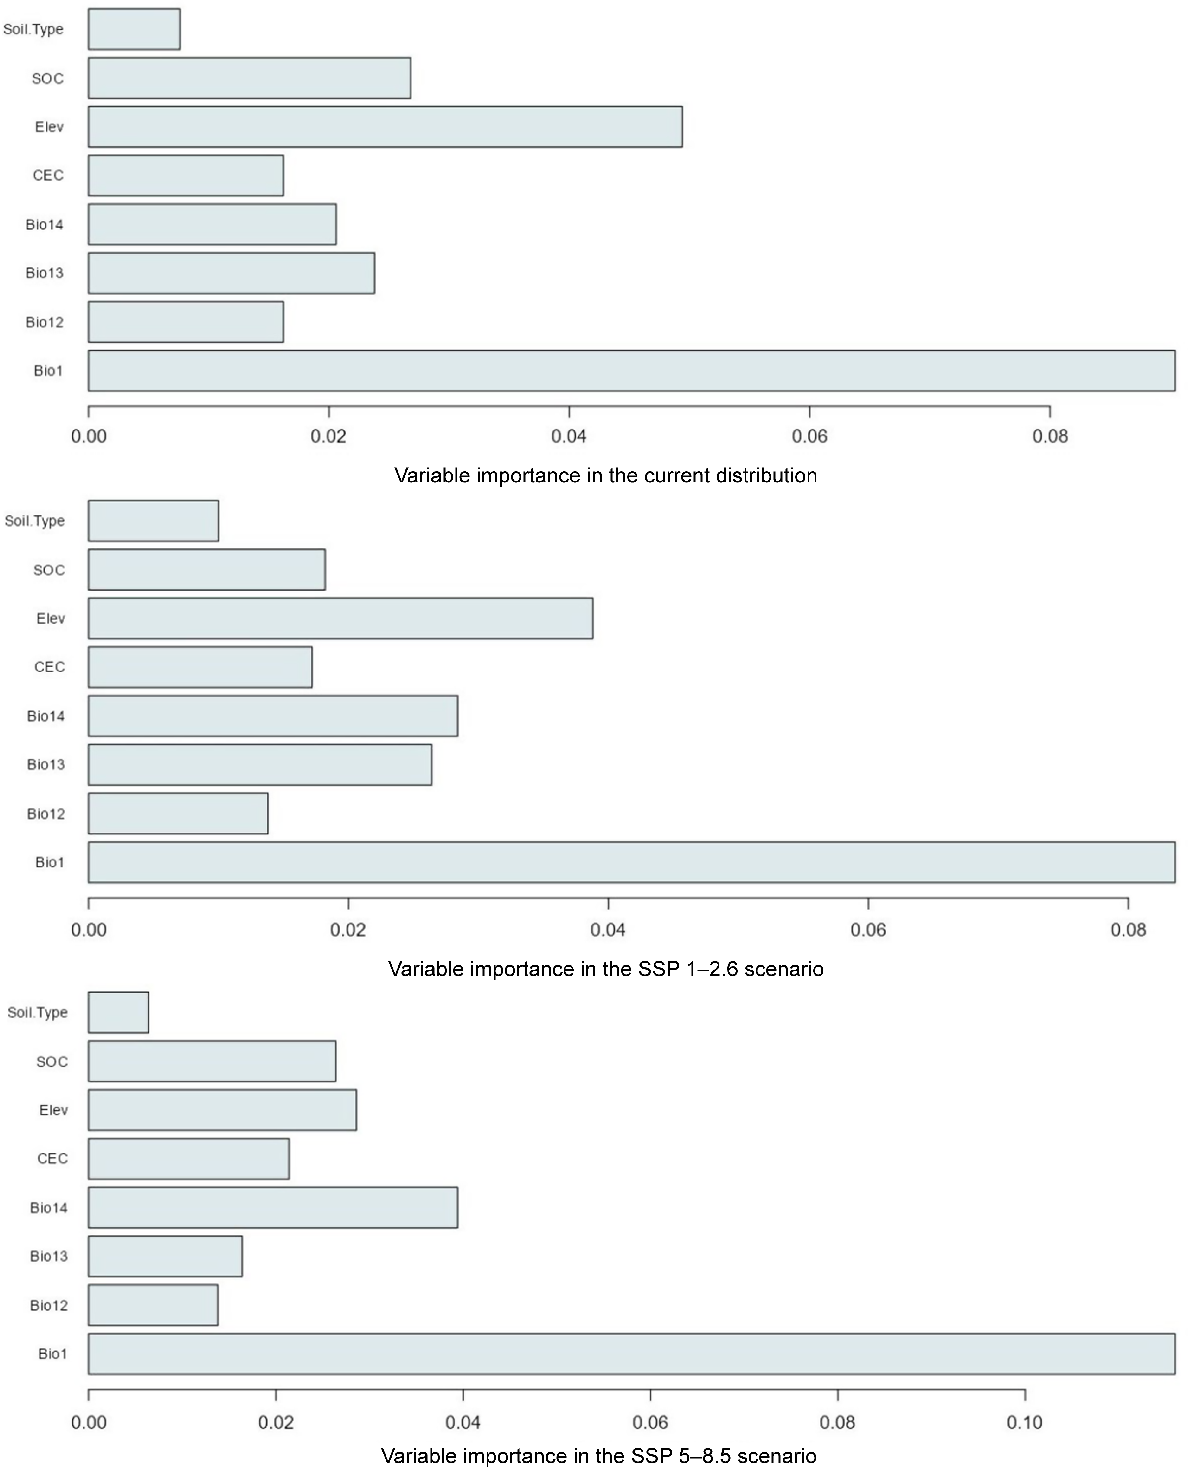
The potential suitable areas of Nothofagus using the SSP 1–2.6 climate scenario were predicted to decline by ~11.08% and expand by 5.12% for highly suitable areas from the current predictive map. Suitable and highly suitable areas using the SSP 5–8.5 climate scenario were predicted to decline by ~20.71% and 22.66% from the current predictive distribution. Variable importance analysis can be used to better understand the contributing factors that determine predicted suitable areas in future (Yudaputra et al. 2024). Annual mean temperature and elevation were the two highest contributing factors affecting the distribution of Nothofagus in the current and future predictions using the SSP 1–2.6 climate scenario. The future prediction using the SSP 5–8.5 climate scenario showed that mean annual temperature and precipitation of the driest month are the two highest contributing factors affecting the potential distribution of Nothofagus species (Fig. 7).
Variable importance of determining the distribution of Nothofagus in New Guinea. Note: Bio1 – mean annual temperature; Bio12 – annual precipitation; Bio13 – precipitation of the wettest month; Bio14 – precipitation of the driest month; CEC – Cation Exchange Capacity; Elev – elevation; SOC – Soil Organic Carbon.
Discussion
The predictive suitable and highly suitable potential distributions of Nothofagus species in the Island of New Guinea with both the SSP 1–2.6 and SSP 5–8.5 climate scenarios are predicted to decline from the current potential distribution in future. Shared Socio-economic Pathway scenarios have been widely used in impact, adaptation or vulnerability studies (Van Ruijven et al. 2014). SSP scenarios (SSP1, SSP2, SSP3, SSP4 and SSP5) are combined with future climate projections based on the Representative Concentration Pathway (RCP) (2.6, 4.5, 6.0 and 8.5) to develop integrated scenarios for use in assessment of impacts and adaptation to climate change (Lehtonen et al. 2021). This study was conducted under two different scenarios, a low-emission scenario, referring to the SSP 1–2.6 scenario and a high-emission scenario referring to the SSP 5–8.5 scenario (Kummu et al. 2021). SSP 1–2.6 represents the most optimistic climate change scenario with a forcing level of 2.6 W/m2 achieved in 2100 and SSP 5–8.5 represents a high emission scenario with a relevant forcing yield of 8.5 W/m2 in 2100 (Guo et al. 2022).
The predictive model shows that highly suitable, suitable and less suitable areas for the potential distribution of Nothofagus species are located along the highlands of the Island of New Guinea crossing almost the entire island, also known as the Central Cordillera (Fig. 4). Predictions of suitable areas are more prevalent in the Papua New Guinea region than Indonesian Papua, while highly suitable areas are only indicated in the Papua New Guinea region. In Indonesian Papua, the areas predicted to be suitable for the potential distribution of Nothofagus species are located in the highlands of south-west Papua, West Papua, Central Papua and Highland Papua provinces. In Papua New Guinea, areas predicted to be suitable for the potential distribution of Nothofagus species are located in the highlands of Sandaun, Western, East Sepik, Hela, Enga, Madang, Southern Highlands, Western Highlands, Eastern Highlands, Gulf, Jiwaka, Chimbu, Morobe, Central, Oro, Milne Bay, West New Britain, East New Britain and Bougainville provinces. Areas predicted to be highly suitable for the potential distribution of Nothofagus species in Papua New Guinea are located in the highlands of Hela, Enga, Madang, Southern Highlands, Western Highlands, Eastern Highlands, Gulf, Jiwaka, Chimbu, Morobe, Central, Oro, Milne Bay, West New Britain and East New Britain provinces.
Future climate scenarios show that the suitable to highly suitable potential distribution areas of Nothofagus species could lose ~4376 km2 (9.24%) under the SSP 1–2.6 scenario and ~9915 km2 (20.93%) under the SSP 5–8.5 scenario. According to the SSP 1–2.6 (Fig. 5) and the SSP 5–8.5 (Fig. 6) climate scenarios, a reduction or shift in the areas that are suitable and highly suitable is predicted from the current potential distribution. The SSP 1–2.6 climate scenario predicts an increase in unsuitable areas for the potential distribution of Nothofagus species, while the less suitable areas are predicted to decrease. Suitable and highly suitable areas for the potential distribution of Nothofagus species are predicted to decrease in the Papua New Guinea region, especially in the Morobe, Central and East New Britain provinces and an expansion or shift is predicted in the Indonesian Papua region, especially in the Central Papua and Highland Papua provinces. The SSP 5–8.5 climate scenario predicts an expansion or shift in suitable areas for the potential distribution of Nothofagus species in the Indonesian Papua region, especially in the Highland Papua province, while in the Papua New Guinea region, a reduction in both suitable and highly suitable areas is predicted in the Eastern Highlands, Madang, Central and East New Britain provinces.
Annual temperature is the most important factor for predicting the potential distribution of suitable areas for Nothofagus in the Island of New Guinea (Fig. 7). Average global surface temperatures during 2081–2100 are highly likely to be higher by 1.3–2.4°C under the low greenhouse gas (GHG) emissions scenario (SSP 1–2.6) and by 3.3–5.7°C in the very high GHG emissions scenario (SSP 5–8.5). Every additional 0.5°C of global warming causes a marked increase in the intensity and frequency of heat extremes, including heat waves, intense rainfall, and agricultural and ecological droughts in some regions (Masson-Delmotte et al. 2021). Plant distribution is expected to change in most future climate scenarios. If the temperature increases by 1–2°C, the distribution potential of plants may increase or decrease depending on the ecosystem in a region (Lan et al. 2022). If plant numbers decrease or the habitats become more fragmented, the number of suitable habitats available for some species may decrease or these habitats may even be completely lost. The climate of the Island of New Guinea is equatorial however over the past few decades the climate has changed dramatically (Pereira et al. 2019) and the temperature in New Guinea is expected to increase by 2.5°C in 2100 (Freeman and Class Freeman 2014). Nothofagus species in the Island of New Guinea grow at annual average temperatures ranging from 10.6 to 23.5°C, with an annual rainfall of 1762–7733 mm (Marshall and Beehler 2007).
Global climate change and other factors including elevation and soil characteristics affect plant species, particularly in spatial distribution. Climate change affects not only the phenological and physiological characteristics, and distribution of plant species but also how these species will survive in future (HamadAmin and Khwarahm 2023). When environmental conditions change and phenotypic plasticity is insufficient to maintain absolute fitness values, populations experience a downward trend that can lead to extinction (Torres et al. 2023). Awareness that distribution ranges of species (HamadAmin and Khwarahm 2023) may decrease or shift (Sharma et al. 2022) is highly important as these may lead to extinction or local extinction of species that are vulnerable to extinction and this has implications for conservation in different climate change scenarios (Lan et al. 2022). Elevation is the second most important variable affecting the potential distribution of Nothofagus species (Fig. 7). According to the predictive map of the current potential distribution of Nothofagus species (Fig. 4), suitable areas and highly suitable areas for Nothofagus habitat occur along the highlands of New Guinea, as expected because Nothofagus species naturally occur at altitudes between 1500 and 2800 m above sea level. Nothofagus is a shade-intolerant species requiring sufficient light for successful growth (Pollmann and Veblen 2004). Although air temperature decreases along the elevation gradient, solar radiation increases with elevation (Aschero et al. 2022). At higher elevations, Nothofagus are able to survive because with increasing elevation, competition and disturbances that can inhibit the growth of Nothofagus decrease (Pollmann and Veblen 2004). At lower elevations, Nothofagus can grow as seedlings but will not survive because the species cannot compete with other species (Pollmann and Veblen 2004). Summer drought also causes mortality in Nothofagus at low elevations because this species is better able to thrive in cold, wet conditions (Aschero et al. 2022).
The modelling of predictive current suitable distribution and recognising the impact of future climate change on future distributions could assist in the implementation of appropriate conservation strategies for species of Nothofagus. However, our study has potential limitations. We only used secondary data from online databases from GBIF and IUCN sources to build the predictive model. The combination of these data with survey data will increase the accuracy and relevance of the predictive model. Fieldwork to make an inventory of the species of Nothofagus should be carried out more intensively to make the predictive model more robust. We also only used physical environmental data as inputs for the model. A combination of physical environmental data with biotic factors, dispersal and population demographics will increase the relevance of the model for future studies. Further studies relating to the role of microclimatic factors for the species, population demography, and dispersal and capability of the species to adapt to environmental change are required for strengthening our findings.
Conclusions
The spatial distribution of Nothofagus in the Island of New Guinea was predicted to decline with climate change using the SSP 1–2.6 and SSP 5–8.5 climate scenarios. The suitable and highly suitable future distribution areas of Nothofagus, according to climate scenarios (SSP 1–2.6) and (SSP 5–8.5), are predicted to decline by 9.24% and 20.93% from current distributions respectively. These results provide comprehensive information regarding the potential impact of climate change on the distribution of Nothofagus in New Guinea.
Data availability
The data that support the findings of this study are available from the corresponding author upon reasonable request.
Acknowledgements
We are grateful to the Biology Department of the Faculty of Mathematics and Natural Sciences, Padjadjaran University (UNPAD) and the National Research and Innovation Agency (BRIN) for supporting this study.
References
Aschero V, Srur AM, Guerrido CM, Villalba R (2022) Contrasting climate influences on Nothofagus pumilio establishment along elevational gradients. Plant Ecology 223, 369-380.
| Crossref | Google Scholar |
Fang B, Zhao Q, Qin Q, Yu J (2022) Prediction of potentially suitable distribution areas for Prunus tomentosa in China based on an optimized MaxEnt model. Forests 13(3), 381.
| Crossref | Google Scholar |
Fick SE, Hijmans RJ (2017) WorldClim 2: new 1-km spatial resolution climate surfaces for global land areas. International Journal of Climatology 37(12), 4302-4315.
| Crossref | Google Scholar |
Freeman BG, Class Freeman AM (2014) Rapid upslope shifts in New Guinean birds illustrate strong distributional responses of tropical montane species to global warming. Proceedings of the National Academy of Sciences 111(12), 4490-4494.
| Crossref | Google Scholar |
GBIF.Org (2024) GBIF occurrence download. The Global Biodiversity Information Facility. Available at https://www.gbif.org/occurrence/download/0015680-241107131044228
Guo Y, Yu X, Xu Y-P, Wang G, Xie J, Gu H (2022) A comparative assessment of CMIP5 and CMIP6 in hydrological responses of the Yellow River Basin, China. Hydrology Research 53(6), 867-891.
| Crossref | Google Scholar |
HamadAmin BA, Khwarahm NR (2023) Mapping impacts of climate change on the distributions of two endemic tree species under socioeconomic pathway scenarios (SSP). Sustainability 15(6), 5469.
| Crossref | Google Scholar |
Harvey BJ, Enright NJ (2022) Climate change and altered fire regimes: impacts on plant populations, species, and ecosystems in both hemispheres. Plant Ecology 223, 699-709.
| Crossref | Google Scholar |
IUCN (2024) Nothofagus. The IUCN Red List of Threatened Species. Available at https://www.iucnredlist.org
Kappelle M, Van Vuuren MMI, Baas P (1999) Effects of climate change on biodiversity: a review and identification of key research issues. Biodiversity & Conservation 8, 1383-1397.
| Crossref | Google Scholar |
Kummu M, Heino M, Taka M, Varis O, Viviroli D (2021) Climate change risks pushing one-third of global food production outside the safe climatic space. One Earth (Cambridge, Mass.) 4(5), 720-729.
| Crossref | Google Scholar | PubMed |
Lan Z, Huiliang L, Hongxiang Z, Yanfeng C, Lingwei Z, Kudusi K, Taxmamat D, Yuanming Z (2022) Potential distribution of three types of ephemeral plants under climate changes. Frontiers in Plant Science 13, 1035684.
| Crossref | Google Scholar |
Lehtonen HS, Aakkula J, Fronzek S, Helin J, Hildén M, Huttunen S, Kaljonen M, Niemi J, Palosuo T, Pirttioja N, Rikkonen P, Varho V, Carter TR (2021) Shared socioeconomic pathways for climate change research in Finland: co-developing extended SSP narratives for agriculture. Regional Environmental Change 21, 7.
| Crossref | Google Scholar |
Masson-Delmotte V, Zhai P, Pirani S, Connors C, Péan S, Berger N, Caud Y, Chen L, Goldfarb M, Scheel Monteiro PM (2021) IPCC, 2021: Summary for Policymakers. In ’Climate Change 2021: the physical science basis’. Contribution of working group I to the sixth assessment report of the Intergovernmental Panel on Climate Change. (Cambridge University Press: United Kingdom).
Mathias S, van Galen LG, Jarvie S, Larcombe MJ (2023) Range reshuffling: climate change, invasive species, and the case of Nothofagus forests in Aotearoa New Zealand. Diversity and Distributions 29(11), 1402-1419.
| Crossref | Google Scholar |
Molowny-Horas R, Suarez ML, Lloret F (2017) Changes in the natural dynamics of Nothofagus dombeyi forests: population modeling with increasing drought frequencies. Ecosphere 8(3), e01708.
| Google Scholar |
Muluneh MG (2021) Impact of climate change on biodiversity and food security: a global perspective—a review article. Agriculture & Food Security 10, 36.
| Crossref | Google Scholar |
Ondiko JH, Karanja AM, Ombogo O (2022) A review of the anthropogenic effects of climate change on the physical and social environment. Open Access Library Journal 9(2), 1-14.
| Google Scholar |
Paull R, Hill RS (2003) Nothofagus kiandrensis (Nothofagaceae subgenus Brassospora), a new macrofossil leaf species from Miocene sediments at Kiandra, New South Wales. Australian Systematic Botany 16(4), 549-559.
| Crossref | Google Scholar |
Pereira FB, Renagi O, Panakal JJ, Anduwan G (2019) A study of climate variability in Papua New Guinea. Journal of Geoscience and Environment Protection 7(5), 45-52.
| Crossref | Google Scholar |
Poggio L, De Sousa LM, Batjes NH, Heuvelink GBM, Kempen B, Ribeiro E, Rossiter D (2021) SoilGrids 2.0: producing soil information for the globe with quantified spatial uncertainty. SOIL 7(1), 217-240.
| Crossref | Google Scholar |
Pollmann W, Veblen TT (2004) Nothofagus regeneration dynamics in south-central Chile: a test of a general model. Ecological Monographs 74(4), 615-634.
| Crossref | Google Scholar |
Read J, Hope G, Hill R (1990) The dynamics of some Nothofagus-dominated rain forests in Papua New Guinea. Journal of Biogeography 17(2), 185-204.
| Crossref | Google Scholar |
Reiter EJ, Weigel R, Walentowski H, Loguercio GA, Fierke J, Winter AFN, Simon A, Kotowska MM, Joelson NZ, Caselli M, Leuschner C (2024) Climate vulnerability of Nothofagus pumilio, Nothofagus dombeyi and Austrocedrus chilensis in northern Patagonia’s temperate forests. Forest Ecology and Management 572, 122261.
| Crossref | Google Scholar |
Romero EJ (1986) Fossil evidence regarding the evolution of Nothofagus Blume. Annals of the Missouri Botanical Garden 73(2), 276-283.
| Crossref | Google Scholar |
Sharma J, Singh R, Garai S, Rahaman SM, Khatun M, Ranjan A, Mishra SN, Tiwari S (2022) Climate change and dispersion dynamics of the invasive plant species Chromolaena odorata and Lantana camara in parts of the central and eastern India. Ecological Informatics 72, 101824.
| Crossref | Google Scholar |
Stephenson DB (2000) Use of the “odds ratio” for diagnosing forecast skill. Weather and Forecasting 15(2), 221-232.
| Crossref | Google Scholar |
Sun Y, Sun Y, Yao S, Akram MA, Hu W, Dong L, Li H, Wei M, Gong H, Xie S, Aqeel M, Ran J, Degen AA, Guo Q, Deng J (2021) Impact of climate change on plant species richness across drylands in China: from past to present and into the future. Ecological Indicators 132, 108288.
| Crossref | Google Scholar |
Torres E, García-Fernández A, Iñigo D, Lara-Romero C, Morente-López J, Prieto-Benítez S, Rubio Teso ML, Iriondo JM (2023) Facilitated adaptation as a conservation tool in the present climate change context: a methodological guide. Plants 12(6), 1258.
| Crossref | Google Scholar | PubMed |
Urrutia-Jalabert R, Barichivich J, Rozas V, Lara A, Rojas Y, Bahamondez C, Rojas-Badilla M, Gipoulou-Zuñiga T, Cuq E (2021) Climate response and drought resilience of Nothofagus obliqua secondary forests across a latitudinal gradient in south-central Chile. Forest Ecology and Management 485, 118962.
| Crossref | Google Scholar |
Van Ruijven BJ, Levy MA, Agrawal A, Biermann F, Birkmann J, Carter TR, Ebi KL, Garschagen M, Jones B, Jones R, Jones R, Kemp-Benedict E, Kok M, Kok K, Lemos MC, Lucas PL, Orlove B, Pachauri S, Parris TM, Patwardhan A, Petersen A, Preston BL, Ribot J, Rothman DS, Schweizer VJ (2014) Enhancing the relevance of shared socioeconomic pathways for climate change impacts, adaptation and vulnerability research. Climatic Change 122, 481-494.
| Crossref | Google Scholar |
Vento B, Agrain F, Puebla G (2024) Ancient Antarctica: the early evolutionary history of Nothofagus. Historical Biology 36(1), 136-146.
| Crossref | Google Scholar |
Wang M, Chen H, Lei M (2022) Identifying potentially contaminated areas with MaxEnt model for petrochemical industry in China. Environmental Science and Pollution Research 29(36), 54421-54431.
| Crossref | Google Scholar | PubMed |
Weston PH, Hill RS (2013) Southern (Austral) ecosystems. In ‘Encyclopedia of biodiversity’. 2nd edn. (Ed. SA Levin) pp. 612–619. (Academic Press: Waltham) 10.1016/B978-0-12-384719-5.00271-9
Yudaputra A (2020) Modelling potential current distribution and future dispersal of an invasive species Calliandra calothyrsus in Bali Island, Indonesia. Biodiversitas 21(2), 674-682.
| Crossref | Google Scholar |
Yudaputra A, Munawaroh E, Usmadi D, Purnomo DW, Astuti IP, Puspitaningtyas DM, Handayani T, Garvita RV, Aprilianti P, Wawangningrum H, Renjana E, Handini E, Angio MH, Firdiana ER, Witono JR, Juswara LS, Fijridiyanto IA, Ariati SR, Yuzammi , Sudarmono S, Wanda IF, Wibowo ARU, Wati RK, Hutabarat PWK, Raharjo PD, Mar’atus Solihah S, Saputra R, Cropper WP, Jr (2024) Vulnerability of lowland and upland orchids in their spatially response to climate change and land cover change. Ecological Informatics 80, 102534.
| Crossref | Google Scholar |