

Impacts of river regulation and fragmentation on platypuses in the northern Murray–Darling Basin
Jasmine Khurana A , Gilad Bino A * and Tahneal Hawke A B
A
B
Abstract
River regulation affect freshwater species by disrupting the natural flow regime and connectivity.
Investigate the impact of river regulation on platypus populations on four regulated rivers within the northern Murray–Darling Basin.
Assessment of hydrology, live trapping downstream of large dams, multi-species environmental DNA surveys in upstream and downstream sections.
There were significant changes in flow seasonality and cold-water pollution as a result of river regulation. Upstream sections experienced prolonged periods of ceased flow, most recently during an extreme drought between 2017 and 2020. eDNA surveys detected platypuses downstream of all dams but failed to find evidence of them upstream in two rivers, indicating possible local extinctions. Capture of four platypuses in the Severn River and four, in very poor condition, in the Peel River, and none in the Gwydir River or Pike Creek–Dumaresq River. Significant differences in macroinvertebrate communities, implying possible impacts on platypus diet.
River regulation and habitat fragmentation affect platypus populations, namely disappearance from upstream sections, low downstream capture rates and the poor body condition.
Urgent need for catchment-scale river management strategies that preserve ecological functions and connectivity and improve resilience to protect and sustain platypus populations, indicating directions for future research and conservation efforts.
Keywords: Australia, biodiversity, eDNA, freshwater, macroinvertebrates, mammal, monotreme, river regulation.
Introduction
Freshwater ecosystems play a pivotal role in sustaining global biodiversity and providing essential ecosystem services (Junk et al. 2014; Kingsford et al. 2016), despite comprising only a mere 2.3% of the Earth’s surface. Despite their limited spatial extent, these ecosystems support ~10% of all known animal species, and approximately one-third of all vertebrates (Abell et al. 2008; Reid et al. 2019). In conjunction, these ecosystems provide humanity with indispensable benefits and services such as water supply, food provision, groundwater recharge, carbon sequestration and tourism opportunities (Davis et al. 2013). They also hold profound spiritual and cultural significance for many communities, serving as sacred sites or focal points for rituals, ceremonies and traditional practices, fostering the preservation of indigenous knowledge, identities and heritage (Miller et al. 2015; Noble et al. 2016). Despite their undeniable significance, extreme degradation of freshwater ecosystems is occurring (Allan et al. 2005; Strayer and Dudgeon 2010; van Asselen et al. 2013). Over 60% of global natural wetland area has been lost over the past century, this being most pronounced in inland wetlands (Davidson 2014). Between 1970 and 2016, an estimated decline of 84% occurred in freshwater species populations (He et al. 2017).
Nearly two-thirds of major rivers worldwide are now regulated by dams (Davidson 2014; Grill et al. 2019). Large dams support multiple services, including flood mitigation, power generation and water supply, but also alter the natural flow regimes and water quality, and lead to disruption of critical ecosystem function and affect flow-dependent species such as fish, waterbirds and mammals (Poff et al. 1997; Puckridge et al. 1998). The structure and function of freshwater ecosystems are inherently dependent on the dynamic character of streamflow, which influences ecosystem health, water quality, food abundance and biotic interactions (Poff et al. 1997). High and low flow patterns regulate crucial ecological processes, maintaining connectivity, nutrient cycling and occasional floods that rejuvenate ecosystems (Jenkins and Boulton 2003; Rood et al. 2005). However, extended low flows can stress species and cause habitat deterioration, leading to declines in biodiversity and ecosystem function (Boulton et al. 1992; Poff et al. 1997; Dahm et al. 2003; Matthews and Marsh-Matthews 2003; Magalhaes et al. 2007). The accumulated effect of river regulation has altered both the ecology and hydrology of freshwater ecosystems, leading to adverse effects, particularly downstream, such as decreased wetland connectivity, channel narrowing, bank erosion and reduced survival of sediment-sensitive species (Poff et al. 1997; Nielsen et al. 2020). Large dams also alter downstream water temperatures as a result of thermal stratification that can extend up to 300 km downstream from the dam wall and decrease water temperatures by up to 16°C (Lugg and Copeland 2014; Parisi et al. 2020). Prolonged exposure to low water temperatures has a negative effect on fish physiology, leading to declines in locomotion, metabolism and growth, regardless of whether the temperatures decrease gradually, intermediately or rapidly (Parisi et al. 2020, 2022). Cold-water pollution has contributed to the decline of native fish species (Astles et al. 2003; Michie et al. 2020). Changes to temperature regimes also affect invertebrate communities, a foundational component of the freshwater food web (Vannote and Sweeney 1980; Voelz et al. 1994; Glazier 2012; Arai et al. 2015; Bonacina et al. 2023).
The platypus (Ornithorhynchus anatinus), a unique native Australian mammal, is one of only five extant monotreme species, possessing a range of specialised adaptations for its semi-aquatic lifestyle (Bino et al. 2019). Inhabiting freshwater ecosystems including rivers, creeks and wetlands, the platypus is a nocturnal predator of aquatic invertebrates (Manger et al. 1998). Platypuses are dependent on freshwater as well as the riparian zone for their habitat, and are in many ways an indicator of freshwater ecosystem health and functioning (Koch et al. 2006). Platypuses occur across much of eastern Australia (Bino et al. 2019), significantly overlapping with Australia’s most regulated rivers, with dams being present in 40.8% of subcatchments in which platypuses have been recorded (Bino et al. 2020). Major dams and their reservoirs create barriers for platypuses, disrupting movements of animals, diminishing genetic diversity of isolated populations (Mijangos et al. 2022). The regulation of water by large dams and disruption of the natural flow regime also affect downstream platypus populations, potentially through impoverishing food availability and affecting breeding success (Hawke et al. 2021). A recent national assessment estimated declines of 21.3% across it species’ range, being greatest in the Gulf of Carpentaria (40.5%) and the Murray–Darling Basin (27.9%), and within the states of Queensland (Qld) (29.6%) and New South Wales (NSW) (28.5%) (Hawke et al. 2020). Understanding the impacts on platypus populations is needed to develop effective conservation strategies to protect it from further declines. The present study aims to evaluate platypus populations and availability of their prey on regulated rivers in the northern Murray–Darling Basin and assess the extent to which the natural flow regime has been altered.
Materials and methods
Study areas
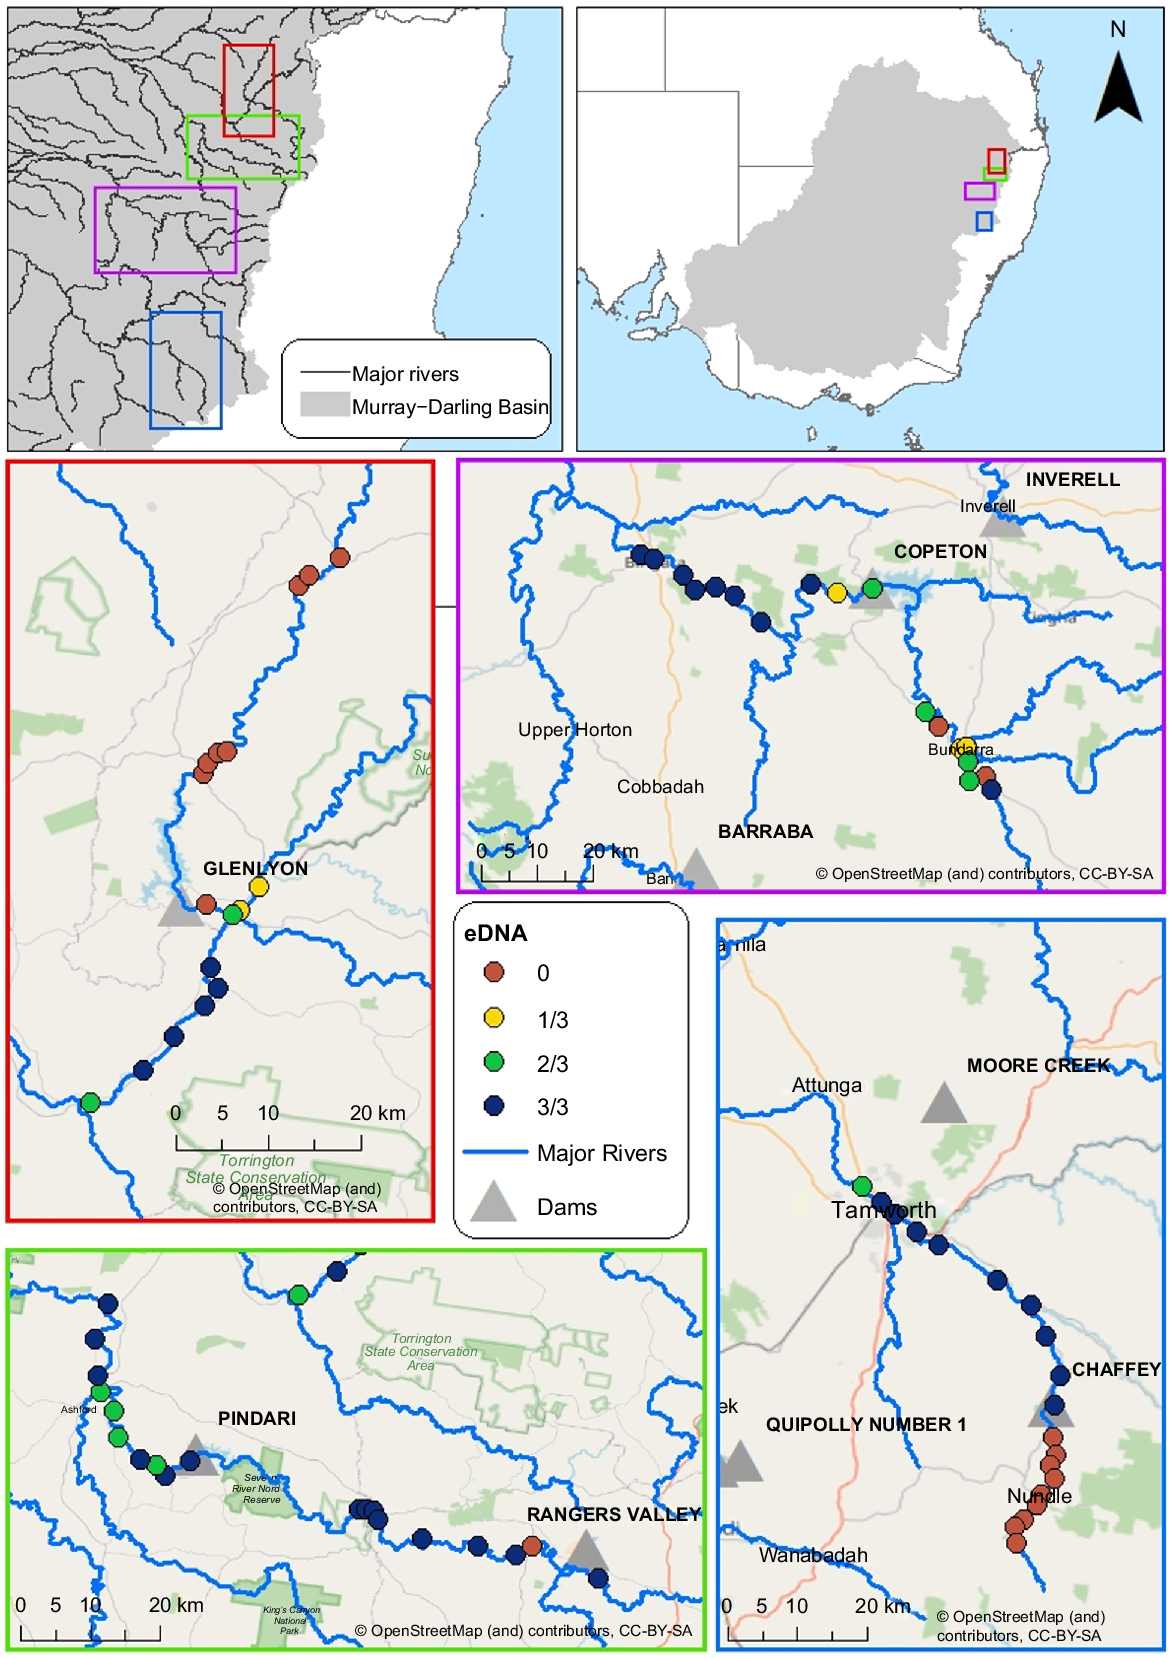
This study focused on four regulated rivers in the northern Murray Darling Basin (Fig. 1) in NSW and parts of southern Qld, Australia. The northern Murray–Darling Basin consists of an interconnected system of generally western and south-western flowing rivers. These were Pike Creek–Dumaresq River upstream and downstream of Glenlyon Dam in the Border Rivers catchment (29 m wall height, 254-GL storage capacity, constructed in 1976), the Gwydir River upstream and downstream of Copeton Dam in the Gwydir catchment (113 m, 1346-GL storage capacity, constructed in 1976), the Severn River upstream and downstream of Pindari Dam in the Border Rivers catchment (85 m, 312-GL storage capacity, constructed in 1969), and the Peel River upstream and downstream of Chaffey Dam in the Namoi–Peel catchment (43 m, 101-GL storage capacity, constructed in 1979). River flows are heavily regulated downstream of these large storage dams, contrasted by minimal regulation upstream of the dam wall. Releases from the reservoir and downstream inflows are used for farming, irrigation and to deliver water to communities and the environment. There are no thermal-pollution mitigation infrastructures or fish-passage devices present in these dams. Environmental flow allocations, as part of the Water Sharing Plan (NSW Water Management Act 2000), exist for all four dams. The study area encompasses the Nandewar and New England Tablelands biogeographic regions (Department of Climate Change, Energy, the Environment and Water 2012). The Nandewar bioregion is mostly warm and dry but varies considerably in relation to elevation. The Nandewar bioregion is characterised by box (Eucalyptus sp.) woodlands in the more productive soils, typically at low to mid-elevation and ironbark (Eucalyptus sp.) and cypress pine (Callitris sp.) in the less productive soils. The New England Tablelands bioregion presents at higher elevations, is mainly temperate to cool temperate, with montane climate at higher elevations with open forests and woodlands, whereas the north-eastern boundary has a warmer, subhumid climate.
River flows and temperature
To evaluate the impact of river regulation and habitat quality on platypus numbers and distribution, we assessed the flow regime and water temperatures in each of the four rivers, above (upstream) and below (downstream) the dam. We downloaded historical river gauge data for the three NSW rivers (Peel, Gwydir and Severn rivers) from WaterNSW’s database (see http://realtimedata.water.nsw.gov.au), and for the Qld river (Pike Creek) we downloaded the data from Qld Water Monitoring Information Portal (see https://water-monitoring.information.qld.gov.au). For the three NSW rivers, we downloaded daily discharge (ML day−1) volumes between 2002 and 2022 for both the upstream and downstream gauges (Table 1). For Pike Creek (Qld), because there were no currently running upstream gauges, we used a discontinued upstream river gauge that had data between 1976 and 1988 and downloaded data of similar period from the downstream gauge (Table 1). For each river gauge, we calculated the total seasonal flows (summer, December–February; autum, March–May; winter, June–August; spring, September–November), and then for each year, we calculated the seasonal proportion of total discharge. We also calculated the total number of days in each season in which discharge was zero (cease-to-flow). For water temperatures, data were available only for the three NSW rivers, with varying ranges for both downstream and upstream sections: Gwydir (2013–2022), Peel (2011–2022) and Severn (2002–2022) (Table 1).
| River | Section | Gauge name and number | Evaluation period (discharge) | Evaluation period (water temperature) | |
|---|---|---|---|---|---|
| Pike | Upstream | Clearview 416303C | 1976–1988 | NA | |
| Pike | Downstream | Glenlyon Dam T/W 416309B | |||
| Gwydir | Upstream | Bundarra 418008 | 2002–2022 | 2013–2022 | |
| Gwydir | Downstream | Downstream Copeton Dam 418026 | |||
| Severn | Upstream | Strathbogie 416039 | 2002–2022 | 2002–2022 | |
| Severn | Downstream | Ducca Marrin 416067 | |||
| Peel | Upstream | Taroona 419081 | 2002–2022 | 2011–2022 | |
| Peel | Downstream | D/S Chaffey Dam 419045 |
D/S, downstream.
To evaluate differences between upstream and downstream river sections, for each of the four seasons, we used the Wilcoxon rank-sum test, appropriate for two independent samples that do not follow a normal distribution (Wilcoxon 1945). To evaluate seasonal variations in discharge within each river section (downstream or upstream), we used the Kruskal–Wallis test, an extension of the Wilcoxon rank-sum test for more than two groups, which similarly does not assume a normal distribution of the data (Kruskal and Wallis 1952). Following a significant Kruskal–Wallis test, we used a post hoc pairwise comparisons by using the Wilcoxon rank-sum test with a Bonferroni correction to control for the increase in Type I error associated with multiple comparisons (Dunn 1964). Data analysis was conducted using R statistical software (ver. 4.4.0, R Foundation for Statistical Computing, Vienna, Austria, see https://www.r-project.org/).
Platypus surveys
Live trapping of platypuses was undertaken from 20 June 2023 to 4 July 2023 at three sites downstream of the dams on the Gwydir, Peel and Severn Rivers, and Pike Creek–Dumaresq River (Fig. 1), for a total of 12 sites. Only one site could be surveyed downstream of Glenlyon Dam on Pike Creek, because it was a short and shallow river section. Two sites were surveyed further downstream after the confluence with the Dumaresq River. Survey sites for each river were selected using existing knowledge of platypus sightings, by using Atlas records and in consultation with local communities and the Commonwealth Environmental Water Holder. Survey sites were spaced 3–5 km apart to minimise the likelihood of recapturing platypuses between sites and to provide a better estimate of population sizes (Hawke et al. 2021).
Platypuses were captured using unweighted mesh nets (Bino et al. 2018). At each location, 25–50 m of mesh net was deployed, parallel to the riverbank, by using a small unpowered 6-ft (~1.8-m) punt. Nets were set at dusk (c. 17:00 hours) and monitored continuously until removal of nets approximately at midnight. Once captured, the animals were carefully removed from the nets and placed in pillowcases situated in a cool, dark environment until processing. Platypuses were processed following established protocols (Bino et al. 2018). Each animal was anaesthetised using isoflurane gas inside an induction chamber for 5–7 min (Pharmachem 5% in oxygen, 3 L min−1). Anaesthesia was then maintained through a T-piece facemask (isoflurane 1.5% in oxygen, 1 L min−1) (Whittington and Grant 1983; Chinnadurai et al. 2016). Vital signs (pulse, SPO2, temperature) were continuously monitored throughout the procedures.
Platypuses were implanted with a passive integrated transponder tag (Trovan ID-100B/125), facilitating the identification of recaptures. Each platypus was sexed and weighed and had body measurements taken. A tail volume-index (TVI) score was also recorded from all individuals to assess fat stores within the tail (ranging from 1 to 5, five indicating the poorest condition). Blood was collected from the bill sinus of platypuses (~2 mL) by using established methods (Whittington and Grant 1983). Blood serums were analysed by Vetnostics Laboratory, by using a Cobas 8000 (Roche Diagnostic Systems), providing chemistry data for albumin (g L−1), alanine aminotransferase (ALT, U L−1), aspartate aminotransferase (AST, U L−1), cholesterol (mmol L−1), creatinine (μmol L−1), triglycerides (mmol L−1) and urea (mmol L−1). We used the Mann–Whitney U-test to compare the biochemical values between the two independent groups, because this non-parametric method does not assume a normal distribution of the data (Mann and Whitney 1947).
All platypuses were captured and handled under UNSW AEC ethics (22/130B), DPIE scientific licence (SL101655), DPIE scientific collection permit (P15/0096-2.0 & OUT20/15426) and Qld Research Permit WA0052230.
eDNA surveys
To assess the presence and distribution of platypuses and benthic macroinvertebrates, we conducted environmental DNA (eDNA) surveys along rivers spaced at ~3-km intervals, covering a ~30-km distance both upstream and downstream of the dam walls. In total, we surveyed 73 sites between May and June 2023 (Fig. 1). eDNA samples were collected using prepared kits from Wilderlab (see https://www.wilderlab.co.nz/). At each site, 50 mL of water was drawn up through a syringe, just below the surface of the water. The water was then passed through a filter until 1 L of water was filtered, or the filter became clogged, and then a preservative was added to the filter. This procedure was repeated three times at each site to increase detection reliability. Multispecies sample analysis and sequencing was performed by Wilderlab by using the basic freshwater eDNA package.
To assess differences in the macroinvertebrate communities from detected eDNA, we first filtered out phyla consisting of microscopic organisms, algae, fungi and vertebrates and retained the following six phyla for analyses: Annelida, Arthropoda, Nematoda, Cnidaria, Porifera, Mollusca and Nemertea. We compared differences in macroinvertebrates upstream and downstream of dams by comparing (1) the total number of unique orders and families detected, (2) the average number of orders and families detected at each site, (3) the prevalence of orders and families (number of sites they were detected), and (4) the multivariate community composition of orders.
Given the small sample sizes and the nature of count and proportional data, we compared differences in the number of orders and families present at each site between the upstream and downstream sections of each river by using non-parametric Wilcoxon signed-rank tests. To compare overall order composition between upstream and downstream river sections, we performed multivariate generalised linear models in the mvabund package (function ‘manyglm’, ver. 4.2.1, see https://cran.r-project.org/package=mvabund; Wang et al. 2012), using a binominal distribution. We found no pattern in the distribution of residuals to indicate a poor fit of any models. Additionally, we used univariate models, implemented in the ‘manyglm’ function, to examine which orders contributed significantly to the differences in composition. Models were performed separately for each river system. We visualised differences using non-metric multidimensional scaling (NMDS) to compare order composition between upstream and downstream sections of each river, by using the Bray–Curtis dissimilarity matrix. Data analysis was conducted using R statistical software (ver. 4.4.0, R Foundation for Statistical Computing).
Results
River flows and temperature
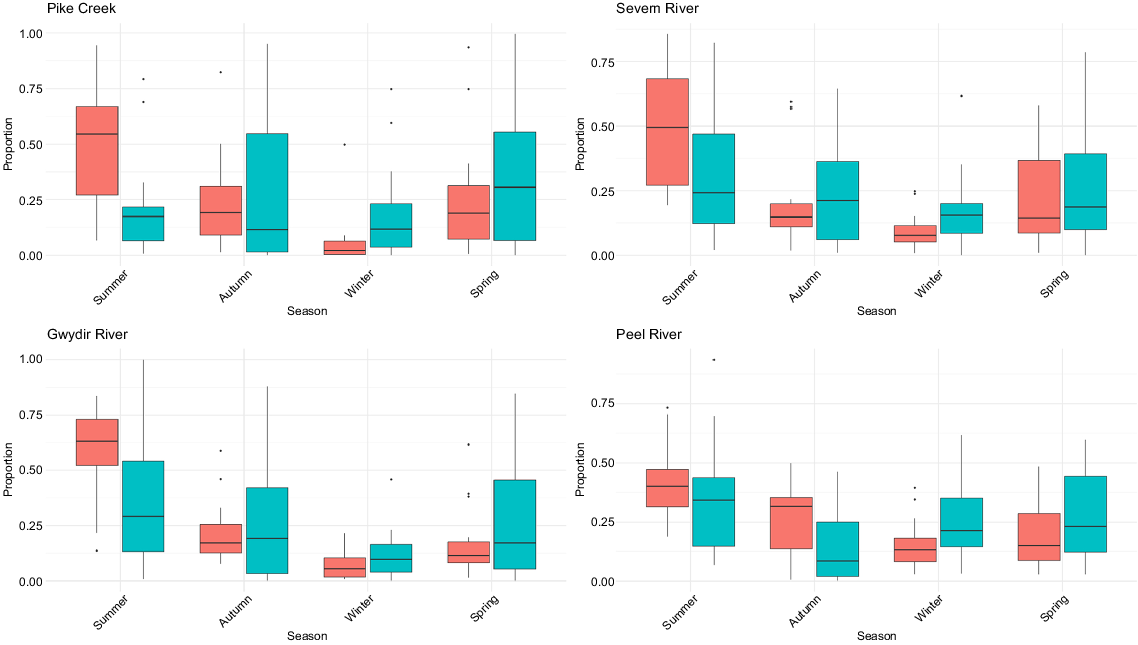
On Pike Creek, the annual proportion of discharge was significantly higher downstream than upstream proportions in summer (V = 7, P < 0.001), and lower in winter (V = 89, P = 0.020) (Fig. 2). The annual proportion of discharge was similar between upstream and downstream sections in autumn (V = 52, P = 1.000) and spring (V = 85, P = 0.169), partially owing to the large natural variability of the upstream flows compared with those in the downstream sections (Supplementary Tables S1–S4). Within the downstream section, the annual proportions of discharge varied (χ2 = 25.7, P < 0.001) and were significantly (P < 0.01) higher in summer than in all other seasons, and in winter significantly lower than in autumn (P = 0.003) and spring (P = 0.009). In the upstream section, no variation was present (χ2 = 1.35, P = 0.72). Between 1976 and 1988, ‘cease-to-flows’ days were higher in the upstream section than in the downstream section (Fig. 3). Of the 12 years examined, 6 years had over 130 days of ‘cease-to-flow’ in the upstream section, compared with 3 years with over 30 days in the downstream section.
Seasonal proportions of total discharge in the upstream (blue) and downstream (red) sections of the dam in the four rivers (Gwydir, Peel, Severn, Pike) (see Table 1 for gauge details).
Annual seasonal ‘cease-to-flow’ (CTF) days in the upstream (US, blue) and downstream (DS, red) sections of the dam in the four rivers (Gwydir, Peel, Severn, Pike) (Table 1 for gauge details).
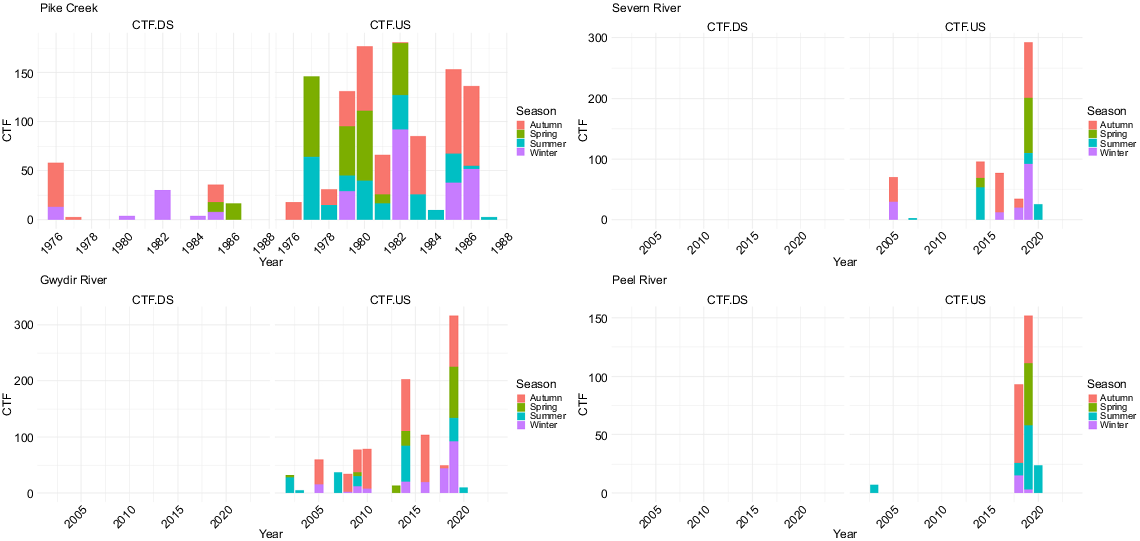
On the Severn River, the annual proportion of discharge was significantly higher downstream in summer (V = 46, P = 0.007) and lower in winter (V = 218, P = 0.002) (Fig. 2). The annual proportion of discharge was similar between upstream and downstream sections in autumn (V = 164, P = 0.23) and spring (V = 125, P = 0.76) (Tables S1–S4). Within the downstream section, the annual proportions of discharge varied (χ2 = 39.1, P < 0.001) and were significantly (P < 0.01) higher in summer than in all other seasons, and in winter significantly lower than in autumn (P = 0.01) and spring (P < 0.001). In the upstream section, no variation was present (χ2 = 5.0, P = 0.17). Between 2002 and 2022, there were no ‘cease-to-flow’ days in the downstream section, whereas there were 4 years with over 70 ‘cease-to-flow’, including 2019, having 293 days (Fig. 3). Annual water temperatures downstream of Pindari Dam were significantly lower in spring (V = 296, P = 0.011), and summer (V = 349.5, P < 0.001), but higher in winter (V = 1, P < 0.001) (Fig. 4, Tables S1–S4).
Maximum monthly water temperatures in the three rivers (Gwydir, Peel, Severn) in the upstream and downstream sections of the dam (see Table 1 for gauge details).
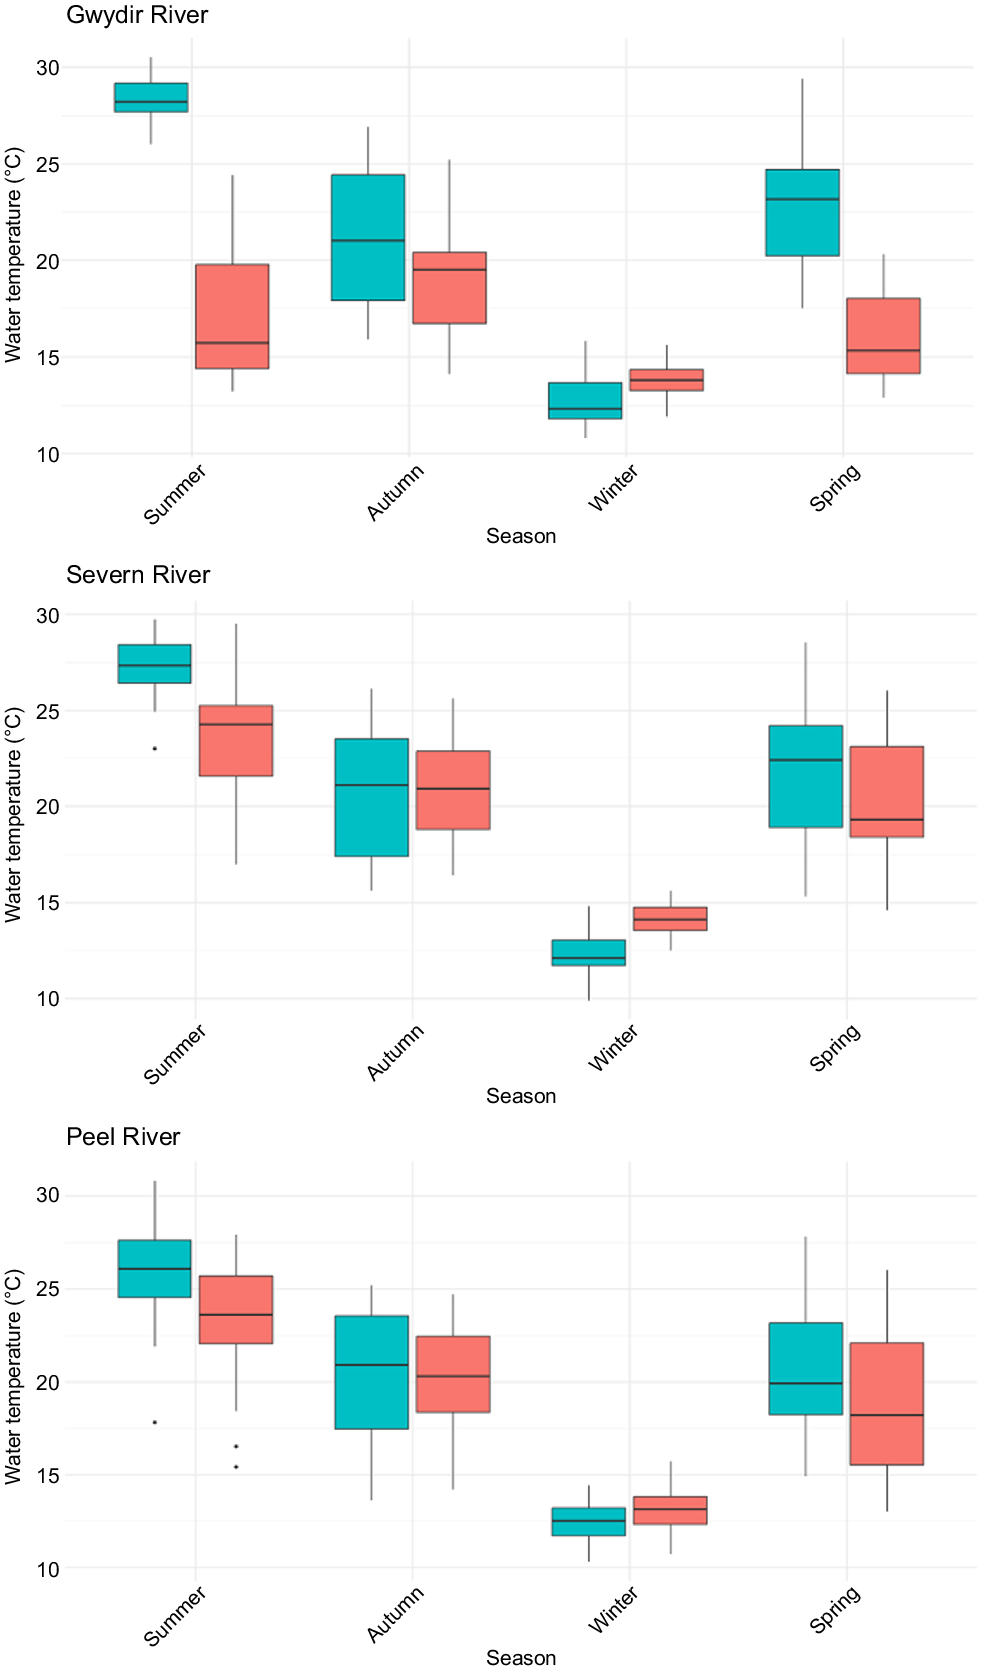
On the Gwydir River, the annual proportion of discharge was significantly higher in the downstream section in summer (V = 53, P = 0.016) (Fig. 2). However, there were no differences in the annual proportion of discharge in any of the other seasons (Tables S1–S4). Within the downstream section, the annual proportions of discharge varied (χ2 = 53.5, P < 0.001), being significantly (P < 0.01) higher in summer than in all other seasons, along with being significantly higher in autumn than in winter (P < 0.01) and spring (P = 0.03) and in spring being higher than in winter (P < 0.01). In the upstream section, less variation was present (χ2 = 11.2, P = 0.01), with only summer having a significantly (P = 0.002) higher proportion of discharge than did winter. Between 2002 and 2022, there were no ‘cease-to-flow’ days in the downstream section, whereas there were 5 years with over 70 days in the upstream section, with 2014 and 2019 having 203 and 317 days respectively (Fig. 3). Annual water temperatures downstream of Copeton Dam were significantly lower in spring (V = 171, P < 0.001), summer (V = 171, P < 0.001) and autumn (V = 162, P < 0.001), but higher in winter (V = 4, P < 0.001) (Fig. 4, Tables S1–S4).
On the Peel River, the annual proportion of discharge downstream of Chaffey Dam was significantly higher in autumn (V = 47, P = 0.008) and lower in winter (V = 198, P = 0.019) (Fig. 2, Tables S1–S4), and higher in summer (V = 74, P = 0.09). Total annual volume of discharge was significantly higher in the downstream section than that in the upstream section in autumn (V = 62, P = 0.04) and summer (V = 50, P = 0.01). Within the downstream section, the annual proportions of discharge varied (χ2 = 32.5, P < 0.001) and were significantly (P < 0.01) higher in summer than in all other seasons, and in autumn they were significantly (P = 0.03) higher than in winter. In the upstream section, variation was present but differed (χ2 = 14.6, P = 0.002), with autumn having the lowest proportion compared with summer (P = 0.004), spring (P = 0.02), and winter (P = 0.03). Between 2002 and 2022, there were no ‘cease-to-flow’ days in the downstream section, whereas there were 2 years with over 70 days in the upstream section, with 2018 and 2019 having 93 and 152 days respectively (Fig. 3). Annual water temperatures downstream of Chaffey Dam were significantly lower in spring (V = 307, P = 0.018) and summer (V = 384, P = 0.002) and higher in einter (V = 83.5, P = 0.012) (Fig. 4, Tables S1–S4).
Platypus captures
Over the 12 nights (three nights per river) of live-trapping, eight platypuses were captured, in total, in the four surveyed rivers. This represented a capture rate of 0.67 platypuses per night (Table 2). None of the captured platypuses had been previously tagged. Four platypuses were captured on the Peel River at the same site downstream of Chaffey Dam, approximately 800 m downstream of the dam wall (Fig. 1). All platypuses were adults (three females and one male). On the Severn River, four platypuses were captured in two sites (Fig. 1), all being adults (three females and one male). No platypuses were captured on the Gwydir River nor Pike Creek and Dumaresq River. On the Peel River, female platypuses weighed (mean ± s.d.) 0.86 kg ± 0.16, and those on the Severn weighed 1.2 kg ± 0.04. The two male platypuses had a similar weight on the Peel (1.52 kg) and Severn (1.49 kg). On the Peel River, tail-volume index (TVI, range 1–5) was very poor, with three of the platypuses having the lowest score of five and one of the females having a score of three. On the Severn River, TVI was somewhat better, ranging between two and five (Table 2). Poor body condition was also reflected in the evaluated biochemical analytes, indicating significantly lower levels of cholesterol (3.98 ± 0.65D vs 5.35 ± 0.67 s.d., P = 0.04) and triglycerides (0.73 ± 0.17 s.d. vs 1.08 ± 0.17 s.d., P = 0.04) in the platypuses on the Peel River than on the Severn River.
| River | Date | Sex | Age | Weight | TVI | Albumin | Cholesterol | Creatinine | Triglyceride | Urea | |
|---|---|---|---|---|---|---|---|---|---|---|---|
| Peel | 22 June 2023 | F | A | 0.85 | 5 | 39 | 4.3 | 18 | 0.8 | 29.7 | |
| Peel | 22 June 2023 | F | A | 1.03 | 3 | 32 | 4.2 | 12 | 0.7 | 24.9 | |
| Peel | 22 June 2023 | F | A | 0.72 | 5 | 40 | 4.4 | 18 | 0.9 | 28.6 | |
| Peel | 22 June 2023 | M | A | 1.52 | 5 | 35 | 3.0 | 22 | 0.5 | 25.5 | |
| Severn | 28 June 2023 | F | A | 1.16 | 3 | 35 | 5.4 | 19 | 1.0 | 31.1 | |
| Severn | 28 June 2023 | F | A | 1.20 | 4 | 41 | 5.9 | 18 | 1.1 | 27.6 | |
| Severn | 29 June 2023 | M | A | 1.49 | 2 | 39 | 4.4 | 19 | 0.9 | 25.6 | |
| Severn | 29 June 2023 | F | A | 1.25 | 5 | 37 | 5.7 | 17 | 1.3 | 27.7 |
Platypus eDNA detections
On Pike Creek and the Dumaresq River, platypus eDNA was detected in 9 of the 10 sites in the downstream section, but none in the upstream sites (n = 7) (Fig. 1). On the Gwydir River, platypus eDNA was detected at all (n = 10) sites downstream and six of the eight sites upstream of the dam. Platypus eDNA was detected at all (n = 10) sites downstream on the Severn River and at eight of the nine upstream sites. On the Peel River, platypus eDNA was detected at all (n = 10) sites downstream of the dam and in none of the upstream sites (n = 9).
Platypus sightings recorded in the Atlas of Living Australia (see https://www.ala.org.au, accessed 8 November 2023) complement eDNA results. On Pike Creek–Dumaresq River four platypus sightings have been recorded along the downstream section within the past 5 years, but none exists in the upstream section. There are 12 platypus sightings upstream of the dam on the Gwydir River within the past 15 years and four sightings recorded downstream in the past 5 years. Along the Severn River, there are 24 sightings downstream 10–15 years ago and 17 sightings upstream in the past 15 years. Along the Peel River, there are 10 sightings downstream of Chaffey Dam over the past 15 years and two upstream of the dam in 2004 and 2008, 19 and 15 years ago respectively.
Macroinvertebrate eDNA detections
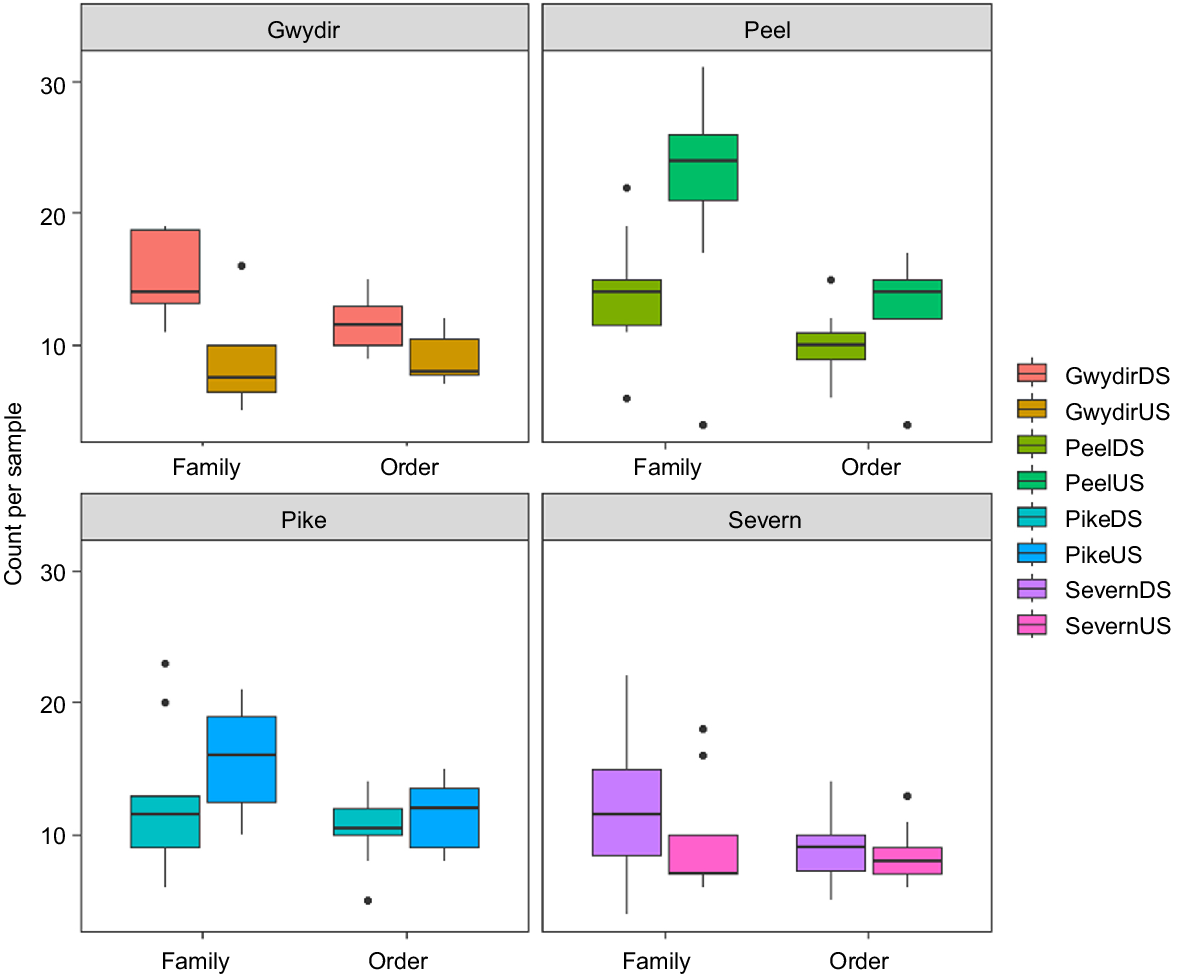
Across all samples from all surveyed rivers, 32 unique orders and 89 unique families were detected. On Pike Creek–Dumaresq River downstream of the dam, 18 orders and 31 families were detected, compared with upstream of the dam (19 orders, 35 families). The average number of macroinvertebrate orders downstream (10.6 ± 2.7 s.d.) was not significantly different from that upstream (12.2 ± 5.6 s.d.; W = 30.5, P = 0.7); this was also true for families (11.4 ± 2.8 s.d., 15.7 ± 4.4 s.d., respectively; W = 20.5, P = 0.2). On the Gwydir River, 22 orders and 37 families were detected downstream of the dam, compared with 18 orders and 29 families upstream. The average number of orders across sites was significantly higher downstream (11.7 ± 2.0 s.d.) than upstream of the dam (9.0 ± 2.0; w = 66.5, P = 0.02), which was also true for families (15.3 ± 3.1 s.d., 8.5 ± 3.6 s.d. respectively; W = 74, P = 0.003) (Fig. 5). On the Severn River, 19 orders and 35 families were detected downstream, and 16 orders and 32 families were detected upstream. The number of orders detected in samples downstream of the dam (9.2 ± 2.7 s.d.) was similar to that upstream (8.7 ± 2.2 s.d.; W = 51.5, P = 0.6), which was also the case for families (12.3 ± 5.8 s.d., 9.7 ± 4.4 s.d. respectively; W = 58, P = 0.3) (Fig. 5). For the Peel River, 18 orders and 29 families were detected downstream of the dam, and fewer than the 30 orders and 61 families were detected upstream of the dam. The average number of macroinvertebrate orders detected in samples was significantly lower downstream of the dam (10.1 ± 2.4 s.d.) than upstream (12.9 ± 3.7 s.d.; W = 17, P = 0.02), which was also the case for families (14.0 ± 4.4 s.d., 21.7 ± 7.7 s.d. respectively; W = 13.5, P = 0.01) (Fig. 5).
Boxplots for the number of orders and families detected across samples upstream and downstream on the Gwydir, Peel, Pike and Severn Rivers in the upper Murray–Darling Basin. DS, downstream; US, upstream.
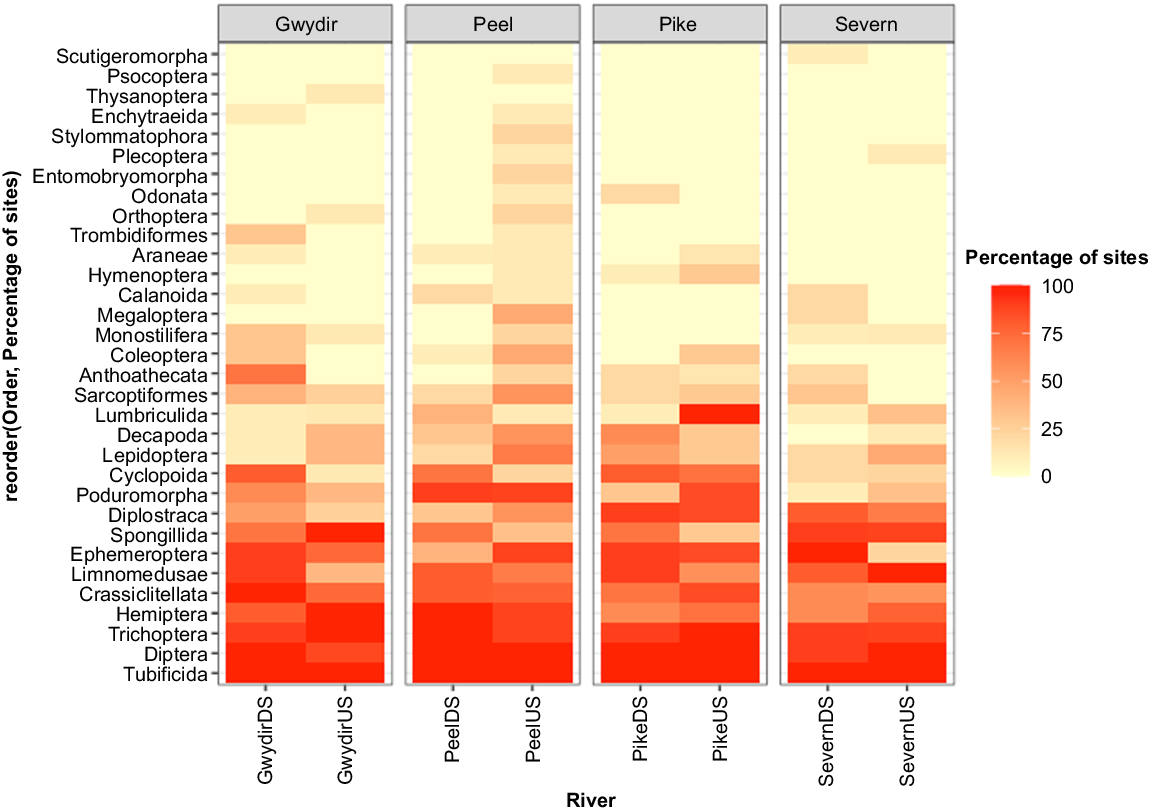
Multivariate analysis of macroinvertebrate composition indicated that taxonomic orders significantly differed between upstream and downstream for all river systems (Gwydir; Dev = 62.79, P = 0.006, Peel; Dev = 63.86, P = 0.01, Pike; Dev = 0.023, P = 0.023, Severn; Dev = 42.46, P = 0.04) (Supplementary Fig. S1, Table S5). Ephemeroptera (mayflies) occurrence, an important dietary component of platypuses, was higher upstream of the dam on the Peel River (8/9 sites) than in the downstream section (4/10 sites) (Fig. 6). This was also the case for Lepidoptera (butterflies and moths) (6/9 upstream, 2/10 downstream). Both orders contributed significantly to observed differences (Dev = 5.27, P = 0.027 and Dev = 4.40, P = 0.052 respectively). On the Severn River, Ephemeroptera also contributed significantly to differences in order composition (Dev = 15.47, P = 0.002), with this being more prevalent downstream (10/10 sites) than upstream (2/9 sites). On Pike Creek upstream of the dam, Lumbriculida, an order known to inhabit disturbed habitats with high nutrient concentrations, contributed significantly to order differences (Dev = 17.01, P = 0.001) and was found in all sites upstream of the dam, compared with only 1/10 sites downstream.
Discussion
Our results have provided important insights into the condition and distribution of platypuses and macroinvertebrates upstream and downstream of large dams in the northern Murray–Darling Basin. River regulation has altered the seasonality of flows on the four assessed rivers. Over the assessed periods, downstream flows on the Peel River were higher in autumn and lower in winter than were natural flow regimes upstream, and higher downstream in summer on the Gwydir River, Severn River and Pike Creek, and lower in winter on the Severn River and Pike Creek. During platypus surveys, although the reservoir on Pike Creek was at full capacity (98%), no water was being released from the dam and the creek was completely dry, apart from a few stagnating pools. In conjunction, cold water pollution was noted in the three assessed NSW rivers. In all assessed rivers, platypus numbers downstream of large dams were low, coinciding with significant differences in community composition of prey.
The considerable alteration to natural flow regimes in winter, coupled with cold water pollution on assessed rivers, may have affected macroinvertebrate availability downstream and the abundance and health of these platypus populations. Platypus numbers were relatively low compared with those encountered in other parts of the species range (Bino et al. 2019), and somewhat low compared with those assessed in a study of the upstream section of the Severn River (Hawke et al. 2021). Platypuses captured on the Peel River had low tail-fat indices, the primary measure of body fat, as well as biochemical indicators of malnourishment. Coinciding with these platypus surveys, a mass fishkill below Chaffey Dam on the Peel River was recorded (Department of Primary Industries, unpubl. data, 2023). An assessment into the causes of the fishkill concluded that this was the result of an underlying environmental issue with water quality or chemical irritants, but a pathogen outbreak was also identified in some fish that was likely triggered by a drop in water temperature and increased stress. Cold water pollution may result in platypuses moving further distances because of increased thermoregulatory costs (Faragher et al. 1979). Although platypus fat stores change seasonally in adults, with low levels of triglycerides and lowest bodyweights in winter (Grant and Dawson 1978; Hulbert and Grant 1983; Stewart et al. 2021), platypus body condition was worse on the Peel River than on the Severn River, which were surveyed in the same month.
High flows during summer also pose a risk of inundating burrows and drowning juveniles because platypus young are confined to nesting burrows, especially from late November until mid-January (Serena and Grant 2017). Reproductive failure following high-flow events in late November and early January (daily discharge of >6 GL) and in late December (daily discharge 2400 ML) have been reported in the Upper Shoalhaven River, whereas juveniles were recorded in years with higher flows in winter and spring (daily discharge 3700−7800 ML) (Serena and Grant 2017). The higher downstream flows in summer on the Gwydir River, Severn River and Pike Creek may potentially reduce breeding success and could contribute to the absence of juveniles captured during surveys. Similarly, low proportions of juveniles downstream of dams have been reported in other regulated rivers, warranting further research (Hawke et al. 2021). Previous platypus surveys on the Severn River in 2016 found slightly higher capture rates upstream of the dam wall (average 2.3 ± 2.4 s.d.) than downstream (average 1.4 ± 1.2 s.d.) (Hawke et al. 2021). Average nightly captures downstream on the Severn River in this study were similar to those encountered in 2016.
Platypus was detected using eDNA at many of the surveyed sites downstream of dams (Fig. 1). Although eDNA suggests the extent of platypus occurrence in assessed sections, results do not provide insights on the species abundance, with low trapping success on most of the rivers suggesting low densities in these river sections. The absence of any platypus detections upstream of the dams on both the Peel River and Pike Creek may suggest local extinctions. The last formally recorded observation of a platypus on the Peel River was made in 2008 (see https://www.ala.org.au). Although no record existed for Pike Creek, historic accounts from 1865 have described platypuses ‘found in nearly every water hole’ (Chisholm 1922; cf. Hawke et al. 2019). Fragmentation of river sections by large dams has detrimental effects on platypus populations both above and below dams by restricting access to freshwater refugia more prevalent in downstream sections of rivers as well as reducing genetic diversity (Mijangos et al. 2022). Like other freshwater species (Magoulick and Kobza 2003), platypuses are dependent on access to freshwater refugia during extreme drought conditions. In 1859, a migration of ‘at least a hundred’ platypuses was observed, with platypuses making their way downstream during a drying phase of the Gwydir River near the Pallamallawa cattle station (Burrell 1927). The availability and quality of habitat upstream of the dam on the Peel River and Pike Creek may have not provided sufficient critical refugia, possibly driving these populations to local extinction as recently as a result of the extreme drought in 2017–20. The Peel River and Pike Creek have much shorter river sections above the dam (~20 and 25 km respectively) than do Gwydir and Severn rivers (~90 and 80 km respectively), with the more limited habitat availability possibly reducing the resilience of upstream population during droughts and extensive cease-to-flow periods. Land-use modifications increased siltation (Ahearn et al. 2005; Minella et al. 2018), reducing depths and increasing likelihood of drying, in conjunction with possible impacts to food availability (Magierowski et al. 2012).
Environmental DNA surveys suggest variation in macroinvertebrate prey availability between river sections upstream and downstream of dams on the surveyed rivers. Results suggest significantly more macroinvertebrate orders and families at sites downstream on the Gwydir River and significantly fewer downstream on the Peel River. On the Peel River, important platypus dietary orders, such as Ephemeroptera (mayflies) and Lepidoptera (butterflies and moths) (Hawke et al. 2022), were less prevalent downstream. This may suggest that reduced food availability was a contributing factor to the poor body condition of platypuses downstream of Chaffey Dam. Upstream of the dam on the Gwydir River, where the number of orders and families was lower than downstream, fewer detections of platypuses were recorded in eDNA samples. However, no platypuses were recorded on the Peel River and Pike Creek upstream of the dams where the number of macroinvertebrate orders and families was higher than or the same as in downstream sections. This may suggest that platypus declines in these sections were driven by other factors, such as drying, or that macroinvertebrate availability now is not reflective of when these declines occurred. Additionally, these eDNA surveys do not provide an indication of abundance of macroinvertebrates, which is likely to be more important than is order and family richness. Future studies would benefit by undertaking macroinvertebrate surveys to assess abundances and by assessing platypus diets.
Facilitating connectivity and movement between platypus populations isolated by dams, including possibilities for translocations during extreme conditions such as droughts or fire, may be required to improve the long-term viability of fragmented populations. As platypus inhabits many regulated rivers across its range (Bino et al. 2020), release of water from dams must consider the possible impacts on platypus and its habitat. Avoiding large, unseasonal water releases over the breeding period will reduce possible impacts to juveniles when they are confined to their burrows (November–January) (Serena and Grant 2017). Strategies to manage cold-water releases and thermal stratification are needed to mitigate the impacts to downstream ecosystems, such as anoxic waters and algal blooms, which affect water quality and can lead to fishkills (Lopez et al. 2023). Construction of new dams, such as small-scale pumped hydro schemes (Heidari et al. 2020), should consider the impacts of habitat modification and increased sedimentation during construction phases, as well as the long-term impacts to the natural flow regimes and fragmentation of populations.
Allocating water for the environment (also known as environmental flows) is an essential mechanism for the restoration and protection of freshwater ecosystems, because it maintains ecological processes and supports their habitat and resilience (Acreman et al. 2014). Environmental flows can preserve habitat quality and availability for various species, mitigate the impacts of reduced water quality, and by mimicking natural flow regimes, environmental water allocation can enhance ecological benefits such as improved water quality, increased habitat availability, enriched biotic interactions (Poff et al. 1997; Horne et al. 2017) and support critical ecosystem processes such as nutrient cycling and primary production (Acreman and Dunbar 2004; Arthington et al. 2006). Environmental flows can provide important cues for spawning and migration and have been incorporated into water legislation in Australia (Gardner 2006). Environmental flows can restore connectivity within river systems, facilitating the movement of aquatic organisms, including dispersal and migration (Humphries et al. 2002; Arthington et al. 2010). Ultimately, environmental water allocation bolsters the resilience of freshwater ecosystems against climate change and other anthropogenic stressors, helping buffer against extreme events by maintaining suitable habitat conditions, such as adequate water depths and velocities, as well as availability of, and access to, drought refugia (Arthington et al. 2010; Poff and Matthews 2013; Horne et al. 2017).
Future research is needed to monitor individual and population condition across seasons on these regulated rivers, as well as the potential long-term impacts of unseasonably cold releases from large dams on platypuses. This could include investigating the duration of cold-water releases on platypuses in different seasons as a mitigation strategy, as well as measuring water quality (temperature, dissolved oxygen, nutrients and pH), benthic macroinvertebrate abundance along thermal gradients (Arai et al. 2015) and the feeding patterns and condition of platypuses across potentially varying water temperatures on upstream and downstream river sections. Long-term monitoring of flow and temperature regimes on regulated rivers is essential and will continue to improve our understanding of their impacts on freshwater communities and guide management strategies that support the long-term viability of this irreplaceable Australian species. The iconic status of the platypus positions it as an ideal flagship species for freshwater conservation, driving communities to improving conditions for platypuses, benefiting both terrestrial and freshwater ecosystems.
Data availability
The data that support this study will be shared upon reasonable request to the corresponding author.
Declaration of funding
This project was funded by the Commonwealth Environmental Water Holder (Department of Climate Change, Energy, the Environment and Water).
Acknowledgements
A huge thanks go to Forest, Monique, Lauren, and Tamielle for generously giving their time to help with eDNA and platypus surveys. A special thanks go to Judy and Dora for looking out for Jasmine Khurana, Greg Ringwood for his insights and knowledge on Glenlyon Dam, and to the locals who helped us with river access.
References
Abell R, Thieme ML, Revenga C, Bryer M, Kottelat M, Bogutskaya N, Coad B, Mandrak N, Balderas SC, Bussing W, Stiassny MLJ, Skelton P, Allen GR, Unmack P, Naseka A, Ng R, Sindorf N, Robertson J, Armijo E, Higgins JV, Heibel TJ, Wikramanayake E, Olson D, López HL, Reis RE, Lundberg JG, Pérez MHS, Petry P (2008) Freshwater ecoregions of the world: a new map of biogeographic units for freshwater biodiversity conservation. BioScience 58(5), 403-414.
| Crossref | Google Scholar |
Acreman MC, Dunbar MJ (2004) Defining environmental river flow requirements – a review. Hydrology and Earth System Sciences 8(5), 861-876.
| Crossref | Google Scholar |
Acreman M, Arthington AH, Colloff MJ, Couch C, Crossman ND, Dyer F, Overton I, Pollino CA, Stewardson MJ, Young W (2014) Environmental flows for natural, hybrid, and novel riverine ecosystems in a changing world. Frontiers in Ecology and the Environment 12(8), 466-473.
| Crossref | Google Scholar |
Ahearn DS, Sheibley RW, Dahlgren RA, Anderson M, Johnson J, Tate KW (2005) Land use and land cover influence on water quality in the last free-flowing river draining the western Sierra Nevada, California. Journal of Hydrology 313(3–4), 234-247.
| Crossref | Google Scholar |
Allan JD, Abell R, Hogan Z, Revenga C, Taylor BW, Welcomme RL, Winemiller K (2005) Overfishing of inland waters. BioScience 55(12), 1041-1051.
| Crossref | Google Scholar |
Arai R, Nukazawa K, Kazama S, Takemon Y (2015) Variation in benthic invertebrate abundance along thermal gradients within headwater streams of a temperate basin in Japan. Hydrobiologia 762(1), 55-63.
| Crossref | Google Scholar |
Arthington AH, Bunn SE, Poff NL, Naiman RJ (2006) The challenge of providing environmental flow rules to sustain river ecosystems. Ecological Applications 16(4), 1311-1318.
| Crossref | Google Scholar | PubMed |
Arthington AH, Naiman RJ, McClain ME, Nilsson C (2010) Preserving the biodiversity and ecological services of rivers: new challenges and research opportunities. Freshwater Biology 55, 1-16.
| Crossref | Google Scholar |
Astles KL, Winstanley RK, Harris JH, Gehrke PC (2003) Regulated Rivers and Fisheries Restoration Project – experimental study of the effects of cold water pollution on native fish. NSW Fisheries Final Report Series 44. (NSW Fisheries Office of Conservation: Sydney, NSW, Australia) Available at https://citeseerx.ist.psu.edu/document?repid=rep1&type=pdf&doi=0f8ce9d1d05c8ff3f7d0363b299a02386ba0d67e
Bino G, Kingsford RT, Grant T, Taylor MD, Vogelnest L (2018) Use of implanted acoustic tags to assess platypus movement behaviour across spatial and temporal scales. Scientific Reports 8(1), 5117.
| Crossref | Google Scholar | PubMed |
Bino G, Kingsford RT, Archer M, Connolly JH, Day J, Dias K, Goldney D, Gongora J, Grant T, Griffiths J, Hawke T, Klamt M, Lunney D, Mijangos L, Munks S, Serena M, Sherwin W, Temple-Smith P, Thomas J, Williams G, Whittington C (2019) The platypus: evolutionary history, biology, and an uncertain future. Journal of Mammalogy 100(2), 308-327.
| Crossref | Google Scholar | PubMed |
Bino G, Kingsford RT, Wintle BA (2020) A stitch in time – synergistic impacts to platypus metapopulation extinction risk. Biological Conservation 242, 108399.
| Crossref | Google Scholar |
Bonacina L, Fasano F, Mezzanotte V, Fornaroli R (2023) Effects of water temperature on freshwater macroinvertebrates: a systematic review. Biological Reviews 98(1), 191-221.
| Crossref | Google Scholar | PubMed |
Boulton AJ, Peterson CG, Grimm NB, Fisher SG (1992) Stability of an aquatic macroinvertebrate community in a multiyear hydrologic disturbance regime. Ecology 73(6), 2192-2207.
| Crossref | Google Scholar |
Chinnadurai SK, Strahl-Heldreth D, Fiorello CV, Harms CA (2016) Best-practice guidelines for field-based surgery and anesthesia of free-ranging wildlife. I. Anesthesia and analgesia. Journal of Wildlife Diseases 52(2), S14-S27.
| Crossref | Google Scholar |
Chisholm AH (1922) Nature notes. In The Daily Mail, Saturday 15 April 1922, p. 9. Available at http://nla.gov.au/nla.news-page23227948
Dahm CN, Baker MA, Moore DI, Thibault JR (2003) Coupled biogeochemical and hydrological responses of streams and rivers to drought. Freshwater Biology 48(7), 1219-1231.
| Crossref | Google Scholar |
Davidson NC (2014) How much wetland has the world lost? Long-term and recent trends in global wetland area. Marine and Freshwater Research 65(10), 934-941.
| Crossref | Google Scholar |
Davis J, Pavlova A, Thompson R, Sunnucks P (2013) Evolutionary refugia and ecological refuges: key concepts for conserving Australian arid zone freshwater biodiversity under climate change. Global Change Biology 19(7), 1970-1984.
| Crossref | Google Scholar | PubMed |
Department of Climate Change, Energy, the Environment and Water (2012) Australia’s bioregions (IBRA). (DCCEEW) Available at https://www.dcceew.gov.au/environment/land/nrs/science/ibra [Verified May 2024]
Dunn OJ (1964) Multiple comparisons using rank sums. Technometrics 6(3), 241-252.
| Crossref | Google Scholar |
Faragher RA, Grant TR, Carrick FN (1979) Food of the platypus (Ornithorhynchus anatinus) with notes on the food of brown trout (Salmo trutta) in the Shoalhaven River, NSW. Australian Journal of Ecology 4(2), 171-179.
| Crossref | Google Scholar |
Gardner A (2006) Environmental water allocations in Australia. Environmental and Planning Law Journal 23(3), 208-235 https://search.informit.org/doi/10.3316/agispt.20062392.
| Google Scholar |
Glazier DS (2012) Temperature affects food-chain length and macroinvertebrate species richness in spring ecosystems. Freshwater Science 31(2), 575-585.
| Crossref | Google Scholar |
Grant TR, Dawson TJ (1978) Temperature regulation in the platypus, Ornithorhynchus anatinus, production and loss of metabolic heat in air and water. Physiological Zoology 51, 315-332.
| Crossref | Google Scholar |
Grill G, Lehner B, Thieme M, Geenen B, Tickner D, Antonelli F, Babu S, Borrelli P, Cheng L, Crochetiere H, Macedo HE, Filgueiras R, Goichot M, Higgins J, Hogan Z, Lip B, McClain ME, Meng J, Mulligan M, Nilsson C, Olden JD, Opperman JJ, Petry P, Liermann CR, Sáenz L, Salinas-Rodríguez S, Schelle P, Schmitt RJP, Snider J, Tan F, Tockner K, Valdujo PH, van Soesbergen A, Zarfl C (2019) Author correction: mapping the world’s free-flowing rivers. Nature 572(7768), E9.
| Crossref | Google Scholar | PubMed |
Hawke T, Bino G, Kingsford RT (2019) A silent demise: historical insights into population changes of the iconic platypus (Ornithorhynchus anatinus). Global Ecology and Conservation 20, e00720.
| Crossref | Google Scholar |
Hawke T, Bino G, Kingsford RT (2021) Damming insights: variable impacts and implications of river regulation on platypus populations. Aquatic Conservation 31(3), 504-519.
| Crossref | Google Scholar |
Hawke T, Bino G, Shackleton ME, Ross AK, Kingsford RT (2022) Using DNA metabarcoding as a novel approach for analysis of platypus diet. Scientific Reports 12(1), 2247.
| Crossref | Google Scholar |
He F, Zarfl C, Bremerich V, Henshaw A, Darwall W, Tockner K, Jähnig SC (2017) Disappearing giants: a review of threats to freshwater megafauna. WIREs Water 4(3), e1208.
| Crossref | Google Scholar |
Heidari A, Esmaeel Nezhad A, Tavakoli A, Rezaei N, Gandoman FH, Miveh MR, Ahmadi A, Malekpour M (2020) A comprehensive review of renewable energy resources for electricity generation in Australia. Frontiers in Energy 14, 510-529.
| Crossref | Google Scholar |
Horne A, Webb J, Stewardson M, Richter B, Acreman M (Eds) (2017) ‘Water for the environment: from policy and science to implementation and management.’ (Academic Press) doi:10.1016/C2015-0-00163-0
Hulbert AJ, Grant TR (1983) Thyroid hormone levels in an egg-laying mammal, the platypus Ornithorhynchus anatinus. General and Comparative Endocrinology 51(3), 401-405.
| Crossref | Google Scholar | PubMed |
Humphries P, Serafini LG, King AJ (2002) River regulation and fish larvae: variation through space and time. Freshwater Biology 47(7), 1307-1331.
| Crossref | Google Scholar |
Jenkins KM, Boulton AJ (2003) Connectivity in a dryland river: short-term aquatic microinvertebrate recruitment following floodplain inundation. Ecology 84(10), 2708-2723.
| Crossref | Google Scholar |
Junk WJ, Piedade MTF, Lourival R, Wittmann F, Kandus P, Lacerda LD, Bozelli RL, Esteves FA, Nunes da Cunha C, Maltchik L, Schöngart J, Schaeffer-Novelli Y, Agostinho AA (2014) Brazilian wetlands: their definition, delineation, and classification for research, sustainable management, and protection. Aquatic Conservation: Marine and Freshwater Ecosystems 24, 5-22.
| Crossref | Google Scholar |
Kingsford RT, Basset A, Jackson L (2016) Wetlands: conservation’s poor cousins. Aquatic Conservation 26, 892-916.
| Crossref | Google Scholar |
Koch N, Munks SA, Utesch M, Davies PE, McIntosh P (2006) The platypus Ornithorhynchus anatinus in headwater streams, and effects of pre-Code forest clearfelling, in the South Esk River catchment, Tasmania, Australia. Australian Zoologist 33(4), 458-473.
| Crossref | Google Scholar |
Kruskal WH, Wallis WA (1952) Use of ranks in one-criterion variance analysis. Journal of the American Statistical Association 47(260), 583-621.
| Crossref | Google Scholar |
Lopez SG, Aspbury AS, Fritts SR, Tidwell T, Bonner TH (2023) Long-term patterns in inland fish kills associated with cold-shock and winter stress: a regional case study from Texas. Journal of Fish Biology 103(3), 472-480.
| Crossref | Google Scholar | PubMed |
Lugg A, Copeland C (2014) Review of cold water pollution in the Murray–Darling Basin and the impacts on fish communities. Ecological Management & Restoration 15(1), 71-79.
| Crossref | Google Scholar |
Magalhaes MF, Beja P, Schlosser IJ, Collares-Pereira MJ (2007) Effects of multi-year droughts on fish assemblages of seasonally drying Mediterranean streams. Freshwater Biology 52(8), 1494-1510.
| Crossref | Google Scholar |
Magierowski RH, Davies PE, Read SM, Horrigan N (2012) Impacts of land use on the structure of river macroinvertebrate communities across Tasmania, Australia: spatial scales and thresholds. Marine and Freshwater Research 63(9), 762-776.
| Crossref | Google Scholar |
Magoulick DD, Kobza RM (2003) The role of refugia for fishes during drought: a review and synthesis. Freshwater Biology 48(7), 1186-1198.
| Crossref | Google Scholar |
Manger PR, Collins R, Pettigrew JD (1998) The development of the electroreceptors of the platypus (Ornithorhynchus anatinus). Philosophical Transactions of the Royal Society of London – B. Biological Sciences 353(1372), 1171-1186.
| Crossref | Google Scholar | PubMed |
Mann HB, Whitney DR (1947) On a test of whether one of two random variables is stochastically larger than the other. The Annals of Mathematical Statistics 18(1), 50-60.
| Crossref | Google Scholar |
Matthews WJ, Marsh-Matthews E (2003) Effects of drought on fish across axes of space, time and ecological complexity. Freshwater Biology 48(7), 1232-1253.
| Crossref | Google Scholar |
Michie LE, Thiem JD, Boys CA, Mitrovic SM (2020) The effects of cold shock on freshwater fish larvae and early-stage juveniles: implications for river management. Conservation Physiology 8(1), coaa092.
| Crossref | Google Scholar |
Mijangos JL, Bino G, Hawke T, Kolomyjec SH, Kingsford RT, Sidhu H, Grant T, Day J, Dias KN, Gongora J, Sherwin WB (2022) Fragmentation by major dams and implications for the future viability of platypus populations. Communications Biology 5, 1127.
| Crossref | Google Scholar |
Miller S, Tait P, Saunders C (2015) Estimating indigenous cultural values of freshwater: a choice experiment approach to Māori values in New Zealand. Ecological Economics 118, 207-214.
| Crossref | Google Scholar |
Minella JPG, Merten GH, Barros CAP, Ramon R, Schlesner A, Clarke RT, Moro M, Dalbianco L (2018) Long-term sediment yield from a small catchment in southern Brazil affected by land use and soil management changes. Hydrological Processes 32(2), 200-211.
| Crossref | Google Scholar |
Nielsen DL, Merrin LE, Pollino CA, Karim F, Stratford D, O’Sullivan J (2020) Climate change and dam development: effects on wetland connectivity and ecological habitat in tropical wetlands. Ecohydrology 13(6), e2228.
| Crossref | Google Scholar |
Noble M, Duncan P, Perry D, Prosper K, Rose D, Schnierer S, Tipa G, Williams E, Woods R, Pittock J (2016) Culturally significant fisheries: keystones for management of freshwater social-ecological systems. Ecology and Society 21(2), 22.
| Crossref | Google Scholar |
Parisi MA, Cramp RL, Gordos MA, Franklin CE (2020) Can the impacts of cold-water pollution on fish be mitigated by thermal plasticity? Conservation Physiology 8(1), coaa005.
| Crossref | Google Scholar |
Parisi MA, Franklin CE, Cramp RL (2022) Can slowing the rate of water temperature decline be utilized to reduce the impacts of cold water pollution from dam releases on fish physiology and performance? Journal of Fish Biology 100(4), 979-987.
| Crossref | Google Scholar | PubMed |
Poff NLR, Matthews JH (2013) Environmental flows in the Anthropocence: past progress and future prospects. Current Opinion in Environmental Sustainability 5(6), 667-675.
| Crossref | Google Scholar |
Poff NL, Allan JD, Bain MB, Karr JR, Prestegaard KL, Richter BD, Sparks RE, Stromberg JC (1997) The natural flow regime: a paradigm for river conservation and restoration. BioScience 47(11), 769-784.
| Crossref | Google Scholar |
Puckridge JT, Sheldon F, Walker KF, Boulton AJ (1998) Flow variability and the ecology of large rivers. Marine and Freshwater Research 49(1), 55-72.
| Crossref | Google Scholar |
Reid AJ, Carlson AK, Creed IF, Eliason EJ, Gell PA, Johnson PTJ, Kidd KA, MacCormack TJ, Olden JD, Ormerod SJ, Smol JP, Taylor WW, Tockner K, Vermaire JC, Dudgeon D, Cooke SJ (2019) Emerging threats and persistent conservation challenges for freshwater biodiversity. Biological Reviews of the Cambridge Philosophical Society 94(3), 849-873.
| Crossref | Google Scholar | PubMed |
Rood SB, Samuelson GM, Braatne JH, Gourley CR, Hughes FMR, Mahoney JM (2005) Managing river flows to restore floodplain forests. Frontiers in Ecology and the Environment 3(4), 193-201.
| Crossref | Google Scholar |
Serena M, Grant TR (2017) Effect of flow on platypus (Ornithorhynchus anatinus) reproduction and related population processes in the upper Shoalhaven River. Australian Journal of Zoology 65(2), 130-139.
| Crossref | Google Scholar |
Stewart J, Bino G, Hawke T, Kingsford RT (2021) Seasonal and geographic variation in packed cell volume and selected serum chemistry of platypuses. Scientific Reports 11, 15932.
| Crossref | Google Scholar |
Strayer DL, Dudgeon D (2010) Freshwater biodiversity conservation: recent progress and future challenges. Journal of the North American Benthological Society 29(1), 344-358.
| Crossref | Google Scholar |
van Asselen S, Verburg PH, Vermaat JE, Janse JH (2013) Drivers of wetland conversion: a global meta-analysis. PLoS ONE 8(11), e81292.
| Crossref | Google Scholar |
Vannote RL, Sweeney BW (1980) Geographic analysis of thermal equilibria: a conceptual model for evaluating the effect of natural and modified thermal regimes on aquatic insect communities. The American Naturalist 115(5), 667-695.
| Crossref | Google Scholar |
Voelz NJ, Poff NLR, Ward JV (1994) Differential effects of a brief thermal disturbance on caddisflies (Trichoptera) in a regulated river. The American Midland Naturalist 132(1), 173-182.
| Crossref | Google Scholar |
Wang Y, Naumann U, Wright ST, Warton DI (2012) mvabund – an R package for model-based analysis of multivariate abundance data. Methods in Ecology and Evolution 3(3), 471-474.
| Crossref | Google Scholar |
Whittington RJ, Grant TR (1983) Haematology and blood chemistry of the free-living platypus, Ornithorhynchus anatinus (Shaw) (Monotremata: Ornithorhynchidae). Australian Journal of Zoology 31(4), 475-482.
| Crossref | Google Scholar |
Wilcoxon F (1945) Individual comparisons by ranking methods. Biometrics Bulletin 1(6), 80-83.
| Crossref | Google Scholar |