

Are tuna always hungry? A deep dive into stomach-fullness measures in the western and central Pacific Ocean
Pauline Machful A * , Annie Portal A , Jed Macdonald A , Valerie Allain A , Joe Scutt Phillips A , Joanne Potts A and Simon Nicol A
A
Abstract
Understanding tuna diet and its drivers can provide valuable insights into the dynamics of pelagic ecosystems and their capacity to adapt to environmental and human-induced stressors.
To reconstruct tropical tuna dietary histories by using different metrics of stomach fullness and to assess their association with fisheries-related, environmental and biological covariates.
We examined stomachs from 8229 skipjack (Katsuwonus pelamis), yellowfin (Thunnus albacares) and bigeye tuna (T. obesus) captured in the western and central Pacific Ocean between 2001 and 2021, classified each on the basis of categorical and continuous fullness metrics, then built statistical models to gauge covariate effects.
Only models for the binary fullness metric (i.e. empty or non-empty) performed well. Tuna with empty stomachs were more likely to be caught on active gear (e.g. purse seine) and earlier in the day. Skipjack and bigeye tuna with empty stomachs were more likely to be associated with floating objects (e.g. fish-aggregating devices).
Our results add to the evidence that tropical tunas forage more effectively during the day and more actively when not associated with floating objects. At the individual level, tuna stomach fullness is highly variable.
Further research is needed to understand the factors governing this promising indicator of ecosystem change.
Keywords: behaviour, diet, feeding success, fisheries-related covariates, foraging, pelagic ecosystem, stomach fullness, tropical tuna.
Introduction
The tropical tuna species of the western and central Pacific Ocean (WCPO) are high trophic-level species that underpin fisheries landing millions of tonnes annually (Food and Agriculture Organization of the United Nations 2022; Williams and Ruaia 2023). Trophic groups such as small skipjack and yellowfin tuna exert a strong top-down pressure on lower trophic-level species while also being preyed on by groups higher in the food web (Griffiths et al. 2019). Variations in diet, condition and consumption rates of these species potentially exist across fishery, climate and environmental factors (Olson et al. 2014, 2016; Duffy et al. 2017; Machful and Allain 2018; Fuller et al. 2021), and as such, the analysis of tuna stomachs provides a way of monitoring the pelagic ecosystem for indicators of food-web structural changes (Olson et al. 2014).
The examination of stomach contents allows the characterisation of diet directly, indicating both the composition and quantity of prey that an individual has eaten at a given time (Hynes 1950). This analysis is widely used to characterise feeding rates, diet preferences, interactions among species in the food web, but also to identify spatial and seasonal variation in diet among groups of individuals or among species (Hyslop 1980; Chipps and Garvey 2007; Olson et al. 2016; Duffy et al. 2017; Machful and Allain 2018; Fuller et al. 2021). Stomach content examination also allows the assessment of prey diversity and provides information on predator behaviour and habitat use (Williams et al. 2015; Machful and Allain 2018; Fuller et al. 2021). Some studies aim not only to identify prey composition but to estimate the amount of food consumed by the fish population to assess daily food-consumption rates for bioenergetic or mass-balance models (Olson 1982; Olson and Boggs 1986; Olson and Watters 2003; Olson et al. 2016; Griffiths et al. 2019).
Regarding observations of the quantity of food ingested, estimates of the relative fullness of individuals’ stomachs have proved useful in gaining an understanding of patterns occurring in the diet of fishes. Stomach-fullness measures can help determine diel feeding periodicity (Buckley and Miller 1994), to identify spatial, seasonal and interannual variations (Nemerson and Able 2004; Griffiths et al. 2007) or to detect changes in diet in relation to biological processes, such as reproductive activity (Griffiths et al. 2007; Perelman et al. 2017; Valls et al. 2022). Estimation of the stomach fullness of tunas also provides insights into tuna behaviour in relation to various fishing methods (Bard 2001) and opportunities to evaluate potential anthropogenic effects on tuna feeding patterns, including around fish aggregation devices (FADs) (Buckley and Miller 1994; Ménard et al. 2000; Hallier and Gaertner 2008; Jaquemet et al. 2011), which remain crucially important to tropical tuna purse seine fisheries across the WCPO (Fonteneau et al. 2013; Griffiths et al. 2019; Escalle et al. 2021) and for which information is still scant.
Several methods can be used to quantify stomach fullness. The ‘fullness coefficient’ is a categorical measure (Hynes 1950), in which fullness is classified through visual examination into one of five categories (0, empty; 1, less than half full; 2, half full; 3, more than half full; 4, full), and which is simple and quick to apply. However, this has been criticised because of its potential subjectivity, as it depends on the experience and judgement of the person performing the examination. Another frequently used measure is the ‘fullness index’, a ratio of stomach content mass to body mass (Herbold 1986). Although less subjective than the fullness coefficient, the fullness index can be sensitive to uncertainties around the estimation of satiety among fish of different sizes whose diet may change, or the evolution of the mass of the stomach itself in relation to body mass or food availability (Ruohonen and Grove 1996; Pirhonen et al. 2019). To avoid these problems, we can calculate a standardised ‘fullness metric’, similar in derivation to the ‘percentage fullness’ metric presented and refined by Herbold (1986), from Knight and Margraf (1982)’s original formulation, that accounts for the maximum capacity of the stomach for fish of a given length (see Methods for calculation details). This continuous metric is comparable across species and life-history stages and is considered to provide a more direct, less biased measure of fullness.
To maximise the information gained from the analysis of stomach fullness, we need reliable metrics that can measure it accurately. For WCPO tunas, researchers have typically used the categorical stomach-fullness coefficient as the standard measure of stomach fullness recorded during stomach analyses in the laboratory (Machful et al. 2021). To improve our understanding of tuna foraging efficiency, and how individuals’ dietary choices vary through ontogeny, across species, and in relation to fishery or environmental covariates, it is prudent to test whether a more quantitative, continuous fullness metric may be required. Alternatively, simpler, more objective categorical metrics may also prove to be as or more informative.
Over the past 20 years, the Pacific Community (SPC) has been collecting biological samples from tuna captured by fishing and research vessels operating throughout the WCPO (Portal et al. 2020). These samples, housed in the Pacific Marine Specimen Bank (PMSB) (Oceanic Fisheries Programme, Pacific Community 2023, http://www.spc.int/ofp/PacificSpecimenBank), now include a comprehensive archive of stomachs taken from skipjack (Katsuwonus pelamis), yellowfin (Thunnus albacares) and bigeye tuna (T. obesus), three tropical tunas of global commercial importance, with the highest catches globally coming from the WCPO (Food and Agriculture Organization of the United Nations 2022; Williams and Ruaia 2023).
This unique archive affords us an opportunity in this study to gain deeper insight into skipjack, yellowfin and bigeye tuna foraging dynamics in relation to anthropogenic (i.e. in our case, fishery-related), environmental and biological factors associated with our observations of stomach fullness. Our three main objectives were (1) to describe the large dataset we have gathered on WCPO tuna stomach fullness in the PMSB archive; (2) to explore three different measures of stomach fullness calculated from these data; specifically, for each individual tuna stomach, we determined the fullness coefficient, calculated the continuous fullness metric, and derived a simpler binary measure of stomach fullness, coded as empty or non-empty; and (3) to investigate, using a series of statistical models, whether the observed variability of these measures can be explained by fishery-related (i.e. fishing gear, floating-object association), environmental (i.e. time of day) and biological (i.e. fish length) covariates hypothesised to be correlated with the observed feeding success of wild tunas captured by commercial fishers.
Methods
Stomach sampling
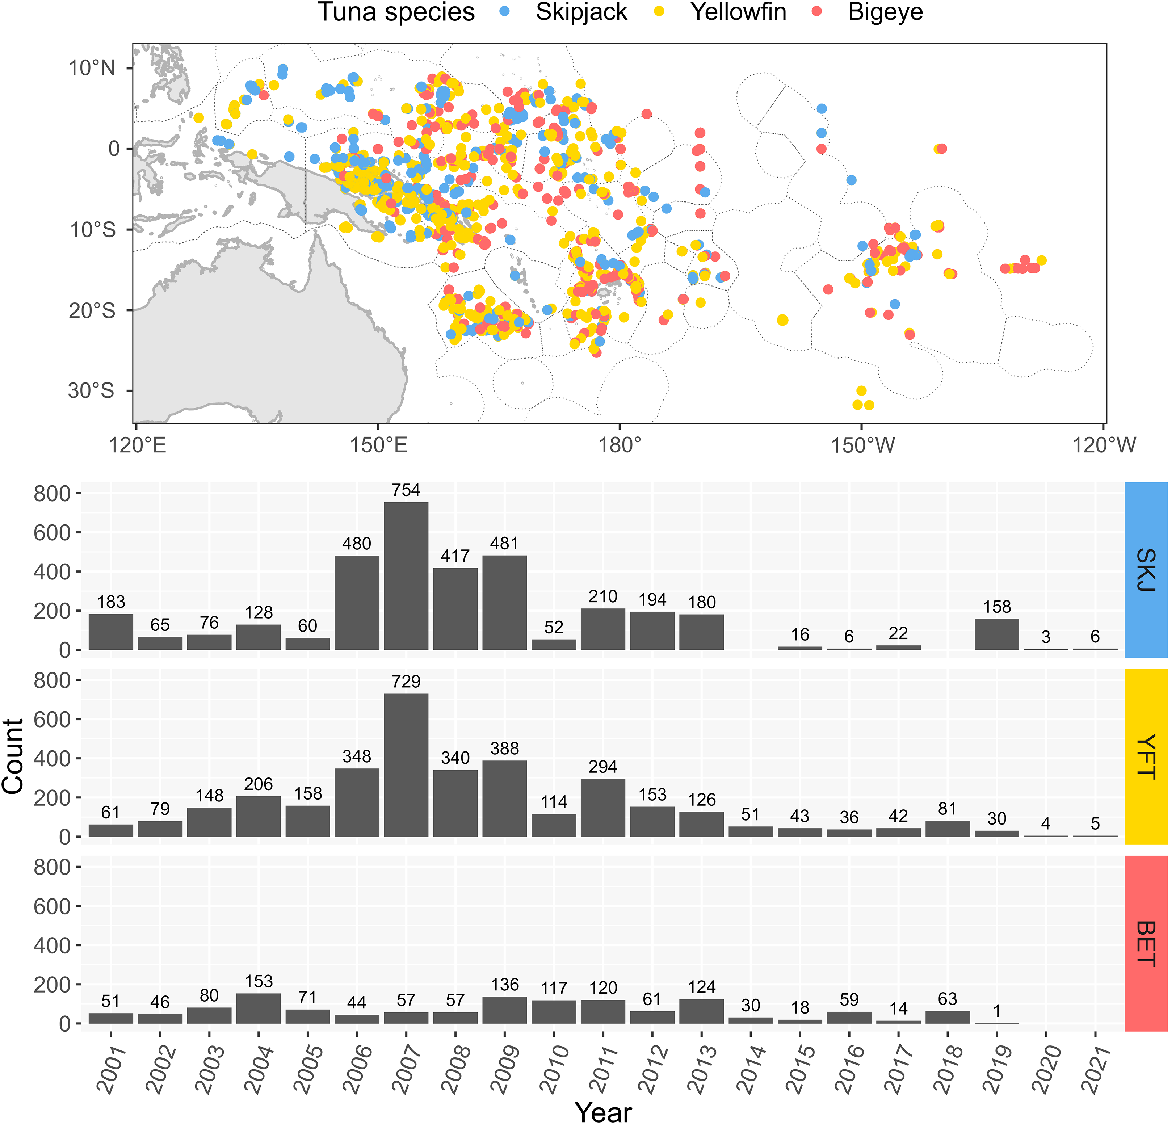
In total, 8229 stomachs of tropical tunas (3491 skipjack, 3436 yellowfin and 1302 bigeye, Supplementary Table S1) were withdrawn from the Pacific Marine Specimen Bank (PMSB). They were sampled from fish captured across the WCPO (125°E–120°W, 32°S–12°N) between 2001 and 2021 (Fig. 1) and stored frozen at −20°C until analysis. All the samples collected as part of the PMSB, including the stomach samples selected in this study, were processed in compliance with the PMSB standard operating procedures regarding methods of sampling, storage, and shipment, and were treated the same way. The time between sampling and analysis of the stomachs in this study varied from several months to 10 years, and we assume that the standard operating procedures used prevented differences in processing time affecting our measures of stomach fullness. The stomachs were examined and assessed for stomach fullness at SPC fisheries laboratory in Noumea, New Caledonia. Tunas were captured by commercial fishing and research vessels, mainly by purse seine, longline, pole-and-line and danglers-handline gear, some of which were associated to a FAD at capture. All stomachs selected within the framework of this study were examined following the same protocol regardless of the species, fishing method, sampling time and year of analysis.
Fullness coefficient
All stomachs were examined according to the following protocol. Each stomach was defrosted in the open air of the laboratory before being opened longitudinally without altering the content. If baitfish (such as sardines or anchovies) were used during fishing operations (i.e. on pole-and-line, handline or longline vessels), and recorded in the fishing logbook for proper identification, they were removed from the stomach contents prior to further analysis. The fullness coefficient was then determined by visually classifying the volume of prey in the stomach into one of the five categories (0, empty; 1, less than half full; 2, half full; 3, more than half full; 4, full).
Fullness metric
After removal of baits and the estimation of the fullness coefficient, all non-empty stomachs (i.e. those with fullness coefficients of 1, 2, 3 and 4) were examined as follows: the stomach contents were recovered using a 200-μm mesh sieve to rinse the prey from mucus to help with the identification, while retaining all small items such as otoliths or cephalopod beaks. Prey was sorted and identified to the lowest taxonomic level and each prey item was then weighed individually to the nearest 0.01 g. A ‘prey weight’ was calculated for each stomach by summing the weight of all the prey items measured in each stomach.
To calculate the fullness metric for each fish, we used a slight modification of Herbold’s (1986) ‘percentage fullness’ calculation, applying the following formula
where prey weight is the observed weight of all prey in the stomach and mean max. prey weight is the mean maximum prey weight at length predicted from species-specific log–log regression models of observed prey weight (g) for all stomachs classified as full (i.e. with a fullness coefficient of 4) (skipjack: n = 120, yellowfin: n = 106, bigeye: n = 55) as a function of fork length (mm) (see Supplementary Fig. S1–S3).
We did not filter for the maximum observed weight for each length class as Herbold proposed, excluding observation of decreasing weights for increasing size, because we wished to us establish a ‘typical’ full stomach baseline, not the maximum that was possible.
Binary fullness metric
We also derived a simpler binary measure of stomach fullness. Fish with a fullness coefficient or fullness metric equal to 0 were classed as having an ‘empty’ stomach. Fish with a fullness coefficient or fullness metric greater than 0 were coded as having an ‘non-empty’ stomach. Although being a coarser measure of fullness, this binary metric allowed us to compare the inference gained from using simple v. more complex measures of stomach fullness as response variables in our models (see ‘Modelling’ section for details).
Exploratory data analysis
As the fullness coefficient is a categorical variable and the fullness metric is continuous, the exploratory analysis of these two metrics consisted of simple descriptive statistics to compare them and to assess their relationship. We also inspected the relationship between the binary fullness metric and each covariate included in our models (see ‘Covariates’ section).
Covariates
We hypothesised that the following covariates may explain some of the observed variability in our measures of stomach fullness: two anthropogenic factors, the fishing gear type (‘Gear’), and the floating-object association (‘School’) and one environmental factor, the time of day (‘Time of day’). Spatial covariates such as Longhurst region were explored but did not explain variability. In the case of ‘Gear’, different modes of fishing require the target species to behave in particular ways to be susceptible to the fishing method. ‘Gear’ was a binary variable (i.e. passive or active gear). Passive gear are left passively soaking in the water and require fish to actively bite a hook or otherwise become entrapped by the gear (i.e. in our study: pole-and-line, handline, rod and reel, troll, and longline), whereas active gear are manipulated to catch fish regardless of their individual behaviour (i.e. in our study: purse seine). Such differences in gear have been hypothesised to influence the catchability of fish in response to their behaviour or satiation, and thus observations of stomach fullness. For example, Bertrand et al. (2002) suggested that longline, a passive gear, may bias catch towards fish with emptier stomachs when they are experiencing poor feeding success. The association of fish around floating objects, including around FADs, which are widely used in the Pacific, has been hypothesised to be linked to the search for food (Hallier and Gaertner 2008; Leroy et al. 2013) and may be responsible for some of the patterns we observe in stomach fullness. Skipjack and juvenile yellowfin and bigeye tuna often aggregate in dense schools around floating objects at dawn, and increased instances of empty stomachs have been observed in fish caught when associated with such objects (Ménard et al. 2000; Machful et al. 2021). To disentangle the potential effects of dawn and association with floating objects, we therefore include a ‘School’ covariate to indicate whether fish were caught in such an associated aggregation. ‘School’, which varies across purse seine, pole-and-line, danglers-handline gear, but does not apply to longline gear, was a binary variable, with ‘Associated’ including fish captured on anchored FADs, drifting FADs, and in fishing sets made around logs and whales, and ‘Not-associated’ including fish captured in free schools or at seamounts. The distribution of samples according to the categorical covariates (‘Gear’ and ‘School’) is summarised in Table S2. ‘Time of day’ may be linked to different feeding cycles, the availability of prey or evasion of predators, and is likely to affect the observations of stomach fullness temporally. Several studies have proposed that small tunas have maximal feeding success over the course of daylight hours (e.g. Ortega-Garcia et al. 1992; Ménard et al. 2000), and so here we test whether such a covariate influences our observations of stomach fullness. ‘Time of day’ was treated as a continuous variable covering the full 24-h cycle but cannot be estimated for tuna captured by longline due to the long soak times of this gear and, thus, the inability to know at what time the fish was hooked and, consequently, models using this covariate excluded longline samples. Furthermore, fish length was an available covariate to be used in the modelling, allowing us to test for any ontogenetic effects on stomach fullness. However, preliminary analysis suggested that there was no strong relationship between fish length and the fullness metric for each species (Fig. S4A). In addition, length was correlated with Gear (i.e. passive gear types caught bigger fish) and School (see Fig. S4B, C). Consequently, fish length was not explored further in the modelling.
Modelling
For each tuna species, we fitted a series of statistical models to the continuous (i.e. fullness metric) and discrete (i.e. fullness coefficient, binary fullness metric) response variables to explore the effects of the above-mentioned explanatory covariates and compare the utility of the different fullness metrics for this purpose (Table 1). Because the continuous ‘Time of day’ covariate was not available for the longline records, we fitted two models to the response variable from each dataset, per species (i.e. in total, we attempted to fit 18 models). The first model formulation, fitted to the ‘Reduced’ datasets (i.e. without longline data), incorporated fixed effects of ‘Gear’ and ‘School’, and a separate cyclic penalised cubic regression spline smooth was used to model ‘Time of day’ for each level of ‘School’ (i.e. M1, M3 and M5, see Table 1). The inclusion of an interaction term here enabled exploration of whether the response to ‘Time of day’ (by species) varied by ‘School’, or not. The second model formulation included the ‘Gear’ fixed effect only and was fitted to the ‘Full’ datasets (i.e. with longline data included, see M2, M4 and M6 Table 1). Because a large proportion of stomachs came from fishing events with very small sample sizes (i.e. 44% of SKJ, 80% of BET and 61% of YFT observations came from fishing events with fewer than five fish), it was not feasible to incorporate a random effect to account for any potential commonality of the fullness metric of stomachs within the same fishing event (see Discussion). All modelling was undertaken in R (ver. 4.4.0, R Foundation for Statistical Computing, Vienna, Austria, see https://www.r-project.org/) using the glmmTMB (ver. 1.1.9, see https://cran.r-project.org/package=glmmTMB; Brooks et al. 2017), MASS (ver. 7.3-60.2, see https://cran.r-project.org/package=MASS; Venables and Ripley 2002), mgcv (ver. 1.9-1, S. Wood, see https://cran.r-project.org/package=mgcv/; Wood 2011) and DHARMa (ver. 0.4.6, available at https://CRAN.R-project.org/package=DHARMa) packages. R code and data to reproduce all analyses are available on request to the PMSB.
| Model number | Dataset | Response variable | Model type | Model formulation | |
|---|---|---|---|---|---|
| M1 | Reduced | Fullness coefficient (i.e. categorical) | Proportional odds logistic regression | Gear + Time of day × School | |
| M2 | Full | Gear | |||
| M3 | Reduced | Fullness metric (i.e. continuous) | Generalised linear model glmmTMB, family = Tweedie | Gear + Time of day × School | |
| M4 | Full | Gear | |||
| M5 | Reduced | Empty or non-empty (i.e. binary) | Generalised additive model, logistic regression | Gear + School + Time of day (by = School) | |
| M6 | Full | Gear |
Results
Exploratory data analysis
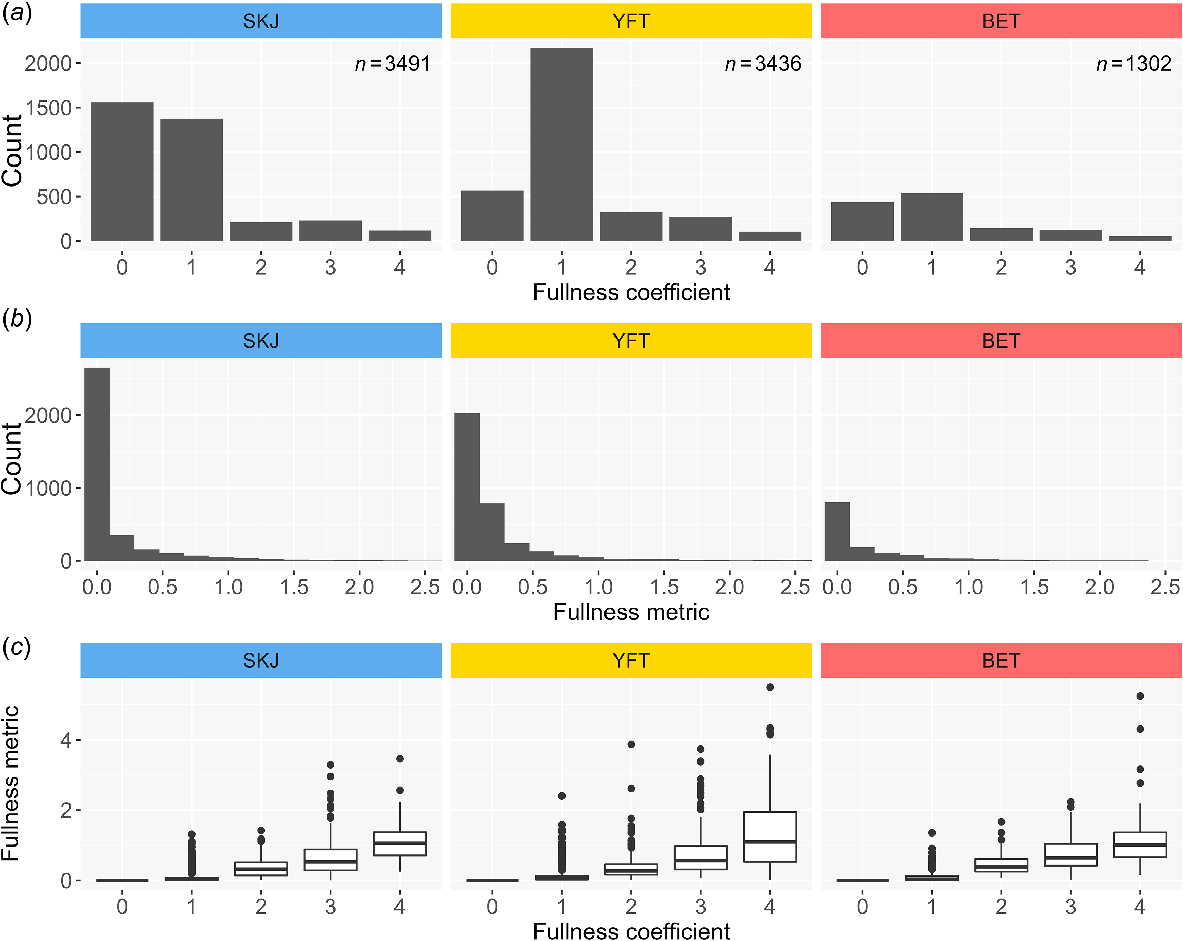
The proportion of empty stomachs was high, especially for skipjack (44.6%) and bigeye tuna (33.5%) and slightly lower for yellowfin tuna (16.5%) (see Fig. 2a). The proportion of stomachs with a fullness coefficient of 1 (i.e. a stomach with a very small amount of food) was also high regardless of species (39.4% for skipjack, 41.3% for bigeye tuna and 63.2% for yellowfin tuna) (Fig. 2a). The distribution of the calculated fullness metric was very skewed across all species (skipjack: mean = 0.13, range: 0–3.46; yellowfin tuna: mean = 0.2, range: 0–5.5; bigeye tuna: mean = 0.22, range: 0–5.25) (see Fig. 2b). Looking at the relationship between the two measures, there was a large variation of observed fullness metric within each fullness coefficient level (see Fig. 2c).
Histograms of (a) fullness coefficient and (b) fullness metric for each species, and (c) box plots of fullness metric for each level of the fullness coefficient. SKJ, skipjack tuna; YFT, yellowfin tuna; and BET, bigeye tuna.
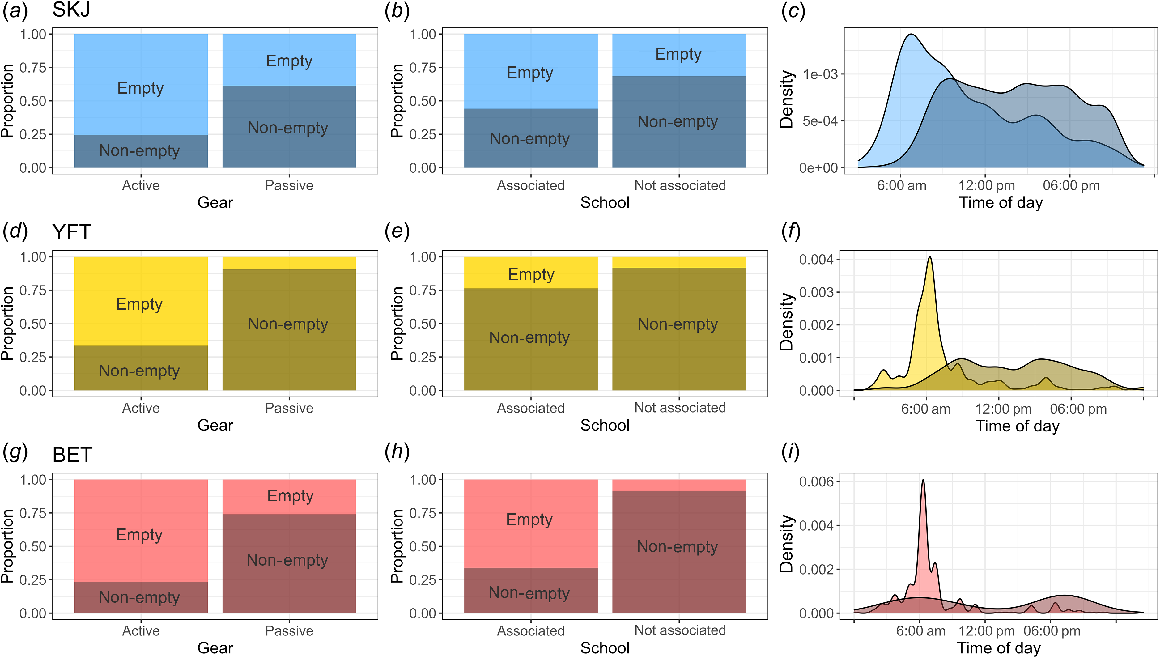
We observed with the binary fullness response that regardless of species, individuals are more likely to have empty stomachs if caught on active gear (purse seine) and non-empty stomachs if caught on passive gear (e.g. longline) (Fig. 3). For skipjack and bigeye tuna, individuals are more likely to have empty stomachs if caught in associated schools and non-empty stomachs if caught in not-associated schools. We did not observe a marked difference between associated and not-associated schools for yellowfin tuna. Finally, the proportion of fish having an empty stomach peaked just prior to dawn, falling away sharply as the day progressed, regardless of species.
Plots of the binary fullness metric, showing the proportion of empty stomachs (light colour) and non-empty stomachs (dark colour) by Gear (first column; full dataset), School (middle column; full dataset), and Time of day (last column; reduced dataset). (a) SKJ, skipjack tuna; (b) YFT, yellowfin tuna; (c) BET, bigeye tuna.
Investigating the fullness coefficient and the fullness metric
Regardless of species, models fitted to the fullness coefficient on the reduced dataset (i.e. categorical response variable, M1, see Table 1) and the full dataset (M2, see Table 1) had extremely poor discrimination and were able to predict only empty or non-empty stomachs. For the highly skewed continuous fullness metric, regardless of species, models fitted to the reduced dataset (M3, see Table 1) and the full dataset (M4, see Table 1) did not meet model assumptions or failed to converge. These response variables were not explored further.
Models for binary response variable
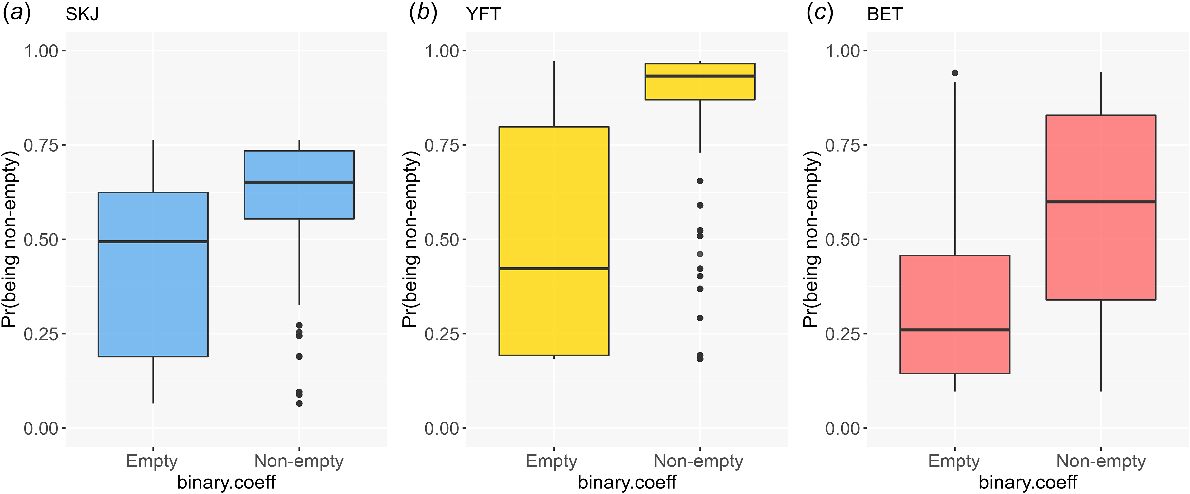
Models fitted to the binary response variable (empty or non-empty stomach) by using the reduced data set (M5, see Table 1) met model assumptions; however, the results varied in their ability to discriminate between empty (0) and non-empty stomachs (1) among species. The models for skipjack and bigeye tuna were the worst-performing models, with poor predictive discrimination between observed empty and non-empty stomachs (Fig. 4a, c). Non-empty yellowfin tuna stomachs typically had high predicted probability of being non-empty (Fig. 4b), whereas empty stomachs had large variation in predicted probability. Similar to the reduced dataset models, regardless of species, the full dataset models (M6, see Table 1) were found to meet model assumptions. For skipjack, 426 of a total of 1557 observed empty stomachs were correctly predicted to be empty (27.4%), and 1796 of a total of 1934 observed non-empty stomachs were correctly predicted to be non-empty (92.8%). For yellowfin, 284 of 566 observed empty stomachs were correctly predicted to be empty (50.1%), and 2726 of 2870 observed non-empty stomachs were correctly predicted to be non-empty (94.9%). For bigeye, 147 of a total of 436 observed empty stomachs were correctly predicted to be empty (33.7%), and 821 of a total of 866 observed non-empty stomachs were correctly predicted to be non-empty (94.8%). These models were better at predicting non-empty stomachs than empty ones, regardless of species.
Box plots of the predicted probability of the stomach being non-empty, on the basis of Model M5 (i.e. binary response variable (empty or non-empty) fitted to the reduced dataset, see Table 1). (a) SKJ, skipjack tuna; (b) YFT, yellowfin tuna; (c) BET, bigeye tuna.
Models using the binary response variable (M5 and M6) confirmed that ‘Gear’ was a significant explanatory variable regardless of species. Active gear always predicted a lower probability of having a non-empty stomach (than did passive gear), regardless of species. Reduced-dataset models (M5) confirmed that the ‘Time of day’ was also a significant explanatory variable, regardless of species, and that ‘School’ association was a significant explanatory variables for skipjack and bigeye tuna.
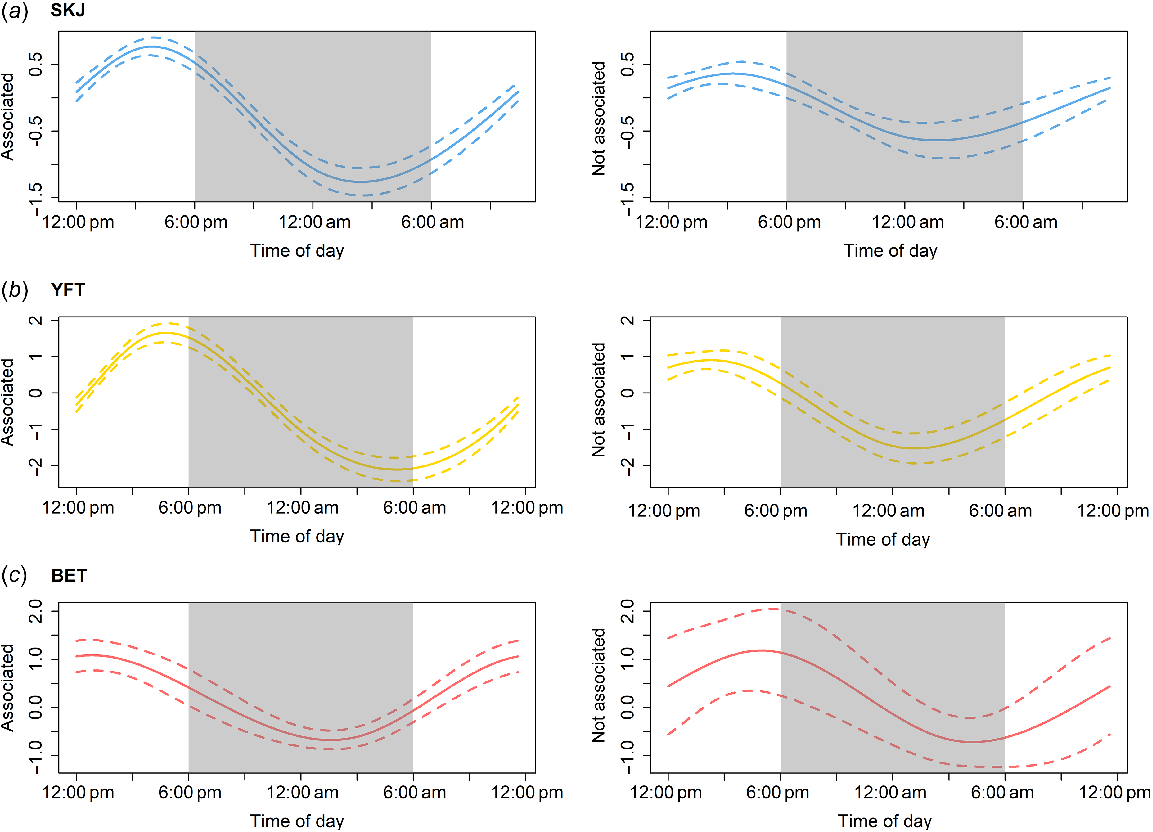
The interaction between ‘Time of day’ and ‘School’ inferred that in associated schools, the probability of non-empty stomachs was lowest before dawn and increased throughout the day, to a maximum just before sunset for skipjack and yellowfin tuna and a little earlier for bigeye tuna (Fig. 5). The effect of ‘Time of day’ was weaker but still present in not-associated schools. There was a lower chance of having a non-empty stomach early in the morning for skipjack and yellowfin tuna, and a shift towards dawn for bigeye tuna, which presented an uncertainty in its results because of the lack of data.
Partial effects of ‘Time of day’ by ‘School’ for the three species of tuna predicted from Model M5 (see Table 1) for the binary response variable (empty or non-empty) fitted to the reduced dataset. (a) SKJ, skipjack tuna; (b) YFT, yellowfin tuna; (c) BET, bigeye tuna. Solid lines represent the likelihood of having a non-empty stomach on the scale of the link function, and dashed lines represent the 95% confidence interval. Dark zones denote the night-time period.
Discussion
In this study, we have presented empirical observations of skipjack, yellowfin, and bigeye tuna stomach fullness from our dataset, which, to our knowledge, is the most extensive dataset available on the diet of these three key oceanic predators of high commercial importance in the WCPO and at this temporal scale (2001–2021). Previous stomach-content studies that focused on prey consumed by tunas have already used some of these data, but covered no more than 13 years (Allain 2004, 2005; Allain et al. 2012; Miller et al. 2015). Today, we have 20 years of trophic data, and this study focused on the information available from the fullness of the stomachs by using three measurement methods. We recap briefly on each below.
Stomach-fullness measurements
The categorical fullness coefficient remains the first measure recorded when assessing fullness for all tuna stomach samples archived in the PMSB. Although classification to the ‘0’ category, representing an empty stomach, is unambiguous, the subjectivity inherent to this measure is confirmed by the large variability observed in fullness metric values within each of fullness coefficient categories from ‘1’ to ‘4’, representing the non-empty stomachs (see Fig. 2c). This spread of fullness metric values for non-empty stomachs is unsurprising, given the qualitative nature of the fullness coefficient. That said, its simplicity, ease of application and the positive relationship evident in Fig. 2c do highlight the potential value of the fullness coefficient as an initial estimate of stomach fullness, one particularly well suited to observers at sea where collection of precise prey-weight measurements is typically not possible.
The calculation of the continuous fullness metric in our study also warrants some discussion. The key difference between our fullness metric calculation and Herbold’s (1986) ‘Percentage fullness’ calculation lies in the derivation of the denominator term in Eqn 1. The log–log models depicted in Fig. S1–S3 aimed to predict the ‘typical’ maximum prey weight at length for each tuna species on the basis of all data available for the individuals we classified as having full stomachs (i.e. with a fullness coefficient of 4). By contrast, Herbold’s approach involved filtering the data for the maximum observed prey weight for each length class and excluding records based on the reasoning that larger fish have a potential maximum prey weight at least as heavy as that of a smaller fish. The multiple regression models fitted by Herbold (1986) to quantify the denominator in his ‘Percentage fullness’ calculation were therefore predicting the ‘absolute’ maximum prey weight at length, rather than the typical maximum prey weight that we use in Eqn 1.
Our decision to use the typical maximum prey weight as a reference follows the rationale that prey weights of full tuna stomachs are likely to vary considerably depending on the diversity of prey types consumed. Tropical tunas of the WCPO are known to predate on a wide array of taxa including fish, crustaceans, cephalopods and gelatinous prey (Ménard et al. 2000; Bertrand et al. 2002; Allain 2004, 2005). Little is known about how prey species’ diversity, availability, size, and mass vary across space and time in the WCPO, and how these are reflected in tropical tuna diets through ontogeny (but see Olson et al. 2016; Fuller et al. 2021). Under these circumstances, we considered it sensible to maximise the information available from our dataset, with the typical maximum prey weight arguably more accurately capturing the diversity of tuna diets exhibited across the study region, rather than reflecting only diets that lead to the heaviest full stomachs, which may be less representative of all possible diets.
We note also that our fullness metric is derived from stomach-content weight, a metric we believe was well-suited to estimating the typical maximum stomach capacity at length in these tropical tunas. That said, volumetric measures of stomach fullness have also been explored in other species (Knight and Margraf 1982; Phelps et al. 2007) and applying such a measure to tropical tunas could offer an informative proxy of absolute maximum stomach capacity at length in future studies.
Finally, we tested the utility of a binary fullness metric, a less subjective version of the fullness coefficient containing only two categories, and found that models using this simpler metric as a response variable were the most informative for understanding relationships between tuna stomach fullness and our chosen covariates. We discuss the outcomes of our modelling in further detail in the next section.
Model performance
The first series of models we fitted with the fullness coefficient (categorical response variable) and the fullness metric (continuous response variable) (i.e. M1–M4) were largely uninformative because they failed to converge, violated model assumptions, or demonstrated poor predictive performance. We cannot base any interpretation on these models other than to say that this fullness metric is highly variable across individuals. These results may be due to missing covariates that are predictive of stomach fullness, or a lack of sensitivity in the measures we are using to describe stomach fullness. It is also possible that the data we have for each species may not be representative of the true range of stomach-fullness values existing in nature, our response variable distributions therefore not fully capturing fullness values existing in the overall population. One way this might arise is if our sampling was somehow biased, for example, through space or time interacting with fishery selectivity. Although we cannot rule out this possibility, we suggest that the presence of any sampling bias in our data is likely to be minimal, given the broad spatial and temporal coverage of our sampling and the sample sizes available (see Fig. 1).
The binary models (empty or non-empty stomachs) using logistic regression (i.e. M5 and M6) generally had good model performance to predict non-empty stomachs (i.e. predicted probability of non-empty stomachs was higher for skipjack and yellowfin tuna, less so for bigeye tuna) but the model performance was variable for empty stomachs (i.e. predicted probability of empty stomachs was variable, regardless of species).
Our analysis allowed us to assess the influence of our covariates on possible feeding success of tuna caught by commercial fisheries. With reference to identifying empty stomachs, this is straightforward and unambiguous in the laboratory, and through our data (Fig. 3) and models (Fig. 5) we can clearly see at which levels of our covariates foraging is least effective or not occurring. Non-empty stomachs may correspond to a period of feeding or digestion; however, the degree to which the ‘non-empty’ stomachs are ‘non-empty’ (i.e. how full they are) is very uncertain and could not be reliably modelled.
Stomach fullness in relation to gear, school association and time of day
As in several previous studies, the results from the binary models confirmed the fact that fisheries-related covariates can predict observations of tuna stomach fullness.
As expected, fishing gear was a relevant predictor; all three tuna species were more likely to have empty stomachs if caught on active gear (i.e. purse seine) and non-empty stomachs if caught on passive gear (i.e. longline, pole-and-line or danglers-handline). However, it is important to again highlight that a non-empty stomach does not necessarily mean it is full. In work on yellowfin, bigeye and albacore (T. alalunga) from the South Pacific, Bard (2001) observed that individuals captured on longline gear typically exhibited empty stomachs or very low stomach fullness. They hypothesised that only tunas with low stomach-fullness levels would attack longline baits, and that such behaviour might be linked to a lack of more attractive, naturally occurring prey such as that available through the daily cycle of vertically migrating, mesopelagic micronekton. Because both pole-and-line and longline gear use baited fishing methods, the chance of catching a fish depends at least partly on the feeding motivation of the fish, i.e. how hungry they are, and if they are actively foraging. Under such circumstances, we would expect a priori that stomach fullness at capture would be generally low, which is in agreement with the observations of Bard (2001), but not necessarily empty, as supported by the prevalence of non-empty stomachs seen in our dataset. For active gear such as purse seine, catchability is less likely to be influenced by satiety and feeding behaviour, and more likely linked to other behaviours or factors related to the fishing strategy. Indeed, Moreno et al. (2007) explained that in the WCPO, purse seiners generally set up at the FADs just before dawn, because targeted tuna can more easily escape during the day with clearer water and a more favourable thermocline depth. As feeding is not a requirement to be caught by purse seine, we might expect tunas captured on this gear to exhibit a wider range of stomach fullness, with no clear trends towards empty or non-empty stomachs. Yet, our findings of a consistently higher probability of empty stomachs in purse-seine catches across all three species suggests that the fishing strategy, linked to the time of day and the use of floating objects, is also influential on our observations.
Our results suggested that skipjack and bigeye tuna were more likely to have non-empty stomachs when they were not associated with floating objects. For skipjack, this observation, which was also made in the equatorial Atlantic Ocean, supports the suggestion that FADs can act as a refuge or a meeting point, and that this species tends to gather in free schools to feed (Ménard et al. 2000). Again, from our results we cannot discern how full a non-empty stomach is in response to these covariates. Because the discrimination between empty and non-empty stomach was not significantly different for yellowfin tuna either associated or not associated to a floating object, it appears that foraging in this species is not strongly influenced by the school-association effect. However, the poor fit of our chosen models for the more detailed categorical fullness coefficient and continuous fullness metric clearly demonstrated that other processes are likely to be driving changes in these finer-scale variations in tuna feeding success. At the majority of the size classes examined here, these tuna species aggregate into groups in which schooling behaviour dominates (Robert et al. 2013; Scutt Phillips et al. 2019). In our results, we did not know the size of the schools (i.e. the number of individuals in the school) nor the size composition of the schools (i.e. schools composed of different species with fish of different size range). Dagorn et al. (1994) showed that as fish size increases, school size decreases and, for yellowfin tuna, this may be linked to a change in foraging. We expected a priori that variation in foraging behaviour among species and through ontogeny may help explain variation in tuna stomach fullness. Graham et al. (2007) and Weng et al. (2015) showed an ontogenetic shift in diet with size for yellowfin caught around coastal, anchored FADs through analysis of nitrogen stable isotopes, which they attributed to changes in foraging niche over size. However, the absence of a clear relationship between our fullness metric and fish length for each of the three tuna species (Fig. S4) suggests that any ontogenetic change in diet composition, if present, is not reflected in ontogenetic changes in the measures we use to gauge stomach fullness, at least not across the length range of the fish examined in our dataset. It should also be noted that while we are comparing associated schools with not-associated schools, we do not take into account the type of associated school (e.g. anchored FADs v. drifting FADs) and the location of floating objects (i.e. the environmental factors). Indeed, Jaquemet et al. (2011) showed a difference in the number of empty stomachs for tuna caught around drifting FADs in food-rich and food-limited areas of the western Indian Ocean. FADs drifting through areas where prey resources are scarce may affect feeding success of resident schools and this hypothesis may also influence the variability of our results.
Our modelling results indicated that tuna caught early in the morning (on gear other than longline) tended to have empty stomachs (see Fig. 5), suggesting several hypotheses on their behaviour. Fish caught at this time may not have fed during the night, potentially because they were not actively looking for food or because they were not successful in catching prey. Indeed, for individuals captured on passive gear, which inherently involves them choosing to take a bait, our results suggest that such active foraging behaviour may often just be commencing at dawn. However, despite their empty stomachs, we cannot assert with certainty that the tunas did not feed during the night. Information on prey-specific digestion times is lacking, and because tuna feed on a wide variety of prey types and sizes, it is difficult to know whether they may have fed on small or quickly digested prey species during the night, leaving an empty stomach at dawn. Data from electronic tagging experiments of Schaefer and Fuller (2005, 2007) have shown a modification in the vertical distribution of bigeye and skipjack, which tend to exhibit surface-oriented behaviours at night when associated with floating objects, suggesting that this may be linked to feeding on organisms of the deep scattering layers coming to the surface at night, including zooplankton and micronekton. Unfortunately, our dataset contained few observations from tunas captured at night that could help support these suggestions. Similarly, our observations for yellowfin showed that a majority of the empty stomachs come from fish caught in the morning. To obtain a more complete picture of tropical tuna diet, especially in terms of prey composition, it would be useful to obtain additional samples from the afternoon and the evening. While helping clarify patterns in stomach fullness through the full diel cycle, such samples would also allow us to gauge the influence of opportunistic sampling or fisheries-dependant bias on our results. Longline records may prove useful in this regard; however, uncertainty around the time of capture during the long soak times observed in our longline sets meant that we could not include these data in models incorporating the ‘Time of day’ covariate in this study.
As the PMSB archive of tuna stomachs from across the WCPO continues to grow, one priority for future modelling work is the incorporation of a fishing event variable into our stomach-fullness models. Its inclusion would allow us to gauge the degree of variability in fullness attributable to within- and between-fishing events, and to better quantify the influence (or not) of school cohesion on feeding behaviour around drifting FADs. Furthermore, integrating studies such as ours with those using telemetry, biotic oceanography or muscle stable isotope analyses may provide deeper insights into the factors driving tuna feeding success (Kirby 2001) and thus improve the utility of stomach-fullness measures as a valuable ecosystem indicator (Allain et al. 2021; Oceanic Fisheries Programme, Pacific Community 2023).
Several studies have examined diet and prey diversity in response to environment, fish length, and similar covariates as those we examined here (e.g. Bertrand et al. 2002; Fuller et al. 2021; Jiang et al. 2022), showing significant differences in diet among regions, species and size. However, our aim in this study was to more fundamentally examine measures of tuna stomach fullness and examine how the apparent short-term feeding success of individuals may be predicted by simple covariates that have been hypothesised to influence observations of stomach contents.
Future directions of the study
This study has highlighted how metrics of stomach fullness may allow us to answer questions about the ecosystem dynamics and the influence of fisheries and advise us on sampling methods for tuna-diet studies. We examined only a small number of explanatory variables in our study and further work is needed to identify other important covariates to better understand the mechanisms that underpin stomach fullness in tunas. Specifically, progress may lie in incorporating estimates of the habitat richness (e.g. primary production), availability of prey (e.g. zooplankton/micronekton estimates from models, Receveur et al. 2022), digestion rate of individual prey and prey composition.
At present, our results suggest that examining tuna stomach fullness as proportional binary data is most appropriate, but with ongoing sample collection, the continued development of fullness metrics, and incorporation of other data such a nitrogen isotope or lipid content measurements, it may be possible to more accurately characterise the true range of feeding success present in tuna populations.
Data availability
The datasets generated and analysed during the current study are not publicly available but are available from the corresponding author on reasonable request.
Declaration of funding
This research has been conducted with the support of the New Zealand Government’s ‘Climate Science for Ensuring Pacific Tuna Access’ project and the European Union’s and Sweden’s ‘Pacific–European Union Marine Partnership’ (PEUMP) Programme.
Acknowledgements
We are grateful to the WCPFC Pacific Marine Specimen Bank and the Pacific Community (SPC, New Caledonia), Fisheries, Aquaculture and Marine Ecosystems (FAME) division for collating and providing stomach samples of tunas. We acknowledge the important work conducted by the national observer programs of the member countries of SPC for sample collection. We also acknowledge the work conducted by the laboratory assistants who examined the samples to produce the stomach-content database. We thank the reviewers for their comments.
References
Allain V (2005) Diet of four tuna species of the Western and Central Pacific Ocean. SPC Fisheries Newsletter 114(July/September), 30-33 Available at https://purl.org/spc/digilib/doc/th5dk.
| Google Scholar |
Allain V, Fernandez E, Hoyle SD, Caillot S, Jurado-Molina J, Andréfouët S, Nicol SJ (2012) Interaction between coastal and oceanic ecosystems of the Western and Central Pacific Ocean through predator–prey relationship Studies. PLoS ONE 7, e36701.
| Crossref | Google Scholar | PubMed |
Allain V, Hare S, Macdonald J, Machful P, Nicol S, Scutt Phillips J, Portal A, Vidal T, Williams P (2021) WCPO Ecosystem and Climate Indicators from 2000 to 2020. In ‘Seventeenth Regular Session of the Western and Central Pacific Fisheries Commission Scientific Committee’, 11–19 August 2021, held virtually. WCPFC-SC17-2021/EB-IP-09. (OFP and SPC: Nouméa, New Caledonia) Available at https://meetings.wcpfc.int/node/12606
Bard FX (2001) Apparent effect of stomach repletion on catchability of large tunas to longline gear. Comparison with other fishing gear. Collective Volume of Scientific Papers ICCAT 52, 452-465.
| Google Scholar |
Bertrand A, Bard F-X, Josse E (2002) Tuna food habits related to the micronekton distribution in French Polynesia. Marine Biology 140, 1023-1037.
| Crossref | Google Scholar |
Brooks M, Kristensen K, van Benthem K, Magnusson A, Berg C, Nielsen A, Skaug H, Mächler M, Bolker B (2017) glmmTMB balances speed and flexibility among packages for zero-inflated generalized linear mixed modeling. The R Journal 9, 378-400.
| Crossref | Google Scholar |
Buckley TW, Miller BS (1994) Feeding habits of yellowfin tuna associated with fish aggregation devices in American Samoa. Bulletin of Marine Science 55, 445-459.
| Google Scholar |
Dagorn L, Petit M, Hallier JP, Cayré P, Simier M (1994) Does tuna school size depend on fish size? In ‘Proceedings of the fifth expert consultation on Indian Ocean tunas. Part 2: review of status of stocks and tuna biology’, 4–8 October 1993, Mahé, Seychelles. (Ed. JD Ardill) IPTP Collective Volumes, Vol. 8, pp. 183–187. (IPTP: Colombo, Sri Lanka) Available at https://horizon.documentation.ird.fr/exl-doc/pleins_textes/divers21-03/010056460.pdf
Duffy LM, Kuhnert PM, Pethybridge HR, Young JW, Olson RJ, Logan JM, Goñi N, Romanov E, Allain V, Staudinger MD, Abecassis M, Choy CA, Hobday AJ, Simier M, Galván-Magaña F, Potier M, Ménard F (2017) Global trophic ecology of yellowfin, bigeye, and albacore tunas: Understanding predation on micronekton communities at ocean-basin scales. Deep-Sea Research – II. Topical Studies in Oceanography 140, 55-73.
| Crossref | Google Scholar |
Escalle L, Hare SR, Vidal T, Brownjohn M, Hamer P, Pilling G (2021) Quantifying drifting fish aggregating device use by the world’s largest tuna fishery. ICES Journal of Marine Science 78, 2432-2447.
| Crossref | Google Scholar |
Fonteneau A, Chassot E, Bodin N (2013) Global spatio-temporal patterns in tropical tuna purse seine fisheries on drifting fish aggregating devices (DFADs): taking a historical perspective to inform current challenges. Aquatic Living Resources 26, 37-48.
| Crossref | Google Scholar |
Food and Agriculture Organization of the United Nations (2022) ‘The state of world fisheries and aquaculture 2022. Towards blue transformation.’ (FAO: Rome, Italy) doi:10.4060/cc0461en
Fuller L, Griffiths S, Olson R, Galván-Magaña F, Bocanegra-Castillo N, Alatorre-Ramírez V (2021) Spatial and ontogenetic variation in the trophic ecology of skipjack tuna, Katsuwonus pelamis, in the eastern Pacific Ocean. Marine Biology 168, 73.
| Crossref | Google Scholar |
Graham BS, Grubbs D, Holland K, Popp BN (2007) A rapid ontogenetic shift in the diet of juvenile yellowfin tuna from Hawaii. Marine Biology 150, 647-658.
| Crossref | Google Scholar |
Griffiths SP, Fry GC, Manson FJ, Pillans RD (2007) Feeding dynamics, consumption rates and daily ration of longtail tuna (Thunnus tonggol) in Australian waters, with emphasis on the consumption of commercially important prawns. Marine and Freshwater Research 58, 376-397.
| Crossref | Google Scholar |
Griffiths SP, Allain V, Hoyle SD, Lawson TA, Nicol SJ (2019) Just a FAD? Ecosystem impacts of tuna purse-seine fishing associated with fish aggregating devices in the western Pacific Warm Pool Province. Fisheries Oceanography 28, 94-112.
| Crossref | Google Scholar |
Hallier JP, Gaertner D (2008) Drifting fish aggregation devices could act as an ecological trap for tropical tuna species. Marine Ecology Progress Series 353, 255-264.
| Crossref | Google Scholar |
Herbold B (1986) An alternative to the fullness index. In ‘Contemporary studies on fish feeding: the proceedings of GUTSHOP’84. Developments in environmental biology of fishes. Vol. 7’. (Eds CA Simenstad, GM Cailliet) pp. 315–320 (Springer: Dordrecht, Netherlands) doi:10.1007/978-94-017-1158-6_27
Hynes HBN (1950) The Food of Fresh-Water Sticklebacks (Gasterosteus aculeatus and Pygosteus pungitius), with a review of methods used in studies of the food of fishes. The Journal of Animal Ecology 19, 36-58.
| Crossref | Google Scholar |
Hyslop EJ (1980) Stomach contents analysis: a review of methods and their application. Journal of Fish Biology 17, 411-429.
| Crossref | Google Scholar |
Jaquemet S, Potier M, Ménard F (2011) Do drifting and anchored Fish Aggregating Devices (FADs) similarly influence tuna feeding habits? A case study from the western Indian Ocean. Fisheries Research 107, 283-290.
| Crossref | Google Scholar |
Jiang RJ, Yang F, Chen F, Yin R, Liu MZ, Zhu WB, Guo A, Liu LW (2022) Assessing trophic interactions among three tuna species in the Solomon Islands based on stomach contents and stable isotopes. Frontiers in Marine Science 9, 961990.
| Crossref | Google Scholar |
Kirby DS (2001) On the integrated study of tuna behaviour and spatial dynamics: tagging and modelling as complementary tools. In ‘Electronic tagging and tracking in marine fisheries: proceedings of the symposium on tagging and tracking marine fish with electronic devices’, 7–11 February 2000, Honolulu, HI, USA. (Eds JR Sibert, JL Nielsen) Reviews: Methods and Technologies in Fish Biology and Fisheries, Vol. 1, pp. 407–420. (Springer: Dordrecht, Netherlands) doi:10.1007/978-94-017-1402-0_22
Knight RL, Margraf FJ (1982) Estimating stomach fullness in fishes. North American Journal of Fisheries Management 2, 413-414.
| Crossref | Google Scholar |
Leroy B, Phillips JS, Nicol S, Pilling GM, Harley S, Bromhead D, Hoyle S, Caillot S, Allain V, Hampton J (2013) A critique of the ecosystem impacts of drifting and anchored FADs use by purse-seine tuna fisheries in the Western and Central Pacific Ocean. Aquatic Living Resources 26, 49-61.
| Crossref | Google Scholar |
Machful P, Allain V (2018) A la carte menu for tuna: kids’ dishes, regional and seasonal specialities, or how tuna diet vary in the Pacific. SPC Fisheries Newsletter 157, 2-7 Available at https://purl.org/spc/digilib/doc/d2zjh.
| Google Scholar |
Machful P, Portal A, Macdonald J, Allain V, Phillips JS, Nicol S (2021) Tuna stomachs: is the glass half full, or half empty? SPC Fisheries Newsletter 166, 38-44 Available at https://purl.org/spc/digilib/zodjm.
| Google Scholar |
Ménard F, Stéquert B, Rubin A, Herrera M, Marchal E (2000) Food consumption of tuna in the Equatorial Atlantic Ocean: FAD-associated versus unassociated schools. Aquatic Living Resources 13, 233-240.
| Crossref | Google Scholar |
Miller MJ, Dubosc J, Vourey E, Tsukamoto K, Allain V (2015) Low occurrence rates of ubiquitously present leptocephalus larvae in the stomach contents of predatory fish. ICES Journal of Marine Science 72, 1359-1369.
| Crossref | Google Scholar |
Moreno G, Dagorn L, Sancho G, Itano D (2007) Fish behaviour from fishers’ knowledge: the case study of tropical tuna around drifting fish aggregating devices (DFADs). Canadian Journal of Fisheries and Aquatic Sciences 64, 1517-1528.
| Crossref | Google Scholar |
Nemerson DM, Able KW (2004) Spatial patterns in diet and distribution of juveniles of four fish species in Delaware Bay marsh creeks: factors influencing fish abundance. Marine Ecology Progress Series 276, 249-262.
| Crossref | Google Scholar |
Oceanic Fisheries Programme, Pacific Community (2023) Project 35b: WCPFC Pacific Marine Specimen Bank. In ‘Nineteenth Regular Session of the Scientific Committee of the Western and Central Pacific Fisheries Commission’, 16–24 August 2023, Koror, Palau. WCPFC-SC19-2023/RP-P35b-01. (OFP and SPC: Nouméa, New Caledonia) Available at https://meetings.wcpfc.int/node/19406
Olson RJ (1982) Feeding and energetics studies of yellowfin tuna, food for ecological thought. ICCAT Collective Volume of Scientific Papers 17, 444-457.
| Google Scholar |
Olson RJ, Boggs CH (1986) Apex predation by Yellowfïn Tuna (Thunnus albacares): independent estimates from gastric evacuation and stomach contents, bioenergetics, and cesium concentrations. Canadian Journal of Fisheries and Aquatic Sciences 43, 1760-1775.
| Crossref | Google Scholar |
Olson RJ, Watters GM (2003) A model of the pelagic ecossystem in the eastern tropical Pacific Ocean. Inter-American Tropical Tuna Commission Bulletin 22, 135-218.
| Google Scholar |
Olson RJ, Duffy LM, Kuhnert PM, Galván-Magaña F, Bocanegra-Castillo N, Alatorre-Ramírez V (2014) Decadal diet shift in yellowfin tuna Thunnus albacares suggests broad-scale food web changes in the eastern tropical Pacific Ocean. Marine Ecology Progress Series 497, 157-178.
| Crossref | Google Scholar |
Olson RJ, Young JW, Ménard F, Potier M, Allain V, Goñi N, Logan JM, Galván-Magaña F (2016) Bioenergetics, trophic ecology, and niche separation of tunas. Advances in Marine Biology 74, 199-344.
| Crossref | Google Scholar |
Ortega-Garcia S, Galván-Magaña F, Arvizu-Martinez J (1992) Activity of the mexican purse seine fleet and the feeding habits of yellowfin tuna. Ciencias Marinas 18, 139-149.
| Crossref | Google Scholar |
Perelman JN, Schmidt KN, Haro I, Tibbetts IR, Zischke MT (2017) Feeding dynamics, consumption rates and daily ration of wahoo Acanthocybium solandri in Indo-Pacific waters. Journal of Fish Biology 90, 1842-1860.
| Crossref | Google Scholar | PubMed |
Phelps QE, Willis DW, Powell KA, Chipps SR (2007) A method for determining stomach fullness for planktivorous fishes. North American Journal of Fisheries Management 27, 932-935.
| Crossref | Google Scholar |
Pirhonen J, Muuri L, Kalliokoski SM, Puranen MM, Marjomäki TJ (2019) Seasonal and ontogenetic variability in stomach size of Eurasian perch (Perca fluviatilis L.). Aquaculture International 27, 1125-1135.
| Crossref | Google Scholar |
Portal A, Roupsard F, Vourey É, Allain V (2020) A carefully protected treasure: the Pacific Marine Specimen Bank. SPC Fisheries Newsletter 161, 40-44 Available at https://purl.org/spc/digilib/doc/dcnek.
| Google Scholar |
Receveur A, Allain V, Menard F, Lebourges Dhaussy A, Laran S, Ravache A, Bourgeois K, Vidal E, Hare SR, Weimerskirch H, Borsa P, Menkes C (2022) Modelling marine predator habitat using the abundance of its pelagic prey in the tropical South-Western Pacific. Ecosystems 25, 757-779.
| Crossref | Google Scholar |
Robert M, Dagorn L, Lopez J, Moreno G, Deneubourg J-L (2013) Does social behavior influence the dynamics of aggregations formed by tropical tunas around floating objects? An experimental approach. Journal of Experimental Marine Biology and Ecology 440, 238-243.
| Crossref | Google Scholar |
Ruohonen K, Grove DJ (1996) Gastrointestinal responses of rainbow trout to dry pellet and low-fat herring diets. Journal of Fish Biology 49, 501-513.
| Crossref | Google Scholar |
Schaefer KM, Fuller DW (2005) Behavior of bigeye (Thunnus obesus) and skipjack (Katsuwonus pelamis) tunas within aggregations associated with floating objects in the equatorial eastern Pacific. Marine Biology 146, 781-792.
| Crossref | Google Scholar |
Schaefer KM, Fuller DW (2007) Vertical movement patterns of skipjack tuna (Katsuwonus pelamis) in the eastern equatorial Pacific Ocean, as revealed with archival tags. Fishery Bulletin 105, 379-389.
| Google Scholar |
Scutt Phillips J, Leroy B, Peatman T, Escalle L, Smith N (2019) Electronic tagging for the mitigation of bigeye and yellowfin tuna juveniles by purse seine fisheries. In ‘Fifteenth Regular Session of the Western and Central Pacific Fisheries Commission Scientific Committee’, 12–20 August 2019, Pohnpei, Federated States of Micronesia. WCPFC-SC15-2019/EB-WP-08. (Western and Central Pacific Fisheries Commission) Available at https://meetings.wcpfc.int/node/11299
Valls M, Saber S, Gómez MJ, Reglero P, Mele S (2022) Diet and feeding behaviour of albacore Thunnus alalunga in the western Mediterranean Sea during the spawning period. Journal of Fish Biology 100, 203-217.
| Crossref | Google Scholar | PubMed |
Weng J-S, Lee M-A, Liu K-M, Hsu M-S, Hung M-K, Wu L-J (2015) Feeding ecology of juvenile yellowfin tuna from waters southwest of Taiwan inferred from stomach contents and stable isotope analysis. Marine and Coastal Fisheries 7, 537-548.
| Crossref | Google Scholar |
Williams P, Ruaia T (2023) Overview of tuna fisheries in the Western and Central Pacific Ocean, including economic conditions – 2022. In ‘Nineteenth Regular Session of the Western and Central Pacific Fisheries Commission Scientific Committee’, 16–24 August 2023, held virtually and Koror, Palau. WCPFC-SC19-2023/GN WP-1. (Western and Central Pacific Fisheries Commission) Available at https://meetings.wcpfc.int/node/19335
Williams AJ, Allain V, Nicol SJ, Evans KJ, Hoyle SD, Dupoux C, Vourey E, Dubosc J (2015) Vertical behavior and diet of albacore tuna (Thunnus alalunga) vary with latitude in the South Pacific Ocean. Deep-Sea Research – II. Topical Studies in Oceanography 113, 154-169.
| Crossref | Google Scholar |
Wood SN (2011) Fast stable restricted maximum likelihood and marginal likelihood estimation of semiparametric generalized linear models. Journal of the Royal Statistical Society – B. Statistical Methodology 73, 3-36.
| Crossref | Google Scholar |