Projected changes in Antarctic daily temperature in CMIP6 under different warming scenarios during two future periods
Jiangping Zhu A B , Aihong Xie
  A * , Xiang Qin
  A * , Bing Xu A B and Yicheng Wang C
A State Key Laboratory of Cryospheric Sciences, Northwest Institute of Eco-Environment and Resources, Chinese Academy of Sciences, Lanzhou, Gansu, 730000, PR China.
B University of Chinese Academy of Sciences, Beijing, 100049, PR China.
C Lanzhou Central Meteorological Observatory, Lanzhou, Gansu, 730000, PR China.
Journal of Southern Hemisphere Earth Systems Science 72(3) 165-178 https://doi.org/10.1071/ES22008
Submitted: 22 March 2022 Accepted: 7 September 2022 Published: 11 October 2022
© 2022 The Author(s) (or their employer(s)). Published by CSIRO Publishing on behalf of BoM. This is an open access article distributed under the Creative Commons Attribution-NonCommercial-NoDerivatives 4.0 International License (CC BY-NC-ND)
Abstract
Global warming increases the frequency and intensity of climate extremes, but the changes in climate extremes over the Antarctic Ice Sheet (AIS) during different periods are unknown. Changes in surface temperature extreme indices (TN10p, TX10p, TN90p, TX90p, CSDI, WSDI, TNn, TNx, TXn, TXx and DTR) are assessed during 2021–2050 and 2071–2100 under SSP1-2.6, SSP2-4.5, SSP3-7.0 and SSP5-8.5, based on the multi-model ensemble mean (MMEM) from the Coupled Model Intercomparison Project Phase 6 (CMIP6). The extreme indices, excluding TXn and DTR, illustrate the opposite trend in the two periods in SSP1-2.6 over the AIS. Generally, the changes in extreme indices reflect the continued warming over AIS in the future, and the warming is projected to intensify in SSP3-7.0 and SSP5-8.5. The variations in the extreme indices exhibit regional differences. The Antarctic Peninsula displays rapid changes in TNn, TXn and DTR. In SSP5-8.5, the magnitudes of all climate index tendencies are greater during 2071–2100 than 2021–2050. The variations in TX10p, TX90p, TN10p, TN90p, WSDI and CSDI are faster in the Antarctic inland than in the other regions over the AIS. However, the decrease in the DTR is concentrated along the AIS coast and extends to the interior region, whereas the increasing trend occurs in the Antarctic inland. In West AIS, TX90p and TN90p rapidly increase during 2021–2050, whereas the rapid changing signals disappear in this region in 2071–2100. The dramatic changes in TNn, TXn and DTR occur at the Ross Ice Shelf during 2071–2100, indicating an increased risk of collapse. For TNx and TXx, the degree of warming in the later part of the 21st century is divided by the transantarctic mountains, and greater changes appear on the eastern side. Generally, Antarctic amplification of TNn, TXn and DTR is observed except under SSP1-2.6. In addition, TNx and TXx amplifications occur in SSP3-7.0 and SSP5-8.5.
Keywords: Antarctica, climate, CMIP6, ETCCDI, extreme indices, extreme temperature, model evaluation, scenarios.
1. Introduction
The Sixth Assessment Report (AR6) of the Intergovernmental Panel on Climate Change (IPCC) has documented global-scale warming caused by human intervention at a rate unprecedented in at least the last 2000 years. Moreover, significant warming changes the intensity, frequency and duration of climate extremes worldwide (IPCC 2021). Antarctica, the largest freshwater reservoir on Earth, is intimately coupled to the rest of the climate system (Rintoul et al. 2018; Roussel et al. 2020). Many studies have explored the changes in ice sheet mass balance, sea ice and temperature (de la Mare 2009; Smith and Polvani 2017; Rignot et al. 2019). Continued ice loss over the 21st century is likely for the Antarctic Ice Sheet (AIS), indicating that the global mean sea level will continue to rise (IPCC 2021). The increase in the near-surface air temperature has contributed to the recent rapid loss of mass (Trusel et al. 2015). The near-surface temperature change in the AIS has been enigmatic over recent years (Monaghan et al. 2008; IPCC 2021). The Antarctic Peninsula (AP) and West AIS (WAIS) have experienced rapid warming since the 1950s (Turner et al. 2005; Bromwich et al. 2013; Nicolas and Bromwich 2014), whereas a cooling trend was observed over the AP for the first part of the 21st century, especially during the austral summer (Carrasco 2013; Turner et al. 2016). By contrast, there is no overall trend in East AIS (EAIS) annual temperature, although marginally significant negative trends have been observed in autumn (Schneider et al. 2012). Although researchers have been committed to exploring the mechanism of climate change over the AIS, little is known about the distribution and variation in climate extremes (Kaur et al. 2013; Sancho et al. 2007).
The harsh weather conditions and inhomogeneous observation stations limit the comprehensive understanding of the Antarctic climate (Wei et al. 2019; Zhu et al. 2021). The Coupled Model Intercomparison Project Phase 6 (CMIP6) of the World Climate Research Programme (WCRP) offers the possibility for analysis of Antarctic extremes. Compared to the previous model generation (CMIP5), the experimental outputs from the CMIP6 models include new and better representations of physical, chemical and biological processes, as well as higher resolution (IPCC 2021). In addition, CMIP6 has designed new emission scenarios named Shared Socioeconomic Pathways (SSPs) for the projections, which describe plausible alternative trends in the evolution of society and natural systems (O’Neill et al. 2014; Eyring et al. 2016). For the improvements in model physics and modified parameterisation schemes, CMIP6 outputs have a wider range of climate sensitivity and perform better in regard to climate extremes (Chen et al. 2020). For the global and most regions, the climate models in CMIP6 can reproduce the overall warming of temperature extremes, although the magnitude of trends may differ (IPCC 2021). There have been many studies exploring the variation of extreme temperatures in extrapolar regions, such as Eurasia (Zhao et al. 2021), Advance Climate Change Adaptation (SREX) regions (Almazroui et al. 2021) and China (Zhang et al. 2021), and the results generally illustrate an increase in the frequency and intensity of climate extremes. However, few have been devoted to assessing the corresponding future changes over the AIS.
In this study, we investigate future changes and the distribution of climate extremes over the AIS under the SSP1-2.6, SSP2-4.5, SSP3-7.0 and SSP5-8.5 scenarios, with outputs from CMIP6 models. Polar amplification occurs when strong warming is observed at high latitudes, and weak Antarctic amplification (AnA) is projected to appear by the end of the 21st century (IPCC 2021). Similarly, when the rate of change in high latitudes is rapid, the AnA of climate extremes occurs. In this paper, we use the model projections to identify any AnA phenomenon for climate extremes. Exploring the spatial and temporal changes in future Antarctic climate extremes will be conducive to a better understanding of the unique Antarctic climate.
2. Data and methods
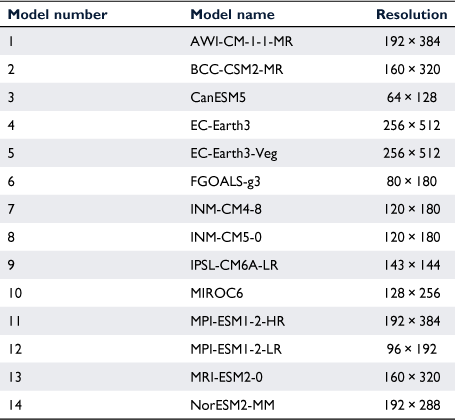
Daily surface (2 m) maximum and minimum temperatures from 14 global climate models (Table 1) are taken from the CMIP6 SSP1-2.6, SSP2-4.5, SSP3-7.0 and SSP5-8.5 emission scenario experiments. The data are available for download at https://esgf-node.llnl.gov/projects/cmip6/. This study selects 11 temperature extreme indices from the Expert Team on Climate Change Detection and Indices (ETCCDI) (Table 2). In the middle part of the 21st century (2021–2050), the warming over the AIS is markedly slower than the warming in the later part (2071–2100) (Fig. 1), especially under high forcing scenarios. Therefore, projected changes in extreme indices are presented in the two different periods. To facilitate the validation, the data are regridded into the resolution of 0.25 × 0.25° using a bilinear interpolation. On this foundation, we weigh all models equally to obtain the multi-model ensemble mean (MMEM), which can improve the accuracy of data and is widely used in research (Taylor et al. 2012; Su et al. 2013). Significance (P < 0.05) of trends is determined using F-tests.
|

|
3. Results
3.1. Variations in temperature extreme indices over AIS and its sub regions under different scenarios during 2021–2050
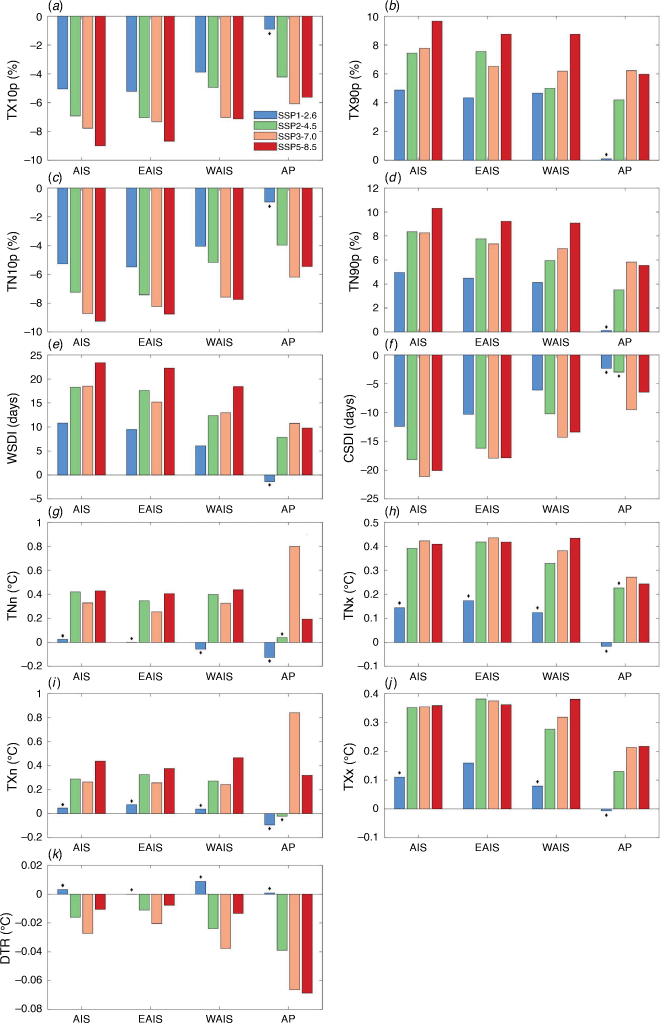
Projected changes in temperature extreme indices from MMEM over AIS, EAIS, WAIS and AP during 2021–2050 are shown in Fig. 2. Generally, the variation in extreme indices in the AIS is essentially in agreement with that in the EAIS. In all scenarios, cold nights (TN10p) and cold days (TX10p) tend to fall, whereas warm nights (TN90p) and warm days (TX90p) are on the rise (Fig. 2a–d). As expected, cold spell duration index (CSDI) decreases for all scenarios, reflecting further warming over the AIS, whereas a weak signal occurs at the AP (Fig. 2f). The warm spell duration index (WSDI) has a slight downward trend (P > 0.05) in SSP1-2.6 (Fig. 2e), and significant increasing trends of 7.86, 10.75 and 9.76 days per decade in SSP2-4.5, SSP3-7.0 and SSP5-8.5 respectively. More specifically, for the threshold temperature indices, including TX10p, TX90p, TN10p, TN90p, WSDI and CSDI, the AP demonstrates a rapid change in SSP3-7.0 rather than SSP5-8.5, which indicates that the projected changes over the AP do not scale linearly with forcing in the middle part of the 21st century. Southern Ocean (SO) warming is vital to the temperature change over the AIS, especially the AP (Shevenell et al. 2011). The standard CMIP6 model configurations do not include the impacts of freshwater input from melting ice shelves, and are important to the strong delays in SO warming in high emissions scenarios, which is crucial for warming over the Antarctic coast (Bronselaer et al. 2018; Bracegirdle et al. 2020). In addition, stronger annual warming of sea surface temperature is observed in the weaker forcing scenarios, which influence the retreat of sea ice and further affect warming (Bracegirdle et al. 2020). In the middle to high forcing scenarios, all regions reflect warming signals for the coldest days and nights (TXn and TNn) and warmest days and nights (TXx and TNx) (Fig. 2g–j). The diurnal temperature range (DTR) has a slight downward trend except under SSP1-2.6 (Fig. 2k), particularly evident at the AP, which is induced by the greater increases in minimum temperature relative to maximum temperature. Among Antarctica and its sub regions, extreme indices at the AP vary slowly in general, with exception of the index DTR. Overall, changes in temperature extremes over the AIS and its sub regions reflect continued future warming in the middle part of the 21st century.
|
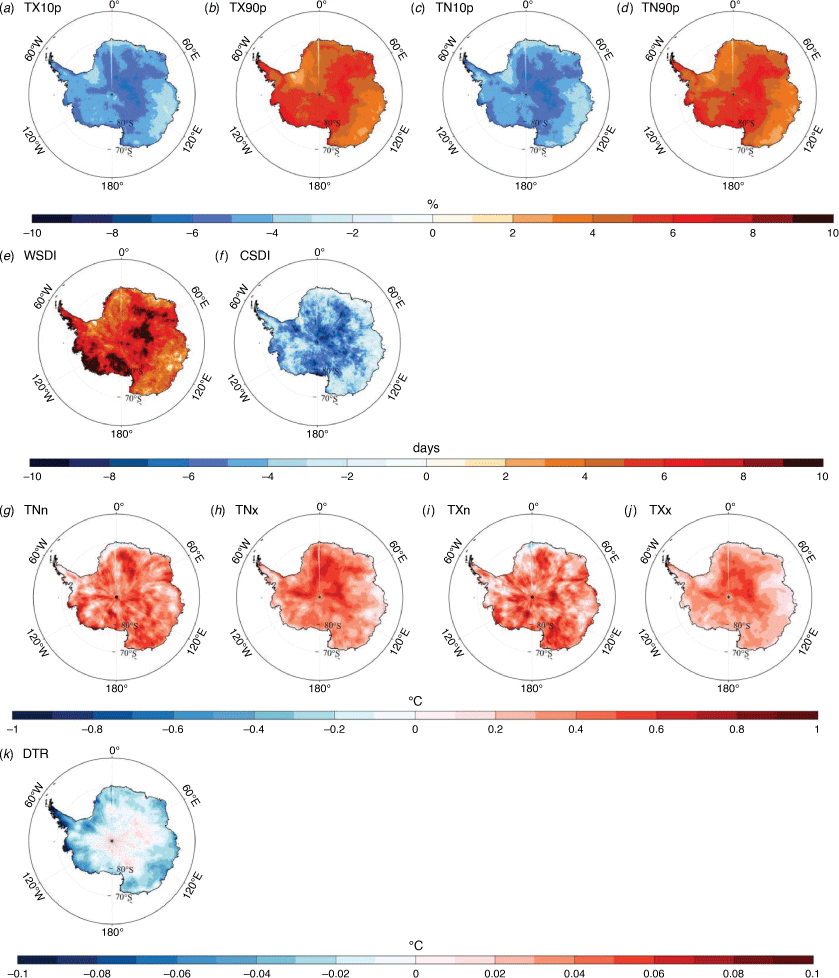
For the rapid change in SSP5-8.5, the spatial patterns of the extreme index trends over the AIS during 2021–2050 from the MMEM are shown in Fig. 3. This result plainly illustrates the consistent variable trends in TX10p and TN10p (Fig. 3a, b), and is also present in TX90p and TN90p (Fig. 3c, d). For cold nights and days (TX10p and TN10p), a rapid decrease occurs at the coast of the WAIS and AP, and a strong signal also appears in the interior of the EAIS. Both TX90p and TN90p display obvious positive trends in the WAIS, western side of the AP and EAIS inland. Similarly, a significant and strongly positive (P < 0.05) WSDI occurs in these regions, especially in the coast of WAIS and AP, with a rate higher than 10 days per decade (Fig. 3e). A key point here is that conspicuous changes in the CSDI and WSDI both occur at the Ross Ice Shelf (Fig. 3e, f). Generally, the increase of TNn, TNx, TXn and TXx dominates the AIS, and the obvious positive trend of TXn and TXx is found in the 0–60°E section of the EAIS (Fig. 3g–j). The variation in DTR shows regional differences, and the negative trends are generally strong at the coast of AIS, for the AP in particular (Fig. 3k). However, the DTR reveals non-significant positive trends (P > 0.05) for the Antarctic inland.
|
3.2. Variations in temperature extreme indices over AIS and its sub regions under different scenarios during 2071–2100
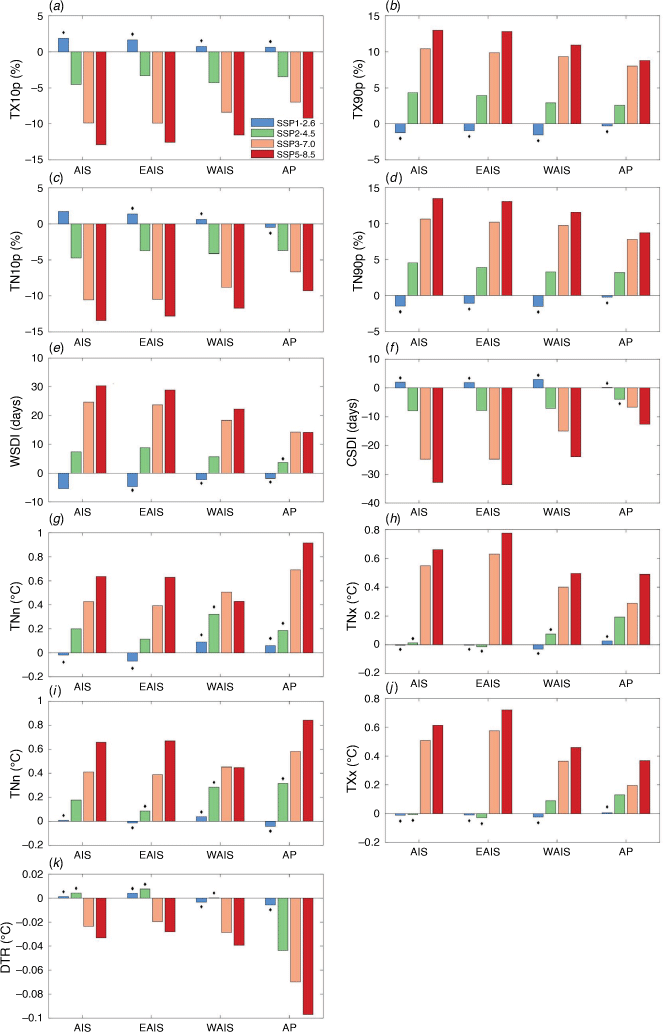
Similarly, Fig. 4 shows projected changes in extreme indices over AIS, WAIS, EAIS and AP in different scenarios, but for the later part of the 21st century. Clearly, the variability in temperature extreme indices becomes violent with the enhancement of radiative forcing. In SSP1-2.6, the TX10p and TN10p exhibit an increasing tendency, and a decreasing trend occurs in TX90p and TN90p, although these changes are generally non-significant (P > 0.05) (Fig. 4a–d). Additionally, in the lower forcing scenario SSP1-2.6, the positive sign of CSDI and negative sign of WSDI are evident in all regions (Fig. 4e, f). In addition, TNn, TNx and TXx reveal declining trends in AIS and EAIS in SSP1-2.6 (Fig. 4g, h, j). The above phenomena are distinguished from those in 2021–2050, which indicates that sustained warming over the AIS is absent in SSP1-2.6. The DTR has an upward trend in AIS and EAIS under SSP1-2.6 and SSP2-4.5 (Fig. 4k), which reflects more rapid increases in maximum rather than minimum temperature. Among the AIS and its sub regions, the AP displays the fastest change in TNn, TXn and DTR in general, and the slowest change is in the other extreme indices. At the AP, TNn and TXn have larger changes than TNx and TXx in SSP3-7.0 and SSP5-8.5 (Fig. 4g–j), which corresponds with the rapid change in DTR.
|
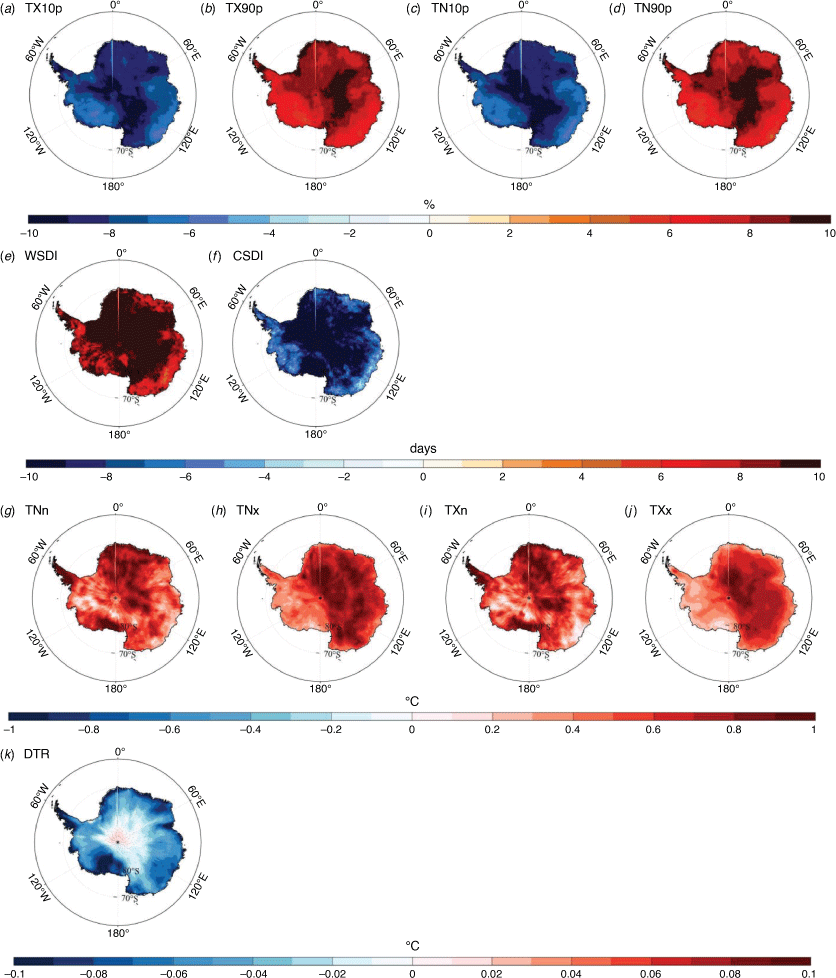
As expected, the changes in temperature extreme indices over the AIS during 2071–2100 (Fig. 5) in SSP5-8.5 are greater than those for 2021–2050 (Fig. 3). Similarly, there is broad agreement of sign in the trends of TX10p and TN10p (Fig. 5a, b), which also exists in TX90p and TN90p (Fig. 5c, d). For TX10p and TN10p, the weaker decrease signal is evident in WAIS and Wilkes Land in general, whereas relatively rapid change occurs on the WAIS coast, and similar variation characteristics are shown in TX90p and TN90p. The WSDI and CSDI exhibit noticeable changes in the Antarctic inland (Fig. 5e, f). The decrease in CSDI is also conspicuous at the Ross Ice Shelf and is weaker at the East Antarctic coast, and most areas in the WAIS and AP. Generally, the warming of TNn, TNx, TXn and TXx dominates the AIS (Fig. 5g–j). Evident TNn and TXn changes take place at the AP and the Ross Ice Shelf, and it should be noted that the warming at the western side of the AP is more conspicuous than on the eastern side, which is distinguished from the change in the middle part of 21st century. The change of TNn and TXn mainly depends on the temperature change in austral winter. Research has found that the obvious warming in winter on the western side of the AP relates to the negative mean sea level pressure and the deep and east Amundsen Sea Low, which can induce the greater warm air advection for the strong north to northwesterly wind down the western side (Turner et al. 2013). In addition, the decrease of sea ice in the Bellingshausen Sea off the west coast of the AP plays an important role in the warming on the western side, which is sensitive to the change of Southern Annular Mode (SAM) and El Niño–Southern Oscillation (ENSO) (Stammerjohn et al. 2008; Ding and Steig 2013). The variations in TNx and TXx show district regional differences, with the transantarctic mountains as demarcation lines, and the warming of the eastern side is faster than that of the western side – this feature is more obvious in TNx. Compared with TNx, TXx exhibits a more remarkable altitude effect. The decrease signals of DTR are missing for the Antarctic inland, and the fast changes are concentrated on the AIS coast (Fig. 5k). More specifically, a strong DTR downward tendency exists on the western side of the AP and the Ross Ice Shelf, which again reflects the rising risk of ice shelf collapse.
|
3.3. Comparison of temperature extreme indices among different latitudes under different scenarios
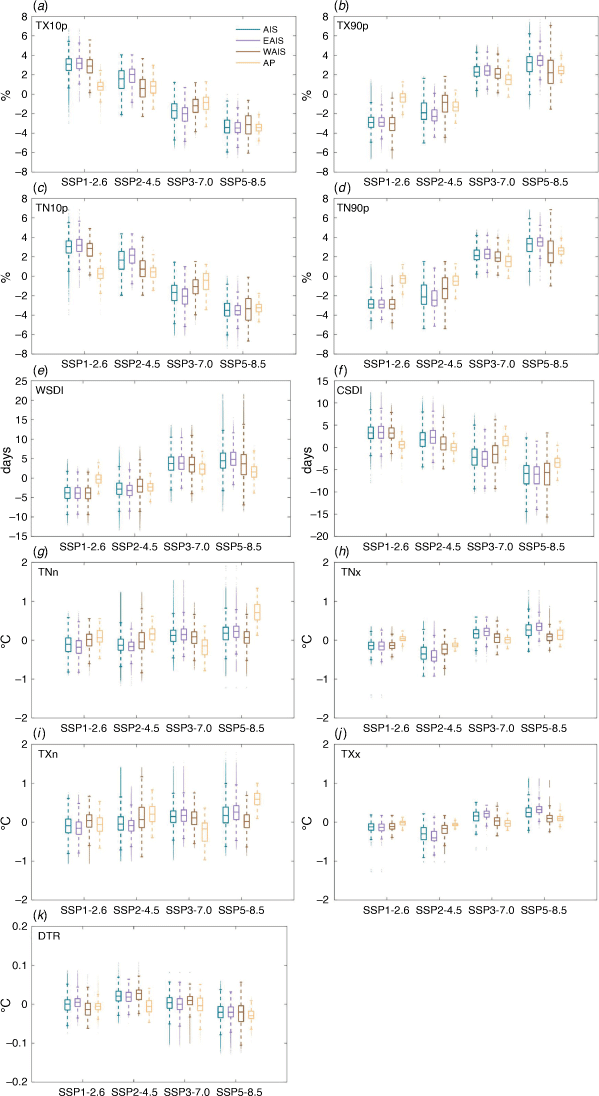
The differences in the temperature extreme indices averaged over the AIS and its sub regions between the two periods under different scenarios are shown in Fig. 6. For the percentile indices (TX10p, TN10p, TX90p and TN90p), obvious discrepancies occur in AIS, EAIS and WAIS among the different scenarios (Fig. 6a–d). However, the signal is missing for the AP between SSP1-2.6 and SSP2-4.5, indicating that the difference of percentile indices trends are similar under the two scenarios. In SSP3-7.0 and SSP5-8.5, the change of percentile indices are fast during 2071–2100 in general. In AIS and its sub regions, the stronger change in WSDI during 2071–2100 is certain in SSP3-7.0 and SSP5-8.5 (Fig. 6e). Similar characteristics are also found in CSDI; however, the decrease at the AP is slower in the later part of 21st century in SSP3-7.0 (Fig. 6f). The slower TNn and TXn warming occurs in the AIS and EAIS during 2071–2100 under SSP1-2.6 and SSP2-4.5, and stronger warming is evident at the AP in SSP5-8.5 (Fig. 6g, i). For TNx and TXx, the AIS and its sub regions show intense positive signals in 2021–2050 in SSP1-2.6 and SSP2-4.5, and the opposite phenomenon occurs in the other scenarios (Fig. 6h, j). In SSP5-8.5, the decrease of DTR is enhanced in the later part of the 21st century, which is contrary to the signal in other scenarios (Fig. 6k).
|
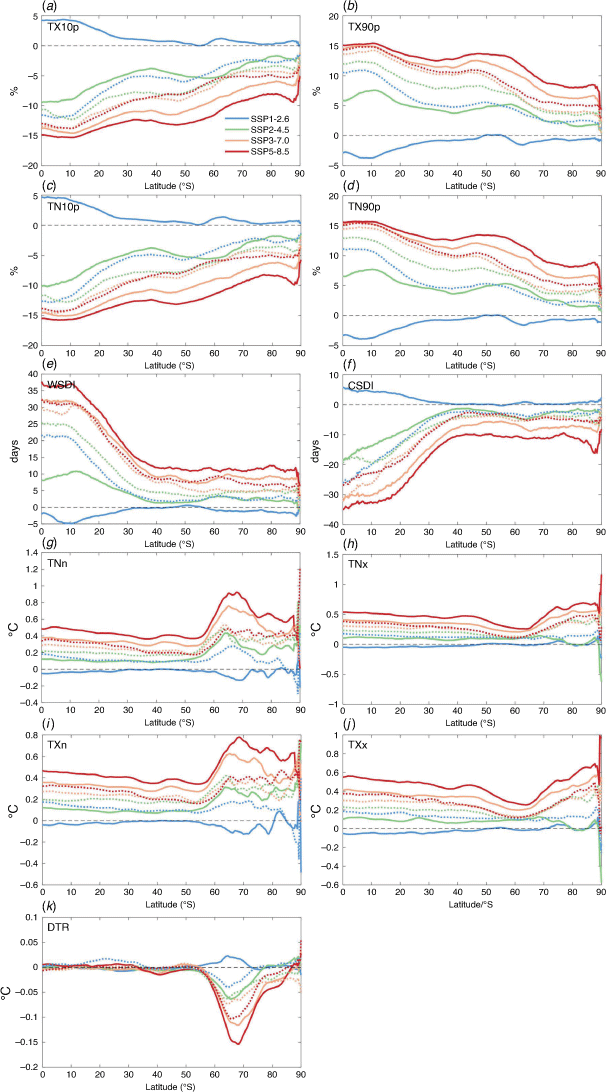
Fig. 7 displays the zonal mean in different latitudes during 2021–2050 and 2071–2100 under different scenarios. Generally, the zonal means of TX10p, TN10p, TX90p, TN90p, WSDI and CSDI decrease with latitude in the southern hemisphere (Fig. 7a–f), indicating that the amplification of these extreme indices is absent in the AIS. In SSP1-2.6, the variations in TNn, TNx, TXn, TXx and DTR with latitude are not obvious (Fig. 7g–k). For TNn and TXn, the zonal means at higher latitudes are greater than at lower latitudes, except under SSP1-2.6, and a mutation appears in the region within 55–65°S (Fig. 7g, i). In SSP3-7.0 and SSP5-8.5, slight amplification of TNx and TXx appears at latitudes that are approximately higher than 75°S (Fig. 7h, j). Clearly, the zonal mean of DTR exhibits a conspicuous decreasing trend for the latitudes of ~65–75°S (Fig. 7k), which obviously differs from that of the low latitudes.
|
4. Discussion and conclusions
In this study, changes in temperature extremes over the AIS and its sub regions based on the MMEM are studied for the periods 2021–2050 and 2071–2100 under SSP1-2.6, SSP2-4.5, SSP3-7.0 and SSP5-8.5. The change in the extreme indices generally represents the overall warming over the AIS, and the signal increases with increasing forcing. In SSP3-7.0 and SSP5-8.5, the cold indices tend to decrease and warm indices tend to increase in all cases. However, the opposite tendency of extreme indices except for TXn and DTR over the AIS is observed in the two periods in SSP1-2.6, which indicates that the warming over the AIS will not be sustained throughout the 21st century in this scenario. The change in temperature extremes exhibit regional differences. At the AP, DTR, TNn and TXn exhibit more rapid changes relative to the other regions. Under SSP5-8.5, the rapid changes of TX10p, TN10p, TX90p and TN90p always occur over the Antarctic inland. In 2021–2050, the strong TX90p and TN90p increasing signals also occur in WAIS, whereas these signals are absent during 2071–2100. For CSDI, the decrease is generally weak in the WAIS and AP. The warming of TNn and TXn accelerates in the later part of the century, and obvious warming appears at the Ross Ice Shelf and the AP. With the transantarctic mountains as demarcation lines, TNx and TXx perform the fast warming on the eastern side during 2071–2100. The DTR exhibits an obvious decrease at the Antarctic coast during 2021–2050, and proliferates to the interior area in 2071–2100, although a non-significant decrease always exists in the deep inland. In addition, the rapid DTR decrease in SSP5-8.5 dominates the Ross Ice Shelf, which indicates the strong warming of the minimum temperature, further indicating the increased risk of collapse. Generally, the amplification of TX10p, TN10p, TX90p, TN90p, WSDI and CSDI does not occur, and the amplification appears in other extreme indices under SSP3-7.0 and SSP5-8.5.
Temperature extremes are difficult to predict and, undoubtedly, the performance of CMIP6 models in simulating the temperature extremes is an important factor affecting the results, and cannot be ignored. Climate models in CMIP6 can capture the mean state and the main characteristics of temperature extremes in recent years, although discrepancies inevitably exist (IPCC 2021). Compared to the predecessor CMIP5, CMIP6 has a stronger ability to capture some basic processes in diurnal variability, whereas the effects of the improvement in future projections remain unclear (Di Luca et al. 2020; IPCC 2021). However, the warm bias exists in hot extremes and cold bias exists in cold extremes, especially the outstanding bias in cold extremes (Di Luca et al. 2020). In high latitude regions, the biases are more obvious (IPCC 2021), which influences our study. The capacity of the MMEM in representing temperature extremes is higher than that of any individual model (Kim et al. 2020), and here we use the MMEM to make the results as accurate as possible.
On the global and regional scales, the frequency of hot extremes increases and that of cold extremes decreases in general (IPCC 2021). Under SSP5-8.5, the surface air temperature over Antarctica will warm by ~5.0°C in the 21st century (Tewari et al. 2022), and the warming will increase the intensity and frequency of hot extremes. The warming events in summertime will be more continent-wide, more frequent and last longer, and the events will increase manyfold by the end of the century, especially over the EAIS (Feron et al. 2021). Over the AIS, EAIS, WAIS and AP, the change rates of the extreme indices during the present period 1980–2010 are generally lower than those under the scenarios of SSP2-4.5, SSP3-7.0 and SSP5-8.5 (Fig. 8). This picture reflects the accelerated change in Antarctic temperature relative to the present period. Under SSP1-2.6, the warming of TNn, TNx, TXn and TXx in AIS is approximately the same as or even slightly lower than that of the present period. By contrast, the rising rate of TNn, TNx, TXn and TXx under SSP5-8.5 is generally two to three times that during the period 1980–2010. Moreover, the decrease in TX10p, TN10p and CSDI and the increase in TX90p, TN90p and WSDI under SSP5-8.5 are five to ten times those in the present period. This result indicates that different forcings will have completely different impacts on Antarctica.
Compared to the Arctic, weaker polar amplification over the Antarctic is projected to occur by the end of the 21st century (IPCC 2021), and the amplification of annual extreme temperature also appears in AIS, particularly under SSP5-8.5. The human-induced greenhouse gas emissions contribute to the increased frequency and intensity of weather and climate extremes, especially for temperature extremes, and human-induced climate change is likely to affect the increased probability of compound extreme events (IPCC 2021). However, some studies suggest that the temperature changes of some areas in the AIS are primarily associated with the extreme natural internal variability of the regional atmospheric circulation (Turner et al. 2016). The changes in AIS near-surface air temperature are closely linked with the variability in the SAM, and the positive SAM trend concentrates to the inhomogeneous change over Antarctica (Gillett et al. 2006; Schneider et al. 2006; Marshall 2007). Modelling research suggests that the increase of SAM may be related to the greenhouse gas increases and decreasing stratospheric ozone caused by human influence (Shindell and Schmidt 2004; Cai and Cowan 2007), which indicates that the temperature change over the AIS is directly or indirectly affected by human factors to some extent. Moreover, the magnitude of the SAM-related circulation anomalies will intensify in the future, which may lead to the different interannual surface air temperature changes between the EAIS and the AP (Mao et al. 2021).
Compared to the mean temperature, the mechanism and leading driving factor may vary with different extreme indices, and changes in temperature extremes over the AIS are often associated with the variations of ENSO and the SAM (Marshall et al. 2006; Wei et al. 2019). The strong westerly winds, which enhance warm-air advection, are related to the extreme high temperatures at the eastern side of the AP (Orr et al. 2008; Turner et al. 2021). However, stronger westerlies reduce the poleward advection of heat towards the EAIS, which has influenced the cooling on the margins of the EAIS in recent years (Marshall et al. 2013; Clem et al. 2018), and may also be one of the causes of relatively slower changes in extreme temperatures in the future. At the eastern side of the Weddell Sea, the extensive sea ice limits the flux of heat and moisture from the ocean, and is one of the impact factors for the most conspicuous extreme low temperatures at the Neumayer station at the coast of the EAIS (Turner et al. 2021). An extreme high surface temperature of 9.3°C has occurred at Mawson, and studies have shown that the poleward warm advection, deep and strong coastal easterly winds, and westward advection of the warm pool contribute to the extreme warm event (Turner et al. 2022). On 6 February 2020, the extreme high temperature at Esperanza was related to the increased wind speeds and decreased atmospheric humidity, which provided conditions for the occurrence of the föhn event and caused substantial surface warming (Francelino et al. 2021). The Antarctic ozone hole may recover during the 21st century; however, an obvious increase in near-surface temperatures over the AIS will occur by the end of this century if greenhouse gas concentrations continue to rise (Bracegirdle et al. 2008), and the strong warming of extreme temperatures in the later part in 21st century under high forcing scenarios coincides with it. Here, we analyse the spatial distribution of temperature extremes in Antarctica and their variations under different scenarios in CMIP6. This will be conducive to a better understanding of Antarctica’s distinct climate, and the impact mechanism needs to be further explored in future studies.
Data availability
The data that support this study are available in https://esgf-node.llnl.gov/projects/cmip6/.
Conflicts of interest
The authors declare that they have no conflicts of interest.
Declaration of funding
This work was supported by the National Natural Science Foundation of China (41671073; 41476164).
References
Almazroui M, Saeed F, Saeed S, Ismail M, Ehsan MA, Islam MN, Abid MA, O’Brien E, Kamil S, Rashid IU, Nadeem I (2021) Projected changes in climate extremes using CMIP6 simulations over SREX regions. Earth Systems and Environment 5, 481–497.| Projected changes in climate extremes using CMIP6 simulations over SREX regions.Crossref | GoogleScholarGoogle Scholar |
Bracegirdle TJ, Connolley WM, Turner J (2008) Antarctic climate change over the twenty first century. Journal of Geophysical Research: Atmospheres 113, D03103
| Antarctic climate change over the twenty first century.Crossref | GoogleScholarGoogle Scholar |
Bracegirdle TJ, Krinner G, Tonelli M, Haumann FA, Naughten KA, Rackow T, Roach LA, Wainer I (2020) Twenty first century changes in Antarctic and Southern Ocean surface climate in CMIP6. Atmospheric Science Letters 21, e984
| Twenty first century changes in Antarctic and Southern Ocean surface climate in CMIP6.Crossref | GoogleScholarGoogle Scholar |
Bromwich DH, Nicolas JP, Monaghan AJ, Lazzara MA, Keller LM, Weidner GA, Wilson AB (2013) Central West Antarctica among the most rapidly warming regions on Earth. Nature Geoscience 6, 139–145.
| Central West Antarctica among the most rapidly warming regions on Earth.Crossref | GoogleScholarGoogle Scholar |
Bronselaer B, Winton M, Griffies SM, Hurlin WJ, Rodgers KB, Sergienko OV, Stouffer RJ, Russell JL (2018) Change in future climate due to Antarctic meltwater. Nature 564, 53–58.
| Change in future climate due to Antarctic meltwater.Crossref | GoogleScholarGoogle Scholar |
Cai W, Cowan T (2007) Trends in southern hemisphere circulation in IPCC AR4 models over 1950–99: ozone depletion versus greenhouse forcing. Journal of Climate 20, 681–693.
| Trends in southern hemisphere circulation in IPCC AR4 models over 1950–99: ozone depletion versus greenhouse forcing.Crossref | GoogleScholarGoogle Scholar |
Carrasco JF (2013) Decadal changes in the near-surface air temperature in the western side of the Antarctic Peninsula. Atmospheric and Climate Sciences 3, 275–281.
| Decadal changes in the near-surface air temperature in the western side of the Antarctic Peninsula.Crossref | GoogleScholarGoogle Scholar |
Chen HP, Sun JQ, Lin WQ, Xu HW (2020) Comparison of CMIP6 and CMIP5 models in simulating climate extremes. Science Bulletin 65, 1415–1418.
| Comparison of CMIP6 and CMIP5 models in simulating climate extremes.Crossref | GoogleScholarGoogle Scholar |
Clem KR, Renwick JA, McGregor J (2018) Autumn cooling of western East Antarctica linked to the Tropical Pacific. Journal of Geophysical Research: Atmospheres 123, 89–107.
| Autumn cooling of western East Antarctica linked to the Tropical Pacific.Crossref | GoogleScholarGoogle Scholar |
de la Mare WK (2009) Changes in Antarctic sea-ice extent from direct historical observations and whaling records. Climatic Change 92, 461–493.
| Changes in Antarctic sea-ice extent from direct historical observations and whaling records.Crossref | GoogleScholarGoogle Scholar |
Di Luca A, Pitman AJ, de Elía R (2020) Decomposing temperature extremes errors in CMIP5 and CMIP6 Models. Geophysical Research Letters 47, e2020GL088031
| Decomposing temperature extremes errors in CMIP5 and CMIP6 Models.Crossref | GoogleScholarGoogle Scholar |
Ding QQH, Steig EJ (2013) Temperature change on the Antarctic Peninsula linked to the Tropical Pacific. Journal of Climate 26, 7570–7585.
| Temperature change on the Antarctic Peninsula linked to the Tropical Pacific.Crossref | GoogleScholarGoogle Scholar |
Eyring V, Bony S, Meehl GA, Senior CA, Stevens B, Stouffer RJ, Taylor KE (2016) Overview of the Coupled Model Intercomparison Project Phase 6 (CMIP6) experimental design and organization. Geoscientific Model Development 9, 1937–1958.
| Overview of the Coupled Model Intercomparison Project Phase 6 (CMIP6) experimental design and organization.Crossref | GoogleScholarGoogle Scholar |
Feron S, Cordero RR, Damiani A, Malhotra A, Seckmeyer G, Llanillo P (2021) Warming events projected to become more frequent and last longer across Antarctica. Scientific Reports 11, 19564
| Warming events projected to become more frequent and last longer across Antarctica.Crossref | GoogleScholarGoogle Scholar |
Francelino MR, Schaefer C, Skansi MLM, Colwell S, Bromwich DH, Jones P, King JC, Lazzara MA, Renwick J, Solomon S, Brunet M, Cerveny RS (2021) WMO evaluation of two extreme high temperatures occurring in February 2020 for the Antarctic Peninsula region. Bulletin of the American Meteorological Society 102, E2053–E2061.
| WMO evaluation of two extreme high temperatures occurring in February 2020 for the Antarctic Peninsula region.Crossref | GoogleScholarGoogle Scholar |
Gillett NP, Kell TD, Jones PD (2006) Regional climate impacts of the Southern Annular Mode. Geophysical Research Letters 33, L23704
| Regional climate impacts of the Southern Annular Mode.Crossref | GoogleScholarGoogle Scholar |
IPCC (2021) ‘Climate Change 2021: The Physical Science Basis. Contribution of Working Group I to the Sixth Assessment Report of the Intergovernmental Panel on Climate Change’. (Eds V Masson-Delmotte, P Zhai, A Pirani, SL Connors, C Péan, S Berger, N Caud, Y Chen, L Goldfarb, MI Gomis, M Huang, K Leitzell, E Lonnoy, JBR Matthews, TK Maycock, T Waterfield, O Yelekçi, R Yu, B Zhou) (Cambridge University Press)
| Crossref |
Kaur R, Dutta HN, Deb NC, Gajananda K, Lagun VE (2013) Role of coreless winter in favoring survival of microorganisms over the schirmacher oasis, East Antarctica. Journal of Ecophysiology & Occupational Health 12, 12–20.
Kim Y-H, Min S-K, Zhang XB, Sillmann J, Sandstad M (2020) Evaluation of the CMIP6 multi-model ensemble for climate extreme indices. Weather And Climate Extremes 29, 100269
| Evaluation of the CMIP6 multi-model ensemble for climate extreme indices.Crossref | GoogleScholarGoogle Scholar |
Mao R, Kim S-J, Gong D-Y, Liu XH, Wen XY, Zhang LP, Tang F, Zong Q, Xiao CD, Ding MH, Park S-J (2021) Increasing difference in interannual summertime surface air temperature between interior East Antarctica and the Antarctic Peninsula under future climate scenarios. Geophysical Research Letters 48, e2020GL092031
| Increasing difference in interannual summertime surface air temperature between interior East Antarctica and the Antarctic Peninsula under future climate scenarios.Crossref | GoogleScholarGoogle Scholar |
Marshall GJ (2007) Half-century seasonal relationships between the Southern Annular Mode and Antarctic temperatures. International Journal of Climatology 27, 373–383.
| Half-century seasonal relationships between the Southern Annular Mode and Antarctic temperatures.Crossref | GoogleScholarGoogle Scholar |
Marshall GJ, Orr A, van Lipzig NPM, King JC (2006) The impact of a changing Southern Hemisphere Annular Mode on Antarctic Peninsula summer temperatures. Journal of Climate 19, 5388–5404.
| The impact of a changing Southern Hemisphere Annular Mode on Antarctic Peninsula summer temperatures.Crossref | GoogleScholarGoogle Scholar |
Marshall GJ, Orr A, Turner J (2013) A predominant reversal in the relationship between the SAM and East Antarctic temperatures during the twenty-first century. Journal of Climate 26, 5196–5204.
| A predominant reversal in the relationship between the SAM and East Antarctic temperatures during the twenty-first century.Crossref | GoogleScholarGoogle Scholar |
Monaghan AJ, Bromwich DH, Chapman W, Comiso JC (2008) Recent variability and trends of Antarctic near-surface temperature. Journal of Geophysical Research: Atmospheres 113, D04105
| Recent variability and trends of Antarctic near-surface temperature.Crossref | GoogleScholarGoogle Scholar |
Nicolas JP, Bromwich DH (2014) New reconstruction of Antarctic near-surface temperatures: multidecadal trends and reliability of global reanalyses. Journal of Climate 27, 8070–8093.
| New reconstruction of Antarctic near-surface temperatures: multidecadal trends and reliability of global reanalyses.Crossref | GoogleScholarGoogle Scholar |
O’Neill BC, Kriegler E, Riahi K, Ebi KL, Hallegatte S, Carter TR, Mathur R, van Vuuren DP (2014) A new scenario framework for climate change research: the concept of shared socioeconomic pathways. Climatic Change 122, 387–400.
| A new scenario framework for climate change research: the concept of shared socioeconomic pathways.Crossref | GoogleScholarGoogle Scholar |
Orr A, Marshall GJ, Hunt JCR, Sommeria J, Wang CG, van Lipzig NPM, Cresswell D, King JC (2008) Characteristics of summer airflow over the Antarctic Peninsula in response to recent strengthening of westerly circumpolar winds. Journal Of the Atmospheric Sciences 65, 1396–1413.
| Characteristics of summer airflow over the Antarctic Peninsula in response to recent strengthening of westerly circumpolar winds.Crossref | GoogleScholarGoogle Scholar |
Rignot E, Mouginot J, Scheuchl B, van den Broeke M, van Wessem MJ, Morlighem M (2019) Four decades of Antarctic Ice Sheet mass balance from 1979–2017. Proceedings of the National Academy of Sciences of the United States of America 116, 1095–1103.
| Four decades of Antarctic Ice Sheet mass balance from 1979–2017.Crossref | GoogleScholarGoogle Scholar |
Rintoul SR, Chown SL, DeConto RM, England MH, Fricker HA, Masson-Delmotte V, Naish TR, Siegert MJ, Xavier JC (2018) Choosing the future of Antarctica. Nature 558, 233–241.
| Choosing the future of Antarctica.Crossref | GoogleScholarGoogle Scholar |
Roussel ML, Lemonnier F, Genthon C, Krinner G (2020) Brief communication: evaluating Antarctic precipitation in ERA5 and CMIP6 against CloudSat observations. The Cryosphere 14, 2715–2727.
| Brief communication: evaluating Antarctic precipitation in ERA5 and CMIP6 against CloudSat observations.Crossref | GoogleScholarGoogle Scholar |
Sancho LG, Allan Green TG, Pintado A (2007) Slowest to fastest: extreme range in lichen growth rates supports their use as an indicator of climate change in Antarctica. Flora - Morphology, Distribution, Functional Ecology of Plants 202, 667–673.
| Slowest to fastest: extreme range in lichen growth rates supports their use as an indicator of climate change in Antarctica.Crossref | GoogleScholarGoogle Scholar |
Schneider DP, Steig EJ, van Ommen TD, Dixon DA, Mayewski PA, Jones JM, Bitz CM (2006) Antarctic temperatures over the past two centuries from ice cores. Geophysical Research Letters 33, L16707
| Antarctic temperatures over the past two centuries from ice cores.Crossref | GoogleScholarGoogle Scholar |
Schneider DP, Deser C, Okumura Y (2012) An assessment and interpretation of the observed warming of West Antarctica in the austral spring. Climate Dynamics 38, 323–347.
| An assessment and interpretation of the observed warming of West Antarctica in the austral spring.Crossref | GoogleScholarGoogle Scholar |
Shevenell AE, Ingalls AE, Domack EW, Kelly C (2011) Holocene Southern Ocean surface temperature variability west of the Antarctic Peninsula. Nature 470, 250–254.
| Holocene Southern Ocean surface temperature variability west of the Antarctic Peninsula.Crossref | GoogleScholarGoogle Scholar |
Shindell DT, Schmidt GA (2004) Southern Hemisphere climate response to ozone changes and greenhouse gas increases. Geophysical Research Letters 31, L18209
| Southern Hemisphere climate response to ozone changes and greenhouse gas increases.Crossref | GoogleScholarGoogle Scholar |
Smith KL, Polvani LM (2017) Spatial patterns of recent Antarctic surface temperature trends and the importance of natural variability: lessons from multiple reconstructions and the CMIP5 models. Climate Dynamics 48, 2653–2670.
| Spatial patterns of recent Antarctic surface temperature trends and the importance of natural variability: lessons from multiple reconstructions and the CMIP5 models.Crossref | GoogleScholarGoogle Scholar |
Stammerjohn SE, Martinson DG, Smith RC, Yuan X, Rind D (2008) Trends in Antarctic annual sea ice retreat and advance and their relation to El Niño–Southern Oscillation and Southern Annular Mode variability. Journal of Geophysical Research: Oceans 113, C03S90
| Trends in Antarctic annual sea ice retreat and advance and their relation to El Niño–Southern Oscillation and Southern Annular Mode variability.Crossref | GoogleScholarGoogle Scholar |
Su FG, Duan XL, Chen DL, Hao ZC, Cuo L (2013) Evaluation of the global climate models in the CMIP5 over the Tibetan Plateau. Journal of Climate 26, 3187–3208.
| Evaluation of the global climate models in the CMIP5 over the Tibetan Plateau.Crossref | GoogleScholarGoogle Scholar |
Taylor KE, Stouffer RJ, Meehl GA (2012) An overview of CMIP5 and the experiment design. Bulletin of the American Meteorological Society 93, 485–498.
| An overview of CMIP5 and the experiment design.Crossref | GoogleScholarGoogle Scholar |
Tewari K, Mishra SK, Salunke P, Dewan A (2022) Future projections of temperature and precipitation for Antarctica. Environmental Research Letters 17, 014029
| Future projections of temperature and precipitation for Antarctica.Crossref | GoogleScholarGoogle Scholar |
Trusel LD, Frey KE, Das SB, Karnauskas KB, Munneke PPK, van Meijgaard E, van den Broeke MR (2015) Divergent trajectories of Antarctic surface melt under two twenty-first-century climate scenarios. Nature Geoscience 8, 927–932.
| Divergent trajectories of Antarctic surface melt under two twenty-first-century climate scenarios.Crossref | GoogleScholarGoogle Scholar |
Turner J, Colwell SR, Marshall GJ, Lachlan-Cope TA, Carleton AM, Jones PD, Lagun V, Reid PA, Iagovkina S (2005) Antarctic climate change during the last 50 years. International Journal of Climatology 25, 279–294.
| Antarctic climate change during the last 50 years.Crossref | GoogleScholarGoogle Scholar |
Turner J, Maksym T, Phillips T, Marshall GJ, Meredith MP (2013) The impact of changes in sea ice advance on the large winter warming on the western Antarctic Peninsula. International Journal of Climatology 33, 852–861.
| The impact of changes in sea ice advance on the large winter warming on the western Antarctic Peninsula.Crossref | GoogleScholarGoogle Scholar |
Turner J, Lu H, White I, King JC, Phillips T, Hosking JS, Bracegirdle TJ, Marshall GJ, Mulvaney R, Deb P (2016) Absence of 21st century warming on Antarctic Peninsula consistent with natural variability. Nature 535, 411–415.
| Absence of 21st century warming on Antarctic Peninsula consistent with natural variability.Crossref | GoogleScholarGoogle Scholar |
Turner J, Lu H, King J, Marshall GJ, Phillips T, Bannister D, Colwell S (2021) Extreme temperatures in the Antarctic. Journal of Climate 34, 2653–2668.
| Extreme temperatures in the Antarctic.Crossref | GoogleScholarGoogle Scholar |
Turner J, Lu H, King JC, Carpentier S, Lazzara M, Phillips T, Wille J (2022) An extreme high temperature event in coastal East Antarctica associated with an atmospheric river and record summer downslope winds. Geophysical Research Letters 49, e2021GL097108
| An extreme high temperature event in coastal East Antarctica associated with an atmospheric river and record summer downslope winds.Crossref | GoogleScholarGoogle Scholar |
Wei T, Yan Q, Ding MH (2019) Distribution and temporal trends of temperature extremes over Antarctica. Environmental Research Letters 14, 084040
| Distribution and temporal trends of temperature extremes over Antarctica.Crossref | GoogleScholarGoogle Scholar |
Zhang GW, Zeng G, Yang XY, Jiang ZH (2021) Future changes in extreme high temperature over China at 1.5°C–5°C global warming based on CMIP6 simulations. Advances in Atmospheric Sciences 38, 253–267.
| Future changes in extreme high temperature over China at 1.5°C–5°C global warming based on CMIP6 simulations.Crossref | GoogleScholarGoogle Scholar |
Zhao YM, Qian C, Zhang WJ, He D, Qi YJ (2021) Extreme temperature indices in Eurasia in a CMIP6 multi-model ensemble: evaluation and projection. International Journal of Climatology 41, 5368–5385.
| Extreme temperature indices in Eurasia in a CMIP6 multi-model ensemble: evaluation and projection.Crossref | GoogleScholarGoogle Scholar |
Zhu JP, Xie AH, Qin X, Wang YT, Xu B, Wang YC (2021) An assessment of ERA5 reanalysis for Antarctic near-surface air temperature. Atmosphere 12, 217
| An assessment of ERA5 reanalysis for Antarctic near-surface air temperature.Crossref | GoogleScholarGoogle Scholar |


