Interpretation of magnetic anomalies using some simple characteristic positions over tabular bodies
M. Subrahmanyam 1 2 T. K. S. Prakasa Rao 11 Department of Geophysics, Andhra University, Visakhapatnam-530003, India.
2 Corresponding author. Email: smangalampalli@rediffmail.com
Exploration Geophysics 40(3) 265-276 https://doi.org/10.1071/EG09005
Submitted: 31 January 2009 Accepted: 18 August 2009 Published: 21 September 2009
Abstract
The quantitative interpretation of magnetic anomalies aims at finding out the location, depth, dip, size, and susceptibility contrast of causative geological sources. In this paper an easy method of interpreting magnetic anomalies over simple geometric shapes of dyke, sheet and vertical step has been proposed by using the easily recognisable characteristic positions on the magnetic anomaly profiles. The method does not require prior knowledge of origin and datum. For determining the source parameters, mathematical expressions and graphical procedure are given.
Key words: characteristic positions, depth, dyke, origin, sheet, step.
Acknowledgement
The authors are thankful to the reviewers for their critical analysis of the work particularly to Dr Amanda Buckingham for patiently correcting and suggesting some points.
Åm, K., 1972, The arbitrarily magnetized dike; Interpretation by characteristics: Geoexploration 10, 63–90.
| Crossref | GoogleScholarGoogle Scholar |
Cook, K. L., 1959, Quantitative interpretation of vertical magnetic anomalies over veins: Geophysics 15, 667–686.
| Crossref | GoogleScholarGoogle Scholar |
Green, R., 1979, The harmonic method of inverting a magnetic profile over a contact: Geoexploration 17, 261–268.
| Crossref | GoogleScholarGoogle Scholar |
Hood, P., 1965, Gradient measurements in aeromagnetic surveying: Geophysics 30, 891–902.
| Crossref | GoogleScholarGoogle Scholar |
Koulomzine, Th., Lamontagne, Y., and Nadeau, A., 1970, New methods for the direct interpretation of magnetic anomalies caused by inclined dikes of infinite length: Geophysics 35, 812–830.
| Crossref | GoogleScholarGoogle Scholar |
Rao, P. T. K. S., 1988, Interpretation of magnetic gradient anomalies using characteristic positions of equi-angular separation. Geological contact and vein: Geoexploration 25, 199–209.
| Crossref | GoogleScholarGoogle Scholar |
Reford, M. S., 1964, Magnetic anomalies over thin sheets: Geophysics 29, 532–536.
| Crossref | GoogleScholarGoogle Scholar |
Appendix Notation followed in the paper
ΔF — magnetic anomaly. (ΔT — total component and ΔV — vertical component anomalies)
CF — Amplitude coefficient.
θ F — Index parameter.
T — Total intensity of the earth’s main magnetic field.
K — Susceptibility contrast.
B0′ = B0 (1 – cos2 IT sin2 AT)1/2. It is the component of the Earth’s normal flux density, B0, in the plane of the profile.
IT — inclination of the Earth’s magnetic field.
AT — declination of the Earth’s magnetic field from x-axis.
i — inclination of the resultant magnetization.
a — declination of the resultant magnetization from x-axis.
I — resolved direction of the induced component of magnetization in the xz plane.
Y — resolved direction of the resultant (remanence and induction) component of magnetization in the xz plane.
tan I = tan IT/cos AT.
tan Y = tan i/cos a.
α — strike of the body.
X — distance of the point of observation from the origin.
h — depth to the top of dyke, sheet, fault or contact.
H — depth to the bottom of the fault.
2w — width of the dyke.
t — thickness of sheet/thin plate.
δ — geological dip.
Dyke
Magnetic expression for the dyke is given by

where

and


and

Thin sheet
Magnetic expression for the sheet is given by

where

and

Vertical step
Magnetic expression for the vertical step is given by

where

and


|
Interpretation of overlapping anomalies by this method
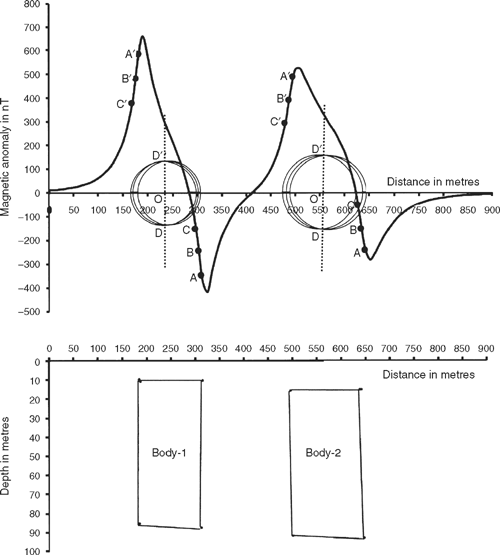
The method discussed in the present paper has been developed for interpreting the magnetic anomalies over single and simple tabular geometries. When the interpretation method is applied over a magnetic profile of overlapping anomalies (anomalies over two or more than two bodies), there may be a small amount of error in the determination of origin and datum. To show the effect of the interpretation technique, Synthetic anomalies over two (2.5 dimensional) bodies separated by 200 m were considered. On applying the geometric procedure for determining the origin and datum over the two bodies, the error percentage was found to be small. For computing the error percentage in datum, the peak to peak amplitude was used. The synthetic profile over two bodies and the interpretation is shown in Figure 10. The interpreted results along with actual values and per cent errors are given in the Table A2.

|

|

