

Agronomic performance, herbage quality, methane yield and methane emission potential of pasture mixtures
Guangdi D. Li A * , Matthew T. Newell B , Suzanne P. Boschma C , Richard Meyer A , Jennifer A. Wood C , Warwick B. Badgery D and Richard C. Hayes A
A
B
C
D
Abstract
Enteric methane (CH4) emission from livestock accounts for 71% of greenhouse gas emissions from Australian agriculture.
To evaluate a range of pasture mixtures by using species with anti-methanogenic properties for their compatibility, productivity, feed quality and CH4 emission reduction potential.
Two field experiments were conducted at Wagga Wagga and Cowra, New South Wales, Australia, from 2022 to 2024. In total, 33 pasture mixtures were evaluated over 3 years. Herbage was taken in spring from each pasture mix to analyse mineral composition, feed quality, plant secondary compounds and CH4 yield from in vitro fermentation.
Methane yield was negatively correlated with saponins and condensed tannins. Perennial herbs, particularly plantain, had higher concentrations of condensed tannins and saponins than perennial grasses, at both sites. Overall, balansa clover was the species with the highest concentration of condensed tannins and biserrula had the highest concentration of saponins. However, plantain and biserrula lacked persistence at both sites. Chicory-based pastures were highly productive with high feed quality.
Pasture species higher in saponins and condensed tannins have great potential to reduce enteric CH4 emissions. Pasture mixtures containing plantain and/or biserrula exhibited potential to reduce CH4 emissions, but poor persistence may limit their adoption in some environments.
The study provided evidence that a number of highly productive pasture mixtures have potential to reduce CH4 emission intensity and can be deployed within extensive livestock grazing systems, allowing producers opportunity to decrease their greenhouse gas liability in emission reduction schemes.
Keywords: biserrula, chicory, condensed tannins, forage quality, mineral composition, plant secondary compounds, plantain, saponins.
Introduction
Enteric methane (CH4) from ruminant livestock accounts for 30% of global anthropogenic CH4 emissions (UNEP 2021). In Australia, enteric CH4 emissions from livestock are the single largest contributor of greenhouse gas (GHG) emissions in agriculture, accounting for 71% of total agricultural emissions, equating to 55 million Mg Mt of carbon dioxide equivalent (CO2-e) emitted annually (DCCEEW 2021). Because Australia is a signatory to the Paris Agreement (UNFCCC 2016), there is a pressing need for our livestock industries to reduce these hard-to-abate emissions to play their part in meeting the Nation’s goals.
Extensive research has been conducted to understand CH4 production in the rumen and develop strategies that can mitigate enteric CH4 emissions in livestock. Abatement strategies fall into the following four main categories: intensification to increase animal productivity, genetically low-CH4-producing animals, feed adjustment using supplements or additives that directly reduce CH4 production in the rumen, and introduction of pasture species with anti-methanogenic properties (Baker et al. 2004; Beauchemin et al. 2022; Marshall et al. 2022). Many of the strategies developed are well suited to intensive livestock industries such as dairy and feedlots; however, few are effective in extensive grazing systems. In Australia, over 95% of both the beef herd and sheep flock graze pastures (MLA (Meat & Livestock Australia) 2022), covering an area of approximately 416 million hectares (ACLUMP 2016). Deploying strategies such as supplements and additives for livestock in extensive grazing systems is inefficient and costly, leading to inconsistent animal intake (Raynor et al. 2024). Alternatively, a feed-base that contains species with traits that can reduce CH4 could be a cost-effective strategy to mitigate enteric emissions in extensive grazing systems (Eugène et al. 2021). Species may include legumes and grasses that contain low quantities of fibre, or that contain plant secondary compounds (PSCs) such as tannins, phenolics and saponins (Beauchemin et al. 2008; Grainger et al. 2009; Eckard et al. 2010; Banik et al. 2013a; Mueller-Harvey et al. 2019).
Plant secondary compounds, once considered to be antinutritional factors, are now widely recognised for their roles in both plant defence and as bio-actives for livestock health and productivity (Makkar 1993; Muzquiz and Wood 2007; Rochfort et al. 2008; Salem et al. 2012). Some PSCs may put livestock at risk of feed intake reduction, altered metabolic processes and potential toxicity. However, livestock grazing on PSC-containing plants may benefit from antioxidant properties, antibacterial, antiviral, fungicidal, helminthiasis protection, enhanced immune function, and even anticancer activities (He 2022). Most of the literature has focused on phenolics and terpenes, particularly tannins and saponins, for enteric CH4 reduction (Almeida et al. 2021; Verma et al. 2022; Pepeta et al. 2024).
Tannins are a diverse group of PSCs that interact with ruminal nitrogen (N) and fibre fermentation (Min et al. 2003; Carulla et al. 2005). Both condensed and hydrolysable tannins have the ability to reduce enteric CH4 emissions because of their ability to bind proteins within the rumen (McSweeney et al. 2001; Min et al. 2003; Badgery et al. 2023). Condensed tannins can also bind carbohydrates, so they can retard protein digestibility and ruminal fermentation, leading to an indirect lowering of CH4 emissions. Hydrolysable tannins appear to reduce CH4 production directly by interfering with rumen microbiota. Flavonoids have also been implicated in rumen microbe suppression, leading to CH4 reductions (Oskoueian et al. 2013).
Saponins can suppress dihydrogen-producing rumen protozoa, essential for the production of CH4 (Wallace 2004). Saponins reduce enteric CH4 emissions primarily through the inhibition of protozoal activity in the rumen in a dose-dependent manner (Patra and Saxena 2009). Because protozoa produce the hydrogen necessary for archaea to produce CH4, their demise leads to lower enteric CH4 production. However, the impact of saponins on other rumen microorganisms, such as bacteria, fungi, and archaea, remains less well understood. Both triterpenoid and steroid saponins cause suppression or elimination of ruminal ciliate protozoal populations (Francis et al. 2021). However, the extent of this inhibition varies among different protozoal species and is influenced by diet composition (Patra and Saxena 2009).
A range of pasture species have been identified that contain PSCs. Those include perennial herbs, such as chicory (Cichorium intybus) and plantain (Plantago lanceolata), along with a range of annual legumes species, such as biserrula (Biserrula pelecinus), French serradella (Ornithopus sativus), and yellow serradella (O. compressus) (Banik et al. 2013a, 2013b; Durmic et al. 2016; Badgery et al. 2023).
Livestock grazing mixed species pastures are generally reported to have lower CH4 emissions (Thomas et al. 2012; Dal Pizzol et al. 2017; Carmona-Flores et al. 2020; Wilson et al. 2020). Pasture mixtures, especially those including a perennial species, provide multiple benefits for livestock production and the environment. These benefits include a varied diet for livestock to better meet their needs (Provenza et al. 2003; Masters 2018), species with different growth patterns, which can extend the period of quality forage available to livestock (Muir et al. 2020), different root structures to access water and nutrients from different areas of the soil profile (Hayes et al. 2010b) and to address soil constraints (Li et al. 2008).
The aim of this study was to evaluate a range of pasture mixtures for their agronomic compatibility, herbage productivity and feed quality, and CH4 emission reduction potential. It was hypothesised that (a) pasture species enriched in condensed tannins and/or saponins would offer potential to reduce enteric CH4 emissions per unit of dry matter (DM), and (b) locally adapted pasture mixtures with anti-methanogenic properties would improve the quality of pastures, offering potential to reduce CH4 emissions from ruminant livestock. Identifying productive high-quality mixtures with anti-methanogenic properties is a step closer to realising reduced CH4 emissions from livestock in extensive grazing systems.
Materials and methods
Site description
Two field experiments were conducted, one at Wagga Wagga (35°01′45″S, 147°20′36″E; 210 m elevation) and the other at Cowra (33°47′54″S, 148°41′23″E; 381 m elevation), New South Wales (NSW) Australia. The soil is a red Kandosol at Wagga Wagga and red Chromosol at Cowra (Isbell and National Committee on Soil and Terrain 2021). At Wagga Wagga, the site has been cropped since 2012, with a preceding crop of barley in 2021. Similarly, the experimental site at Cowra had been in a cereal cropping rotation for 5 years and lime (1.8 t ha−1) was applied and incorporated by cultivating with a scarifier on the 31 March 2022. Rainfall data were accessed from the Bureau of Meteorology at https://www.longpaddock.qld.gov.au/silo/point-data at the Wagga Wagga Airport (18 km from the experimental site) and the Cowra Research Station (3 km from the experimental site).
Experimental design
Both experiments were designed using the nearest-neighbour spatial design program, DiGGer, developed by Coombes (2002). Twenty-four pasture mixtures were evaluated at each site, replicated three times. All pastures were binary mixes consisting of one perennial herb or grass species and one legume species, with lucerne as a control (Table 1). The cultivars were chosen on the basis of their adaptation to the local environment. There were 33 pasture mixtures in total and 15 pasture mixtures in common across the two sites (Table 1).
| ID | Pasture mix | Wagga Wagga | Cowra | |||
|---|---|---|---|---|---|---|
| Herb/grass | Legume | Herb/grass | Legume | |||
| 1 | Chicory–arrowleaf clover | Puna II (3) | Zulu II (3) | – | – | |
| 2 | Chicory–balansa clover | – | – | Grasslands Puna (4) | Bolta (2) | |
| 3 | Chicory–biserrula | Puna II (3) | Casbah (2) | Grasslands Puna (4) | Casbah (2) | |
| 4 | Chicory–subterranean clover | Puna II (3) | Coolamon (6) | Grasslands Puna (4) | Seaton Park (6) | |
| 5 | Chicory–French serradella | Puna II (3) | Margurita (5) | Grasslands Puna (4) | Margurita (5) | |
| 6 | Chicory–yellow serradella | Puna II (3) | Avila (5) | Grasslands Puna (4) | Avila (5) | |
| 7 | Chicory–lucerne | Puna II (3) | Aurora (2) | Grasslands Puna (4) | Titan 9 (2) | |
| 8 | Plantain–arrowleaf clover | Ecotain (4) | Zulu II (3) | – | – | |
| 9 | Plantain–balansa clover | – | – | Grasslands Lancelot (4) | Bolta (2) | |
| 10 | Plantain–biserrula | Ecotain (4) | Casbah (2) | Grasslands Lancelot (4) | Casbah (2) | |
| 11 | Plantain–subterranean clover | Ecotain (4) | Coolamon (6) | Grasslands Lancelot (4) | Seaton Park (6) | |
| 12 | Plantain–French serradella | Ecotain (4) | Margurita (5) | Grasslands Lancelot (4) | Margurita (5) | |
| 13 | Plantain–yellow serradella | Ecotain (4) | Avila (5) | Grasslands Lancelot (4) | Avila (5) | |
| 14 | Plantain–lucerne | Ecotain (4) | Aurora (2) | Grasslands Lancelot (4) | Titan 9 (2) | |
| 15 | Phalaris–arrowleaf clover | Holdfast (3) | Zulu II (3) | – | – | |
| 16 | Phalaris–balansa clover | – | – | Holdfast GT (3) | Bolta (2) | |
| 17 | Phalaris–biserrula | Holdfast (3) | Casbah (2) | Holdfast GT (3) | Casbah (2) | |
| 18 | Phalaris–subterranean clover | Holdfast (3) | Coolamon (6) | Holdfast GT (3) | Seaton Park (6) | |
| 19 | Phalaris–French serradella | Holdfast (3) | Margurita (5) | Holdfast GT (3) | Margurita (5) | |
| 20 | Phalaris–yellow serradella | Holdfast (3) | Avila (5) | Holdfast GT (3) | Avila (5) | |
| 21 | Phalaris–lucerne | Holdfast (3) | Aurora (2) | Holdfast GT (3) | Titan 9 (2) | |
| 22 | Cocksfoot–arrowleaf clover | Uplands (3) | Zulu II (3) | – | – | |
| 23 | Cocksfoot–biserrula | Uplands (3) | Casbah (2) | – | – | |
| 24 | Cocksfoot–subterranean clover | Uplands (3) | Coolamon (6) | – | – | |
| 25 | Cocksfoot–French serradella | Uplands (3) | Margurita (5) | – | – | |
| 26 | Cocksfoot–yellow serradella | Uplands (3) | Avila (5) | – | – | |
| 27 | Cocksfoot–lucerne | Uplands (3) | Aurora (2) | – | – | |
| 28 | Tall fescue–balansa clover | – | – | Temora (6) | Bolta (2) | |
| 29 | Tall fescue–biserrula | – | – | Temora (6) | Casbah (2) | |
| 30 | Tall fescue–subterranean clover | – | – | Temora (6) | Seaton Park (6) | |
| 31 | Tall fescue–French serradella | – | – | Temora (6) | Margurita (5) | |
| 32 | Tall fescue–yellow serradella | – | – | Temora (6) | Avila (5) | |
| 33 | Tall fescue–lucerne | – | – | Temora (6) | Titan 9 (2) | |
ID refers to pasture mix formulated despite different cultivars being chosen at each site for better adaptation. The pasture mix ID is identical throughout all tables and figures.
–, species not sown at that site.
Herb/grass, perennial herb or perennial grasses.
Pastures were direct drilled at 10–20 mm depth by using a cone-seeder with 10 tynes at 0.18 m row spacing, at Wagga Wagga on 10 May 2022 and Cowra on 20 May 2022. Seeds of the two species were pre-mixed and sown into each drill row. All legume seeds were inoculated with recommended rhizobia. Plot size was 1.8 m × 10 m, with a 0.40 m buffer between plots and 2.0 m between blocks at Wagga Wagga, and 1.8 m × 7.5 m with a 0.5 m buffer between plots and 2.0 m between blocks at Cowra. A starter fertiliser comprising 15 kg phosphorus (P) ha−1, 18.7 kg sulfur (S) ha−1 and 5 kg N ha−1 was applied at sowing. In Years 2 and 3, a superphosphate fertiliser was top-dressed at 15 kg P ha−1 and 18.7 kg S ha−1 in autumn. The starter and maintenance fertilisers were applied to ensure that pasture growth was not limited by nutrient deficiency (Peverill et al. 1999).
Field measurements
Seedling density of each species was counted at three random locations per plot by using a quad of 1.0 m × 0.36 m ~6–10 weeks after sowing. The average of all counts within a plot was converted into plants per square metre.
Seedling numbers of annual legumes were assessed approximately 4–6 weeks after significant rainfall at the break of season in autumn in Years 2 and 3, by using a 1.0 m × 1.0 m quadrat placed at two random locations within each plot, divided into 0.1 m × 0.1 m cells. The number of annual legume seedlings were counted in 10 cells across one diagonal transect of the quadrat, then converted to plants per square metre.
Basal frequency was used to assess relative density of perennial species over time, because of the uncertainty of reliably distinguishing individual plants (Lodge and Gleeson 1984; Hayes et al. 2021). Basal frequency was the number of cells (0.1 m × 0.1 m) with the presence of crown or stem base of perennial species in a 1.0 m × 1.0 m quadrat (100 cells in total), expressed as percentage. The quadrat was aligned at 45 degrees off the original drill rows at two fixed locations. Basal frequency was monitored in late winter–early spring in Year 1, then early autumn in Years 2 and 3.
Herbage DM production was visually scored at the end of each season (i.e. 3-month intervals), with an additional measurement in mid-spring. Scores were given for each of three equal sections per plot (Boschma et al. 2011). The visual scores were calibrated by cutting 10 quadrats (0.25 m × 0.25 m) to 10 mm to capture the full range of visual scores at each sampling time at each location. The herbage mass from calibration cut was dried at 60°C for 48 h and weighed. Visual scores were then converted to kg DM ha−1 by using a regression function between visual scores and the calibrated DM sample at each sampling time at each location. After each herbage DM assessment, all plant materials were removed by mowing to a height of 50–100 mm, except in spring of the establishment year, where mowing was delayed until late spring to allow annual legume species to set seed. Pasture botanical composition was assessed at the same time when DM was measured, by using the dry-weight-rank method (’t Mannetje and Haydock 1963), a non-destructive method that has been shown to provide an accurate estimate of the botanical composition of pastures.
Laboratory measurements
Two sets of grab samples (500–800 g fresh herbage) were taken in spring each year by cutting herbage at 20 mm in height at 10 random locations. One set of grab samples was taken for each species within each plot for all pasture mixtures, oven-dried at 60°C, with 144 samples in total. Another set was for key species in selected pasture mixtures, freeze-dried at −50°C. The selection criteria was all legume species (six species) mixed with chicory, and all herb/grass (four species) mixed with biserrula within all three replicates, with 30 samples in total. Both oven- and freeze-dried plant samples were ground to pass a 1-mm sieve and kept airtight in the dark.
Extra care was taken with the freeze-dried samples at sampling, i.e. not to crush or fold, but to circle the plant materials into ‘wreaths’ within airtight ziplock plastic bags to minimise damage to plant stems. Samples were then placed on ice in the dark for immediate transportation to the laboratory prior to drying. The samples were frozen at −20°C, cut with a Robotcoupe chopper, kept in −20°C storage, then freeze-dried at −50°C, and kept airtight in the dark.
A subsample of the oven-dried plant samples was analysed for full mineral composition by using closed vessel microwave nitric acid and hydrogen peroxide digestion (Kalra 1998) and processed using inductively coupled plasma–optical emission spectroscopy (ICP–OES) (Agilent 5110, ICP–OES). Chloride (Cl) was extracted in 1:125 water solution by using the ferricyanide method (Kalra 1998) on a flow injection analyser (QuikChem 8000, Lachat) at the NSW Department Primary Industries and Regional Development (NSW DPIRD) AgEnviro Laboratory, Wollongbar, NSW, Australia (ISO 17025 accredited; NATA 2024). The macro-elements analysed were calcium (Ca), potassium (K), magnesium (Mg), sodium (Na), P, S and Cl, and the micro-elements analysed were copper (Cu), iron (Fe), manganese (Mn), zinc (Zn), aluminium (Al) and boron (B).
Mineral ratios were calculated and compared with established animal health thresholds. The Ca:P ratio was calculated directly from the concentrations of the respective elements. All other ratios and indices were determined by converting concentrations of each element into milliequivalents (meq) by using their molecular weight. The K:(Na + Mg) ratio was calculated using the formula: (K / 0.039) / [(Na / 0.023) + (Mg / 0.012)] (Dove et al. 2016). The tetany index was calculated using the formula: (K / 0.039) / [(Mg / 0.012) + (Ca / 0.02)] (Kemp and ’t Hart 1957) and the dietary cation anion difference (DCAD) was calculated using the formula: (Na / 0.023 + K / 0.039) − (Cl / 0.0355 + S / 0.016), expressed as meq 100 g−1 (Takagi and Block 1991).
A subsample of the oven-dried plant samples was used to measure crude protein (CP), acid detergent fibre (ADF), neutral detergent fibre (NDF), organic matter (OM), DM digestibility (DMD), digestibility of the organic matter in the DM (DOMD), water-soluble carbohydrate (WSC) and ash content by using near-infrared spectrophotometry (NIR) at the NSW DPIRD Feed Quality Laboratory, Wagga Wagga, NSW, Australia (ISO 17025 accredited; NATA 2024). A subset of random samples (representing 10% of the total samples) was analysed using conventional wet chemistry methods to confirm the estimated values from the NIR calibration (AFIA 2014). Metabolisable energy (ME) was calculated according to method 2.2R (AFIA 2014) from DOMD by using the equation ME = 0.203 × DOMD − 3.001.
A subsample of the freeze-dried plant samples for individual species was fermented with rumen fluid and an artificial saliva solution (Goering and Van Soest 1970) using Ankom Gas Production™ system modules. Briefly, on the first day of fermentation, rumen fluid was collected from three fistulated cattle that were fed on a standard diet consisting of lucerne (Medicago sativa) and oat (Avena sativa) chaff cubes. The rumen fluid was filtered through cheesecloth to remove particulate matter, and added to a buffered mixture of macro- and micro-nutrients and an oxygen-reducing agent (Goering and Van Soest 1970). A volume of 120 mL of warmed solution and 1.0 g of plant sample were added to a fermentation jar, purged with nitrogen to remove oxygen, sealed and incubated at 39°C for 48 h. Gas production was recorded over 48 h by using integrated electronic transducers, with gas samples taken for analysis after 48 h. Total gas volumes were quantified using the cumulative pressure values obtained from the Ankom RF Gas Production Software (Ver. 15.0, see https://www.ankom.com/product-catalog/ankom-rf-gas-production-system). At the completion of the fermentation, the gas sample was collected by inserting a syringe through a rubber septum in a sampling port located on the side of each respective fermentation jar, withdrawing 20 mL and then transferring this gas to a pre-evacuated 12 mL Labco Exetainer® glass vial. Gas samples were analysed for CH4, CO2, N2 and O2 within a period of 7 days, and typically within 2 days following the end of the incubation, on an SRI 8610 MG#5 gas chromatograph fitted with thermo-conductivity detector and using a 2 m Hayesep D column, and a 1.5 m 5A molecular sieve column (SRI Instruments, CA, USA) running high-purity helium as the carrier gas. Samples of three standard species, including biserrula, white clover (Trifolium repens) and sudan grass (Sorghum × drummondii), were analysed with each batch. Gas yield was corrected for a batch blank average, which was the amount of gas produced with the rumen fluid/artificial saliva mix incubated in the same batch. The CH4 yield was measured as millilitres per gram of DM at standard temperature and pressure.
The CH4 yield (mL g−1 DM) for each pasture mixture was calculated using the weighted average of each pasture component based on the DM ratio of the given mixture. The predicted CH4 emission (Mg CO2-e ha−1) from each plot was calculated using weighted average of CH4 yield for the given mixture multiplied by its herbage DM consumed (Mg ha−1) with 60% utilisation rate at the time of sampling. The cumulative CH4 emission was the sum of CH4 emission from each measurement over 3 years. These calculations assumed that there were no interactions between plant secondary compounds when two species are mixed. As such, it is recognised that calculated values are theoretical and would require validation under grazing conditions. Nevertheless, the calculated values provide a robust means to compare the relative emission potential of different pastures.
A subsample of the freeze-dried plant samples was used to perform assays for total phenols, non-tannin phenols, total tannins, condensed tannins, hydrolysable tannins, total flavonoids and saponins at the NSW DPIRD Food and Feed Laboratory, Tamworth, NSW, Australia. Extractions were obtained by rotary mixing 20 mg of plant material with 1 mL of 70% acetone (~40 rpm, 2 h in the dark), centrifuging (20,000g, 5 min at room temperature) and collecting the supernatant. The pellet was resuspended in 1 mL of 70% acetone and rotary mixed overnight, centrifuged (20,000g, 5 min at room temperature) and the supernatants were combined. Extractions were performed in duplicate and pooled supernatants were stored in the freezer. Controls, blanks and species with high and low PSC contents were included in each of the following assays.
The total phenolic content was measured using the Folin–Ciocalteu’s assay (Singleton and Rossi 1965) adapted to microplate (Siah 2012; Siah et al. 2019). The non-tannin phenols were removed from the extract by polyvinylpolypyrrolidone by using a scaled-down version of that described in Makkar (2003). The concentration of total tannins in each extract was calculated as total tannins = total phenols − non-tannin phenols. The total phenol, non-tannin phenol and total tannin results were expressed as tannic acid equivalents (% TAE, DM), as calculated in Makkar (2003).
The total flavonoid content was measured using a modified method of Xu and Chang (2007), scaled down to microplate. Each extract was assayed in triplicate; absorbance was read at 510 nm. Total flavonoids were calculated as catechin equivalents (g CE kg−1 DM) on the basis of a standard curve.
Condensed tannin content of the extracts was measured using a scaled-down version of that described in Makkar (2003). Each extract was assayed in triplicate and absorbance was read at 550 nm. If the absorbance was greater than 0.6, the sample extract was diluted in 70% acetone and the process was repeated. Condensed tannins (%LE, DM) were calculated on the basis of a standard curve of leucocyanidin, as described in Makkar (2003), then adjusted to standard units (g LE kg−1 DM).
Hydrolysable tannins were determined using the procedure of Makkar (2003). Each plant sample was methanolysed in duplicate, and the methanolysed solution was assayed for hydrolysable tannins in triplicate with absorbance read at 525 nm. The results were expressed as methyl gallate equivalents (g MGE kg−1 DM), based on a standard curve.
Saponins were extracted from the freeze-dried ground pasture samples by using a procedure modified from Kotze et al. (2011). Briefly, 1 mL of 70% ethanol was added to 50 mg of sample, vortexed, then rotary mixed (~40 rpm, 48 h), and centrifuged (20,000g, 10 min). The supernatant was removed, centrifuged (20,000g, 5 min) and stored in the freezer. The assay for saponins was based on the procedure of Hiai et al. (1976), with the volume of reagents decreased as per Le et al. (2018). Each extract was assayed in triplicate and absorbance was read at 544 nm. The results were expressed as quillaja bark equivalents (g QBE kg−1 DM) by using a standard curve.
Statistical analysis
Data for pasture minerals, feed quality attributes, in vitro methane and plant secondary compounds were collected for individual species from each plot. Data for pasture mixtures were then calculated using the weighted average of the individual species results, based on the DM proportion of individual species in each plot at each sampling time at each site. An across-site analysis was not attempted, owing to the differences in soil type and rainfall distribution between sites and the different cultivars used; thus, one-way ANOVA was conducted using GenStat for Windows, 23rd edn (VSN International 2023) for all parameters at each site, with pasture mix treatment as the fixed factor and replicate as the random factor. Plots of the residuals showed that no data transformation was necessary. For CH4 yield and PSC contents, data were also presented at the species level and analysed with one-way ANOVA in a randomised complete block model. Least significant difference between treatments was reported at P = 0.05. Correlations between CH4 and PSC contents were computed using ‘GGally’ package (extension to ‘ggplot2’; see https://www.rdocumentation.org/packages/GGally/versions/2.2.1) in R environment (Ver. 2.21; see https://github.com/ggobi/ggally).
Results
Climate
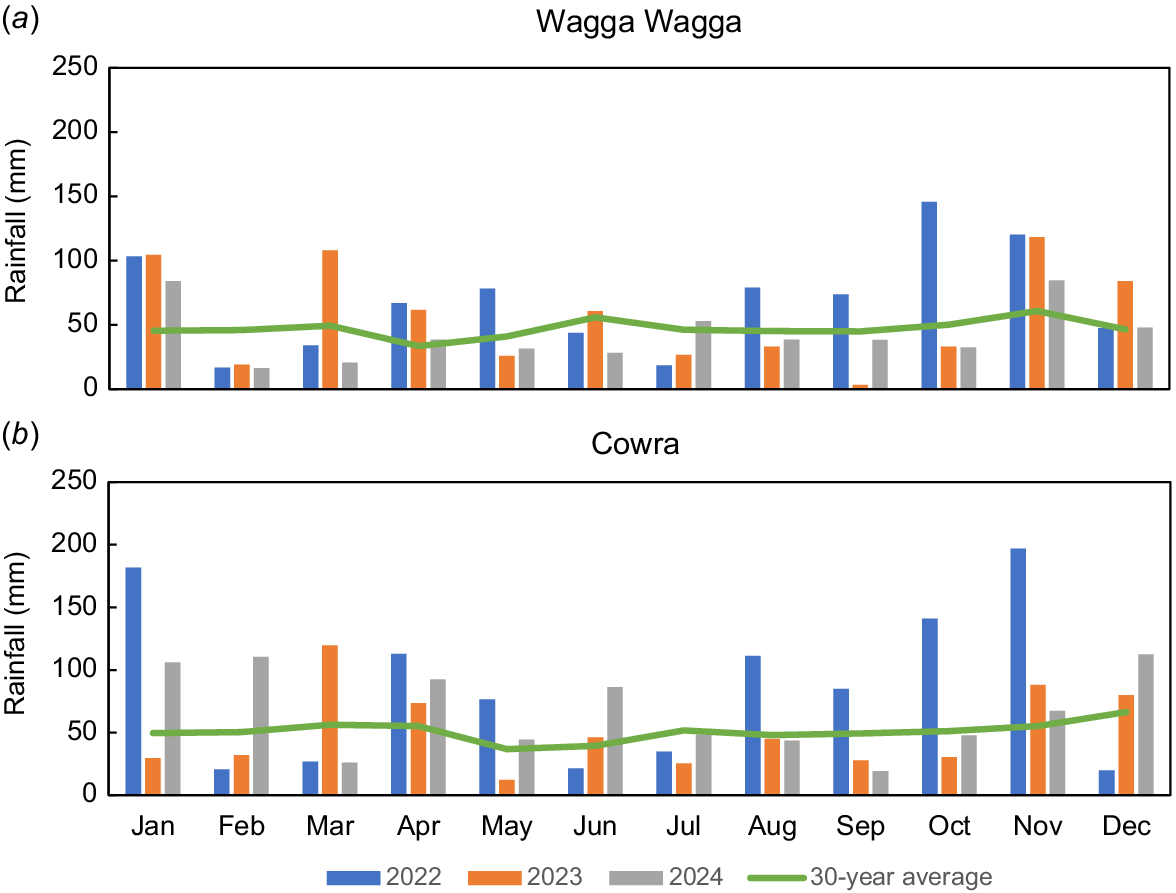
It was a wet year in 2022 when pastures were established. The rainfall received was 827 mm and 1028 mm at Wagga Wagga and Cowra respectively, which was 47% and 69% more than the long-term average (Fig. 1). In 2023, the total rainfall was again greater than the long-term average at Wagga Wagga, although rainfall from July to October was 90 mm less than the long-term average for the same period. The Cowra site also experienced a dry spring, with 72 mm less rainfall received during July–October in 2023 than the average for that period. In 2024, the Cowra site had a wet autumn, but dry early spring, whereas the Wagga Wagga site was drier than average in autumn and early spring (Fig. 1).
Pasture establishment
There was variation in seedling densities for the legume species, but similar seedling establishment for perennial herbs/grasses at Wagga Wagga. There were also greater differences in seedling densities between perennial herbs/grasses and legume species at Cowra (P < 0.001; Table 2). In general, the seedling density of both herb/grass and legume components was lower at Wagga Wagga than Cowra. Both yellow and French serradella established at higher densities than did other legumes at both sites.
| ID | Pasture mix | Wagga Wagga | Cowra | |||
|---|---|---|---|---|---|---|
| Herb/grass | Legume | Herb/grass | Legume | |||
| 1 | Chicory–arrowleaf clover | 59 | 58 | – | – | |
| 2 | Chicory–balansa clover | – | – | 76 | 57 | |
| 3 | Chicory–biserrula | 70 | 52 | 81 | 17 | |
| 4 | Chicory–subterranean clover | 67 | 44 | 87 | 26 | |
| 5 | Chicory–French serradella | 75 | 66 | 90 | 88 | |
| 6 | Chicory–yellow serradella | 85 | 81 | 80 | 110 | |
| 7 | Chicory–lucerne | 72 | 39 | 71 | 36 | |
| 8 | Plantain–arrowleaf clover | 56 | 65 | – | – | |
| 9 | Plantain–balansa clover | – | – | 67 | 70 | |
| 10 | Plantain–biserrula | 49 | 65 | 86 | 27 | |
| 11 | Plantain–subterranean clover | 65 | 51 | 67 | 27 | |
| 12 | Plantain–French serradella | 63 | 82 | 91 | 94 | |
| 13 | Plantain–yellow serradella | 52 | 64 | 81 | 103 | |
| 14 | Plantain–lucerne | 52 | 38 | 99 | 37 | |
| 15 | Phalaris–arrowleaf clover | 74 | 78 | – | – | |
| 16 | Phalaris–balansa clover | – | – | 61 | 64 | |
| 17 | Phalaris–biserrula | 52 | 57 | 67 | 27 | |
| 18 | Phalaris–subterranean clover | 46 | 42 | 69 | 28 | |
| 19 | Phalaris–French serradella | 66 | 79 | 64 | 92 | |
| 20 | Phalaris–yellow serradella | 57 | 77 | 78 | 114 | |
| 21 | Phalaris–lucerne | 55 | 51 | 65 | 29 | |
| 22 | Cocksfoot–arrowleaf clover | 64 | 57 | – | – | |
| 23 | Cocksfoot–biserrula | 74 | 71 | – | – | |
| 24 | Cocksfoot–subterranean clover | 69 | 53 | – | – | |
| 25 | Cocksfoot–French serradella | 66 | 91 | – | – | |
| 26 | Cocksfoot–yellow serradella | 79 | 84 | – | – | |
| 27 | Cocksfoot–lucerne | 72 | 54 | – | – | |
| 28 | Tall fescue–balansa clover | – | – | 126 | 56 | |
| 29 | Tall fescue–biserrula | – | – | 117 | 13 | |
| 30 | Tall fescue–subterranean clover | – | – | 145 | 41 | |
| 31 | Tall fescue–French serradella | – | – | 152 | 110 | |
| 32 | Tall fescue–yellow serradella | – | – | 128 | 99 | |
| 33 | Tall fescue–lucerne | – | – | 162 | 48 | |
| Significance | n.s. | *** | *** | *** | ||
| LSD0.05 | – | 23.4 | 35.2 | 18.6 | ||
***P < 0.001; n.s., not significant; –, not applicable.
Perennial species persistence and annual species regeneration
There were large variations in basal frequency of perennial herbs/grasses and seedling regeneration of annual legume species (Fig. 2). The pasture mixtures located in the top right quadrant had above average basal frequency and seedling regeneration, whereas those located at the bottom left quadrant had below average basal frequency and seedling regeneration. Phalaris (Phalaris aquatica)-subterranean clover (T. subterraneum), phalaris-yellow serradella, cocksfoot (Dactylis glomerata)-subterranean clover, and cocksfoot-French serradella were the best performing mixtures at Wagga Wagga, while phalaris-balansa clover (T. michelianum), phalaris-French serradella, and tall fescue (Festuca arundinacea) in mixtures with balansa clover, French serradella and yellow serradella were the best for these traits at Cowra.
Mean basal frequency (%) of perennial herbs/grasses and seedling regeneration of annual legume species (seedlings m−2) in Years 2 and 3 at (a) Wagga Wagga, and (b) Cowra, NSW, Australia. Seedling regeneration of annual legume species was not measured in Year 3 at Cowra. The number in the graph refers to the pasture mix ID listed in Table 1. Dotted lines represent the average of each parameter.
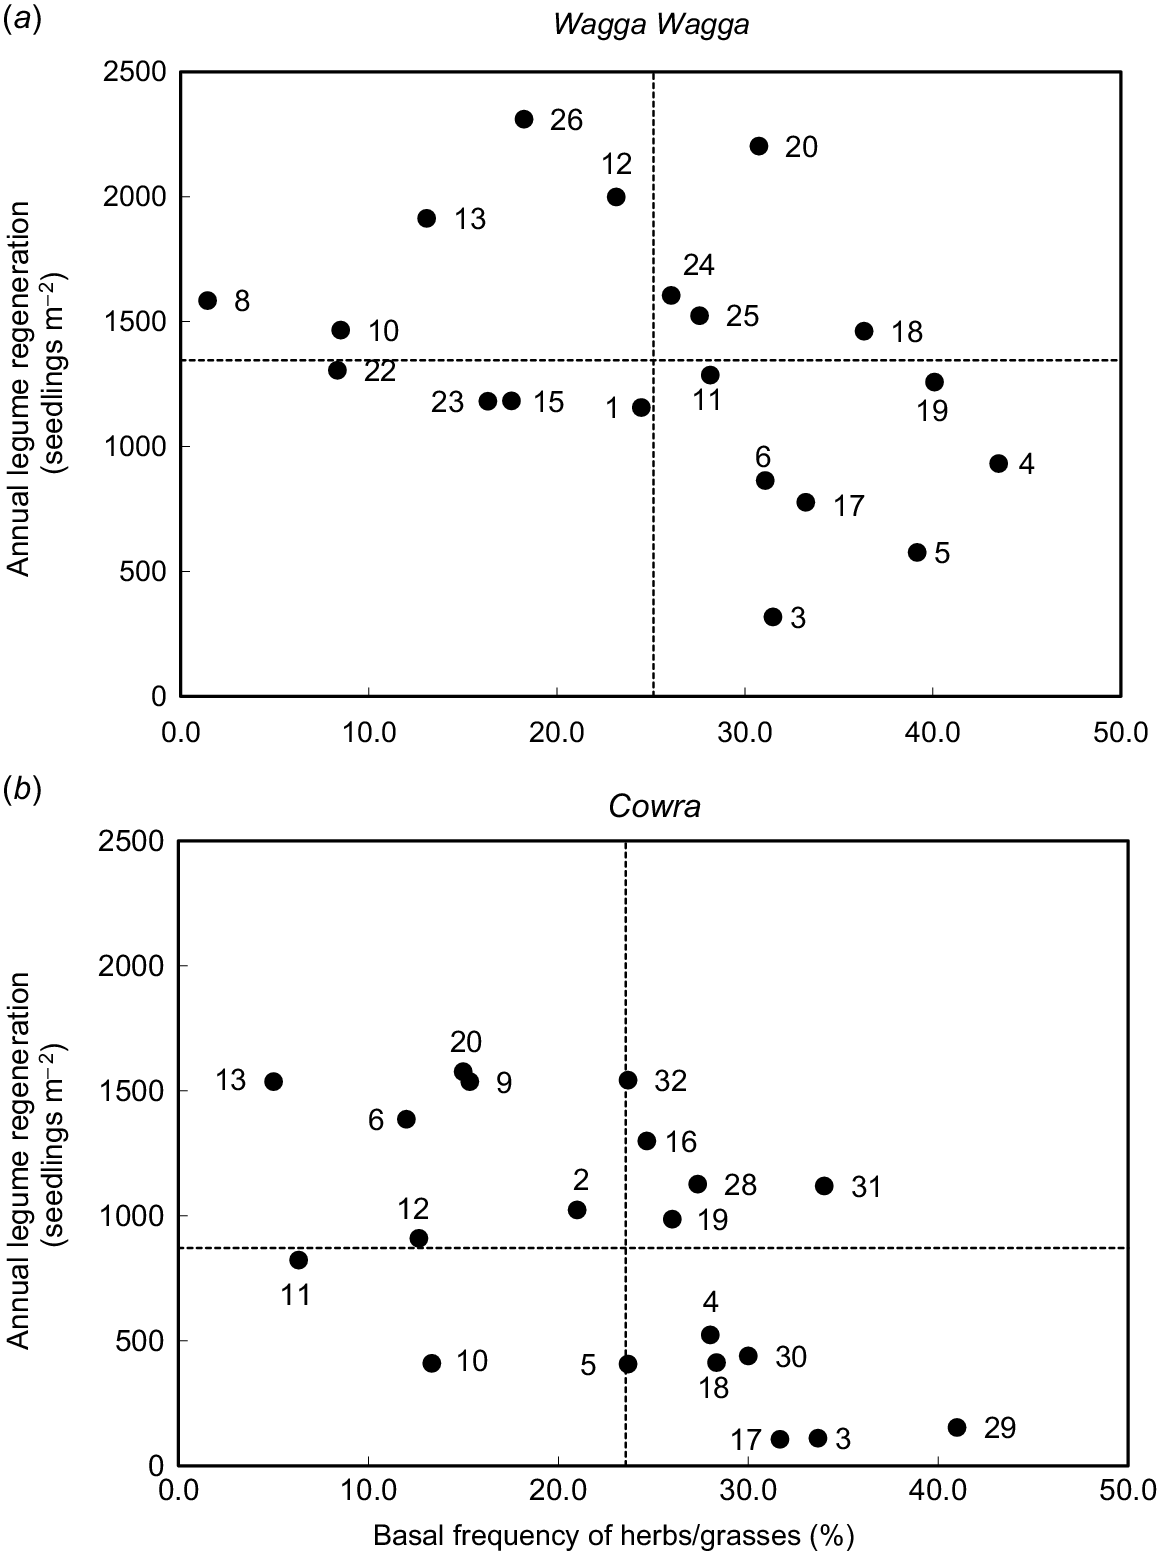
At Wagga Wagga, chicory-based pastures were located at bottom-right quadrant, with high basal frequency for chicory, but lower seedling regeneration of annual legume species. In contrast, plantain-based pastures were located at top-left quadrant because plantain had below-average basal frequency, but above-average seedling regeneration of annual legume species. The cocksfoot-based mixtures were generally located in the upper quadrants, indicating above-average seedling regeneration with variable basal frequency for cocksfoot. At Cowra, the chicory-based mixtures were in either the top-left or bottom-right quadrants, suggesting that high values of one species negatively affected the other species in the mix. The plantain mixtures were generally located in the two left quadrants and tall fescue mixtures in the right quadrants (Fig. 2). At both sites, phalaris mixtures were typically located in the two right quadrants, indicting that phalaris had a high basal frequency irrespective of the legume. Among the annual legume species, biserrula was observed to have low seedling regeneration densities at both sites. Low densities of subterranean clover and French serradella were also commonly observed.
Herbage production and legume content
In general, the pasture mixtures were more productive over 3 years at Cowra than Wagga Wagga (Fig. 3, Supplementary Fig. S1). At Cowra, chicory-based mixtures produced more than 44 Mg ha−1 of cumulative herbage DM, with the highest being chicory-French serradella (59 Mg ha−1), comprising ~25–32% legume (Fig. 3b). All pasture mixtures with balansa clover were also located at top-right quadrant, except chicory–balansa clover that had legume content below the treatment average (29%). Pasture mixtures containing biserrula were the least productive, with legume content less than 10% (Fig. 3b) and generally had a large proportion of weeds (Fig. S1). For example, the sown species in the plantain–biserrula mix yielded 17 Mg ha−1 of herbage mass, with only 3 Mg ha−1 of legume herbage (10%), but 13 Mg ha−1 of weeds (43%).
Cumulative herbage production (DM, Mg ha−1) for sown species of each pasture mix with their average legume contents (%) over 3 years at (a) Wagga Wagga and (b) Cowra, NSW, Australia. The number in the graph refers to the pasture mix ID listed in Table 1. Dotted line represents the average of each parameter.
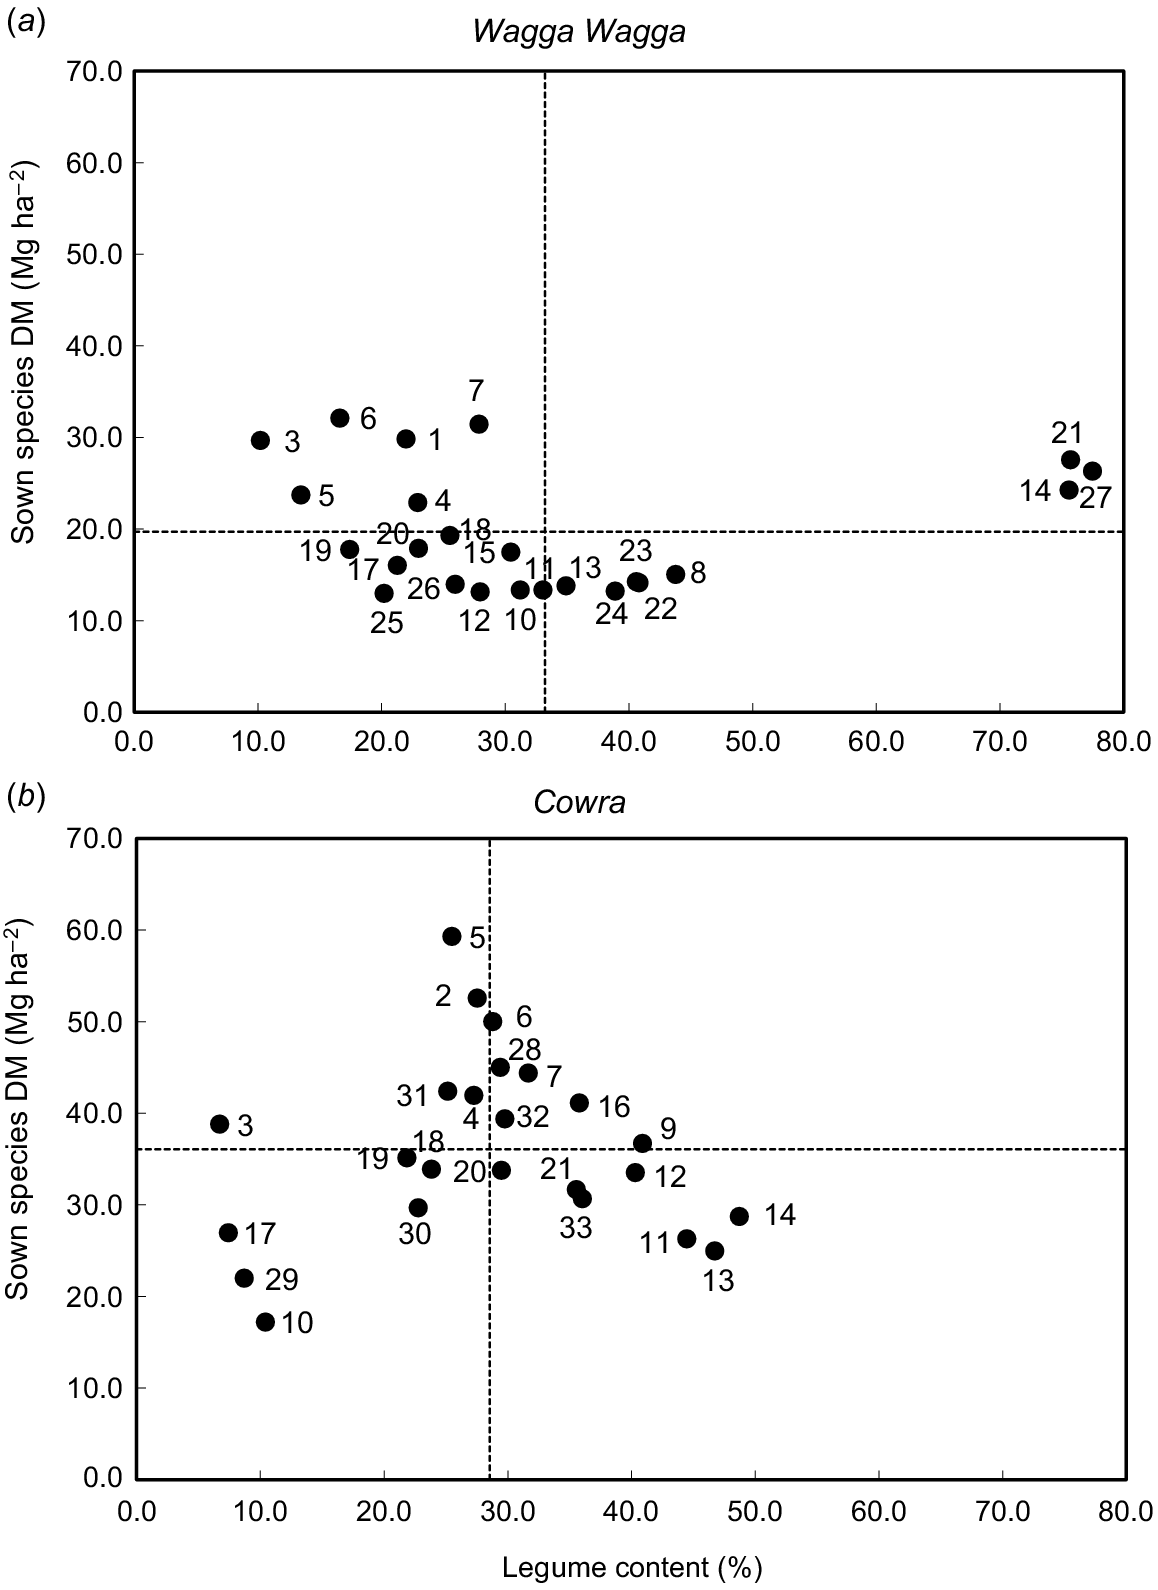
At Wagga Wagga, all chicory-based pastures were more productive than any other pasture mixtures, with herbage production greater than 23 Mg ha−1, but the annual legume content was consistently less than 23%. For the pasture mixtures with lucerne, the lucerne content was over 76% except for chicory–lucerne mix where lucerne content was 28% (Fig. 3a). At Wagga Wagga, the weed content was below 10% for most of pasture mixtures except for plantain–arrowleaf clover (T. vesiculosum) and cocksfoot–arrowleaf clover where weed content was more than 20% (Fig. S1).
Pasture mineral composition and animal health index
Most pasture mixtures at both sites were supplied adequate concentrations of minerals to meet requirements of a 50 kg lamb growing at 250 g day−1 (NRC 2007) (Supplementary Table S1). However, there were notable exceptions. The forage concentration of K exceeded animal requirements (<3%, NRC 2007) in all chicory-based pastures regardless of legume species at Wagga Wagga (mean 3.53%) and Cowra (mean 3.78%). Pasture mixtures that included cocksfoot (Wagga Wagga only) (range 0.01–0.04%) recorded values less than the published requirement for Na for an early maturing sheep at 50 kg (>0.06%, NRC 2007), as was the case for the phalaris–lucerne mixture (0.04%) as well as the mixtures at Cowra containing phalaris–lucerne, tall fescue–biserrula and tall fescue–yellow serradella.
Key mineral ratios indicating the availability of Ca and Mg in ruminants were below the established maximum thresholds for the tetany index (<2.2) and K:(Na + Mg) ratio (<6) for all forage mixtures, indicating normal mineral metabolism for grazing sheep (Table 3). However, the tetany indices for phalaris-based mixtures were generally elevated at each site (range 2.0–2.7). Among all pasture mixtures, the dietary cation–anion difference (DCAD) was up to nine times (range 27–112) greater than the nominal maximum threshold (<12, Takagi and Block 1991).
| ID | Pasture mix | Wagga Wagga | Cowra | |||||||
|---|---|---|---|---|---|---|---|---|---|---|
| K:(Na + Mg) | Ca:P | DCAD | Tetany | K:(Na + Mg) | Ca:P | DCAD | Tetany | |||
| 1 | Chicory–arrowleaf clover | 4.8 | 3.2 | 65 | 1.4 | – | – | – | – | |
| 2 | Chicory–balansa clover | – | – | – | – | 3.6 | 4.2 | 77 | 1.2 | |
| 3 | Chicory–biserrula | 4.5 | 3.5 | 62 | 1.4 | 3.7 | 3.5 | 78 | 1.3 | |
| 4 | Chicory–subterranean clover | 4.6 | 3.3 | 61 | 1.4 | 3.6 | 4.7 | 67 | 1.0 | |
| 5 | Chicory–French serradella | 4.5 | 3.4 | 60 | 1.4 | 4.3 | 3.2 | 80 | 1.5 | |
| 6 | Chicory–yellow serradella | 4.1 | 3.5 | 60 | 1.2 | 4.0 | 2.8 | 74 | 1.5 | |
| 7 | Chicory–lucerne | 3.8 | 4.4 | 49 | 1.1 | 3.9 | 4.3 | 61 | 1.2 | |
| 8 | Plantain–arrowleaf clover | 2.9 | 4.9 | 37 | 0.8 | – | – | – | – | |
| 9 | Plantain–balansa clover | – | – | – | – | 2.9 | 5.2 | 44 | 0.9 | |
| 10 | Plantain–biserrula | 3.2 | 5.0 | 36 | 0.9 | 3.3 | 3.8 | 36 | 0.8 | |
| 11 | Plantain–subterranean clover | 3.0 | 4.9 | 39 | 1.0 | 3.0 | 5.3 | 45 | 0.7 | |
| 12 | Plantain–French serradella | 2.8 | 4.3 | 30 | 1.0 | 3.3 | 3.1 | 48 | 1.2 | |
| 13 | Plantain–yellow serradella | 2.9 | 4.1 | 33 | 1.1 | 3.6 | 3.2 | 55 | 1.1 | |
| 14 | Plantain–lucerne | 3.7 | 6.0 | 35 | 0.8 | 3.8 | 5.3 | 40 | 0.9 | |
| 15 | Phalaris–arrowleaf clover | 4.3 | 2.1 | 32 | 2.1 | – | – | – | – | |
| 16 | Phalaris–balansa clover | – | – | – | – | 3.4 | 2.9 | 48 | 1.7 | |
| 17 | Phalaris–biserrula | 3.9 | 2.0 | 29 | 1.9 | 4.0 | 1.4 | 39 | 2.2 | |
| 18 | Phalaris–subterranean clover | 3.9 | 2.2 | 31 | 2.1 | 3.3 | 2.6 | 39 | 1.8 | |
| 19 | Phalaris–French serradella | 4.0 | 2.0 | 33 | 2.1 | 3.8 | 1.6 | 52 | 2.0 | |
| 20 | Phalaris–yellow serradella | 3.6 | 1.9 | 37 | 2.0 | 3.8 | 2.1 | 64 | 1.9 | |
| 21 | Phalaris–lucerne | 4.0 | 4.9 | 42 | 1.2 | 3.9 | 2.6 | 53 | 2.1 | |
| 22 | Cocksfoot–arrowleaf clover | 4.3 | 3.4 | 46 | 1.3 | – | – | – | – | |
| 23 | Cocksfoot–biserrula | 5.0 | 2.8 | 52 | 1.6 | – | – | – | – | |
| 24 | Cocksfoot–subterranean clover | 4.6 | 3.6 | 39 | 1.6 | – | – | – | – | |
| 25 | Cocksfoot–French serradella | 4.4 | 2.7 | 34 | 1.6 | – | – | – | – | |
| 26 | Cocksfoot–yellow serradella | 4.2 | 2.9 | 35 | 1.4 | – | – | – | – | |
| 27 | Cocksfoot–lucerne | 4.3 | 5.0 | 39 | 1.1 | – | – | – | – | |
| 28 | Tall fescue–balansa clover | – | – | – | – | 3.4 | 2.8 | 44 | 1.4 | |
| 29 | Tall fescue–biserrula | – | – | – | – | 4.2 | 1.2 | 31 | 2.0 | |
| 30 | Tall fescue–subterranean clover | – | – | – | – | 3.5 | 2.2 | 36 | 1.6 | |
| 31 | Tall fescue–French serradella | – | – | – | – | 3.3 | 1.5 | 38 | 1.6 | |
| 32 | Tall fescue–yellow serradella | – | – | – | – | 3.8 | 1.6 | 41 | 1.7 | |
| 33 | Tall fescue–lucerne | – | – | – | – | 3.5 | 3.0 | 35 | 1.4 | |
| Significance | *** | *** | *** | *** | * | *** | *** | *** | ||
| LSD0.05 | 0.71 | 0.86 | 10.9 | 0.31 | 0.73 | 0.64 | 9.9 | 0.34 | ||
The values for each parameter are weighted averages of each pasture component in the pasture mix.
*P < 0.05; ***P < 0.001; n.s., not significant; –, not applicable.
Herbage quality
There were significant differences in all parameters measured for all pasture mixtures at both sites (Table 4). At Wagga Wagga, chicory-based pastures, in general, had a lower CP than other pasture mixtures because of lower legume content in the swards (Fig. 3a). Pasture mixtures with lucerne had CP over 17.6%, except for chicory–lucerne mix (13.2%). The ME of all swards ranged from 9.3 to 10.8 MJ kg−1 DM, whereas the DMD ranged from 60% to 72%. There was a large variation in WSC, with the highest being 15.5% in phalaris–yellow serradella mix and the lowest being 7.3% in plantain–lucerne mix. Chicory-based pastures, in general, had low NDF, and higher WSC and ash content than did other pasture mixtures at both sites (Table 4). Crude protein concentration for most of the pasture mixtures was higher at Cowra than that at Wagga Wagga, with plantain–yellow serradella having the highest (18.8%) and tall fescue–biserrula having the lowest (10.1%) concentrations. The ME was also slightly higher at Cowra than at Wagga Wagga, ranging from 10.4 to 11.6 MJ kg−1 DM. Both DMD and DOMD were higher at Cowra than at Wagga Wagga. (Table 4).
| ID | Pasture mix | Wagga Wagga | Cowra | |||||||||||||||||
|---|---|---|---|---|---|---|---|---|---|---|---|---|---|---|---|---|---|---|---|---|
| CP (%) | ME (MJ kg−1 DM) | ADF (%) | NDF (%) | OM (%) | DMD (%) | DOMD (%) | WSC (%) | Ash (%) | CP (%) | ME (MJ kg−1 DM) | ADF (%) | NDF (%) | OM (%) | DMD (%) | DOMD (%) | WSC (%) | Ash (%) | |||
| 1 | Chicory–arrowleaf clover | 12.9 | 9.7 | 26 | 37 | 88 | 65 | 63 | 14.2 | 12.0 | – | – | – | – | – | – | – | – | – | |
| 2 | Chicory–balansa clover | – | – | – | – | – | – | – | – | – | 17.3 | 11.4 | 18 | 26 | 86 | 76 | 71 | 17.3 | 14.0 | |
| 3 | Chicory–biserrula | 12.9 | 9.8 | 21 | 30 | 87 | 63 | 63 | 14.9 | 13.1 | 16.2 | 11.1 | 16 | 24 | 86 | 75 | 70 | 18.1 | 13.8 | |
| 4 | Chicory–subterranean clover | 12.3 | 9.9 | 24 | 37 | 88 | 66 | 64 | 15.0 | 12.3 | 16.4 | 10.7 | 19 | 29 | 86 | 73 | 68 | 16.1 | 13.9 | |
| 5 | Chicory–French serradella | 12.9 | 10.1 | 21 | 29 | 87 | 64 | 64 | 15.1 | 12.9 | 18.0 | 11.1 | 18 | 27 | 87 | 74 | 69 | 15.3 | 13.4 | |
| 6 | Chicory–yellow serradella | 13.3 | 9.3 | 25 | 39 | 87 | 60 | 61 | 11.3 | 13.1 | 18.2 | 10.9 | 18 | 26 | 86 | 74 | 69 | 14.7 | 13.7 | |
| 7 | Chicory–Lucerne | 13.2 | 9.8 | 25 | 37 | 88 | 65 | 63 | 11.9 | 12.1 | 17.5 | 10.9 | 19 | 28 | 87 | 73 | 68 | 14.8 | 13.1 | |
| 8 | Plantain–arrowleaf clover | 16.1 | 10.1 | 26 | 41 | 89 | 65 | 65 | 9.1 | 10.9 | – | – | – | – | – | – | – | – | – | |
| 9 | Plantain–balansa clover | – | – | – | – | – | – | – | – | – | 15.0 | 11.6 | 22 | 30 | 89 | 76 | 72 | 14.7 | 11.4 | |
| 10 | Plantain–biserrula | 15.0 | 9.7 | 26 | 41 | 88 | 63 | 63 | 7.3 | 11.8 | 14.2 | 10.9 | 21 | 30 | 89 | 72 | 69 | 12.9 | 10.8 | |
| 11 | Plantain–subterranean clover | 13.1 | 9.8 | 26 | 43 | 88 | 65 | 63 | 9.8 | 11.7 | 16.1 | 10.8 | 23 | 32 | 88 | 72 | 68 | 12.0 | 11.7 | |
| 12 | Plantain–French serradella | 14.1 | 9.5 | 26 | 46 | 88 | 62 | 62 | 9.4 | 11.6 | 16.0 | 11.0 | 22 | 32 | 90 | 73 | 69 | 11.2 | 10.0 | |
| 13 | Plantain–yellow serradella | 14.5 | 9.4 | 29 | 48 | 89 | 62 | 61 | 8.2 | 11.4 | 18.8 | 11.1 | 21 | 32 | 89 | 74 | 69 | 8.9 | 10.5 | |
| 14 | Plantain–lucerne | 17.8 | 10.0 | 27 | 41 | 90 | 68 | 64 | 7.3 | 9.9 | 15.6 | 11.2 | 21 | 27 | 87 | 76 | 72 | 12.5 | 11.2 | |
| 15 | Phalaris–arrowleaf clover | 13.7 | 10.2 | 26 | 47 | 90 | 66 | 65 | 13.7 | 10.4 | – | – | – | – | – | – | – | – | – | |
| 16 | Phalaris–balansa clover | – | – | – | – | – | – | – | – | – | 15.2 | 11.5 | 24 | 40 | 89 | 76 | 72 | 17.8 | 11.2 | |
| 17 | Phalaris–biserrula | 14.4 | 10.1 | 27 | 49 | 89 | 66 | 64 | 12.7 | 10.8 | 11.5 | 11.4 | 23 | 43 | 90 | 75 | 71 | 21.0 | 9.6 | |
| 18 | Phalaris–subterranean clover | 12.1 | 9.6 | 30 | 53 | 89 | 63 | 62 | 13.2 | 10.9 | 13.8 | 10.8 | 24 | 43 | 90 | 73 | 68 | 16.3 | 10.4 | |
| 19 | Phalaris–French serradella | 14.3 | 10.2 | 26 | 48 | 89 | 66 | 65 | 14.5 | 11.2 | 14.5 | 11.0 | 24 | 43 | 90 | 73 | 69 | 16.0 | 10.0 | |
| 20 | Phalaris–yellow serradella | 13.9 | 10.4 | 24 | 41 | 88 | 68 | 66 | 15.5 | 12.4 | 15.8 | 11.1 | 24 | 41 | 89 | 74 | 69 | 15.4 | 10.6 | |
| 21 | Phalaris–lucerne | 17.6 | 9.9 | 28 | 43 | 90 | 68 | 63 | 9.1 | 9.7 | 15.6 | 11.2 | 24 | 40 | 90 | 75 | 70 | 16.3 | 9.9 | |
| 22 | Cocksfoot–arrowleaf clover | 16.5 | 10.8 | 24 | 38 | 89 | 71 | 68 | 13.2 | 11.4 | – | – | – | – | – | – | – | – | – | |
| 23 | Cocksfoot–biserrula | 15.9 | 10.8 | 23 | 38 | 89 | 71 | 68 | 12.5 | 11.5 | – | – | – | – | – | – | – | – | – | |
| 24 | Cocksfoot–subterranean clover | 16.2 | 10.7 | 24 | 42 | 89 | 71 | 68 | 11.8 | 11.4 | – | – | – | – | – | – | – | – | – | |
| 25 | Cocksfoot–French serradella | 14.6 | 10.5 | 26 | 45 | 89 | 69 | 67 | 12.9 | 11.1 | – | – | – | – | – | – | – | – | – | |
| 26 | Cocksfoot–yellow serradella | 13.4 | 10.7 | 25 | 42 | 90 | 70 | 67 | 13.1 | 10.2 | – | – | – | – | – | – | – | – | – | |
| 27 | Cocksfoot–lucerne | 19.1 | 10.7 | 25 | 37 | 90 | 72 | 68 | 8.5 | 10.1 | – | – | – | – | – | – | – | – | – | |
| 28 | Tall fescue–balansa clover | – | – | – | – | – | – | – | – | – | 14.0 | 11.1 | 25 | 42 | 90 | 74 | 70 | 17.3 | 10.0 | |
| 29 | Tall fescue–biserrula | – | – | – | – | – | – | – | – | – | 10.1 | 11.1 | 26 | 44 | 93 | 74 | 69 | 20.9 | 7.5 | |
| 30 | Tall fescue–subterranean clover | – | – | – | – | – | – | – | – | – | 12.6 | 10.5 | 26 | 45 | 91 | 72 | 67 | 16.1 | 9.0 | |
| 31 | Tall fescue–French serradella | – | – | – | – | – | – | – | – | – | 13.5 | 10.4 | 26 | 46 | 91 | 71 | 66 | 14.4 | 8.7 | |
| 32 | Tall fescue–yellow serradella | – | – | – | – | – | – | – | – | – | 15.1 | 10.8 | 25 | 43 | 91 | 73 | 68 | 14.6 | 9.1 | |
| 33 | Tall fescue–lucerne | – | – | – | – | – | – | – | – | – | 15.3 | 10.6 | 25 | 43 | 91 | 72 | 67 | 13.7 | 9.0 | |
| Significance | *** | *** | *** | *** | *** | *** | *** | *** | *** | *** | *** | *** | *** | *** | *** | *** | *** | *** | ||
| LSD0.05 | 1.51 | 0.50 | 2.8 | 5.2 | 0.8 | 2.7 | 2.4 | 2.04 | 0.83 | 1.93 | 0.32 | 1.3 | 3.1 | 1.1 | 1.6 | 1.5 | 2.17 | 0.73 | ||
The values for each parameter are weighted averages of each pasture component in the pasture mix.
***P < 0.001; –, not applicable.
Methane yield and predicted CH4 emissions
For individual species, biserrula had the lowest CH4 yield (9.5 mL g−1 DM), whereas two perennial grasses, phalaris and tall fescue, had the highest CH4 yields (40.7 and 39.2 mL g−1 DM respectively, Table 5). Plantain had slightly lower CH4 yield than chicory and cocksfoot; however, no significant difference was detected between the two. Balansa clover and subterranean clover had much higher CH4 yield than French serradella, yellow serradella and lucerne (P < 0.05, Table 5). As a result, pasture mixtures that included biserrula had the lowest CH4 yields, followed by pasture mixtures including French serradella or yellow serradella at both sites (Table 6). Plantain-based pasture mixtures, in general, had a lower CH4 yield than chicory-based pasture mixtures at both sites. At Wagga Wagga, cocksfoot-based pasture mixtures had a much lower CH4 yield than phalaris-based pasture mixtures. At Cowra, tall fescue-based pasture mixtures had a similar CH4 yield to that of phalaris-based pasture mixtures (Table 6).
| Species | CH4 yield (mL g−1 DM) | Total phenol (% TAE DM) | Non-tannin phenols (% TAE DM) | Total tannins (% TAE DM) | Condensed tannins (g LE kg−1 DM) | Hydrolysable tannins (g TAE kg−1 DM) | Total flavonoids (g CE kg−1 DM) | Saponin (g QBE kg−1 DM) | |
|---|---|---|---|---|---|---|---|---|---|
| Chicory | 33.5 | 1.33 | 1.14 | 0.19 | 0.34 | 5.99 | 20.60 | 2.90 | |
| Plantain | 29.7 | 1.14 | 0.87 | 0.28 | 3.32 | 5.43 | 24.91 | 4.15 | |
| Phalaris | 40.7 | 0.58 | 0.48 | 0.10 | 0.08 | 0.06 | 4.40 | 1.92 | |
| Cocksfoot | 33.8 | 0.67 | 0.61 | 0.08 | 0.06 | 1.92 | 8.03 | 2.36 | |
| Tall fescue | 39.2 | 0.57 | 0.53 | 0.04 | 0.11 | 0.06 | 5.76 | 2.07 | |
| Arrowleaf clover | 35.5 | 0.90 | 0.82 | 0.09 | 0.68 | 1.78 | 7.48 | 2.89 | |
| Balansa clover | 37.6 | 1.12 | 0.72 | 0.40 | 8.76 | 1.26 | 16.26 | 3.14 | |
| Biserrula | 9.5 | 1.06 | 0.92 | 0.14 | 2.37 | 2.18 | 13.82 | 4.35 | |
| Subterranean clover | 37.6 | 0.77 | 0.69 | 0.09 | 0.21 | 0.79 | 7.24 | 2.73 | |
| French serradella | 29.3 | 0.86 | 0.66 | 0.21 | 3.52 | 0.48 | 7.53 | 3.62 | |
| Yellow serradella | 30.8 | 0.82 | 0.64 | 0.18 | 0.76 | 0.27 | 7.45 | 3.56 | |
| Lucerne | 31.9 | 0.61 | 0.60 | 0.04 | 0.13 | 0.10 | 5.09 | 3.00 | |
| Significance | *** | *** | *** | *** | *** | *** | *** | *** | |
| LSD0.05 | 5.24 | 0.341 | 0.320 | 0.105 | 0.894 | 2.223 | 7.084 | 0.555 |
TAE, tannic acid equivalent; LE, leucocyanidin equivalent; CE, catechin equivalent; QBE, quillaja bark equivalent.
***P < 0.001.
| ID | Pasture mix | Wagga Wagga | Cowra | |||||
|---|---|---|---|---|---|---|---|---|
| CH4 yield (mL CH4 g−1 DM) | Herbage DM consumed (Mg DM ha−1) | Predicted CH4 emission (Mg CO2-e ha−1) | CH4 yield (mL CH4 g−1 DM) | Herbage DM consumed (Mg DM ha−1) | Predicted CH4 emission (Mg CO2-e ha−1) | |||
| 1 | Chicory–arrowleaf clover | 34.0 | 17.9 | 13.0 | – | – | – | |
| 2 | Chicory–balansa clover | – | – | – | 34.8 | 32.7 | 24.4 | |
| 3 | Chicory–biserrula | 31.0 | 17.8 | 11.5 | 31.7 | 23.4 | 15.8 | |
| 4 | Chicory–subterranean clover | 34.5 | 13.7 | 10.1 | 34.7 | 25.3 | 18.6 | |
| 5 | Chicory–French serradella | 33.0 | 14.2 | 9.9 | 32.4 | 35.6 | 24.6 | |
| 6 | Chicory–yellow serradella | 33.1 | 19.3 | 13.5 | 32.7 | 30.2 | 21.0 | |
| 7 | Chicory–lucerne | 33.1 | 18.8 | 13.3 | 33.0 | 27.0 | 19.0 | |
| 8 | Plantain–arrowleaf clover | 32.9 | 10.1 | 7.4 | – | – | – | |
| 9 | Plantain–balansa clover | – | – | – | 33.2 | 22.8 | 16.8 | |
| 10 | Plantain–biserrula | 22.8 | 7.9 | 3.1 | 26.1 | 8.4 | 4.5 | |
| 11 | Plantain–subterranean clover | 32.5 | 8.0 | 5.8 | 33.6 | 15.4 | 11.3 | |
| 12 | Plantain–French serradella | 29.6 | 7.9 | 4.9 | 29.5 | 19.5 | 12.2 | |
| 13 | Plantain–yellow serradella | 30.1 | 8.2 | 5.3 | 30.4 | 15.7 | 10.8 | |
| 14 | Plantain–lucerne | 31.4 | 14.5 | 9.6 | 31.0 | 16.4 | 10.9 | |
| 15 | Phalaris–arrowleaf clover | 39.1 | 10.5 | 8.4 | – | – | – | |
| 16 | Phalaris–balansa clover | – | – | – | 39.6 | 25.1 | 21.0 | |
| 17 | Phalaris–biserrula | 33.9 | 9.8 | 5.8 | 37.9 | 15.0 | 11.9 | |
| 18 | Phalaris–subterranean clover | 39.9 | 11.4 | 9.6 | 39.9 | 19.8 | 16.8 | |
| 19 | Phalaris–French serradella | 38.7 | 10.6 | 8.3 | 37.7 | 21.5 | 16.9 | |
| 20 | Phalaris–yellow serradella | 38.4 | 10.8 | 8.3 | 37.6 | 19.7 | 15.5 | |
| 21 | Phalaris–lucerne | 34.0 | 16.5 | 12.0 | 37.0 | 18.8 | 14.8 | |
| 22 | Cocksfoot–arrowleaf clover | 34.6 | 9.3 | 7.0 | – | – | – | |
| 23 | Cocksfoot–biserrula | 22.5 | 8.5 | 2.8 | – | – | – | |
| 24 | Cocksfoot–subterranean clover | 35.3 | 7.9 | 6.1 | – | – | – | |
| 25 | Cocksfoot–French serradella | 32.7 | 7.5 | 5.0 | – | – | – | |
| 26 | Cocksfoot–yellow serradella | 32.8 | 7.9 | 5.4 | – | – | – | |
| 27 | Cocksfoot–lucerne | 32.3 | 15.7 | 10.8 | – | – | – | |
| 28 | Tall fescue–balansa clover | – | – | – | 38.7 | 27.1 | 22.2 | |
| 29 | Tall fescue–biserrula | – | – | – | 36.2 | 12.3 | 9.4 | |
| 30 | Tall fescue–subterranean clover | – | – | – | 38.8 | 17.6 | 14.5 | |
| 31 | Tall fescue–French serradella | – | – | – | 36.6 | 26.1 | 19.8 | |
| 32 | Tall fescue–yellow serradella | – | – | – | 36.4 | 23.5 | 17.9 | |
| 33 | Tall fescue–lucerne | – | – | – | 36.2 | 18.4 | 14.1 | |
| Significance | *** | *** | *** | *** | *** | *** | ||
| LSD0.05 | 0.81 | 3.15 | 2.32 | 0.91 | 4.08 | 2.97 | ||
CH4 yield (mL g−1 DM) for each pasture mixture was calculated using the weighted average of each pasture component based on the DM ratio of the given mixture.
Herbage DM consumed (Mg DM ha−1) was estimated using herbage DM of sown species with 60% utilisation rate over 3 years.
Predicted CH4 emission (Mg CO2-e ha−1) from each plot was calculated using weighted average of CH4 yield for the given mixture multiplied by its herbage DM consumed (Mg ha−1) at the time of sampling. The cumulative CH4 emission was the sum of CH4 emission from each measurement over 3 years.
***P < 0.001; –, not applicable.
There was a significant difference in predicted CH4 emissions among pasture mixtures at both sites (Table 6). In general, more productive pasture mixtures potentially resulted in greater CH4 emissions. The predicted CH4 emissions were much greater at Cowra (4.5–24.4 Mg CO2-e ha−1) compared to those at Wagga Wagga (2.8–13.5 Mg CO2-e ha−1). At Wagga Wagga, plantain and cocksfoot mixed with biserrula, French serradella and yellow serradella were predicted to have CH4 emissions less than 5.4 Mg CO2-e ha−1 over 3 years. All chicory-based pasture mixtures, together with pasture mixtures including lucerne, had CH4 emissions exceeding 9.6 Mg CO2-e ha−1 over 3 years (Table 6). At Cowra, plantain-based pasture mixtures, and pasture mixtures including biserrula, generally resulted in low CH4 emissions, whereas chicory-based pasture mixtures and pasture mixtures including balansa clover, were predicted to have high CH4 emissions. Plantain–biserrula resulted in the lowest CH4 emissions (4.5 Mg CO2-e ha−1), which were only half of those for tall fescue–biserrula (9.4 Mg CO2-e ha−1). Chicory–balansa clover and chicory–French serradella had the highest CH4 emissions (24.4–24.6 Mg CO2-e ha−1 respectively, Table 6).
Concentrations of plant secondary compounds
There was large variation in concentration of total phenols, ranging from 0.57% to 1.33% TAE, with the highest concentrations observed in chicory and the lowest in phalaris and tall fescue (Table 5). Among legume species, total phenols were over 1.00% TAE for balansa clover and biserrula, but as low as 0.61% TAE for lucerne. Balansa clover had the highest total tannins, followed by plantain, whereas tall fescue and lucerne had the lowest. There was a large variation for condensed tannins (0.06–8.76 g LE kg−1) and hydrolysable tannins (0.06–5.99 g TAE kg−1) among the species tested. Balansa–clover had the highest condensed tannins, followed by French serradella and plantain, whereas chicory and plantain had the highest hydrolysable tannins. For saponins, biserrula and plantain had the highest concentrations (4.35 and 4.15 g QBE kg−1 respectively), whereas phalaris had the lowest (1.92 g QBE kg−1, Table 5).
Chicory- and plantain-based pastures had higher concentrations of total phenols, non-tannin phenols, hydrolysable tannins, total flavonoids and saponins than perennial grass-based pastures (Table 7). At Wagga Wagga, all plantain-based pastures, except for plantain–lucerne mixture, had greater concentrations of condensed tannins than all other pasture mixtures. At Cowra, a similar trend was observed for concentrations of condensed tannins in plantain-based pastures. The exception was that all pasture mixtures that included balansa clover had higher concentrations of condensed tannins than any other legumes (Table 7). For saponins, plantain–biserrula had the highest concentrations at Wagga Wagga and Cowra (4.22 and 4.18 g QBE kg−1 respectively), whereas phalaris–subterranean clover had the lowest (2.13–2.14 g QBE kg−1, Table 7).
| ID | Pasture mix | Wagga Wagga | Cowra | |||||||||||||
|---|---|---|---|---|---|---|---|---|---|---|---|---|---|---|---|---|
| TP | NTP | TT | CT | HT | TF | SP | TP | NTP | TT | CT | HT | TF | SP | |||
| 1 | Chicory–arrowleaf clover | 1.24 | 1.07 | 0.17 | 0.41 | 5.05 | 17.68 | 2.90 | – | – | – | – | – | – | – | |
| 2 | Chicory–balansa clover | – | – | – | – | – | – | – | 1.27 | 1.01 | 0.25 | 2.82 | 4.60 | 19.32 | 2.97 | |
| 3 | Chicory–biserrula | 1.30 | 1.12 | 0.19 | 0.55 | 5.59 | 19.89 | 3.05 | 1.31 | 1.12 | 0.19 | 0.49 | 5.70 | 20.08 | 3.01 | |
| 4 | Chicory–subterranean clover | 1.20 | 1.03 | 0.17 | 0.31 | 4.79 | 17.52 | 2.86 | 1.17 | 1.01 | 0.16 | 0.30 | 4.47 | 16.68 | 2.85 | |
| 5 | Chicory–French serradella | 1.27 | 1.07 | 0.19 | 0.78 | 5.23 | 18.80 | 3.00 | 1.20 | 1.01 | 0.20 | 1.21 | 4.48 | 17.00 | 3.10 | |
| 6 | Chicory–yellow serradella | 1.25 | 1.05 | 0.19 | 0.41 | 5.02 | 18.37 | 3.01 | 1.17 | 0.98 | 0.19 | 0.47 | 4.20 | 16.49 | 3.11 | |
| 7 | Chicory–lucerne | 1.12 | 0.98 | 0.15 | 0.28 | 4.29 | 16.11 | 2.93 | 1.09 | 0.96 | 0.14 | 0.27 | 4.02 | 15.40 | 2.93 | |
| 8 | Plantain–arrowleaf clover | 1.01 | 0.84 | 0.17 | 1.85 | 3.40 | 15.23 | 3.45 | – | – | – | – | – | – | – | |
| 9 | Plantain–balansa clover | – | – | – | – | – | – | – | 1.13 | 0.80 | 0.33 | 5.71 | 3.60 | 21.11 | 3.71 | |
| 10 | Plantain–biserrula | 1.11 | 0.88 | 0.23 | 2.99 | 4.32 | 21.13 | 4.22 | 1.13 | 0.88 | 0.25 | 3.15 | 4.85 | 22.94 | 4.18 | |
| 11 | Plantain–subterranean clover | 1.01 | 0.80 | 0.21 | 2.24 | 3.83 | 18.80 | 3.66 | 0.96 | 0.78 | 0.18 | 1.78 | 3.13 | 16.15 | 3.44 | |
| 12 | Plantain–French serradella | 1.06 | 0.81 | 0.26 | 3.37 | 3.99 | 19.84 | 3.99 | 1.00 | 0.76 | 0.24 | 3.42 | 2.93 | 16.11 | 3.88 | |
| 13 | Plantain–yellow serradella | 1.02 | 0.78 | 0.24 | 2.34 | 3.47 | 18.28 | 3.92 | 0.93 | 0.72 | 0.21 | 1.64 | 2.05 | 13.49 | 3.76 | |
| 14 | Plantain–lucerne | 0.73 | 0.66 | 0.09 | 0.88 | 1.35 | 9.74 | 3.27 | 0.82 | 0.70 | 0.13 | 1.38 | 2.18 | 12.85 | 3.45 | |
| 15 | Phalaris–arrowleaf clover | 0.68 | 0.59 | 0.09 | 0.28 | 0.61 | 5.39 | 2.23 | – | – | – | – | – | – | – | |
| 16 | Phalaris–balansa clover | – | – | – | – | – | – | – | 0.78 | 0.57 | 0.21 | 3.39 | 0.51 | 8.92 | 2.38 | |
| 17 | Phalaris–biserrula | 0.68 | 0.58 | 0.11 | 0.58 | 0.52 | 6.45 | 2.45 | 0.62 | 0.52 | 0.10 | 0.29 | 0.25 | 5.25 | 2.14 | |
| 18 | Phalaris–subterranean clover | 0.63 | 0.54 | 0.09 | 0.12 | 0.25 | 5.15 | 2.13 | 0.63 | 0.54 | 0.09 | 0.12 | 0.26 | 5.19 | 2.14 | |
| 19 | Phalaris–French serradella | 0.63 | 0.51 | 0.12 | 0.70 | 0.13 | 4.97 | 2.22 | 0.65 | 0.53 | 0.13 | 0.99 | 0.17 | 5.23 | 2.37 | |
| 20 | Phalaris–yellow serradella | 0.64 | 0.52 | 0.12 | 0.24 | 0.11 | 5.12 | 2.30 | 0.66 | 0.53 | 0.12 | 0.30 | 0.12 | 5.36 | 2.43 | |
| 21 | Phalaris–lucerne | 0.60 | 0.57 | 0.05 | 0.12 | 0.09 | 4.93 | 2.75 | 0.59 | 0.53 | 0.07 | 0.10 | 0.07 | 4.69 | 2.37 | |
| 22 | Cocksfoot–arrowleaf clover | 0.78 | 0.71 | 0.08 | 0.36 | 1.85 | 7.77 | 2.61 | – | – | – | – | – | – | – | |
| 23 | Cocksfoot–biserrula | 0.85 | 0.75 | 0.11 | 1.13 | 2.04 | 10.72 | 3.28 | – | – | – | – | – | – | – | |
| 24 | Cocksfoot–subterranean clover | 0.71 | 0.64 | 0.08 | 0.12 | 1.47 | 7.72 | 2.51 | – | – | – | – | – | – | – | |
| 25 | Cocksfoot–French serradella | 0.71 | 0.62 | 0.11 | 0.84 | 1.60 | 7.92 | 2.65 | – | – | – | – | – | – | – | |
| 26 | Cocksfoot–yellow serradella | 0.72 | 0.62 | 0.11 | 0.29 | 1.38 | 7.84 | 2.75 | – | – | – | – | – | – | – | |
| 27 | Cocksfoot–lucerne | 0.62 | 0.60 | 0.05 | 0.11 | 0.49 | 5.73 | 2.86 | – | – | – | – | – | – | – | |
| 28 | Tall fescue–balansa clover | – | – | – | – | – | – | – | 0.73 | 0.58 | 0.15 | 2.76 | 0.43 | 8.97 | 2.40 | |
| 29 | Tall fescue–biserrula | – | – | – | – | – | – | – | 0.62 | 0.57 | 0.05 | 0.34 | 0.28 | 6.58 | 2.30 | |
| 30 | Tall fescue–subterranean clover | – | – | – | – | – | – | – | 0.61 | 0.56 | 0.05 | 0.13 | 0.23 | 6.09 | 2.22 | |
| 31 | Tall fescue–French serradella | – | – | – | – | – | – | – | 0.64 | 0.56 | 0.08 | 1.00 | 0.17 | 6.22 | 2.48 | |
| 32 | Tall fescue–yellow serradella | – | – | – | – | – | – | – | 0.65 | 0.56 | 0.09 | 0.32 | 0.13 | 6.31 | 2.56 | |
| 33 | Tall fescue–lucerne | – | – | – | – | – | – | – | 0.58 | 0.56 | 0.04 | 0.12 | 0.07 | 5.48 | 2.45 | |
| Significance | *** | *** | *** | *** | *** | *** | *** | *** | *** | *** | *** | *** | *** | *** | ||
| LSD0.05 | 0.044 | 0.033 | 0.013 | 0.169 | 0.423 | 1.253 | 0.099 | 0.036 | 0.025 | 0.013 | 0.262 | 0.309 | 1.002 | 0.116 | ||
The values for each parameter are weighted averages of each pasture component in the pasture mix.
***P < 0.001; –, not applicable.
Correlation between CH4 yield and concentrations of plant secondary compounds
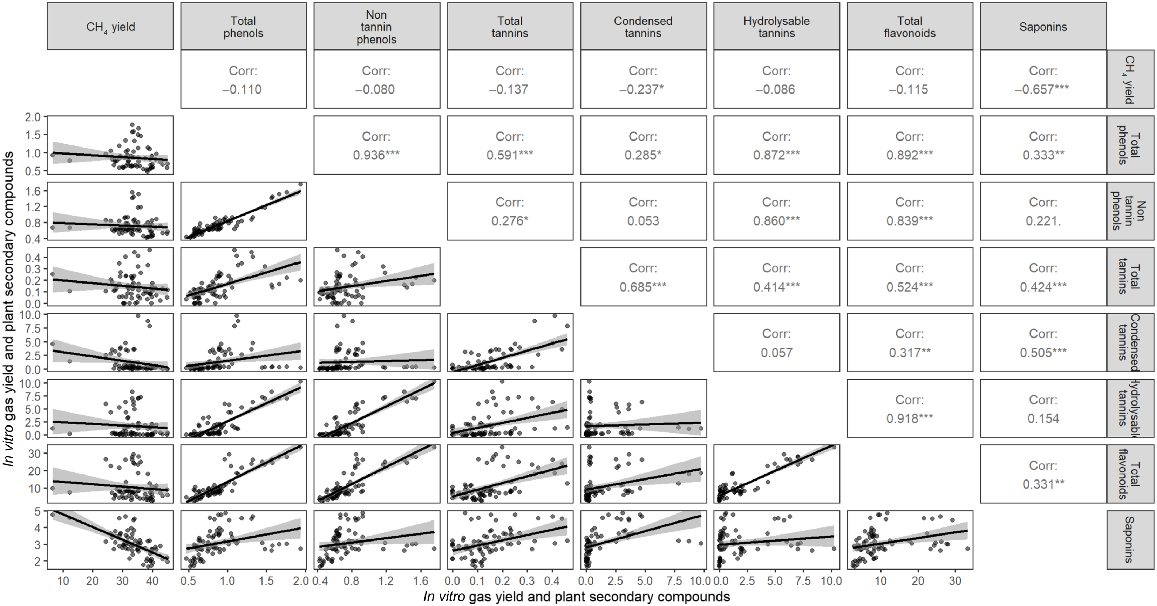
Methane yield was negatively correlated with saponins (P < 0.001) and condensed tannins (P < 0.05; Fig. 4). All of the PSCs assessed were positively correlated with each other, although not all significantly correlated. Both total phenols and total tannins were positively correlated with each other, and with each of the other PSCs assessed (P < 0.05). Condensed tannins were positively correlated with total flavonoids and saponins (P < 0.01), but not with hydrolysable tannins or non-tannin phenols. Hydrolysable tannins were positively correlated with total phenols, non-tannin phenols, total tannins and total flavonoids (P < 0.001). Total flavonoids were positively correlated with total phenols, non-tannin phenols, total tannins, condensed tannins, hydrolysable tannins and saponins (P < 0.01, Fig. 4).
Correlation between in vitro methane yield (mL g−1 DM) and plant secondary compound contents of total phenols (% TAE, DM), non-tannin phenols (% TAE, DM), total tannins (% TAE, DM), condensed tannins (g LE kg−1 DM), hydrolysable tannins (g TAE kg−1 DM), total flavonoids (g CE kg−1 DM) and saponins (g QBE kg−1 DM) from freeze-dried samples (−50°C) at Wagga Wagga and Cowra, NSW, Australia.
Discussion
Role of plant secondary compounds in reduction of CH4 emission
This study has provided the first comparison of the profile of plant secondary compound groups in the herbage of important pastures commonly grown across southern Australia. It showed that CH4 yield had a strong negative correlation with saponins (P < 0.001) and, to a lesser degree, with condensed tannins. Whereas the role of condensed tannins in CH4 mitigation of grazing livestock has received much research attention, the importance of saponins in pasture plants has been understated until recently (Ghamkhar et al. 2018; Badgery et al. 2023). Biserrula, a self-regenerating annual legume species previously implicated as a low methane-producing species (Banik et al. 2013b), was the standout species in the present study, yielding a quarter of the CH4 of other species tested. It was observed that biserrula had the highest concentration of saponins in its herbage, and reasonably high concentrations of non-tannin phenols, flavonoids and condensed tannins. Plantain herbage had the second-highest concentration of saponins. As a result, the concentration of saponins was highest in the plantain–biserrula mix. However, at both sites, swards containing either plantain or biserrula tended to have the lowest herbage yields. Lower pasture production often has higher emission intensity of production (kg CO2-e kg−1 product) (Badgery et al. 2023), but lower emissions (Mg CO2-e ha−1), as shown in this study (Table 7). It is unclear whether plantain and biserrula with higher PSC concentrations would offset CH4 emissions when mixed with other highly productive species in pasture mixtures. Further work is warranted to explore possible interaction effects in vitro and in vivo with a range of ratios of two or more species. Grazing experiments would be required to tease out these relationships.
The correlations between CH4 and PSC contents were dominated by the very low CH4 yield of biserrula (Fig. 4). Thus, although the concentration of these polyphenol and saponin groups in pasture species provides an indication of potentially important PSC groups, further research into the smaller subgroups and specific compounds within each PSC group is required to elucidate stronger relationships with CH4 reduction. Furthermore, literature suggests that both the PSC polymer size and structure differences, such as the degree of phenolic hydroxylation, are likely to influence the amount of CH4 reduction achieved (Tavendale et al. 2005; Kayembe et al. 2013; Hatew et al. 2015). Although this study has highlighted differences between species in regard to PSC classes and effects on CH4 mitigation, there is much more to unravel in understanding the individual metabolites within the phenolic and saponin groups that convey important CH4 mitigation roles, and their relative impacts. These results strongly suggest that the specific phenolic and saponin compounds within these PSC groups differ among pasture species, leading to variance in CH4 reduction effectiveness, which needs to be explored in more depth to understand which compounds are most effective. This will enable researchers to evaluate and predict pasture CH4 reduction with enhanced accuracy.
Methane reduction potential from annual legume species
Balansa clover herbage exhibited very high levels of condensed tannins, more than double the concentration of the next-highest species, plantain and French serradella, but much higher CH4 yield than those two species. Lower CH4 emissions from French serradella were previously assumed to be related to polyphenol concentrations (Badgery et al. 2023). To our knowledge, there has been no previous study highlighting the potential of balansa clover for CH4 mitigation. Balansa clover is generally recommended only on waterlogged soils (Rogers and West 1993). However, at Cowra even in the absence of waterlogging, it comprised ~30–40% of the swards in which it was grown, except in mixtures with tall fescue, suggestive that its adaptation may extend beyond waterlogged soils. Given the very high condensed tannin concentration in balansa clover herbage, coupled with moderately high concentrations of saponins, it is surprising that its in vitro CH4 yield was not significantly less than that of the perennial grasses, tall fescue, phalaris and cocksfoot, which had the lowest concentrations of most PSCs. The most likely reason is that the specific compound structures within the condensed tannins and/or saponin groups of balansa clover herbage differ significantly from the compound structures found in pastures with similar contents but much lower CH4 yield, such as biserrula. Further research is required to understand the differences in individual phenolic and saponin compounds and their roles in mitigating CH4 production.
The low persistence of biserrula at both experimental sites prompts a word of caution when selecting species for CH4 mitigation, as a species is clearly effective in a given environment only if it is present and is ingested by the grazing livestock. Biserrula has previously been shown to be a highly productive and persistent self-regenerating legume species, well-suited to lower-rainfall cropping environments (Nichols et al. 2007, 2012). Adaptation to cooler, higher-rainfall environments would likely require the development of new cultivars with suitable persistence traits (Hayes et al. 2023). The persistence of other legumes with desirable traits for CH4 mitigation also cannot be presumed across the myriad environments in which lower emissions are required, suggesting that the quest for lower-emission pastures will need to be accompanied by a substantial plant breeding initiative. This may include breeding to improve the persistence of a species such as biserrula. Alternatively, it may involve breeding improved plant secondary compounds into traditional species, as has been attempted in white clover (Roldan et al. 2022). It is clear that a wider range of species options will be required to provide more effective options across the myriad environments used for grazing in Australia. This may be achieved by screening other species not included in the present study, and through plant breeding to increase the zone of adaptation of species with desirable attributes.
Challenge to increase legume components in pasture mixtures
Legume species are often a small component in mixed pasture swards, and their abundance is highly variable from year to year (Hayes et al. 2019, 2023). This is especially the case with annual legume species, which are typically the weaker competitor when regenerating from seed in an established perennial-based sward (Dear and Cocks 1997; Hayes et al. 2024). In the context of CH4 mitigation, this poses a risk as the legume herbage may contain the necessary PSCs, but may not be present in the sward for substantial periods of the year, or in adequate quantities to effectively mitigate emissions in extensively grazed swards. Increased legume content in the sward providing high-quality forage with a moderate fibre content is known to lead to positive outcomes for livestock (Pembleton et al. 2015; Refshauge et al. 2022), but also contribute positively to soil health with ongoing inputs of biologically fixed N (Peoples et al. 2012). Improved productivity with legumes is also commonly accompanied by a lower intensity of the enteric CH4 emissions (Santander et al. 2023).
Prospect of perennial herbs in CH4 reduction in extensive grazing systems
The current study demonstrated the importance of the perennial herbs, such as plantain and chicory, in underpinning CH4 mitigation in grazed pastures of southern Australia, in environments where they can persist. Being perennial sepecies, these species offer potential for year-round herbage, as conditions permit (Hayes et al. 2010a), offering ongoing access to herbage with elevated concentrations of PSCs. In addition, the higher WSC and lower NDF from chicory-based pastures would lead to increased feed intake and reduced ruminal retention time and CH4 production (Jayanegara et al. 2010; Lind et al. 2023), resulting in a lower intensity of enteric CH4 emissions (Santander et al. 2023). Furthermore, the herbage of chicory and plantain is mineral-dense and highly digestible, providing further benefits to livestock production. In previous evaluations of perennial pasture species, both species were shown to be broadly adapted to a range of environments across southern Australia (Li et al. 2008; Reed et al. 2008). Chicory, with its deep tap root, tends to be more persistent in lower-rainfall environments (Nie et al. 2008; Hayes et al. 2010a). Plantain is more likely to thrive in higher-rainfall environments that experience cooler summers because of its shallower root system and increased sensitivity to high temperatures (Langworthy et al. 2018). However, to select an appropriate companion legumes species for perennial herbs is still a challenge requiring further investigation (Li et al. 2025). It is anticipated that feed intake by grazing animals is high in perennial herb-based swards compared with traditional pastures, owing to their high herbage quality (Hayes et al. 2010a; Cranston et al. 2015). This will likely further emphasise their advantage in reducing CH4 emissions in grazing systems, and is a priority for future research in this field.
Conclusions
This study demonstrates the significant potential of pasture species containing PSCs to reduce CH4 emissions from ruminant livestock in extensive grazing systems. We found that the composition of these PSC groups varies significantly depending on species, but they are consistent with different locations and environmental conditions.
A key finding from this study was the importance of saponins in mitigating methanogenesis, particularly in biserrula. While condensed tannin content is often considered crucial for reducing CH4 emissions in some pasture species, such as plantain and French serradella, our research showed that this is not a universal mechanism. For instance, balansa clover did not consistently show reduced CH4 emissions despite its high concentration of condensed tannins. Further research is required to understand the structure-specific modes of action of smaller PSC subclasses and individual compounds on CH4 mitigation and their relative efficiencies, before predictions of enteric CH4 emissions can be made on the basis of herbage quality and composition.
Reducing methanogenesis in ruminants is a critical objective for agricultural sustainability, aimed at meeting targets of reduction of GHG emissions. However, this reduction must be achieved without compromising livestock productivity. Our study identified that a number of pasture mixtures with herbs and legumes that have anti-methanogenic properties could adapt to local environmental conditions, maintain or enhance pasture productivity, and provide producers with practical options for reducing their grazing-related GHG emissions. These findings offer a targeted approach to mitigating CH4 emissions in extensive grazing systems where few viable options presently exist.
Data availability
The data that support this study will be shared upon reasonable request to the corresponding author.
Declaration of funding
This work was supported by NSW Department of Primary Industries and Regional Development with initial financial support from the Meat and Livestock Australia Donor Company at early stage.
Acknowledgements
Authors are grateful to the quality technical support from a number of technicians from NSW Department of Primary Industries and Regional Development, namely Richard Lowrie, Andrew Price, Binbin Xu, Peter Tyndall, Sabrina Meurs and Kristy Bailes at Wagga Wagga Agricultural Institute; Neil Munday, Lance Troy, Susan Langfield and Kylie Cooley at Cowra Agricultural Research and Advisory Station; Narelle Egan and Mark Brennan at Tamworth Agricultural Institute.
References
ACLUMP (2016) Land Use in Australia – at a glance. Australian Collaborative Land Use and Management Program. Available at https://www.agriculture.gov.au/sites/default/files/abares/aclump/documents/Land%20use%20in%20Australia%20at%20a%20glance%202016.pdf
Almeida AK, Hegarty RS, Cowie A (2021) Meta-analysis quantifying the potential of dietary additives and rumen modifiers for methane mitigation in ruminant production systems. Animal Nutrition 7, 1219-1230.
| Crossref | Google Scholar | PubMed |
Badgery W, Li G, Simmons A, Wood J, Smith R, Peck D, Ingram L, Durmic Z, Cowie A, Humphries A, Hutton P, Winslow E, Vercoe P, Eckard R, Cullen B (2023) Reducing enteric methane of ruminants in Australian grazing systems – a review of the role for temperate legumes and herbs. Crop & Pasture Science 74, 661-679.
| Crossref | Google Scholar |
Banik BK, Durmic Z, Erskine W, Ghamkhar K, Revell C (2013a) In vitro ruminal fermentation characteristics and methane production differ in selected key pasture species in Australia. Crop & Pasture Science 64, 935-942.
| Crossref | Google Scholar |
Banik BK, Durmic Z, Erskine W, Nichols P, Ghamkhar K, Vercoe P (2013b) Variability of in vitro ruminal fermentation and methanogenic potential in the pasture legume biserrula (Biserrula pelecinus L.). Crop & Pasture Science 64, 409-416.
| Crossref | Google Scholar |
Beauchemin KA, Kreuzer M, O’Mara F, McAllister TA (2008) Nutritional management for enteric methane abatement: a review. Australian Journal of Experimental Agriculture 48, 21-27.
| Crossref | Google Scholar |
Beauchemin KA, Ungerfeld EM, Abdalla AL, et al. (2022) Invited review: current enteric methane mitigation options. Journal of Dairy Science 105, 9297-9326.
| Crossref | Google Scholar | PubMed |
Boschma SP, Lodge GM, Harden S (2011) Seasonal production of lucerne and other perennial legumes and herbs in a summer dominant rainfall zone. New Zealand Journal of Agricultural Research 54, 105-114.
| Crossref | Google Scholar |
Carmona-Flores L, Bionaz M, Downing T, Sahin M, Cheng L, Ates S (2020) Milk production, n partitioning, and methane emissions in dairy cows grazing mixed or spatially separated simple and diverse pastures. Animals 10, 1301.
| Crossref | Google Scholar |
Carulla JE, Kreuzer M, Machmüller A, Hess HD (2005) Supplementation of Acacia mearnsii tannins decreases methanogenesis and urinary nitrogen in forage-fed sheep. Australian Journal of Agricultural Research 56, 961-970.
| Crossref | Google Scholar |
Cranston LM, Kenyon PR, Morris ST, Kemp PD (2015) A review of the use of chicory, plantain, red clover and white clover in a sward mix for increased sheep and beef production. Journal of New Zealand Grasslands 77, 89-94.
| Crossref | Google Scholar |
Dal Pizzol JG, Ribeiro-Filho HMN, Quereuil A, Le Morvan A, Niderkorn V (2017) Complementarities between grasses and forage legumes from temperate and subtropical areas on in vitro rumen fermentation characteristics. Animal Feed Science and Technology 228, 178-185.
| Crossref | Google Scholar |
DCCEEW (2021) National Inventory Report 2021. Available at https://www.dcceew.gov.au/sites/default/files/documents/national-inventory-report-2021-volume-1.pdf
Dear BS, Cocks PS (1997) Effect of perennial pasture species on surface soil moisture and early growth and survival of subterranean clover (Trifolium subterraneum L.) seedlings. Australian Journal of Agricultural Research 48, 683-693.
| Crossref | Google Scholar |
Dove H, Masters DG, Thompson AN (2016) New perspectives on the mineral nutrition of livestock grazing cereal and canola crops. Animal Production Science 56, 1350-1360.
| Crossref | Google Scholar |
Durmic Z, Moate PJ, Jacobs JL, Vadhanabhuti J, Vercoe PE (2016) In vitro fermentability and methane production of some alternative forages in Australia. Animal Production Science 56, 641-645.
| Crossref | Google Scholar |
Eckard RJ, Grainger C, de Klein CAM (2010) Options for the abatement of methane and nitrous oxide from ruminant production: a review. Livestock Science 130, 47-56.
| Crossref | Google Scholar |
Eugène M, Klumpp K, Sauvant D (2021) Methane mitigating options with forages fed to ruminants. Grass and Forage Science 76, 196-204.
| Crossref | Google Scholar |
Francis G, Kerem Z, Makkar HPS, Becker K (2021) Reflections on ‘The biological action of saponins in animal systems: a review’. British Journal of Nutrition 127(7), 1034-1036.
| Crossref | Google Scholar |
Ghamkhar K, Rochfort S, Banik BK, Revell C (2018) Candidate metabolites for methane mitigation in the forage legume biserrula. Agronomy for Sustainable Development 38, 30.
| Crossref | Google Scholar |
Grainger C, Clarke T, Auldist MJ, Beauchemin KA, McGinn SM, Waghorn GC, Eckard RJ (2009) Potential use of Acacia mearnsii condensed tannins to reduce methane emissions and nitrogen excretion from grazing dairy cows. Canadian Journal of Animal Science 89, 241-251.
| Crossref | Google Scholar |
Hatew B, Hayot Carbonero C, Stringano E, Sales LF, Smith LMJ, Mueller-Harvey I, Hendriks WH, Pellikaan WF (2015) Diversity of condensed tannin structures affects rumen in vitro methane production in sainfoin (Onobrychis viciifolia) accessions. Grass and Forage Science 70, 474-490.
| Crossref | Google Scholar |
Hayes RC, Dear BS, Li GD, Virgona JM, Conyers MK, Hackney BF, Tidd J (2010a) Perennial pastures for recharge control in temperate drought-prone environments. Part 1: productivity, persistence and herbage quality of key species. New Zealand Journal of Agricultural Research 53, 283-302.
| Crossref | Google Scholar |
Hayes RC, Li GD, Dear BS, Conyers MK, Virgona JM, Tidd J (2010b) Perennial pastures for recharge control in temperate drought-prone environments. Part 2: soil drying capacity of key species. New Zealand Journal of Agricultural Research 53, 327-345.
| Crossref | Google Scholar |
Hayes RC, Ara I, Badgery WB, Culvenor RA, Haling RE, Harris CA, Li GD, Norton MR, Orgill SE, Penrose B, Smith RW (2019) Prospects for improving perennial legume persistence in mixed grazed pastures of south-eastern Australia, with particular reference to white clover. Crop & Pasture Science 70, 1141-1162.
| Crossref | Google Scholar |
Hayes RC, Newell MT, Pembleton KG, Peoples MB, Li GD (2021) Sowing configuration affects competition and persistence of lucerne (Medicago sativa) in mixed pasture swards. Crop & Pasture Science 72, 707-722.
| Crossref | Google Scholar |
Hayes RC, Newell MT, Li GD, Haling RE, Harris CA, Culvenor RA, Badgery WB, Munday N, Price A, Stutz RS, Simpson RJ, Cullen B (2023) Legume persistence for grasslands in tableland environments of south-eastern Australia. Crop & Pasture Science 74, 712-738.
| Crossref | Google Scholar |
Hayes RC, Li GD, Smith RW, Peoples MB, Rawnsley RP, Newell MT, Pembleton KG (2024) Prospects for improving productivity and composition of mixed swards in semi-arid environments by separating species in drill rows – a review. Agriculture, Ecosystems & Environment 373, 109131.
| Crossref | Google Scholar |
He H-F (2022) Recognition of gallotannins and the physiological activities: from chemical view. Frontiers in Nutrition 9, 888892.
| Crossref | Google Scholar |
Hiai S, Oura H, Nakajima T (1976) Color reaction of some sapogenins and saponins with vanillin and sulfuric acid. Planta Medica 29, 116-122.
| Crossref | Google Scholar | PubMed |
Jayanegara A, Goel G, Makkar HPS, Becker K (2010) Reduction in methane emissions from ruminants by plant secondary metabolites: effects of polyphenols and saponins. In ‘Sustainable improvement of animal production and health’. (Eds NE Odongo, M Garcia, GJ Viljoen) pp. 151–157. (Food and Agriculture Organization of the United Nations (FAO): Rome, Italy)
Kayembe K, Basosila L, Mpiana PT, Sikulisimwa PC, Mbuyu K (2013) Inhibitory effects of phenolic monomers on methanogenesis in anaerobic digestion. Microbiology Research Journal International 3(1), 32-41.
| Crossref | Google Scholar |
Kemp A, ’t Hart ML (1957) Grass tetany in grazing milking cows. Netherlands Journal of Agricultural Science 5, 4-17.
| Crossref | Google Scholar |
Kotze AC, Zadow EN, Vercoe PE, Phillips N, Toovey A, Williams A, Ruffell AP, Dinsdale A, Revell DK (2011) Animal grazing selectivity and plant chemistry issues impact on the potential of Rhagodia preissii as an anthelmintic shrub. Parasitology 138, 628-637.
| Crossref | Google Scholar | PubMed |
Langworthy AD, Rawnsley RP, Freeman MJ, Pembleton KG, Corkrey R, Harrison MT, Lane PA, Henry DA (2018) Potential of summer-active temperate (C3) perennial forages to mitigate the detrimental effects of supraoptimal temperatures on summer home-grown feed production in south-eastern Australian dairying regions. Crop & Pasture Science 69, 808-820.
| Crossref | Google Scholar |
Le AV, Parks SE, Nguyen MH, Roach PD (2018) Improving the vanillin-sulphuric acid method for quantifying total saponins. Technologies 6, 84.
| Crossref | Google Scholar |
Li GD, Lodge GM, Moore GA, Craig AD, Dear BS, Boschma SP, Albertsen TO, Miller SM, Harden S, Hayes RC, Hughes SJ, Snowball R, Smith AB, Cullis BC (2008) Evaluation of perennial pasture legumes and herbs to identify species with high herbage production and persistence in mixed farming zones in southern Australia. Australian Journal of Experimental Agriculture 48, 449-466.
| Crossref | Google Scholar |
Li GD, Hayes RC, Gardner MJ, McCormick JI, Newell MT (2025) Companion legume species for chicory in a phased farming system. European Journal of Agronomy 164, 127488.
| Crossref | Google Scholar |
Lind V, Schwarm A, Mele M, Cappucci A, Foggi G, Sizmaz Ö, Tsiplakou E, Atzori AS, Van Mullem J, Peiren N (2023) Nutritional approaches to reduce enteric methane emission from ruminants. In ‘Technology for environmentally friendly livestock production’. (Ed. T Bartzanas) pp. 65–98. (Springer International Publishing: Cham, Switzerland)
Lodge GM, Gleeson AC (1984) A comparison of methods of estimating lucerne population for monitoring persistence. Australian Journal of Experimental Agriculture 24, 174-177.
| Crossref | Google Scholar |
Makkar HPS (1993) Antinutritional factors in foods for livestock. BSAP Occasional Publication 16, 69-85.
| Crossref | Google Scholar |
Marshall CJ, Beck MR, Garrett K, Castillo AR, Barrell GK, Al-Marashdeh O, Gregorini P (2022) The effect of feeding a mix of condensed and hydrolyzable tannins to heifers on rumen fermentation patterns, blood urea nitrogen, and amino acid profile. Livestock Science 263, 105034.
| Crossref | Google Scholar |
Masters DG (2018) Practical implications of mineral and vitamin imbalance in grazing sheep. Animal Production Science 58, 1438-1450.
| Crossref | Google Scholar |
McSweeney CS, Palmer B, McNeill DM, Krause DO (2001) Microbial interactions with tannins: nutritional consequences for ruminants. Animal Feed Science and Technology 91, 83-93.
| Crossref | Google Scholar |
Min BR, Barry TN, Attwood GT, McNabb WC (2003) The effect of condensed tannins on the nutrition and health of ruminants fed fresh temperate forages: a review. Animal Feed Science and Technology 106, 3-19.
| Crossref | Google Scholar |
MLA (Meat & Livestock Australia) (2022) Livestock distribution maps. Available at https://www.mla.com.au/prices-markets/Trends-analysis/livestock-distribution-maps/
Mueller-Harvey I, Bee G, Dohme-Meier F, et al. (2019) Benefits of condensed tannins in forage legumes fed to ruminants: Importance of structure, concentration, and diet composition. Crop Science 59, 861-885.
| Crossref | Google Scholar |
Muir SK, Kennedy AJ, Kearney G, Hutton P, Thompson AN, Vercoe P, Hill J (2020) Offering subterranean clover can reduce methane emissions compared with perennial ryegrass pastures during late spring and summer in sheep. Animal Production Science 60, 1449-1458.
| Crossref | Google Scholar |
NATA (2024) ISO/IEC 17025. Testing and calibration laboratories. Available at https://www.iso.org/ISO-IEC-17025-testing-and-calibration-laboratories.html
Nichols PGH, Loi A, Nutt BJ, et al. (2007) New annual and short-lived perennial pasture legumes for Australian agriculture – 15 years of revolution. Field Crops Research 104, 10-23.
| Crossref | Google Scholar |
Nichols PGH, Revell CK, Humphries AW, Howie JH, Hall EJ, Sandral GA, Ghamkhar K, Harris CA (2012) Temperate pasture legumes in Australia – their history, current use, and future prospects. Crop & Pasture Science 63, 691-725.
| Crossref | Google Scholar |
Nie ZN, Miller S, Moore GA, Hackney BF, Boschma SP, Reed KFM, Mitchell M, Albertsen TO, Clark S, Craig AD, Kearney G, Li GD, Dear BS (2008) Field evaluation of perennial grasses and herbs in southern Australia. 2. Persistence, root characteristics and summer activity. Australian Journal of Experimental Agriculture 48, 424-435.
| Crossref | Google Scholar |
Oskoueian E, Abdullah N, Oskoueian A (2013) Effects of flavonoids on rumen fermentation activity, methane production, and microbial population. BioMed Research International 2013, 349129.
| Crossref | Google Scholar |
Patra AK, Saxena J (2009) The effect and mode of action of saponins on the microbial populations and fermentation in the rumen and ruminant production. Nutrition Research Reviews 22, 204-219.
| Crossref | Google Scholar | PubMed |
Pembleton KG, Tozer KN, Edwards GR, Jacobs JL, Turner LR (2015) Simple versus diverse pastures: opportunities and challenges in dairy systems. Animal Production Science 55, 893-901.
| Crossref | Google Scholar |
Peoples MB, Brockwell J, Hunt JR, Swan AD, Watson L, Hayes RC, Li GD, Hackney B, Nuttall JG, Davies SL, Fillery IRP (2012) Factors affecting the potential contributions of N2 fixation by legumes in Australian pasture systems. Crop & Pasture Science 63, 759-786.
| Crossref | Google Scholar |
Pepeta BN, Hassen A, Tesfamariam EH (2024) Quantifying the impact of different dietary rumen modulating strategies on enteric methane emission and productivity in ruminant livestock: a meta-analysis. Animals 14, 763.
| Crossref | Google Scholar | PubMed |
Provenza FD, Villalba JJ, Dziba LE, Atwood SB, Banner RE (2003) Linking herbivore experience, varied diets, and plant biochemical diversity. Small Ruminant Research 49, 257-274.
| Crossref | Google Scholar |
Raynor EJ, Kutz M, Thompson LR, Carvalho PHV, Place SE, Stackhouse-Lawson KR (2024) Impact of growth implants and low-level tannin supplementation on enteric emissions and nitrogen excretion in grazing steers. Translational Animal Science 8, txae115.
| Crossref | Google Scholar |
Reed KFM, Nie ZN, Miller S, Hackney BF, Boschma SP, Mitchell ML, Albertsen TO, Moore GA, Clark SG, Craig AD, Kearney G, Li GD, Dear BS (2008) Field evaluation of perennial grasses and herbs in southern Australia. 1. Establishment and herbage production. Australian Journal of Experimental Agriculture 48, 409-423.
| Crossref | Google Scholar |
Refshauge G, Newell MT, Hopkins DL, Holman BWB, Morris S, Hayes RC (2022) The plasma and urine mineral status of lambs offered diets of perennial wheat or annual wheat, with or without lucerne. Small Ruminant Research 209, 106639.
| Crossref | Google Scholar |
Rochfort S, Parker AJ, Dunshea FR (2008) Plant bioactives for ruminant health and productivity. Phytochemistry 69, 299-322.
| Crossref | Google Scholar | PubMed |
Rogers ME, West DW (1993) The effects of rootzone salinity and hypoxia on shoot and root growth in Trifolium species. Annals of Botany 72, 503-509.
| Crossref | Google Scholar |
Roldan MB, Cousins G, Muetzel S, Zeller WE, Fraser K, Salminen J-P, Blanc A, Kaur R, Richardson K, Maher D, Jahufer Z, Woodfield DR, Caradus JR, Voisey CR (2022) Condensed tannins in white clover (Trifolium repens) foliar tissues expressing the transcription factor TaMYB14-1 bind to forage protein and reduce ammonia and methane emissions in vitro. Frontiers in Plant Science 12, 777354.
| Crossref | Google Scholar |
Salem AZM, López S, Robinson PH (2012) Plant bioactive compounds in ruminant agriculture – impacts and opportunities. Animal Feed Science and Technology 176, 1-4.
| Crossref | Google Scholar |
Santander D, Clariget J, Banchero G, Alecrim F, Simon Zinno C, Mariotta J, Gere J, Ciganda VS (2023) Beef steers and enteric methane: reducing emissions by managing forage diet fiber content. Animals 13, 1177.
| Crossref | Google Scholar | PubMed |
Siah SD, Agboola S, Wood JA, Konczak I, Blanchard CL (2019) A comparison study of phenolic contents and in vitro antioxidant activities of Australian grown faba beans (Vicia faba L.) varying in seed coat colours as affected by extraction solvents. American Journal of Analytical Chemistry 10, 227-245.
| Crossref | Google Scholar |
Singleton VL, Rossi JA (1965) Colorimetry of total phenolics with phosphomolybdic-phosphotungstic acid reagents. American Journal of Enology and Viticulture 16, 144-158.
| Crossref | Google Scholar |
Takagi H, Block E (1991) Effects of manipulating dietary cation–anion balance on macromineral balance in sheep. Journal of Dairy Science 74, 4202-4214.
| Crossref | Google Scholar | PubMed |
Tavendale MH, Meagher LP, Pacheco D, Walker N, Attwood GT, Sivakumaran S (2005) Methane production from in vitro rumen incubations with Lotus pedunculatus and Medicago sativa, and effects of extractable condensed tannin fractions on methanogenesis. Animal Feed Science and Technology 123, 403-419.
| Crossref | Google Scholar |
’t Mannetje L, Haydock KP (1963) The dry-weight-rank method for the botanical analysis of pasture. Grass and Forage Science 18, 268-275.
| Crossref | Google Scholar |
Thomas DT, Sanderman J, Eady SJ, Masters DG, Sanford P (2012) Whole farm net greenhouse gas abatement from establishing kikuyu-based perennial pastures in south-western Australia. Animals 2, 316-330.
| Crossref | Google Scholar | PubMed |
UNEP (2021) The climate and clean air coalition – methane. United Nations Environment Programme. Available at https://www.unep.org/topics/energy/methane/climate-and-clean-air-coalition-ccac
UNFCCC (2016) The Paris agreement. United Nations Framework Convention on Climate Change (UNFCCC). Available at https://unfccc.int/sites/default/files/resource/parisagreement_publication.pdf
Verma S, Wolffram S, Salminen J-P, Hasler M, Susenbeth A, Blank R, Taube F, Kluß C, Malisch CS (2022) Linking metabolites in eight bioactive forage species to their in vitro methane reduction potential across several cultivars and harvests. Scientific Reports 12, 10454.
| Crossref | Google Scholar | PubMed |
Wallace RJ (2004) Antimicrobial properties of plant secondary metabolites. Proceedings of the Nutrition Society 63, 621–629. 10.1079/pns2004393
Wilson RL, Bionaz M, MacAdam JW, Beauchemin KA, Naumann HD, Ates S (2020) Milk production, nitrogen utilization, and methane emissions of dairy cows grazing grass, forb, and legume-based pastures. Journal of Animal Science 98, skaa220.
| Crossref | Google Scholar |
Xu BJ, Chang SKC (2007) A comparative study on phenolic profiles and antioxidant activities of legumes as affected by extraction solvents. Journal of Food Science 72, S159-S166.
| Crossref | Google Scholar | PubMed |