

A novel Leifsonia xyli subsp. xyli quantitative LAMP-based diagnostic correlated with sugarcane ratoon stunting disease rating
Moutoshi Chakraborty A B * , Shamsul A. Bhuiyan C D , Simon Strachan B C , Sithi Saha D , Rabbee G. Mahmudunnabi B C , Nam-Trung Nguyen C , Muhammad J. A. Shiddiky B C E and Rebecca Ford A B
A
B
C
D
E
Abstract
Ratoon stunting disease (RSD), caused by Leifsonia xyli subsp. xyli (Lxx), poses a significant economic threat to sugarcane (Saccharum hybrid) worldwide. RSD is hard to manage due to its elusive visible symptomology and disease rating of cultivars is subjective.
We aimed to develop a sensitive, rapid, and quantitative Lxx diagnostic method able to correlate Lxx titre and disease resistance rating of sugarcane cultivars.
A Lxx diagnostic method was developed using heat lysis-based reagent-free DNA isolation from xylem sap followed by loop-mediated isothermal amplification (LAMP)-based colorimetric and fluorescence quantification within a single microcentrifuge tube. Bacterial titre was then statistically correlated with industry-agreed disease resistance ratings for key sugarcane cultivars.
The diagnostic was highly sensitive (1 cell/μL) and reproducible (%s.d. = <5%, for n = 3), and showed excellent linear dynamic range (i.e. 10 pM−1 aM or 107−100 copies/μL, r = 0.99) for quantitative Lxx detection. LAMP quantifications were completely concordant with quantitative polymerase chain reaction quantification from the same samples. Additionally, a strong correlation was determined between the detected quantitative bacterial titres and known cultivar disease resistance ratings (r = 0.82, n = 10, P < 0.001).
The novel LAMP-based Lxx diagnostic was validated as a fast, simple, and relatively cost-effective means of RSD resistance rating, making it a reliable contribution towards RSD management.
The development of this diagnostic tool provides a practical solution for accurately measuring Lxx titre and assessing disease resistance in sugarcane plants, aiding in effective risk management of RSD spread, and mitigating its economic impact on sugarcane crops worldwide.
Keywords: diagnostic method, disease resistance ratings, isothermal amplification, nucleic acid isolation, quantitative detection, ratoon stunting disease, screening for disease resistance, sugarcane.
Introduction
Ratoon stunting disease (RSD) is an insidious and damaging sugarcane disease, causing significant production losses of 12% to 37% under normal growing conditions and up to 60% under water stress (Bailey and Bechet 1997). Following its first report in Queensland, Australia in 1944, RSD has affected the global sugarcane industry (Gillaspie 1989; Young and Brumbley 2004). RSD is caused by a gram-positive, xylem-inhabiting, coryneform bacterium Leifsonia xyli subsp. xyil (Lxx), and the resulting disease is challenging to diagnose due to the lack of specific external symptoms and the ambiguous nature of internal symptoms (Davis et al. 1980). In addition, growers frequently attribute poor ratooning performance to other factors like soil-borne fungi, nematodes, or nutrient stress (Magarey 1994; Young 2018). Once detected, managing RSD involves using clean seed cane, farm hygiene, and removing potential bacterial reservoirs like volunteer crops before replanting, and planting of moderately resistant varieties to reduce the risk of potential disease spread where best practice management is not possible. Clean and disease-free materials are achieved through the use of hot water, antibiotics, moist air, and aerated steam treatments (Benda and Ricaud 1978; Gul and Hassan 1995). However, heat treatment often fails to completely eradicate Lxx, leading to the spread of the disease in so-called ‘pathogen-free’ nurseries from which planting material is sourced (Damann and Benda 1983).
Therefore, the strategy to manage RSD in sugarcane crops involves a combination of planting resistant varieties where available, maintaining farm hygiene, and planting disease-free seed cane (Comstock 2002; Hoy 2017). Accordingly, RSD resistance has been a key sugarcane breeding goal since the early 2000s (Comstock et al. 2001). Although some variability in disease reaction among sugarcane germplasms offers hope for selecting this crucial trait (Roach 1988, 1992; Roach and Jackson 1992; Croft and Johnson 2013), most currently employed cultivars have low to no RSD resistance, and to date, breeding for stable resistance has not been achieved (Young 2016; Bhuiyan et al. 2021). This may be due to the quantitative and recessive nature of the resistance trait (You et al. 2021) and/or the genetic bottlenecks that have been created through selective breeding strategies directed primarily at agronomic and elevated brix levels, and with the unintentional exclusion of disease resistance traits (Kull et al. 2003; Li et al. 2022). To address this, novel resistance sources must be sought from genetically diverse germplasms, akin to reintroducing disease resistance in wild relatives of sugarcane and related crop species such as Napier grass (Wamalwa et al. 2017), barley (Li et al. 2022) and wheat (Sharma et al. 2021). To enable this, and for daily disease management, a fast and accurate diagnostic tool that can also be applied to identify resistant germplasm in large-scale screening programs would be highly valuable. Previously, Steindl (1974) had noted that plants with a lower bacterial colonisation within the vascular bundles were more resistant to RSD, and this was also observed by Teakle et al. (1978). Although a direct correlation between Lxx titre and resistance level has been established, the variations in sensitivity among current methods make it difficult to assign reliable resistance ratings. The application of a fast, precise, and sensitive Lxx detection method could streamline the evaluation of resistance during cultivar selection processes, providing invaluable assistance in managing RSD effectively on farms (Zhao et al. 2015).
To date, several methods have been reported for identifying Lxx and determining RSD ratings in sugarcane varieties. For this, Gillaspie and Teakle (1989) compared the yields among RSD-infected and RSD-free trials to evaluate RSD reactions. Subsequently, Roach and Jackson (1992) scored RSD reactions on a scale (0–9) based on the amount of Lxx bacteria detected in sugarcane clone sap via phase contrast microscopy (PCM). Then, Gagliardi and Camargo (2009) evaluated RSD reactions by measuring field yield loss with or without RSD inoculation and categorised germplasm as susceptible, moderately resistant, or tolerant. To increase the throughput, Harrison and Davis (1988) developed a tissue blot-enzyme immunoassay (TB-EIA) to estimate Lxx-infected vascular bundles. Davis et al. (1994) then improved the TB-EIA for large-scale screening of genotypes for RSD resistance, which proved more accurate than PCM. Following this, Croft (2002) devised an evaporative-binding enzyme-linked immunosorbent assay (EBEIA) to rate sugarcane cultivars for RSD resistance, demonstrating significant variations among cultivars in bacterial titres. Although correlation between titre and disease rating was determined, these techniques were limited by lack of sensitivity, and were labour and time-intensive (Chakraborty et al. 2024). Subsequently, specific and sensitive Lxx detection and quantification methods, including polymerase chain reaction (PCR) and fluorescence-based quantitative real-time PCR (qPCR), were developed and applied to predict RSD disease rating (Deng et al. 2004; Grisham et al. 2007; Que et al. 2008; Carvalho et al. 2010; Young et al. 2016; Ngo et al. 2023). Despite their sensitivity (104 to 101 cells/μL), these methods have been underutilised due to their complexity in application, cost, lack of portability, and the requirement of labour-intensive DNA extraction and purification procedures (Ghai et al. 2014; Chen et al. 2018). To overcome these obstacles, a simpler, cost-effective, and user-friendly method is needed for Lxx diagnostic quantification that is correlated to disease rating and requires little to no chemical reagents for sample processing, suitable for growers and extension workers with minimal training.
To simplify and speed up an Lxx diagnostic, a field-applicable reagent-free heat-induced DNA isolation method for efficient release of Lxx DNA may be assessed, bypassing multistep processing, and using commercial kits. Indeed, high temperatures are known to degrade microorganism cell walls, releasing nuclear content (Goodwin and Lee 1993; Lou et al. 1993; Strus 1997; Jose and Brahmadathan 2006; Merk et al. 2006; Umer et al. 2021). Specifically, Jose and Brahmadathan (2006) found 94°C for 2 min sufficient for bacterial cell wall denaturation. This technique has been used previously to release bacterial nucleic acid from various biological samples (Dashti et al. 2009; Ghai et al. 2014; Smyrlaki et al. 2020; Umer et al. 2021). Combining this method with loop-mediated isothermal amplification (LAMP) offers a simple method for Lxx detection and quantification. LAMP is known for its simplicity, cost-effectiveness, and rapidity in detecting plant pathogens, even within crude extracts, and is preferred over PCR-based methods, which may be hindered by amplification inhibitors (Tsai et al. 2009; Francois et al. 2011). To date, several Lxx LAMP protocols have been developed (Liu et al. 2013; Ghai et al. 2014; Naidoo et al. 2017; Wu et al. 2018). However, none have been used to correlate Lxx titre with cultivar for RSD disease resistance rating. Therefore, this study aimed to (i) develop a novel LAMP-based method combined with a rapid and reagent-free Lxx DNA isolation technique for in-situ detection and quantification of Lxx bacteria from sugarcane sap samples, (ii) validate the quantitative accuracy of the Lxx diagnostic protocol via qPCR, and (iii) apply the developed two-stage diagnostic to correlate with pre-established RSD ratings in a range of sugarcane cultivars of known susceptibility/resistance.
Materials and methods
Source and production of inoculum
Leifsonia xyli subsp. xyli (Lxx) was isolated from naturally infected sugarcane plants grown at the Sugar Research Australia (SRA), Woodford Pathology Research Station, Woodford, Queensland, Australia (S 26.93°, E 152.78°). For this, stalks were cut at the base using sterilised secateurs and scrubbed to eliminate any extraneous material. Afterward, a small air compressor (Boss Air Suspension, Queensland, Australia) with an attached soft rubber cup was used to provide positive pressure to the stalk from the basal nodal and internodal regions to push the sap out of the vascular bundles. The sap was collected in 15 mL centrifuge tubes and immediately kept on ice during transport to Griffith University, Nathan campus. The extracted sap was then filtered using a 0.2 μm syringe fitted filter and aliquoted into 1.5 mL microcentrifuge tubes. For Lxx culturing, 2 mL of the sap was also added to 100 mL of modified liquid broth S8 medium and incubated at 28°C for 4 weeks with gentle shaking at 200 rpm in the dark according to Sugar Research Australia’s (SRA) industry protocol (Davis et al. 1980; Brumbley et al. 2002).
Sugarcane leaf scald (LS) disease-causing bacteria, Xanthomonas albilineans (Xalb), were used as a negative control. Xalb strain 3/14/9 was obtained from SRA, Indooroopilly Research Station, Queensland, cultured in modified Wilbrink’s broth media and incubated at 28°C for 5 days according to the industry protocol (Dawson 1957). The culture flasks were incubated in temperature-controlled shakers with gentle shaking at 250 rpm until the OD600 reached approximately 0.5, where Lxx and Xalb cell densities were calculated to be 4 × 10⁸ cfu/mL and 16 × 108 cfu/mL, respectively (Monteiro-Vitorello et al. 2004; Mira et al. 2022). Each measurement was conducted in triplicate for three repeated experiments.
Establishment of field trial, inoculation, and planting
An RSD field trial was established at SRA’s Pathology Research Station, Woodford, Queensland, Australia in September 2020. Ten sugarcane genotypes with known disease ratings for RSD (Ngo et al. 2023) were sourced from a disease-free propagation block in Kallangur (S 27.235°, E 153.01°), Queensland, approximately 50 km south of SRA’s Pathology Research Station. Stalks were cut into one-budded setts using an electric saw and washed in tap water to remove dirt and debris (Table 1). Sugarcane setts were then treated in 52°C hot water for 30 min and dried before inoculation with Lxx. Inoculation of the one-budded setts was done by soaking them in a suspension of 16 × 108 cfu/mL of lab-grown Lxx cells measured at OD600 following the method described by Ngo et al. (2023). The inoculated setts were then kept in trays under LED lights covered with moistened vermiculite at 30°C with 60–80% humidity for 2 weeks in a germination chamber. Subsequently, they were planted in a field at the SRA Pathology Research Station, Woodford in a randomised complete block design, with three replications consisting of six plants each.
| Variety | RSD rating | Rating category | |
|---|---|---|---|
| Q253 | 8 | Susceptible | |
| SRA26 | 6 | Intermediate susceptible | |
| Q242 | 7 | Susceptible | |
| Q232 | 6 | Intermediate susceptible | |
| SRA20 | 8 | Susceptible | |
| WSRA24 | 4 | Intermediate resistant | |
| SRA22 | 3 | Moderately resistant | |
| Q208 | 5 | Intermediate resistant | |
| CP72-2086 | 3 | Moderately resistant | |
| Ho06-537 | 3 | Moderately resistant |
Sugarcane field samples
Xylem sap samples were collected from three stalks (i.e. one stalk/replication) harvested at 53 weeks after inoculation, when the stalks produced at least two to three visible internodes above-ground. Xylem sap extracts (2 mL/variety) were collected as previously described (Croft et al. 1994) and stored at −20°C until processing. Sap samples were collected from the following genotypes: CP72-2086, Ho06-537, Q232, Q253, SRA20, Q208, WSRA24, Q242, SRA26, and SRA22, all with previously designated and industry accepted RSD disease ratings based on ELISA and/or qPCR studies (Croft et al. 1994; Croft 2002; Croft and Johnson 2013; Ngo et al. 2023). The disease ratings employed in this study were on a 0 to 9 scale and adapted from Ngo et al. (2023; Table 1).
Reagents and materials
All reagents and chemicals used in this study were of analytical grade. Nuclease-free water (Integrated DNA Technologies, Australia) was used to prepare all aqueous solutions. PureLink™ Microbiome DNA purification kits were purchased from Thermo Fisher Scientific (Australia). Designed primers and synthetic targets (4.2 × 10⁷ copies/μL) were purchased from Integrated DNA Technologies (USA). WarmStart® Colorimetric LAMP 2X Master Mix and WarmStart® Multi-Purpose RT-LAMP 2X Master Mix, and 2X SensiFAST SYBER No-ROX Master Mix were purchased from New England Biolabs (Ipswich, MA, USA), and Meridian Bioscience (Cincinnati, Ohio, USA), respectively. All other reagents were purchased from Sigma-Aldrich (USA).
Reagent-free DNA isolation method
To develop a standard detection curve using a heat-induced reagent-free rapid DNA isolation method, a range of known concentrations of cultured Lxx cells (107−100 cells/μL) were inoculated into 1 mL of freshly extracted and ‘clean’ sugarcane xylem sap. Subsequently, the mixtures were boiled at 95°C for 2 min in a digital heat block (Morganville Scientific, USA). Then, 2 μL aliquots of the cooled supernatant were used as templates for LAMP or qPCR assays. Once the detection thresholds were established, 100 μL volumes of field-collected and naturally infected sap samples were subjected to the same method and 2 μL of the resulting supernatant was again used for LAMP or qPCR. Each experiment was performed in triplicate and repeated three times to ensure accuracy and reliability.
Commercial kit for DNA extraction
Genomic DNA of Lxx was extracted from the known numbers of Lxx cultured cells (107−100 cells/μL) and RSD-infected field samples for qPCR analysis according to the described protocol of a commercial kit (The PureLink™ Microbiome DNA purification kit manual, Thermo Fisher Scientific, Australia). Each experiment was conducted in triplicate and repeated three times.
Target selection and primer design
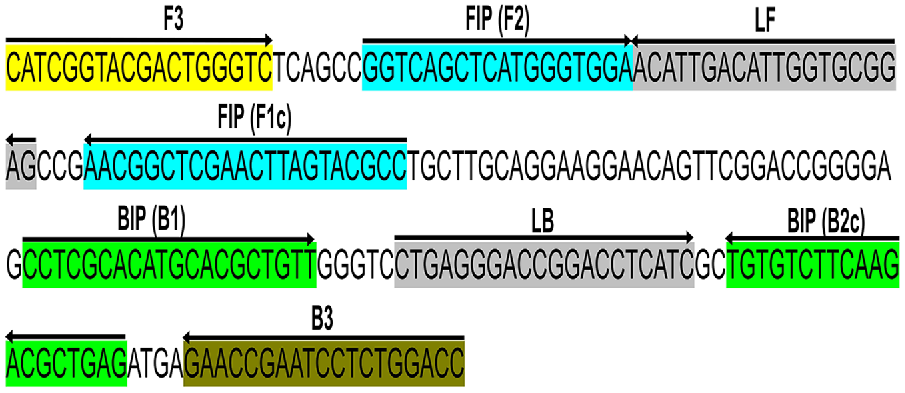
Primers were designed targeting a 210 bp conserved section of the Lxx intergenic spacer (IGS) region between the 16S and 23S rRNA genes (GenBank accession no. AE016822.1) corresponding to positions 1,35,389–1,35,598 in L. xyli subsp. xyli strain CTCB07 complete genome (National Center for Biotechnology Information (NCBI) 1988). This locus was chosen because of its single copy number status (Supplementary Fig. S1) (Monteiro-Vitorello et al. 2004, 2013) and had no significant similarity to any other sequences available in GenBank (searched on 26/04/2022). For qPCR analysis, forward and reverse primers (LxxFP and LxxRP respectively, Table 2) were designed using the NCBI primer blast web tool with standard parameters (Ye et al. 2012). For LAMP analysis, two loop primers (LxxLF and LxxLP), two outer primers (LxxF3 and LxxB3), and two inner primers (LxxFIP and LxxBIP) were designed using the NEB LAMP primer designing tool, again with standard parameters (https://lamp.neb.com) (Table 2) (Fig. 1). The specificity of each primer was confirmed by screening each sequence using the BLASTn (Chen et al. 2015) tool against the NCBI nucleotide and genome databases. All the sequences were found to be 100% homologous to the corresponding Lxx sequences (Chen et al. 2015) and no close matches (E < 10) was found. The OligoAnalyzer™ Tool (Integrated DNA Technologies Inc., USA) was used to assess the possibility of the formation of hairpins and dimers.
| Names of synthetic targets and primers | Sequence (5′−3′) | Length (nt) | E-value | GC (%) | |
|---|---|---|---|---|---|
| LxxSTS | CATCGGTACGACTGGGTCTCAGCCGGTCAGCTCATGGGTGGAACATTGACATTGGTGCGGAGCCGAACGGCTCGAACTTAGTACGCCTGCTTGCAGGAAGGAACAGTTCGGACCGGGGAGCCTCGCACATGCACGCTGTTGGGTCCTGAGGGACCGGACCTCATCGCTGTGTCTTCAAGACGCTGAGATGAGAACCGAATCCTCTGGACC | 210 | 2× 10-103 | 59 | |
| LxxF3 | CATCGGTACGACTGGGTC | 18 | 38 | 61.1 | |
| LxxB3 | GGTCCAGAGGATTCGGTTC | 19 | 9.6 | 57.8 | |
| LxxFIP (F1c-F2) | GGCGTACTAAGTTCGAGCCGTT- GGTCAGCTCATGGGTGGA | 22–18 | 0.16–38 | 54.5–61.1 | |
| LxxBIP (B1-B2c) | CCTCGCACATGCACGCTGTT-CTCAGCGTCTTGAAGACACA | 20–20 | 2.4–2.4 | 60–50 | |
| LxxLF | CTCCGCACCAATGTCAATGT | 20 | 2.4 | 50 | |
| LxxLB | CTGAGGGACCGGACCTCATC | 20 | 2.4 | 65 | |
| LxxFP | CATCGGTACGACTGGGTC | 18 | 38 | 61.1 | |
| LxxRP | GGTCCAGAGGATTCGGTTC | 19 | 9.6 | 57.9 |
Here, E-value refers to the ‘Primer Efficiency value’, and GC refers to the percentage of guanine (G) and cytosine (C) bases in the primer sequence.
Schematic illustration of the primer design for the proposed LAMP assay representing the position of the eight primers spanning the target gene and the nucleotide sequences of the intergenic spacer (IGS) region between 16S and 23S ribosomal RNA (rRNA) genes (GenBank accession no. AE016822.1). Sequence corresponds to positions 1,35,389–1,35,598 of L. xyli subsp. xyli strain CTCB07. The sense sequence is denoted by the right arrow, and the complementary sequence is denoted by the left arrow.
LAMP reaction conditions
LAMP mixtures for fluorescent or colorimetric analyses were prepared according to the protocols described in the WarmStart® Multi-Purpose RT-LAMP 2X Master Mix and WarmStart® Colorimetric LAMP 2X Master Mix (New England Biolabs, USA) manuals with slight modifications. WarmStart RT-LAMP reactions were carried out in a 25 μL mixture containing 2.5 μL of 10X LAMP primer concentration (2 μM each LxxF3 and LxxB3, 16 μM each LxxFIP and LxxBIP, 4 μM each of LxxLF and LxxLB), 12.5 μL of 2X WarmStart Multi-purpose master mix, 0.5 μL SYBR Green fluorescent dye, 2 μL of DNA template and 8 μL of nuclease-free water. WarmStart colorimetric LAMP reactions were also carried out in a 25 μL mixture containing 2.5 μL of 10X LAMP primer concentration (2 μM each of LxxF3 and LxxB3, 16 μM each of LxxFIP and LxxBIP, 4 μM each of LxxLF and LxxLB), 12.5 μL of 2X WarmStart colorimetric LAMP master mix, 2 μL of DNA template, and 8 μL of nuclease-free water. The mixture was incubated at 65°C for 40 min in a CFX96 Touch Real-Time PCR Detection System (Bio-Rad Laboratories Pty Ltd, Australia). Products were kept at 4°C for further analysis. The 25 μL colorimetric LAMP product volumes were inspected visually in the 200 μL tubes. Samples that turned yellow were considered Lxx-positive, and those that remained pink were assumed to be Lxx-negative, as per the manufacturer’s instructions (New England Biolabs, USA). Variations in colour gradient were linked to pathogen loads, with intense yellow colour indicating higher concentrations of Lxx, and pinkish-yellow shades suggesting lower levels of Lxx present in the samples. The colour change achieved in the colorimetric LAMP reaction was captured with a mobile camera. Sterile distilled water (ddH2O) and fresh ‘clean’ sap served as the no-target controls (NTC), and Xalb cells and purified DNA from Xalb cells were used as negative controls (NC). Each experiment was performed in triplicate with three repetitions.
qPCR assay and gel documentation
To validate the LAMP assay, qPCR experiments were devised to detect the targeted intergenic spacer (IGS) region using synthetic targets, bacterial cell samples, and sugarcane sap samples collected from the field. RSD detection from sugarcane xylem sap samples was done using two conventional qPCR methods: (i) Using directly expressed xylem sap samples in the PCR reactions as a template (Goodwin and Lee 1993; Ghai et al. 2014), or (ii) Using a commercial kit to extract Lxx DNA from the sugarcane sap samples before using as a template. The qPCR analyses were conducted following the 2X SensiFAST SYBER No-ROX Master Mix manual (New England Biolabs, USA). A CFX96 Touch Real-Time PCR Detection System (Bio-Rad Laboratories Pty Ltd, Australia) was used with the following reaction conditions: initial denaturation at 100°C for 1 min; 40 cycles at 98°C for 15 s, 52°C for 30 s and 72°C for 30 s; followed by heating at 72°C for 2 min to terminate the reaction and a hold of 4°C for 5 minutes. The quantification cycle (Cq) value of each dilution was analysed at the end of the reaction and Lxx was considered present if a positive result was observed in less than 40 cycles. Each assay was performed in triplicate for three repeated experiments. For gel documentation, an aliquot of 5 μL of each LAMP or PCR product was loaded on 1% agarose, electrophoresed in 1X Tris-acetate-EDTA (TAE) buffer at 90 V for 40 min, stained with SYBR safe and visualised using UV light under gel documentation system. A 100 bp GeneRuler (Thermo Fisher Scientific, Australia) was used to estimate the sizes of amplified products.
Statistical analysis
Serial dilutions of known L. xyli subsp xyli target sequence, Lxx cells, and purified genomic DNA concentrations were used to generate a standard curve for the absolute quantification of Lxx. This was then used to determine the sensitivity and detection threshold of the qPCR. The standard curve was represented as a semi-log regression line plot of Cq values versus the −log of the input DNA template amounts. The efficiencies (E) of the fluorescence LAMP and qPCR assays were calculated using E = (10−1/slope) − 1. Validation of fluorescence LAMP and qPCR results with target-specific primers was achieved when E-values were between 0.9 and 1.1, with E-values closer to 1.0 indicating higher amplification efficiency (Wu et al. 2018). The determination of Lxx quantity relied on Cq values derived from the analysis of xylem sap samples. This was then correlated with established disease resistance ratings, as demonstrated in earlier studies (Davis et al. 1988; Ngo et al. 2023). Consequently, a linear mixed model was fitted to the Cq datasets using proc mixed in SAS version 9.4 (SAS Institute, Cary, NC, USA), where varieties were treated as fixed effects, and block (replication) and the error term (residual) were treated as random effects. For the appropriate significance factors, protected-mean comparisons of all possible pairwise differences of the Cq values were tested at alpha = 0.05, using Fisher’s protected l.s.d. test. PDMIX800 SAS Macro was then used to convert mean separation outputs to letter groupings (Saxton 1998). Spearman rank correlation was then conducted between the outputs of the LAMP and qPCR methods to determine the relatedness and accuracy of the newly developed method. Statistical analyses were performed using OriginPro 2022 v.9.9.0.225 (OriginLab, Northampton, Massachusetts, USA), and Microsoft Excel 365 (USA). Graphical representations of data were carried out using BioRender, SnapGene software (www.snapgene.com), and Microsoft Powerpoint 365 (USA). A mobile camera (Samsung Galaxy A52s) was used to capture the colour change during the colorimetric LAMP reaction. The mean value ± s.e. among all three replications were determined for each sample.
Results
Validation of novel Lxx target sequences and robustness of LAMP assay
The newly designed LAMP primer sets successfully amplified the targeted IGS region (210 bp) in both colorimetric and fluorescent LAMP assays using 10 pM (i.e. 107 copies/μL) synthetic target sequences, confirming their efficacy (Fig. S2). In colorimetric LAMP, a colour change from pink to yellow indicated positive responses where the Lxx targets were present, whereas NTC and NC reactions remained pink, indicating that the primers were specific and useful for naked-eye detection of Lxx (Fig. S2). Additionally, the positive colour change to yellow occurred in all eight serially diluted concentrations of synthetic target sequence (representing 107−100 copies/μL) with a threshold of detection of 1 copy/μL (1 ag/μL) (Fig. 2a). Accordingly, the fluorescent LAMP assay detected the synthetic targets in the infected sap only, and not in the NTC (Fig. S2). The LAMP amplification signal level was directly and reproducibly proportional to the target concentration (Fig. 2b and S3a), with a correlation coefficient (r) of 0.99. Again, the threshold of LAMP assay detection was 1 copy/μL (1 ag/μL) and subsequent gel electrophoresis confirmed amplification of the expected size (210 bp) only in positive reactions (Fig. S2 and S3b).
LAMP and qPCR primer pairs checking with different synthetic target concentrations. (a) Colorimetric LAMP detection for the designated concentrations; Tubes 1 to 8: 1:10 dilutions of the synthetic target (107−100 copies/μL, or 10 pg/μL-1 ag/μL); Tube 9: No Target Control (NTC). Obtained Cq value of (b) Fluorescence LAMP and (c) qPCR detection for the designated concentrations of synthetic targets (107−100 copies/μL, or 10 pg/μL-1 ag/μL). Error bars represent the standard deviation of three repetitive experiments (biological replications).
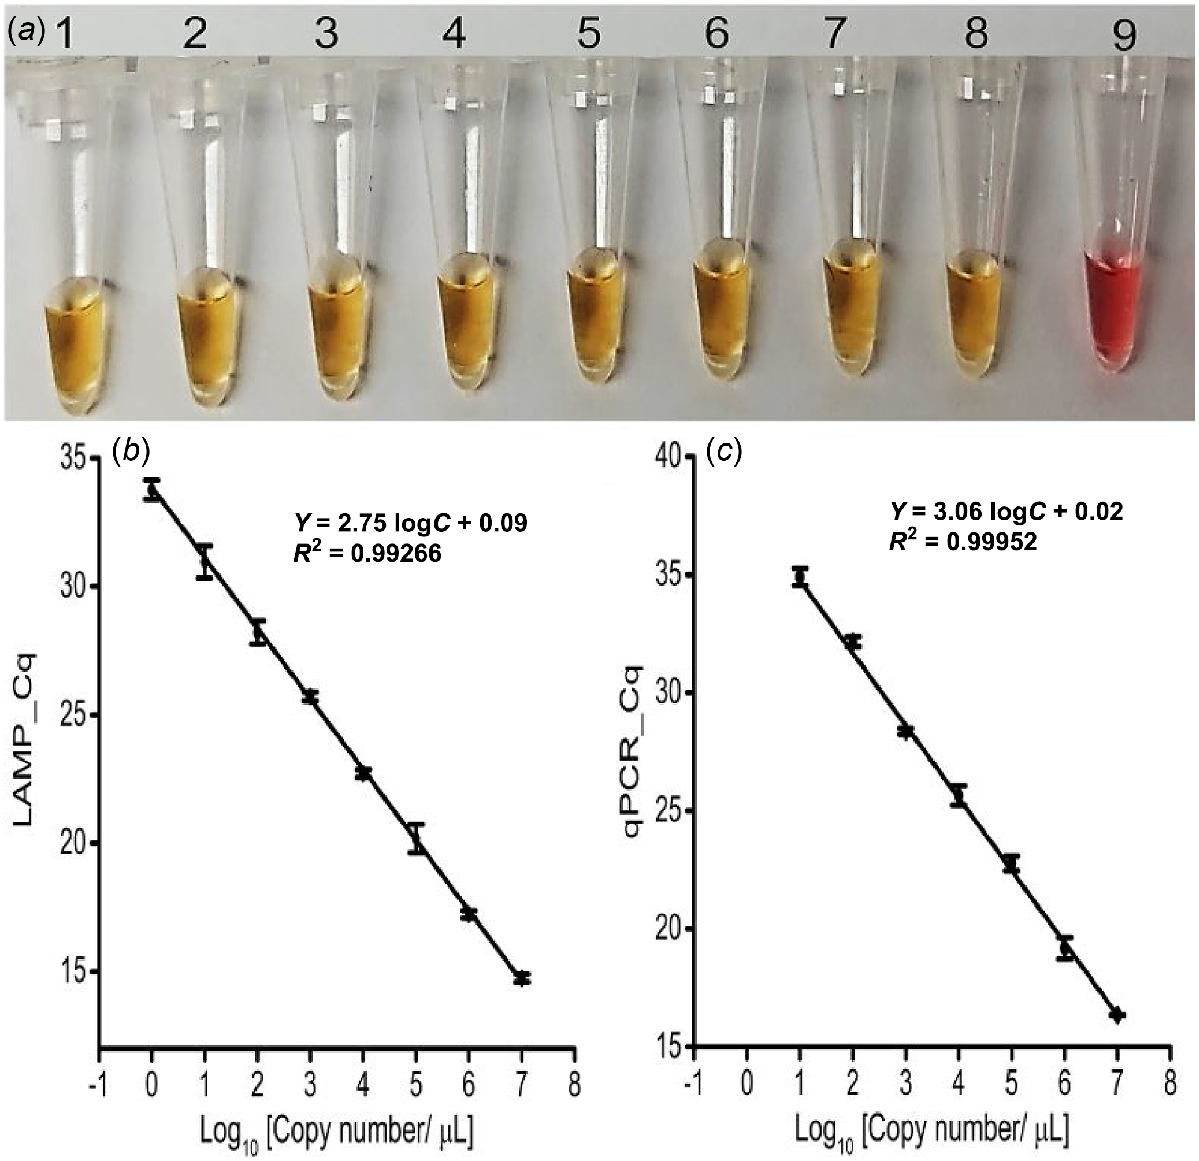
Successful qPCR amplification of the synthetic target (1 nM) at an annealing temperature of 52°C validated the LAMP assay results (Fig. S6a). Consequently, the qPCR standard curve with titrated synthetic target (ranging 107−100 copies/μL of Lxx; Fig. 2c) was established and had a detection threshold of 10 copies/μL (100 ag/μL), 10 times less sensitive than the LAMP assay (Fig. 2b). Meanwhile, a single amplicon of the correct size (210 bp) was visualised from only the positive samples (Figs S6b and S7c).
Validation of LAMP-based in-situ detection and quantification of Lxx
Using predetermined and titrated concentrations of Lxx cells (107 to 100 cells/μL), the detection threshold of the colorimetric LAMP assay was approximately ~1 cell/μL (Fig. 3a) and was the same for the fluorescence LAMP assay (s.d. = ≤5% (n = 3), and r = 0.99; Fig. 3b and S4a). Also, the expected LAMP amplicon (210 bp) was observed on agarose gel in only positive samples (Fig. S4b).
Sensitivity and specificity analysis. (a) Colorimetric LAMP detection for the designated samples; Tubes 1 to 8: 1:10 dilutions created by spiking cells into clean fresh sap (107−100 cells/μL); Tube 9: No Target Control (NTC); Tube 10: Known number of spiked Xalb cells (107 cells/μL). (b) Obtained Cq of fluorescence LAMP and qPCR detection for the designated number of Lxx cells spiked into fresh xylem sap (107−100 cells/μL); error bars represent the standard deviation of three repetitive experiments.
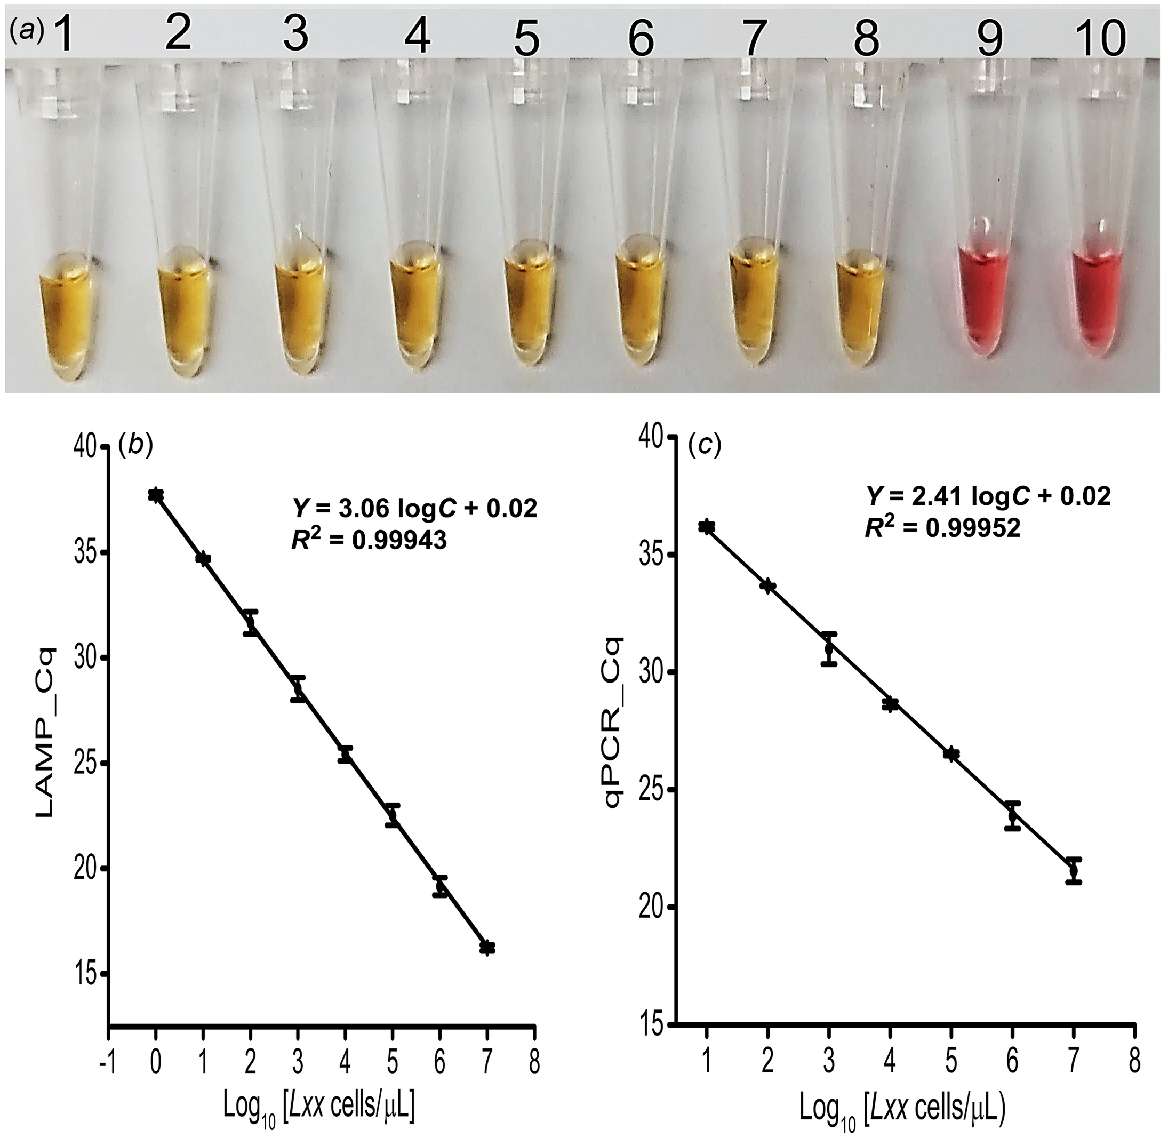
To validate the LAMP assay with Lxx cell samples, the standard plot for qPCR-based absolute quantification was obtained by plotting Cq values against a log of the corresponding amount of purified DNA extracted from the titrated Lxx cells. Consequently, qPCR effectively amplified the target region from the DNA extracted from as little as 100 Lxx cells (Fig. 3c and S7b). Again, the expected amplicon (210 bp) was observed on agarose gel in only positive sample reactions (Fig. S7d). There was a strong correlation (r = 0.99) between the Cq value from the LAMP and qPCR reactions. Also, the LAMP assay was 100 times more sensitive than the qPCR for in-situ detection and quantification of Lxx bacteria (Fig. 3b versus Fig. 3c).
Correlation of the new LAMP diagnostic with RSD resistance rating
To investigate the applicability of the assay for RSD resistance screening, the yellow colour was detected in all RSD-infected xylem sap samples from the 10 sugarcane varieties of known RSD resistance rating. Additionally, the gradient of the yellow colour was correlated with the industry resistance rating of the cultivar. The most intense colours were visualised from sap samples collected from more susceptible cultivars Q253, SRA26, SRA20, Q232, and Q242 (Fig. 4a, Tube # 1, 2, 8, 9 and 10), indicating high bacterial concentrations. In contrast, sap samples from more resistant cultivars Ho06-537, CP72-2086, Q208, SRA22, and WSRA24 (Fig. 4a, Tube # 3, 4, 5, 6, and 7) had a pinkish-yellow colour intensity in the reaction, suggesting lower bacterial concentrations (Table 1; Fig. 4a).
Field application of assay. (a) Colorimetric detection for all the analysed xylem sap samples collected from SRA Woodford RSD screening trials. Tubes 1 to 10: RSD-infected xylem sap samples- Q253, SRA26, Ho06-537, CP72-2086, Q208, SRA22, WSRA24, SRA20, Q232, and Q242; Tube 11: No Target Control (NTC); obtained Cq values for these samples, (b) fluorescence LAMP detection; qPCR detection of (c) directly on expressed xylem sap sample; (d) commercial kit-based DNA extraction technique; each bar is the mean of three replications, and bar(s) associated with same letter(s) are not significantly different according to Fisher’s protected l.s.d. test (P = 0.05).
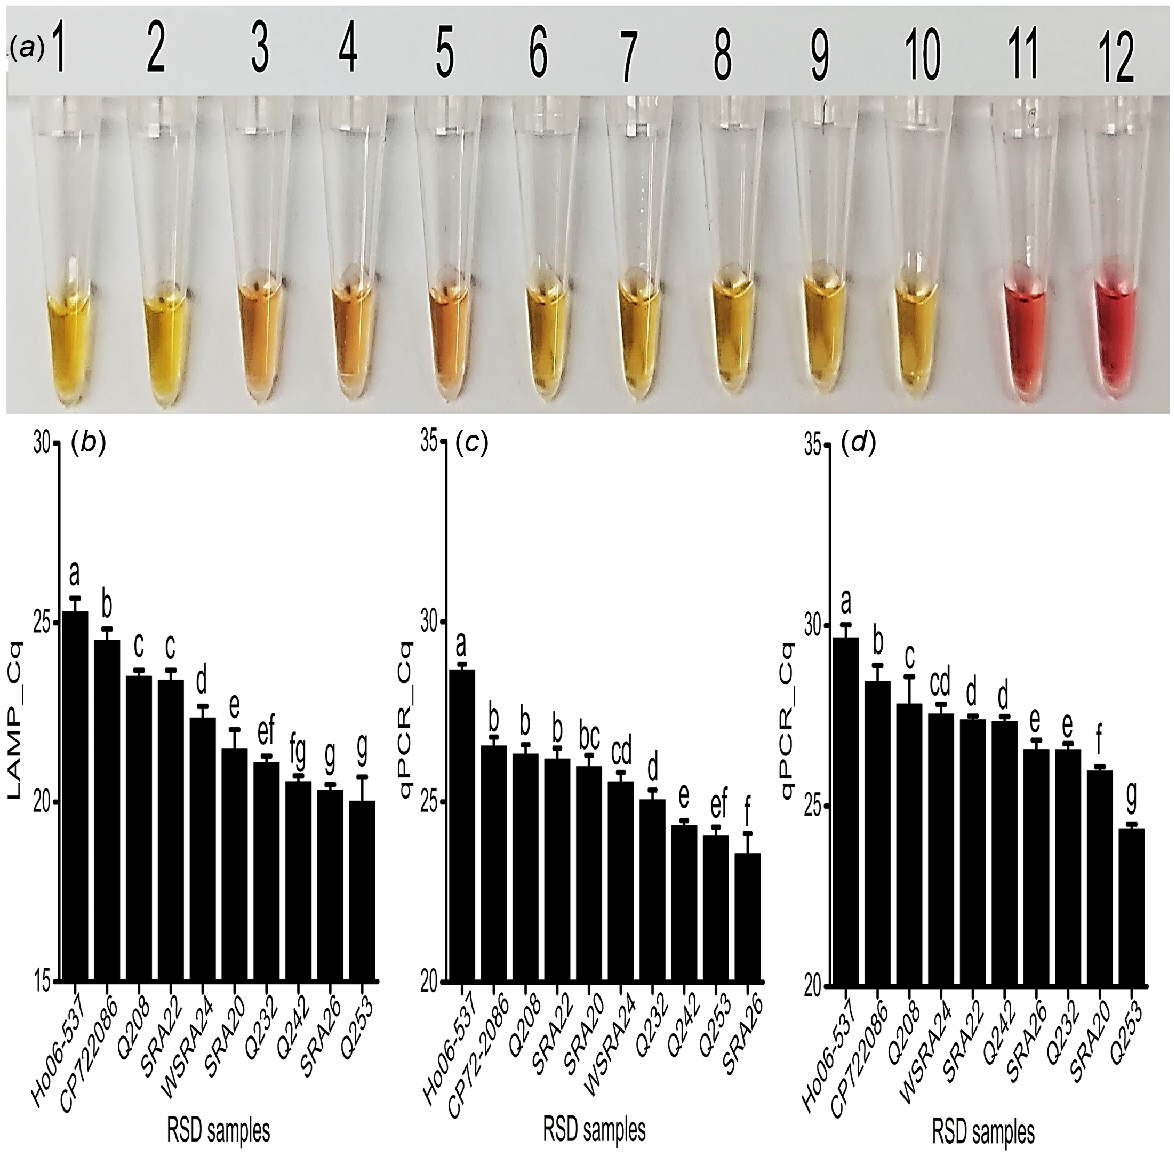
The fluorescent LAMP assay successfully amplified Lxx DNA from all collected samples at different cycle times, indicating different levels of pathogen loads (Fig. 4b and S5a). The determined amount of Lxx DNA was then significantly correlated to the cultivar resistance rating, where higher LAMP values corresponded to lower known RSD resistance ratings (r = −0.82, P < 0.001; Table 3). Sap from the most susceptible cultivars, Q253, Q242, and SRA26 contained the highest number of bacteria (approximately 106−107Lxx cells/μL of sap samples), as depicted by their lower Cq values (20.02, 20.56, and 20.33) (Fig. 3b, 4b). In this manner, the LAMP results were validated with the susceptible to intermediate susceptible rating of cultivars Q232, SRA20 and WSRA24, with Cq values 21.09, 21.47, and 22.34 respectively, and the presence of around 105−106 cells/μL (Fig. 3b, 4b). Similarly, the LAMP results of SRA22 (Cq 23.38) and Q208 (Cq 23.49) were correlated with their intermediate resistant rating, exhibiting approximately 104−105 cells/μL, and were significantly (P < 0.05) different from that of CP72-2086 (Cq 24.50) and Ho06-537 (Cq 25.29), which showed approximately 103−104 cells/μL of sap (Fig. 3b, 4b). The LAMP results of CP72-2086 and Ho06-537 were supported by the previous findings by Ngo et al. (2023) that they are moderately resistant to RSD. Significantly different amounts of Lxx DNA 210 bp target amplicons were detected among sap samples from the cultivars and did not amplify in the control reactions (Fig. S5b; P = 0.05; Fig. 4b).
The target qPCR region was amplified from all infected field sap samples and assessed at all cycle times. The amount of amplified product was also directly correlated with the cultivar resistance rating (Table 1; Figs 4c, d, Figs S8a and S8b), albeit with different amounts of Lxx detected between the two methods and hence slightly different disease rating predictions (Figs 4, S8d). Both qPCR samples (sap and DNA) showed strong negative correlations with the resistance ratings. However, qPCRsap had slightly weaker (r = −0.72, P < 0.05) and qPCR_DNA showed slightly stronger (r = −0.87, P < 0.001) correlations (Table 3). Again, a single amplicon was present on the gel from positive samples only (Fig. S8c and d).
Discussion
The novel LAMP assay developed in this study provides for the first time a quantitative Lxx diagnostic tool capable of predicting sugarcane cultivar RSD resistance rating. This method is highly sensitive (able to detect as little as 1 Lxx cell/μL) and highly specific to Lxx as determined via in silico BLASTn analysis. The newly developed diagnostic is more sensitive than the previously developed Lxx diagnostic detection thresholds of 10 pM–0.03352 nM, equating to approximately 103−104 cell(s)/reaction (Grisham et al. 2007; Liu et al. 2013; Ghai et al. 2014). Additionally, previously published Lxx LAMP diagnostic methods were specifically designed for the successful detection of Lxx infection and were not employed for resistance rating purposes.
So far, only a limited number of studies have reported the use of LAMP-based assays for resistance rating. Recently, Wamalwa et al. (2017) reported a LAMP technique for the effective rating of Napier grass accessions for Napier grass stunt resistance. However, they used complex and time-consuming DNA extraction steps for extracting DNA from the plant samples and for detection, they also used subjective gel electrophoresis for the analysis. This new Lxx LAMP assay provides real-time, rapid, and naked-eye read-out streamlined with a simple field-applicable heat-induced DNA isolation method, avoiding the use of multistep sample processing and expensive commercial kits. This approach enables the quantitative assessment of Lxx titres by providing Cq values, facilitating the detection of pathogen loads in sugarcane cultivars. Lower Cq values indicate a higher number of Lxx cells, whereas higher Cq values suggest a lower number of Lxx cells. This correlation aligns with the standard RSD resistance ratings employed in Australia and elsewhere, as susceptible to intermediate-susceptible cultivars exhibit lower Cq values and a more intense yellow colour, whereas intermediate-resistant to moderately-resistant cultivars display higher Cq values and a pinkish-yellow colour in fluorescent and colorimetric LAMP reactions. Additionally, minimal training is required to conduct the assay, which produces a result within just 40 min from stalk sample collection to read-out. These advantages indicated the utility of this new diagnostic test for fast, cost-effective, and relatively simple disease rating.
Once further validation is undertaken on a wider range of cultivars and samples from a wider range of environmental settings, this tool has the potential to become a new RSD management tool for researchers and growers, especially if it can be integrated into a portable hand-held device (Strachan et al. 2023). This represents a powerful tool for sugarcane growers and breeders alike, as quantifying Lxx titre in field-grown samples is an effective strategy for developing RSD-resistant sugarcane cultivars for RSD management (Young 2018). Indeed, the Lxx titre determined from qPCR, visual or quantitated LAMP assays in replicated field-grown plants assessed in this study was tightly correlated with the established cultivar industry resistance ratings (Croft et al. 1994; Croft 2002; Croft and Johnson 2013; Ngo et al. 2023). This is completely congruent with historical understanding (Teakle et al. 1978). This study is the first to demonstrate that RSD-causing bacteria can be detected and screened for resistance in infected sugarcane crops with various levels of bacterial loads using the LAMP method. However, further research is needed to validate this method in a wide range of varietal combinations and agroclimatic conditions.
In summary, a novel LAMP-based Lxx quantitative diagnostic tool was developed for RSD resistance screening. This diagnostic tool exhibits high sensitivity (1 cell/μL) and reproducibility (s.d. <5%). Furthermore, it was validated for quantitative detection of Lxx, demonstrating a strong correlation with established cultivar disease ratings (r = 0.82, n = 10, P < 0.001). In future, this diagnostic may also serve as a tool to better understand how environmental conditions influence bacterial population dynamics, pathogen proliferation, disease progression, and the expression of resistance (Singh et al. 2023).
Data availability
The data that support the findings of this study are available from the corresponding author upon reasonable request.
Declaration of funding
The operating funds for this work were supplied within the Australian Research Council Linkage Project (LP200100016), with further resources from Sugar Research Australia (SRA). The lead author received a Griffith University International Postgraduate Research Scholarship from Griffith University.
Acknowledgements
The supply of infected and clean plant materials from Sugar Research Australia is gratefully acknowledged.
References
Brumbley SM, Petrasovits LA, Birch RG, Taylor PW (2002) Transformation and transposon mutagenesis of Leifsonia xyli subsp. xyli, causal organism of ratoon stunting disease of sugarcane. Molecular Plant Microbe Interactions 15, 262-268.
| Crossref | Google Scholar | PubMed |
Carvalho G, de Faria RS, Oliveira FR, Ramos AT, Monteiro-Vitorello CB, Camargo LE (2010) Development of a quantitative real-time PCR protocol for the analysis of early colonization of sugarcane plantlets with Leifsonia xyli subsp. xyli. Phytopathology 100, S1-S147.
| Crossref | Google Scholar |
Chakraborty M, Soda N, Strachan S, Ngo CN, Bhuiyan SA, Shiddiky MJA, Ford R (2024) Ratoon stunting disease of sugarcane: a review emphasizing detection strategies and challenges. Phytopathology 114, 7-20.
| Crossref | Google Scholar | PubMed |
Chen Y, Ye W, Zhang Y, Xu Y (2015) High speed BLASTN: an accelerated MegaBLAST search tool. Nucleic Acids Research 43, 7762-7768.
| Crossref | Google Scholar | PubMed |
Chen Y, Wang Z, Liu Y, Wang X, Li Y, Ma P, Gu B, Li H (2018) Recent advances in rapid pathogen detection method based on biosensors. European Journal of Clinical Microbiology and Infectious Diseases 37, 1021-1037.
| Crossref | Google Scholar | PubMed |
Comstock JC (2002) Ratoon stunting disease. Sugar Tech 4, 1-6.
| Crossref | Google Scholar |
Croft BJ (2002) A method for rating sugarcane cultivars for resistance to ratoon stunting disease based on an enzyme-linked immunoassay. Australasian Plant Pathology 31, 63-66.
| Crossref | Google Scholar |
Damann KE, Jr, Benda GTA (1983) Evaluation of commercial heat-treatment methods for control of ratoon stunting disease of sugarcane. Plant Disease 67, 966-967.
| Crossref | Google Scholar |
Dashti AA, Jadaon MM, Abdulsamad AM, Dashti HM (2009) Heat treatment of bacteria: a simple method of DNA extraction for molecular techniques. Kuwait Medical Journal 41, 117-122.
| Google Scholar |
Davis MJ, Gillaspie AG, Jr, Harris RW, Lawson RH (1980) Ratoon stunting disease of sugarcane: isolation of the causal bacterium. Science 210, 1365-1367.
| Crossref | Google Scholar | PubMed |
Davis MJ, Dean JL, Harrison NA (1988) Quantitative variability of Clavibacter xyli subsp. xyli populations in sugarcane cultivars differing in resistance to ratoon stunting disease. Phytopathology 78, 462-468.
| Crossref | Google Scholar |
Davis MJ, Dean JL, Miller JD, Shine JM, Jr (1994) A method to screen for resistance to ratoon stunting disease of sugarcane. Sugar Cane 6, 9-16.
| Google Scholar |
Dawson WJ (1957) ‘Plant diseases due to bacteria,’ 2nd edn., p. 48. (Cambridge University Press) doi:10.2134/agronj1958.00021962005000010020x
Deng ZY, Wang BH, Liu HB, Zhu QZ, Li M, Wang WZ, Tan YM (2004) Occurrence and pathogen detection of sugarcane ratoon stunting disease in Guangxi Province. Sugar Crops China 3, 35-38.
| Google Scholar |
Francois P, Tangomo M, Hibbs J, Bonetti EJ, Boehme CC, Notomi T, Perkins MD, Schrenzel J (2011) Robustness of a loop-mediated isothermal amplification reaction for diagnostic applications. FEMS Immunology and Medical Microbiology 62, 41-48.
| Crossref | Google Scholar | PubMed |
Gagliardi PR, Camargo LEA (2009) Resistance of sugarcane commercials cultivars to causal agent of ratoon stunting disease. Ciencia Rural 39, 1211-1214.
| Crossref | Google Scholar |
Ghai M, Singh V, Martin LA, McFarlane SA, van Antwerpen T, Rutherford RS (2014) A rapid and visual loop-mediated isothermal amplification assay to detect Leifsonia xyli subsp. xyli targeting a transposase gene. Letters in Applied Microbiology 59, 648-657.
| Crossref | Google Scholar | PubMed |
Goodwin DC, Lee SB (1993) Microwave miniprep of total genomic DNA from fungi, plants, protists and animals for PCR. Biotechniques 15, 438 441–2, 444.
| Google Scholar | PubMed |
Grisham MP, Pan Y-B, Richard EP, Jr (2007) Early detection of Leifsonia xyli subsp. xyli in sugarcane leaves by real-time polymerase chain reaction. Plant Disease 91, 430-434.
| Crossref | Google Scholar | PubMed |
Gul F, Hassan S (1995) Further studies on the control of ratoon stunting disease of sugarcane in the N.W.F.P. Pakistan Journal of Phytopathology 7, 163-165.
| Google Scholar |
Harrison NA, Davis MJ (1988) Colonization of vascular tissues by Clavibacter xyli subsp. xyli in stalks of sugarcane cultivars differing in susceptibility to ratoon stunting disease. Phytopathology 78, 722-727.
| Crossref | Google Scholar |
Hoy JW (2017) Is it possible to beat RSD? Sugar. Journal 11, 8-9.
| Google Scholar |
Jose JJM, Brahmadathan KN (2006) Evaluation of simplified DNA extraction methods for emm typing of group A streptococci. Indian Journal of Medical Microbiology 24, 127-130.
| Crossref | Google Scholar | PubMed |
Kull LS, Vuong TD, Powers KS, Eskridge KM, Steadman JR, Hartman GL (2003) Evaluation of resistance screening methods for Sclerotinia stem rot of soybean and dry bean. Plant Disease 87, 1471-1476.
| Crossref | Google Scholar | PubMed |
Li Y, Shi F, Lin Z, Robinson H, Moody D, Rattey A, Godoy J, Mullan D, Keeble-Gagnere G, Hayden MJ, Tibbits JFG, Daetwyler HD (2022) Benefit of introgression depends on level of genetic trait variation in cereal breeding programmes. Frontiers of Plant Science 13, 786452.
| Crossref | Google Scholar |
Liu J, Xu L, Guo J, Chen R, Grisham MP, Que Y (2013) Development of loop-mediated isothermal amplification for detection of Leifsonia xyli subsp. xyli in sugarcane. Biomed Research International 2013, 357692.
| Crossref | Google Scholar | PubMed |
Lou Y-K, Qin H, Molodysky E, Morris BJ (1993) Simple microwave and thermal cycler boiling methods for preparation of cervicovaginal lavage cell samples prior to PCR for human papillomavirus detection. Journal of Virological Methods 44, 77-81.
| Crossref | Google Scholar |
Magarey RC (1994) Effect of pachymetra root rot on sugarcane yield. Plant Disease 78, 475-477.
| Crossref | Google Scholar |
Merk S, Meyer H, Greiser-Wilke I, Sprague L, Neubauer H (2006) Detection of Burkholderia cepacia DNA from artificially infected EDTA-blood and lung tissue comparing different DNA isolation methods. Journal of Veterinary Medicine Series B 53, 281-285.
| Crossref | Google Scholar | PubMed |
Mira P, Yeh P, Hall BG (2022) Estimating microbial population data from optical density. PLoS ONE 17, e0276040.
| Crossref | Google Scholar | PubMed |
Monteiro-Vitorello CB, Camargo LE, Van Sluys MA, Kitajima JP, Truffi D, Do Amaral AM, Harakava R, De Oliveira JC, Wood D, De Oliveira MC (2004) The genome sequence of the gram-positive sugarcane pathogen Leifsonia xyli subsp. xyli. Molecular Plant Microbe Interactions 17, 827-836.
| Crossref | Google Scholar | PubMed |
Monteiro-Vitorello CB, Zerillo MM, Van Sluys M-A, Camargo LEA, Kitajima JP (2013) Complete genome sequence of Leifsonia xyli subsp. cynodontis strain DSM46306, a gram-positive bacterial pathogen of grasses. Genome Announcements 1, e00915-13.
| Crossref | Google Scholar |
Naidoo N, Ghai M, Moodley K, Mkize L, Martin L, McFarlane S, Rutherford S (2017) Modified RS-LAMP assay and use of lateral flow devices for rapid detection of Leifsonia xyli subsp. xyli. Letters in Applied Microbiology 65, 496-503.
| Crossref | Google Scholar | PubMed |
Que YX, Xu JS, Xu LP, Gao SJ, Chen RK (2008) PCR detection for Leifsonia xyli subsp. xyli, pathogen of the sugarcane ratoon stunting disease. Fujian Journal of Agricultural Science 23, 364-367.
| Google Scholar |
Roach BT (1992) Susceptibility to ratoon stunting disease in the Saccharum complex and feasibility of breeding for resistance. Sugar Cane 3, 1-11.
| Google Scholar |
Roach BT, Jackson PA (1992) Screening sugar cane clones for resistance to ratoon stunting disease. Sugar Cane 2, 2-12.
| Google Scholar |
Sharma S, Schulthess AW, Bassi FM, Badaeva ED, Neumann K, Graner A, Özkan H, Werner P, Knüpffer H, Kilian B (2021) Introducing beneficial alleles from plant genetic resources into the wheat germplasm. Biology 10, 982.
| Crossref | Google Scholar | PubMed |
Singh BK, Delgado-Baquerizo M, Egidi E, Guirado E, Leach JE, Liu H, Trivedi P (2023) Climate change impacts on plant pathogens, food security and paths forward. Nature Reviews Microbiology 21, 640-656.
| Crossref | Google Scholar | PubMed |
Smyrlaki I, Ekman M, Lentini A, Rufino de Sousa N, Papanicolaou N, Vondracek M, Aarum J, Safari H, Muradrasoli S, Rothfuchs AG, Albert J, Högberg B, Reinius B (2020) Massive and rapid COVID-19 testing is feasible by extraction-free SARS-CoV-2 RT-PCR. Nature Communicaions 11, 4812.
| Crossref | Google Scholar |
Strachan S, Chakraborty M, Sallam M, Bhuiyan SA, Ford R, Nguyen N-T (2023) Maximizing affordability of real-time colorimetric LAMP assays. Micromachines 14, 2101.
| Crossref | Google Scholar | PubMed |
Strus M (1997) Action of physical agents on microorganisms. Roczniki Panstwowego Zakladu Higieny 48, 263-268.
| Google Scholar | PubMed |
Teakle DS, Appleton JM, Steindl DRL (1978) An anatomical basis for resistance of sugar cane to ratoon stunting disease. Physiological Plant Pathology 12, 83-91.
| Crossref | Google Scholar |
Tsai SM, Chan KW, Hsu WL, Chang TJ, Wong ML, Wang CY (2009) Development of a loop-mediated isothermal amplification for rapid detection of ORF virus. Journal of Virol Methods 157, 200-204.
| Crossref | Google Scholar |
Umer M, Aziz NB, Al Jabri S, Bhuiyan SA, Shiddiky MJA (2021) Naked eye evaluation and quantitative detection of the sugarcane leaf scald pathogen, Xanthomonas albilineans, in sugarcane xylem sap. Crop & Pasture Science 72, 361-371.
| Crossref | Google Scholar |
Wamalwa NIE, Midega CAO, Ajanga S, Omukunda NE, Muyekho FN, Asudi GO, Mulaa MA, Khan ZR (2017) Screening Napier grass accessions for resistance to Napier grass stunt disease using the loop-mediated isothermal amplification of DNA (LAMP). Crop Protection 98, 61-69.
| Crossref | Google Scholar |
Wu Q, Pan YB, Zhou D, Grisham MP, Gao S, Su Y, Guo J, Xu L, Que Y (2018) A comparative study of three detection techniques for Leifsonia xyli subsp. xyli, the causal pathogen of sugarcane ratoon stunting disease. BioMed Research International 2018, 2786458.
| Crossref | Google Scholar |
Ye J, Coulouris G, Zaretskaya I, Cutcutache I, Rozen S, Madden TL (2012) Primer-BLAST: a tool to design target-specific primers for polymerase chain reaction. BMC Bioinformatics 13, 1-11.
| Crossref | Google Scholar |
You Q, Sood S, Luo Z, Liu H, Islam MS, Zhang M, Wang J (2021) Identifying genomic regions controlling ratoon stunting disease resistance in sugarcane (Saccharum spp.) clonal F1 population. The Crop Journal 9, 1070-1078.
| Crossref | Google Scholar |
Young A (2016) Possible origin of ratoon stunting disease following interspecific hybridization of Saccharum species. Plant Pathology 65, 1403-1410.
| Crossref | Google Scholar |
Young AJ (2018) Turning a blind eye to ratoon stunting disease of sugarcane in Australia. Plant Disease 102, 473-482.
| Crossref | Google Scholar | PubMed |
Young AJ, Kawamata A, Ensbey MA, Lambley E, Nock CJ (2016) Efficient diagnosis of ratoon stunting disease of sugarcane by quantitative PCR on pooled leaf sheath biopsies. Plant Disease 100, 2492-2498.
| Crossref | Google Scholar | PubMed |
Zhao D, Davidson RW, Baltazar M, Comstock JC, McCord P, Sood S (2015) Screening for sugarcane brown rust in the first clonal stage of the canal point sugarcane breeding program. Agronomy 5, 341-362.
| Crossref | Google Scholar |