From initial advice statement to export – a 10 year retrospective of Queensland’s liquefied natural gas industry
Peter Downey A , Jon Thomas A B and Mark Stone AA Department of Natural Resources, Mines and Energy, 1 William Street, Brisbane, Qld 4000, Australia.
B Corresponding author. Email: Jon.Thomas@dnrme.qld.gov.au
The APPEA Journal 59(1) 58-69 https://doi.org/10.1071/AJ18070
Submitted: 10 December 2018 Accepted: 10 January 2019 Published: 17 June 2019
Abstract
A decade on from the submission of project initial advice statements to Queensland Government agencies in 2008, this paper provides a retrospective on the development journey of three integrated coal seam gas (CSG) to liquefied natural gas (LNG) mega-projects currently delivering domestic and international markets. The process from development concept to operating asset is considered from several perspectives including: project rationale, description and delivery, as well as regulatory approvals. Project delivery is further considered in terms of the upstream, midstream and downstream components. The delivery of world first CSG to LNG is discussed in the context of project execution during significant volatility in the global oil, gas and LNG markets. All three projects have successfully completed commissioning and start-up. Although all six trains have been performance tested at name-plate production capacity, current LNG production is below this level. This paper examines their evolution from the initial concepts through to delivery, including current gas reserves and those required to sustain gas supply over expected project life. The paper also considers how these projects and any future expansion of the Queensland LNG industry will be impacted upon by an evolving global LNG market.
Keywords: coal seam gas to LNG, Coordinator-General, Gladstone, integrated gas development, LNG, mega-project, petroleum tenure, regulatory approvals, Surat, water production.
Introduction
This paper provides a summary of the project rationale, key design components, gas market considerations, regulatory approvals pathway, contracting strategy and delivery of three integrated CSG to LNG mega-projects currently providing gas and LNG to domestic and international markets.
Project rationale
All three projects, Australian Pacific Liquid Natural Gas (APLNG), Queensland Curtis Liquid Natural Gas (QCLNG) and Gladstone Liquid Natural Gas (GLNG), sought to connect competitively priced gas to high value markets. While integrated gas to LNG projects have been executed since the 1960s, the novelty of sourcing gas from coal seams rather than conventional reservoirs made these projects a world-first.
Incentives to develop Queensland gas resources and export LNG include:
-
Close proximity (and therefore lower transportation costs) of east coast Australian supply relative to others gas exporters, such as the USA, Mexico and Canada, to Asian markets, including China and Japan
-
Large, undeveloped gas resources
-
Introduction of the Queensland Gas Scheme in 2005, which was intended to stimulate the sector and reduce greenhouse gas emissions by requiring electricity retailers to procure 13% (increasing to 15% in 2010) of their electricity from gas-powered generation
-
Market conditions positive for low cost capital investment
-
Established, skilled (though relatively expensive) labour force associated with the state’s existing resources industries
-
Political stability offered by the system of government in Queensland and, more broadly, Australia
-
Bipartisan political support for the development of the petroleum sector in Queensland.
Major project components
All three projects included the following in single vertically-integrated operations:
-
Upstream: onshore gas field development, exploiting high methane-content and low impurity natural gas held in coal seams and comprising thousands of vertical wells using artificial lift to dewater and produce gas; in-field gathering pipelines, processing and compression facilities
-
Midstream: large diameter steel, buried, high-pressure export gas collection headers and export pipelines
-
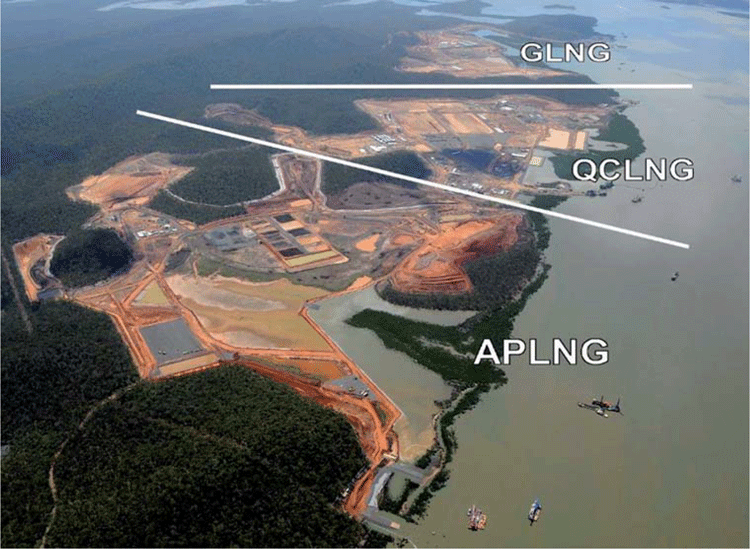
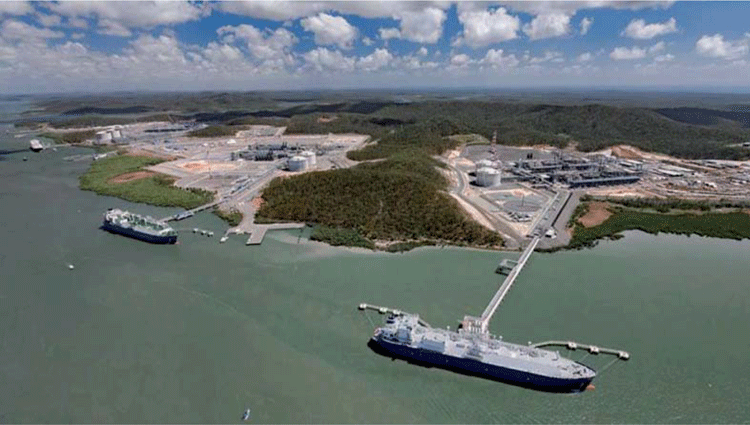
Downstream: a two-train LNG plant utilising ConocoPhillips’ Optimised Cascade™ process, LNG storage tanks and loading jetties (see Figs 1 and 2).
Coordinated project status
In Queensland, the proponents for large projects can apply to the Coordinator-General, who facilitates the assessment and approvals of infrastructure projects, for coordinated project status. Such projects are characterised by:
-
Complex approval requirements, involving local, state and commonwealth governments
-
Significant environmental considerations
-
Strategic significance to the location, region or state, including infrastructure, economic and social benefits, capital investment or employment opportunities it may provide
-
Significant infrastructure requirements.
Given the inherent scale and complexity of the three projects, including the requirement to address numerous state and commonwealth legislation, the proponents all applied for coordinated project status.
To manage the complexity and address possible impacts of the projects, proponents were required to prepare an initial advice statement (IAS) which supports their application and assists the Coordinator-General to determine the level of assessment required. It describes the following:
-
Size and nature of the proposed project
-
Environment in and around the project location
-
Scale and extent of the project’s potential environmental impacts
-
Any proposed measures to mitigate potential adverse impacts.
State project approvals process
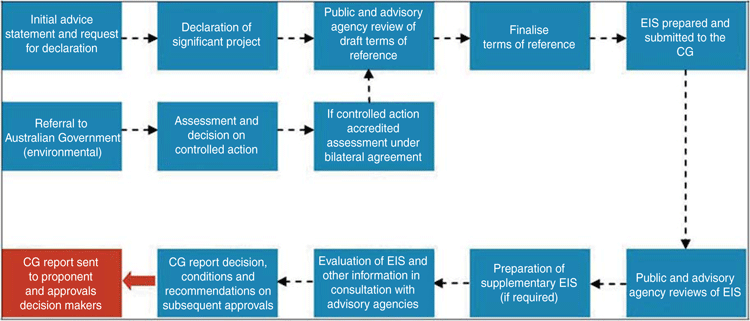
Fig. 3 outlines the Queensland Government’s approvals process under the Coordinator-General. Once declared a coordinated project, the proponent is required to undertake an Environmental Impact Statement (EIS) process.
The EIS provides information regarding the benefit, impact and need for a project as well as how it will be planned and managed to protect environment and social values in the project area. The EIS process includes the public disclosure of all relevant information. It is noted that before 2012, coordinated projects were termed ‘significant projects’ under the State Development and Public Works Organisations Act 1971.
As the projects developed, some elements of their design evolved. This evolution was based on the recommendations of the Coordinator-General and increased engineering definition obtained during the Front End Engineering and Design (FEED) process. This is typical for all mega-projects, representing an optimisation of engineering design, location and layout of major facilities, and project scheduling that is ultimately required to underpin the Final Investment Decision (FID).
Project commonalities and differences
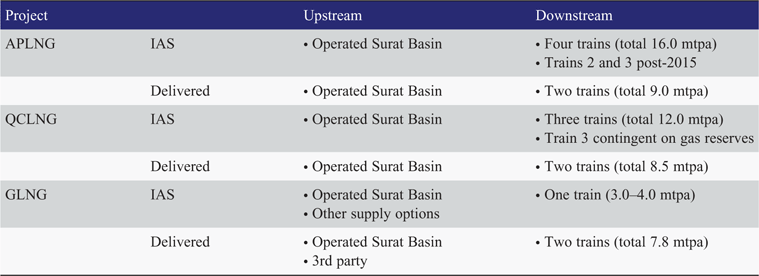
Table 1 provides a comparison of the upstream and downstream components of each project. The significant differences between project description at IAS and delivery follow:
|
-
Both APLNG and QCLNG revised down the number of trains that would be built
-
GLNG took the decision to build an additional train, having stated in its IAS that the project would ‘… give further impetus to coal seam gas development in Eastern Australia, further promoting supply options’.
Project gas reserves
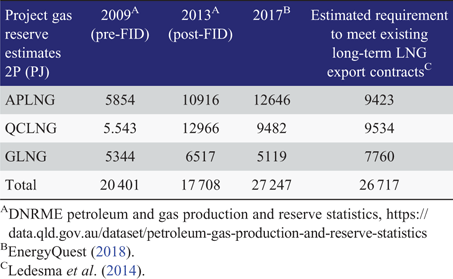
Table 2 provides a summary of project 2P gas reserves before and following FID. Reserves are those quantities of gas which, by analysis of geoscience and engineering data, can be estimated with reasonable certainty to be commercially recoverable from a given date forward, from known reservoirs and under defined economic conditions, operating methods and government regulations (Society of Petroleum Engineers 1997). The table shows the development of reserves over time, compared with the estimated requirements of each project’s long-term export contracts. Petroleum tenure holders in Queensland are required by regulation to periodically report 2P reserves to the Department of Natural Resources Mines and Energy (DNRME). Reserves reporting published by DNRME reflect the data provided by tenure holders and are not calculated by DNRME.
|
It is noted that projects of this nature are value-driven, with the investment in developing reserves and production phased to meet life-of-project needs. Accordingly, while the table may imply that total reserves are insufficient to meet the total long-term contractual commitments, future gas supply is expected to materialise as the projects convert contingent resources into production. Although the Oxford Institute for Energy Studies has forecast requirements to meet long-term LNG contracts on a 20-year horizon, all three projects are expected to operate for around 40 years.
Production performance
Broadly speaking, reservoir performance has delivered within the range expected by the proponents. The primary development challenges have, and continue to be, CSG well reliability and the unit cost of production.
Reliability issues stem from well completion design, including artificial lift (e.g. down-hole pumps) and solids production. Given the shallow reservoir depth, geological formations can be relatively unconsolidated, chemically unstable and prone to production of fine-grained solids which affect well productivity. To maintain field delivery, wells may require work-over and in some cases replacement through re-drilling, which increases down time and operating costs. The impact of long-term shut in wells on unit costs is undesirable and may erode overall project value and erodes reserves because higher actual unit costs could make fields sub-economic.
These issues are often consistent with the nature of these ‘first of a kind’ projects, where learnings are gained through operational experience and process improvement. It is expected that each project will continue to achieve operational and design efficiencies that will substantially lower the cost of brownfield, incremental developments.
Water production
Another feature of all three projects has been the difference between the production of associated water estimated at FEED and the actual smaller volumes that have materialised with production.
Generally, gas production cannot begin until dewatering of a coal seam has begun. CSG production water tends to be relatively saline (usually it is brackish).
The overestimation of water production can be attributed to several factors including:
-
Preference towards over-designing water handling facilities to avoid curtailment of gas production, and
-
Tendency towards accommodating the higher end of water production estimates in order to understand potential environmental, social, and economic impacts and the corresponding requirements to mitigate these risks.
In the project definition stage, water production forecasts were likely based on a development scenario that included eight LNG trains and the associated number of wells required to support them.
In 2008, one estimate put the cumulative water production across the Surat Basin for the life of project at between 2500–5000 GL. This estimate was necessarily based on limited data, reflecting the lack of analogous CSG developments of this scale and the early stage of reservoir appraisal. This data informed FEED and arguably led to overdesigned water treatment facilities (Underschultz et al. 2018)
Over time, forecasts for water production have decreased as more performance data have become available. Additionally, the project design basis has evolved with changes to well construction scheduling and the construction of fewer LNG trains than originally planned.
A more recent forecast for the Surat Basin calculates water production for the life of the projects at 1700 GL, which is below the lower bound of the previous estimate. While this learning may be an advantage to the design of future gas developments, the overestimation of water production has mostly likely resulted in over-investment in the initial stages of all three projects.
Upstream footprint over time
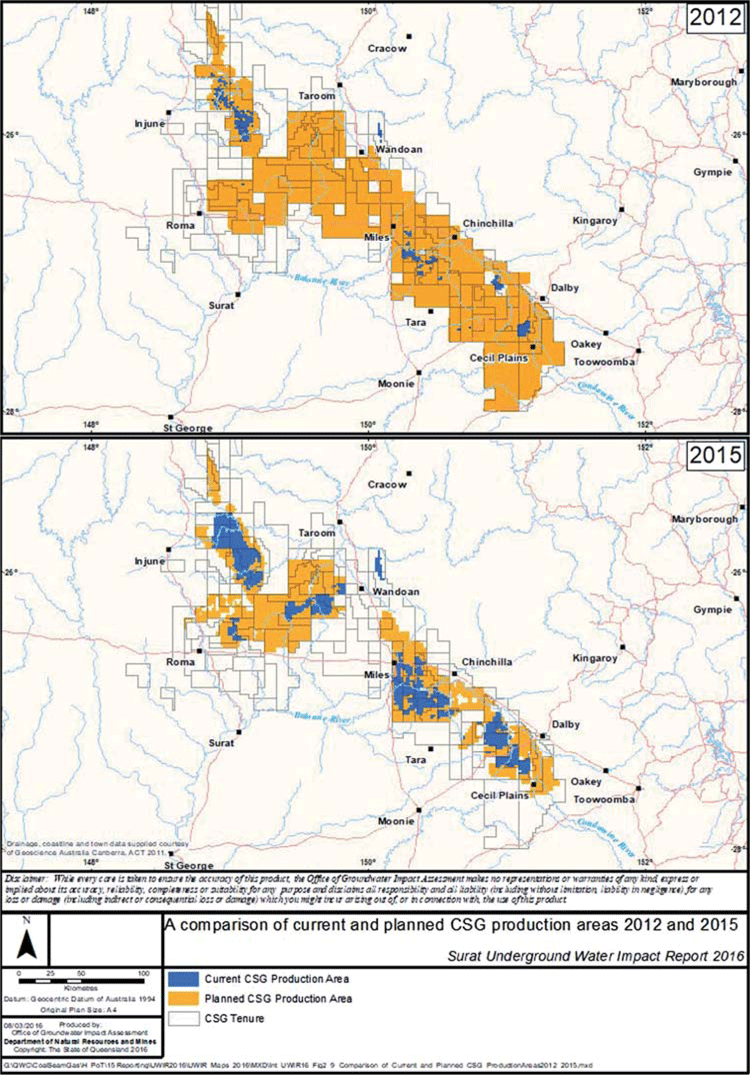
Fig. 4 shows the petroleum tenure holdings across the Surat Basin from 2012 to 2015. Over this time, several factors combined to reduce the planned CSG production area, including:
|
-
Tenure security at the exploration and appraisal stage to underpin the LNG projects, where resource and reserve uncertainty was high
-
Identification of ‘sweet spots’ (e.g. those areas with the lowest unit cost of production) from wells completed during appraisal and early development
-
Progressive step-out of gas field development in preparation for LNG export
-
Contraction as a result of actual field performance, including the identification of areas which are currently uneconomic and may require technological development. These areas include low-permeability coal seams that could be developed in the future.
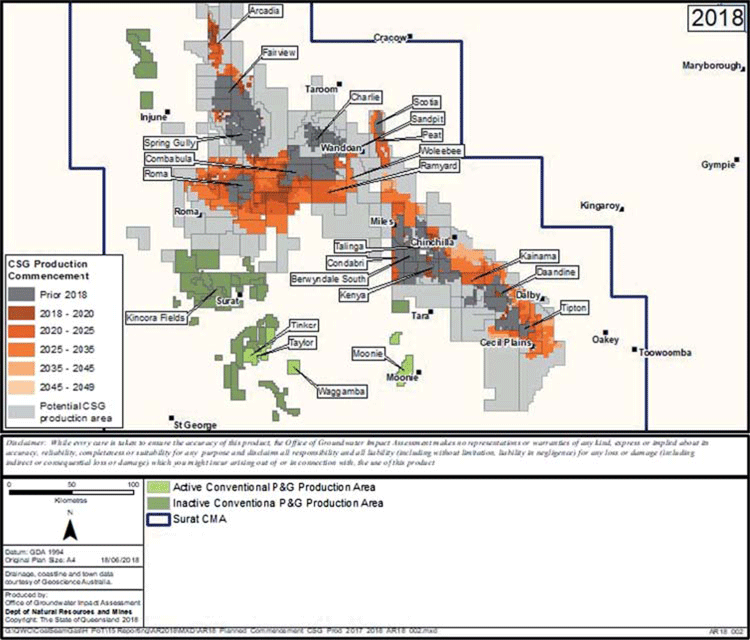
Fig. 5 shows that the overall development footprint in 2018 is relatively unchanged from 2015. This suggests that the projects have sufficient definition of resource quality and well performance to meet current forecast supply needs for the immediate future of the projects.
|
It can also been seen from Figs 4 and 5 that between 2012 and 2018, CSG tenure holdings across the Surat Basin have not reduced to reflect the smaller CSG development footprint.
Although Fig. 5 shows the area planned for long-term (out to 2049) CSG development is less than the total area currently under tenure, further exploration and appraisal – as well as advances in technology – are likely required to determine the commerciality of these areas.
Project partnering
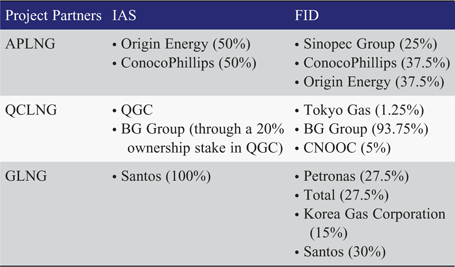
All three proponents mitigated the inherent risks of mega-project delivery by partnering. Strategic partnering can satisfy several requirements including technical and operational expertise, capital investment needs and integration of the LNG value chain including markets and buyers. With gas buyers investing in the projects, not only did the proponents secure capital funding, they also secured future cash flow through long term gas supply agreements, further underpinning the commercialality of the respective projects.
Table 3 shows the addition of partners as projects moved from IAS to FID. Partners either took equity in the project as a whole, or individual project elements.
|
Commodity market environment
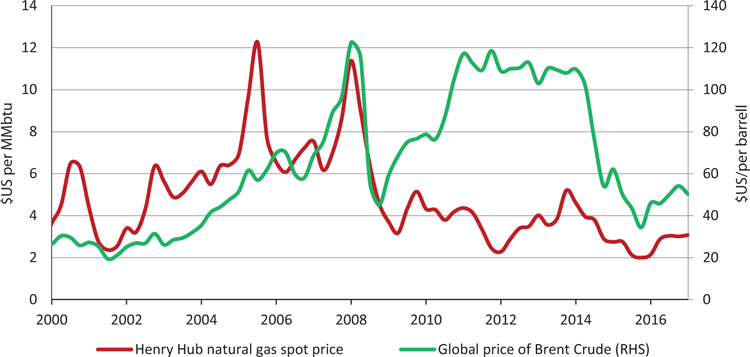
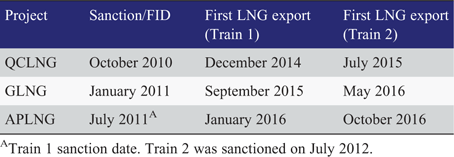
All three projects were sanctioned and delivered in an environment characterised by high crude oil and gas market volatility (see Fig. 6 and Table 4).
|
|
Although the oil and gas industry is used to executing projects in a volatile market environment and planning accordingly (through factors such as project design and contracting strategies), the risks posed by large and unexpected movements in prices can seldom be accounted for completely.
Movements in commodity prices can impact the cash flow from a project owners’ existing assets – which part fund these capital-intensive mega-projects, and the ability to invest in those projects to sustain production and generate further value for shareholders. Price movements can also influence the negotiating position of project owners in securing partners along the LNG value chain for co-investment, risk mitigation, and gas sale and purchase agreements.
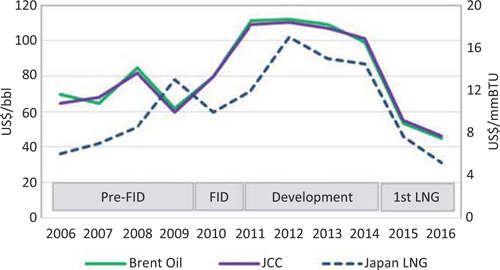
Fig. 7 shows Brent Crude and LNG prices in the Asian market, over the period of interest. The chart describes the environment for major investment decisions in the period before the three projects being sanctioned and their first LNG being produced. It is noted that project proponents secured several long-term supply contracts, before and following FID, with partners and purchasers along the LNG ‘value chain’.
|
The overlapping timeframes for engineering, procurement and construction of the three projects meant that each faced the challenge of controlling the cost of key materials and services, such as steel and labour, with the cumulative impact of concurrent delivery.
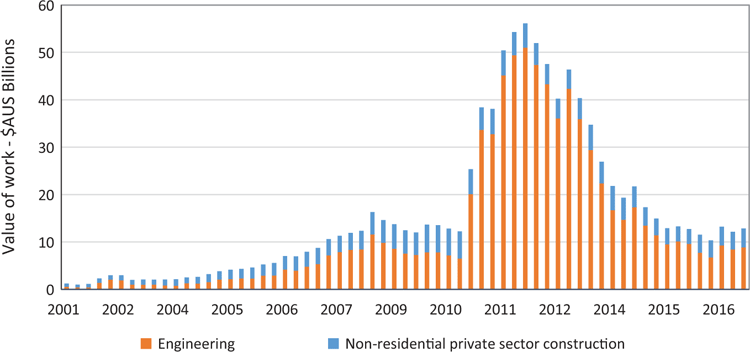
In aggregate, project construction represented the largest concentration of private-capital investment in Australia’s history, creating thousands of engineering and construction jobs for Queensland. Fig. 8 illustrates this contribution, with construction employment increasing several fold between 2011 and early 2013, the peak of project construction activity.
|
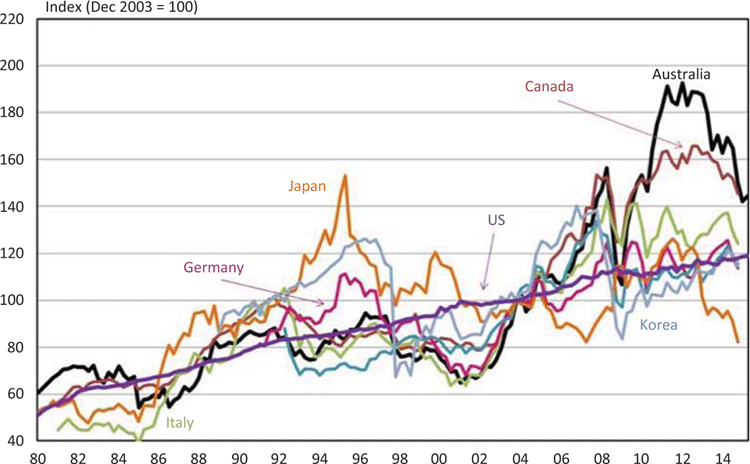
In the global context, over the past decade Australia has become a relatively high labour cost jurisdiction (Fig. 9) driven by factors including competition for labour in the midst of a then booming Australian resources sector. The simultaneous construction of the three projects also put pressure on labour costs.
The mitigation of labour-related costs was achieved through several project features including:
-
Modularisation of LNG facilities, through the fabrication of some 260 modules weighing up to 5000 tons, in construction yards in Indonesia, Thailand and the Philippines
-
Transportation of modules by barge directly to Curtis Island
-
Use of construction camps.
Project delivery
The three projects shared similar contracting strategies for the delivery of major capital components. In the case of the LNG facilities, Bechtel Corporation was selected to deliver the six LNG trains, storage tanks and berthing facilities on Curtis Island, through Engineering, Procurement and Construction contracts. This can be seen as acknowledging the experience that Bechtel holds in the construction of more than 40 LNG trains, which represent one-third of global LNG capacity.
In its project summary (https://www.bechtel.com/projects/curtis-island-lng), Bechtel lists an impressive array of project statistics:
-
14 500 people employed at peak
-
More than 500 Aboriginal and Torres Strait Island people employed
-
$1.5 billion in local wages to long-term Gladstone residents
-
436 apprentices trained and hired, including 200 local residents for operational roles
-
More than 40 subcontracts totalling $350 million awarded to local businesses.
For the high-pressure gas export pipeline, collection header pipeline and associated major facility components, the project owners awarded detailed design, procurement and construction contracts to consortia that included international pipeline design and construction companies.
The three proponents used similar strategies to deliver the upstream component of their projects. Each used an Engineering, Procurement, Construction Management model, whereby the totality of the project was segmented and discrete work packages awarded to individual contracting and construction specialists.
Future opportunities and challenges
With all three projects commissioned and operating, they can be considered in light of future opportunities and challenges.
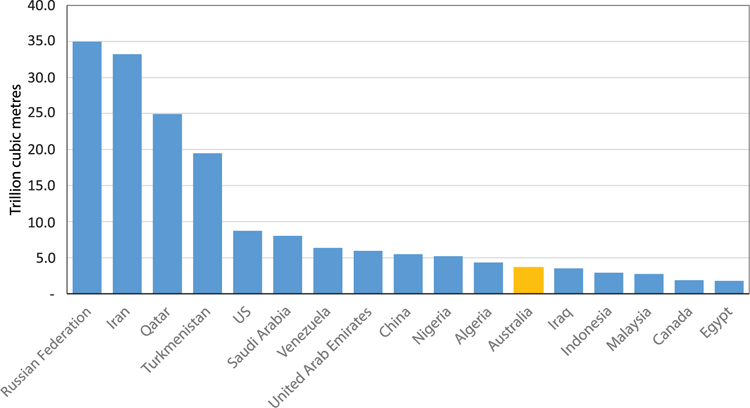
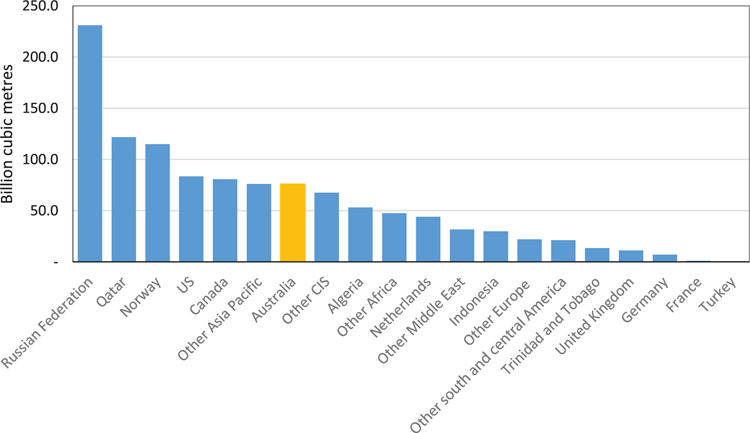
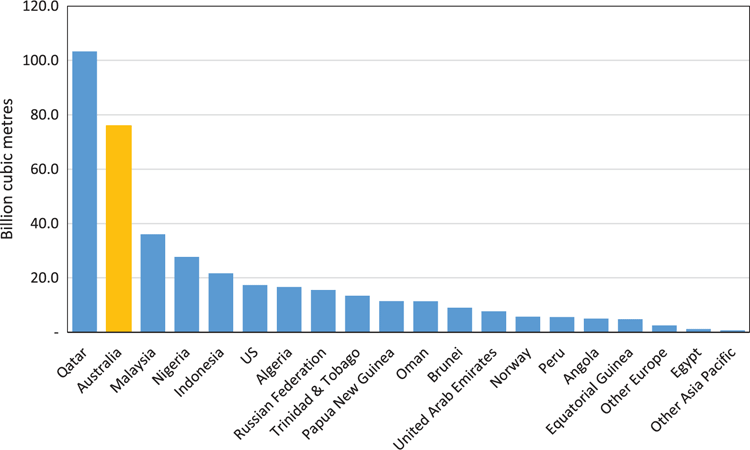
In terms of opportunities, Queensland’s proximity to Asian markets will provide a source of enduring comparative advantage. While Australia is only the twelfth largest holder of gas reserves in the world, it is the seventh largest gas exporter and the second largest exporter of LNG into the major importing Asian countries.
The rapid development of Queensland and Australia’s position as a major exporter of LNG to Asia (Figs 10–12) has been driven in part by low shipping costs due to geographic proximity. For example, Queensland’s CSG-LNG operations currently face spot cargo costs of approximately $US1/MMBtu. This compares with USA exports to Asia, via the Panama Canal, having shipping costs closer to $US3/MMBtu (EnergyQuest 2018).
|
This advantage, however, could be eroded over time if competitors are able to counter Australia’s geographic advantage with lower production costs. As noted above, Queensland’s CSG-LNG industry must achieve continuous unit cost improvements, particularly to the upstream components of their operations, to remain globally competitive.
While 2P reserves are currently estimated to be sufficient to meet the total long-term contractual obligations of the three projects, all will maintain a focus on unit cost improvements to ensure that contingent resources and undeveloped reserves can be developed economically. This is a particularly pertinent challenge as undeveloped 2P gas in the Surat-Bowen basin is currently approximately one-third more expensive than gas produced from developed 2P.
Cost reductions are expected to be obtained through several design and operational means including:
-
Improvements to well cost and reliability through well design and field development optimisation – including the sharing of data across industry
-
Achieving economies of scale through coordinated repair and maintenance services, across all three projects, upstream and downstream
-
Incremental brownfield and greenfield developments making full use of learnings.
Global market challenges
The Queensland LNG export industry also faces a rapidly changing global environment. Each project now faces the realities of a global LNG trade that is expanding rapidly and moving away from the business model that has prevailed since the latter half of the 20th century. Under this model, large, capital-intensive projects were underwritten by multi-decade contracts with only a few large-scale buyers interested to maintain security of supply.
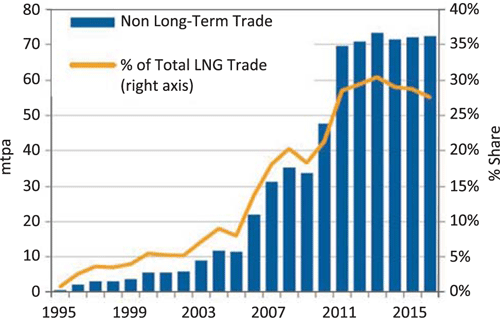
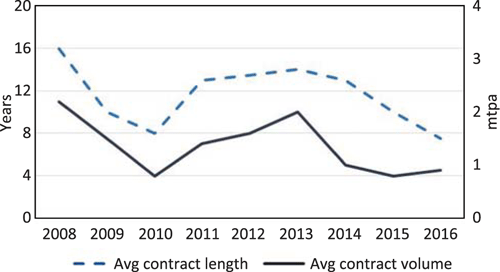
Figs 13 and 14 show the related trends of an increasing volume and proportion of LNG being sold on the spot market and reductions in the duration and volume of long-term LNG contracts.
|
Prior to the early 2000s, LNG projects were characterised by participation of downstream (buyers) in the upstream (sellers) project, to hedge financial exposure and influence cost management and reliability of supply. A few long-term (more than 20 years) contracts would typically represent 80% of the total project supply, with the remainder as contingency to ensure long-term contracts were reliably met as well as exposure to spot and short-term markets with potential price upside.
In recent times, the market has seen an increased in spot cargos with shorter contract periods and a huge growth in the number of LNG-importing countries.
Technological improvement, such as floating storage and regasification units, now allow buyers to import relatively small quantities of LNG economically. The potential supply of LNG to the global market was also increased substantially by the development of shale gas in the USA and the development of commercial means to export this gas. This has allowed for a precipitous expansion to the size of the global LNG market. In 2000 the global LNG trade consisted of 11 importers and 12 exporters, by 2017 this had expanded to 40 countries importing LNG from 19 exporters (Fig. 11) (Department of Industry, Innovation and Science 2018).
A rapidly expanding market has facilitated changes to traditional business practices. The export business model of point-to-point sales between buyers and sellers is beginning to recede in favour of companies that operate on a portfolio basis in which they act as both LNG producers and traders to supply an entire market rather than specific customers. Relatedly, short-term unexpected demand needs have occurred as a result of events such as the Fukushima nuclear disaster in Japan in 2011.
The emergence of greater flexibility on the part of sellers and the need for more immediate supplies on the part of (an expanded) number of buyers has driven rapid expansion in the LNG spot market. Between 2005 and 2011, the volume of LNG traded in the spot market increased by nine-fold. Short-term trades are defined as those equal to or less than four years in duration.
The expansion of the LNG spot market has implications for pricing that pose a major challenge to Queensland’s CSG-LNG projects. In addition to these projects being underwritten by long-term sales contracts, these contracts include the traditional pricing mechanism in which the prices are linked to that of oil. The expansion of the spot market as well as a divergence between oil and gas price over the period 2008–14 (Fig. 6) is leading to a move away from oil-linked pricing towards prices based on significant gas trading hubs, such as the Henry Hub in the USA.
The implications of a shift away from long-term oil-linked pricing towards more short-term and flexible gas-hub pricing may influence both the existing three projects and any expansion of the Queensland LNG industry.
Conflicts of interest
The authors declare no conflicts of interest.
Acknowledgements
This research did not receive any specific funding.
References
APLNG (2009) Australia Pacific LNG Project: Initial advice statement. Available at https://www.statedevelopment.qld.gov.au/resources/project/australia-pacific-lng/aplng-ias-27-mar-09.pdf [Verified 17 January 2019].BP (2018) Statistical Review of World Energy. 67th edn. Available at https://www.bp.com/content/dam/bp/en/corporate/pdf/energy-economics/statistical-review/bp-stats-review-2018-full-report.pdf [Verified 17 January 2019].
Business Insider Australia (2015) CHART: Labour costs in Australia compared to other countries. Available at https://www.businessinsider.com.au/chart-labour-costs-in-australia-compared-to-other-countries-2015-6 [Verified 17 January 2019].
Department of Industry Innovation and Science (2018) Resources and Energy Quarterly – June 2018. Available at https://publications.industry.gov.au/publications/resourcesandenergyquarterlyjune2018/index.html [Verified 17 January 2019].
Department of Natural Resources and Mines (2016) Underground water impact report for the Surat cumulative management area (State of Queensland). Available at https://www.dnrm.qld.gov.au/__data/assets/pdf_file/0007/345616/uwir-surat-basin-2016.pdf [Verified 17 January 2019].
EnergyQuest (2018) Monthly LNG Report – August 2018. (EnergyQuest: Adelaide)
International Gas Union (2018) IGU World Gas LNG Report – 2018 Edition. (IGU). Available at https://www.igu.org/sites/default/files/node-document-field_file/IGU_LNG_2018_0.pdf [Verified 17 January 2019].
Ledesma, D., Palmer, N., and Henderson, J. (2014) The future of Australian LNG exports: will domestic challenges limit the development of future LNG export capacity? (Oxford Institute for Energy Studies: Oxford). Available at https://www.oxfordenergy.org/wpcms/wp-content/uploads/2014/09/NG-90.pdf [Verified 17 January 2019].
Office of Groundwater Impact Assessment (2018) Annual report 2018 for the Surat underground water impact report 2016. Available at https://www.dnrm.qld.gov.au/__data/assets/pdf_file/0007/1397644/surat-uwir-annual-report-2018.pdf [Verified 17 January 2019].
Society of Petroleum Engineers (1997) Petroleum Reserves definitions (Society of Petroleum Engineers) Available at https://www.spe.org/industry/petroleum-reserves-definitions.php [Verified 8 February 2019].
Underschultz, J. R., Vink, S., and Garnett, A. (2018). Coal seam gas associated water production in Queensland: Actual vs predicted. Journal of Natural Gas Science and Engineering 52, 410–422.
| Coal seam gas associated water production in Queensland: Actual vs predicted.Crossref | GoogleScholarGoogle Scholar |

Peter Downey holds a Bachelor of Economics and a Bachelor of Arts (Political Science) from the University of Queensland and a Graduate Certificate in Policy Analysis from Griffith University. He is currently Principal Policy Officer within the Strategic Policy Unit of the Department of Natural Resources, Mines and Energy. Peter has 10 years of experience in economic analysis and economic policy development in the areas of natural, mineral and energy resources. |

Jon Thomas holds a Bachelor of Engineering degree in Mineral Surveying from the Camborne School of Mines and post-graduate qualifications from Deakin University. He is currently Portfolio Manager within the Petroleum Assessment Hub of the Department of Natural Resources, Mines and Energy. Jon has 25 years of experience in the extractive resources and manufacturing industries, in technical and managerial roles. |

Mark Stone holds a Master of Engineering degree in Petroleum Engineering from Heriot-Watt University. He is currently Executive Director – Resources Safety and Health within the Department of Natural Resources, Mines and Energy. Mark has 25 years of experience in the mineral and energy resources industry, across oil and gas development and production, and as a regulator. He is a member of the Society of Petroleum Engineers. |


