

Population differentiation in the white-fronted chat (Epthianura albifrons) at a continental scale: implications for dispersal, biogeography and conservation
Richard E. Major A , Georgina M. Schlub A B , Rebecca N. Johnson A C , Andrew G. King A and Gretel S. Major D *
A
B
C
D
Abstract
The capacity for dispersal is an important determinant of a species’ resilience to decline from the serial extinction of local populations. Dispersal of animals can be difficult to measure directly but population genetics provides a powerful tool for identifying dispersal limits. This study used microsatellite markers to investigate population structuring of the white-fronted chat (Epthianura albifrons) across its geographic range. Because the species is threatened in the north-eastern part of its range, the primary aim was to identify barriers limiting dispersal. Isolation by distance was not apparent across the 3000 km mainland range but populations on three oceanic islands, and two mainland sites surrounded by urbanisation, were genetically distinct from each other and the other mainland sites. The small populations that were surrounded by urbanised land had significantly lower genetic diversity (allelic diversity and heterozygosity) than the other mainland populations, with the oceanic island populations showing intermediate levels of diversity. These results suggest that although being a partially nomadic species, which facilitates its dispersal over continuous habitat, the species does not have the flight capacity of some other small passerines and is sensitive to habitat discontinuity. Populations inhabiting small areas of coastal saltmarsh in areas with large human populations are likely to face increasing threat levels.
Keywords: barrier, biogeography, conservation, dispersal, DNA, endangered species, Epthianura albifrons, fragmentation, microsatellite, population genetics.
Introduction
Habitat fragmentation is major cause of species decline, producing isolated local populations that suffer from the negative effects of inbreeding and demographic stochasticity (Haddad et al. 2015; Frankham et al. 2019). Strong dispersal ability, which allows species to cross barriers, is therefore an important species attribute that provides resilience to local population extinction and ultimately species decline (Niebuhr et al. 2015). Because of the power of flight, birds are generally less susceptible to the demographic and genetic consequences of habitat fragmentation than less vagile taxa such as reptiles or mammals (Frankham et al. 2010). However, historic geographical barriers have still been important in avian speciation, and isolation of island populations has resulted in numerous examples of morphological differentiation (Mayr and Diamond 2001).
Determining the dispersal ability of animals is not easy, although advances in telemetry have made great inroads into this important ecological discipline (Kays et al. 2015). Historically, dispersal in birds has been inferred from appearance and disappearance of birds in particular regions between seasons and has provided a broad understanding of movements associated with migration and nomadism (Keast 1968). Mark/recapture studies have been important in refining understanding of these patterns of movement, and also in identifying local movements (Paradis et al. 1998; Fandos et al. 2023). However, recaptures at large spatial scales occur at extremely low probability, and issues with tracking devices for very small individuals means that our knowledge of dispersal in small passerines is limited.
Morphological differences between populations have often been inferred to reflect isolation and thus the presence of barriers to dispersal (Fan et al. 2024). In particular, many insular populations of birds are recognised as subspecies on this basis (Mayr and Diamond 2001). By extension, a lack of morphological difference may indicate the absence of barriers and the capacity for dispersal over distances narrower than the extent of the barrier.
For example, the white-fronted chat (Epthianura albifrons) is considered to have the capacity to disperse across potential oceanic barriers because of an absence of morphological variation in island populations, reinforced by punctuated observation records that imply nomadism (Schodde and Mason 1999). However, the determination of the absence of morphological variation is equivocal, with more recent data (Major 2012) supporting earlier measurements that had historically been used to infer subspeciation (Mathews 1912; Keast 1958). Resolving this uncertainty is important, because the white-fronted chat is a threatened species (NSWSC 2010a, 2010b) with naturally fragmented saltmarsh as its core habitat (Ashcroft and Major 2013), such that understanding its dispersal capacity is a fundamental issue for conservation efforts to prevent further decline.
Robust information for identifying barriers to movement and hence dispersal ability in a species can also be obtained from the analysis of genetic variability between locations across its range (Haig et al. 2011). Furthermore, a population genetic approach has the benefit of establishing whether movements actually contribute to the breeding population, which is not necessarily the case (Coulon et al. 2010). Moreover, a genetic approach has the additional benefit of directly assessing the extent of any inbreeding, which is one of the deleterious effects of habitat fragmentation that conservation management seeks to address (Frankham et al. 2010). The aim of this study is to use highly variable genetic markers (microsatellites) to identify any population discontinuities in the distribution of the white-fronted chat, and to determine the extent to which the species is threatened by anthropogenic landscape modification.
Methods
Study sites and species
The white-fronted chat is a ground-foraging insectivore in the honeyeater family (Meliphagidae). It is distributed across southern mainland Australia from 200 km north of Perth in the west to 500 km north of Sydney in the east, as well as the continental islands of Tasmania, King Island, Flinders Island, Kangaroo Island and Rottnest Island (Higgins et al. 2001). White-fronted chats prefer open habitats, particularly salt marsh vegetation, and they are not found in forest or woodland (Higgins et al. 2001). The species is non-territorial and gregarious, foraging in flocks and often nesting in loose colonies (Major 1991a, 1991b). They are considered to be nomadic in some parts of their range (Keast 1958), although they are also known to be sedentary in other areas, particularly where they inhabit coastal salt marsh (Major 1991a; Higgins et al. 2001).
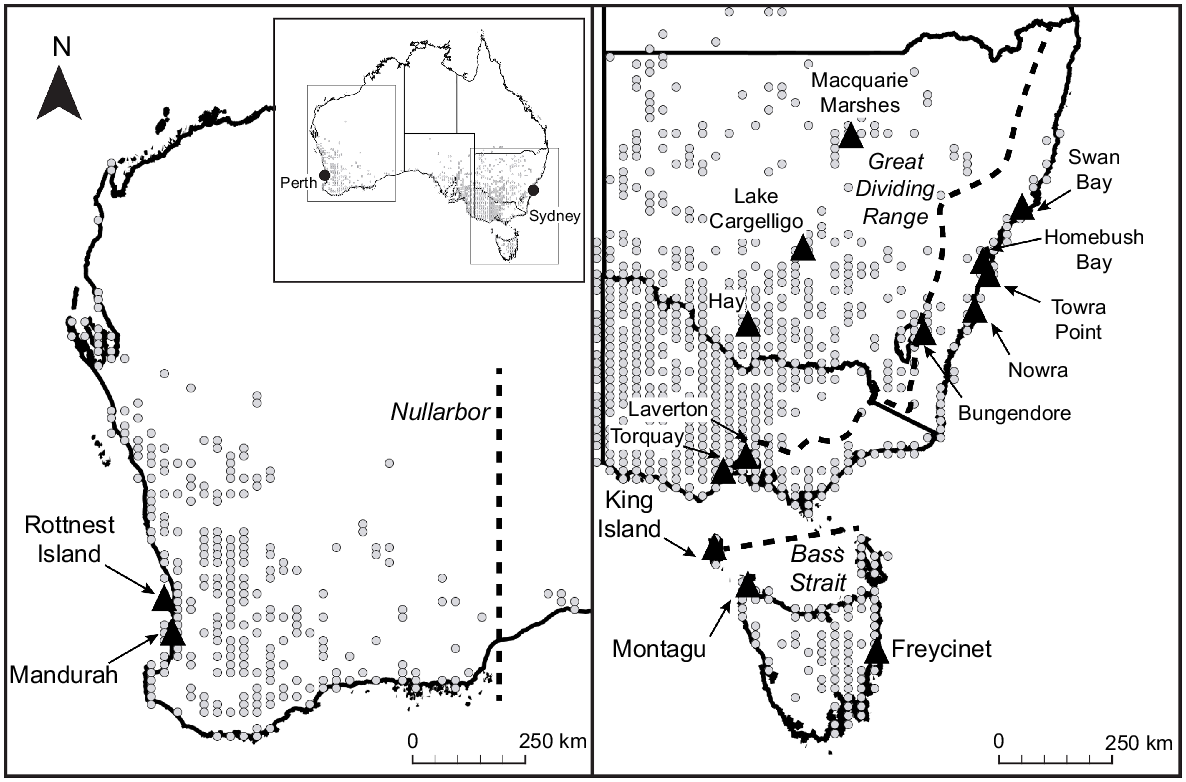
E. albifrons was sampled from 15 sites distributed across the ~3000 km known range of the species. These sites were selected based on recent records in eBird (Sullivan et al. 2009) and chosen to measure genetic variability associated with geographical distance and isolation by potential barriers to dispersal (Fig. 1). To investigate the effect of oceanic barriers, sites were chosen on Rottnest Island (18 km from mainland), King Island (90 km from mainland) and two locations in Tasmania (130 km from mainland), as well as sites in proximal mainland locations (Mandurah, Torquay, Laverton). To investigate the effect of urban barriers, sites were chosen in two nature reserves that were surrounded by urban development in Sydney, at Homebush Bay and Towra Point. To investigate the effect of continuous forest as a barrier, sites were chosen to the east (Swan Bay, Nowra) and west of the Great Dividing Range (Macquarie Marshes, Lake Cargelligo, Hay, Bungendore), and on the eastern (Freycinet) and western (Montagu) sides of Tasmania.
Location records (grey circles) and position of study sites (black triangles) for DNA collection from 15 populations of white-fronted chats spanning continental Australia and adjacent islands. Potential dispersal barriers (Nullarbor, Bass Strait and Great Dividing Range) are indicated by dashed lines. Study site names are subsequently referred to by three-letter abbreviations: ROT, Rottnest Island; MAN, Mandurah; KIN, King Island; MON, Montagu; FRE, Freycinet; TOR, Torquay; LAV, Laverton; BUN, Bungendore; NOW, Nowra; TOW, Towra Point; HOM, Homebush Bay; SWA, Swan Bay; MAC, Macquarie Marshes; CAR, Lake Cargelligo; HAY, Hay.
Collecting and processing DNA samples
Between 8 and 28 adult individuals were captured in each of the 15 sites (N = 264) between 2008 and 2011, by attracting birds into mist-nets using porcelain decoys and song playback (Major et al. 2014). Each bird was individually marked using numbered leg bands to prevent resampling, and ~10 down feathers were plucked from the dorsal and ventral sides of the bird and stored in sterile plastic bags. Feather samples were held in a portable refrigerator for a maximum of 10 days during field trips, prior to storage at −80°C until DNA extraction. Unused feathers were curated in the Australian Museum Frozen Tissue Collection, an ISO 17025 accredited biorepository.
Under sterile laboratory conditions, the proximal 2 mm of the calumi of two feathers from each bird were detached with a scalpel blade, and DNA was extracted using the QIAGEN DNeasy blood and tissue DNA extraction kit. DNA extraction and PCR amplification of 21 microsatellite markers followed the standard procedures described in King et al. (2012). Using labelled primers, multiplexed PCR products were run on an AB 3730xl Sequencer (Applied Biosystems) by an external service provider, the Australian Genome Research Facility (AGRF www.agrf.org.au), and the electropherograms were analysed and scored manually using Genemapper ver. 4.1 (Applied Biosystems).
Analysis of population structure
Of the 21 microsatellite loci screened, only 18 amplified reliably and expressed polymorphism (King et al. 2012). A previous study (Major et al. 2014) identified that in six of the remaining loci, heterozygosity deviated significantly from Hardy–Weinberg equilibrium in at least one of five populations after applying sequential Bonferoni corrections. These loci were also excluded, resulting in the use of 12 loci (Ea03, Ea05, Ea07, Ea08, Ea09, Ea13, Ea14, Ea16, Ea19, Ea24, Ea26, Ea28: King et al. 2012) in the following analyses.
To identify the likely membership of individuals to genetic populations, we used the program Structure ver. 2.3.3 (Pritchard et al. 2000), which takes a Bayesian clustering approach to model the number of genetic populations that best fits the observed pattern of allelic variation. In our models we assumed admixture between populations, and independent allele frequencies; we also used informative priors based on sampling location (Locprior option in Structure). We ran models for all possible numbers of genetic populations between 1 and 15, selecting the ‘best’ number of populations (K) based on the maximum (least-negative) mean log-likelihood value (Pritchard et al. 2000). We verified this decision using the program Structure Harvester, which identifies the optimum number of populations based on the rate of change in the log-probability of data between successive K values (Evanno et al. 2005). Each of the 15 possible number of populations was run eight times, with all models having a burn-in period of 106 followed by 106 iterations. We used the program Clump (Jakobsson and Rosenberg 2007) to align replicate runs and generate a single structure plot.
Variation in genetic diversity among populations (effective number of alleles and unbiased expected heterozygosity) was calculated using the program Genalex 6 (Peakall and Smouse 2006). Statistical differences in pairwise comparisons of effective number of alleles and unbiased heterozygosity were determined by Wilcoxon paired-sample signed rank tests implemented in JMP®, ver. 17 (SAS Institute Inc., Cary, NC, USA). Statistical differences between mainland, oceanic island and urban island population groupings were determined by analysis of variance using SYSTAT 12 (Systat Software, Inc., Chicago, IL, USA). Genetic distance among populations were calculated by pairwise FST and Dest using Arlequin ver. 3.5.1.2 (Excoffier and Lischer 2010) and SMOGD (Crawford 2010), respectively. We used pairwise FST because it has extensive previous application, facilitating comparisons between studies, and pairwise Dest because it more accurately accounts for differences in allelic diversity in highly polymorphic markers such as microsatellites (Jost 2008). The significance of pairwise FST values was determined by permutation in Arlequin (Excoffier and Lischer 2010). Genetic distances between populations were represented graphically by group-averaged clustering and by ordination of the pairwise Dest matrix using PRIMER ver. 5.2.4 (Clarke and Warwick 1994). To measure genetic isolation by distance between populations we excluded ‘island’ populations (for rationale, see Results) then used Mantel tests implemented in Mantel ver. 2.0 (Liedloff 1999) to measure the correlation between the Dest matrix and a matrix of geographic distances.
Results
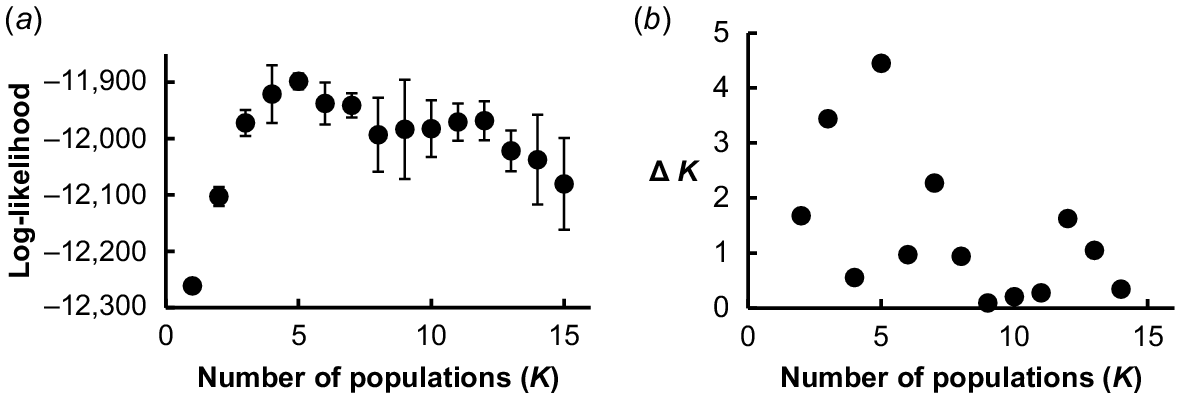
Clear population structuring was evident in all Structure models, with five distinct genetic populations (K = 5) best explaining the dataset as determined by both maximum mean log-likelihood (Fig. 2a) and rate of change in log-probability between successive K values (Fig. 2b).
Determining the number of genetic populations from (a) the maximum (least negative) mean log-likelihood value, and (b) maximum second order rate of change of the likelihood function (Δ K). Models are derived from eight simulations of each of 15 model population structures ranging between 1 and 15 genetic populations. Using both criteria the ‘best’ models are those with K = 5. Error bars represent standard deviations (n = 8).
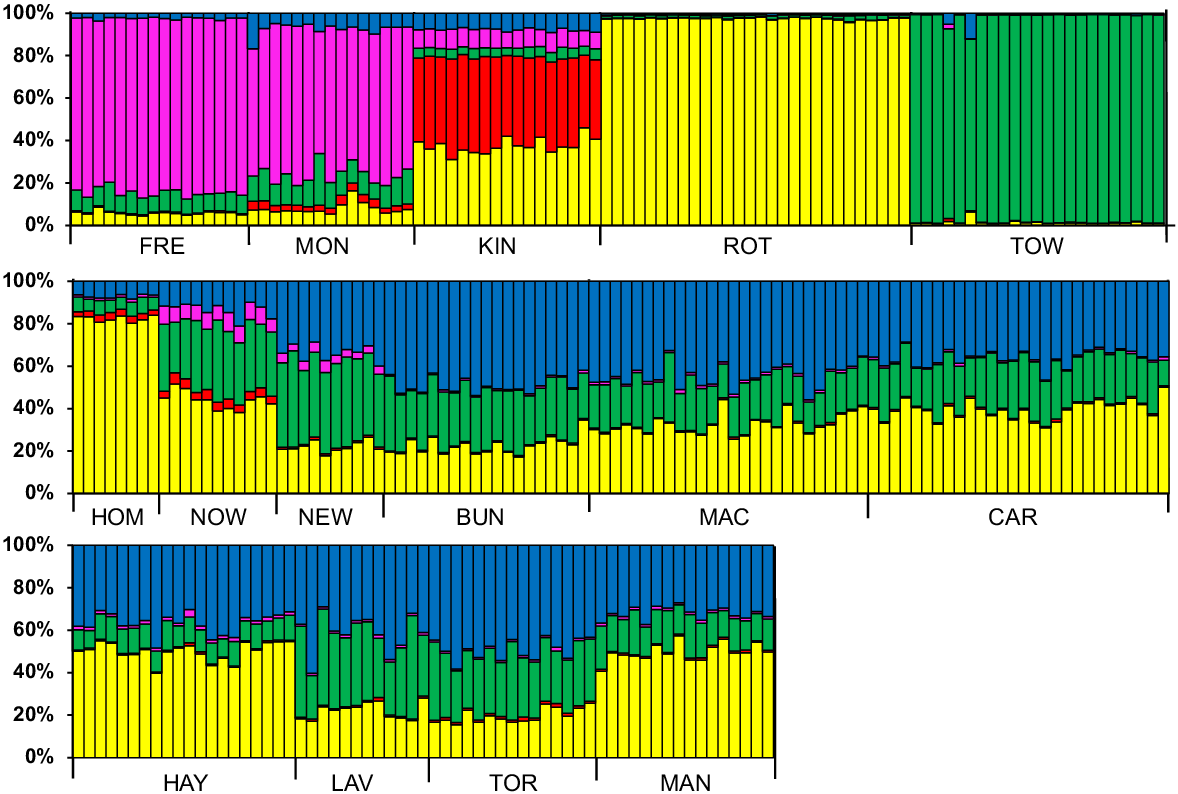
The two populations sampled on the island of Tasmania (Montagu and Freycinet) showed similar genetic composition but were distinct from the remaining 13 populations (Fig. 3). The other two oceanic island populations (Rottnest Island and King Island) also had unique population signatures. Of the mainland populations, Homebush Bay and Towra Point, the two populations surrounded by urban development, had distinct population signatures but the remaining mainland populations showed little variation among each other, while being distinct from all island populations (Fig. 3).
Population genetic structure of 264 white-fronted chats grouped into 15 sampling locations (see Fig. 1 for full location names) identified using the program Structure. Each bar represents an individual bird and shows the percentage contribution of five genetically distinct populations (represented by different colours) to its genetic composition.
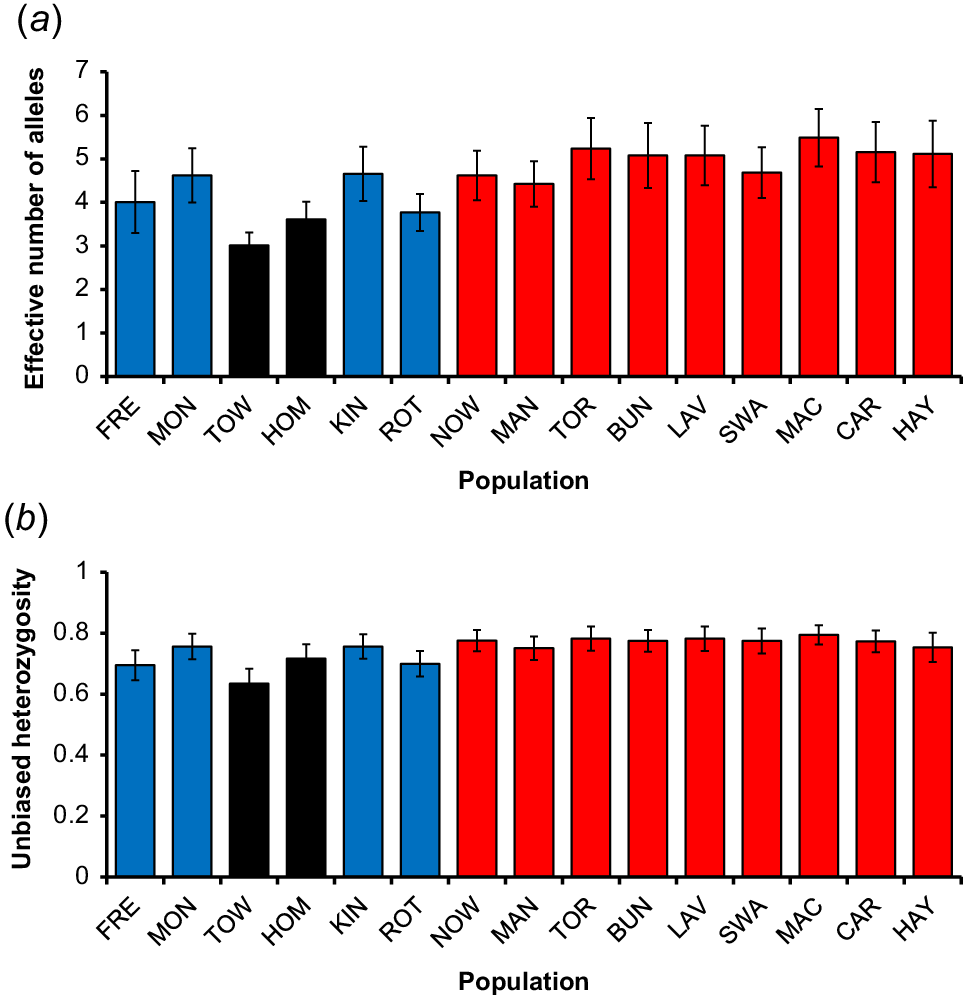
Genetic diversity measured by both allelic richness (F = 6.76, P < 0.01) and heterozygosity (F = 5.33, P < 0.01) varied significantly among populations (Fig. 4). The mean effective number of alleles per locus ranged between 3.0 (Towra Point) and 5.5 (Macquarie Marshes) with the two populations surrounded by an urban matrix having significantly lower allelic richness than the other mainland populations, whereas the ocean islands had intermediate values. Pairwise comparisons indicated that the population on the smallest oceanic island (Rottnest) had significantly lower allelic richness than most mainland populations (Appendix 1). Similar patterns were apparent for mean unbiased heterozygosity, which ranged between 0.63 (Towra Point) and 0.79 (Macquarie Marshes).
Variation in genetic diversity amongst 15 populations of white-fronted chats represented by (a) mean (±s.e.) number of effective alleles per locus, and (b) mean (±s.e.) unbiased heterozygosity. Blue bars denote ocean-island populations; black bars denote urban-island populations and red bars denote open mainland populations.
The genetic distances between all island and mainland populations were significantly different, including mainland pairwise FST comparisons with ocean island populations and with urban island populations (Table 1). Additionally, all pairwise FST comparisons among islands were highly significant. Pairwise differences between mainland populations were not significant with the exception of the NOW/CAR, NOW/BUN and TOR/HAY pairs (Table 1). Dest and FST values were highly correlated (R2 = 0.91) and accordingly, pairwise Dest showed the same pattern (Appendix 2). Ordination and clustering of the Dest matrix showed that the distances among island populations were large, and that the mainland populations clustered together (Fig. 5).
| FRE | MON | KIN | ROT | TOW | HOM | NOW | MAN | TOR | BUN | LAV | SWA | MAC | CAR | HAY | ||
|---|---|---|---|---|---|---|---|---|---|---|---|---|---|---|---|---|
| HAY | 0.061 | 0.037 | 0.041 | 0.034 | 0.071 | 0.037 | 0.013 | 0.005 | 0.013 | 0.004 | 0.005 | 0.017 | 0.005 | −0.004 | – | |
| CAR | 0.061 | 0.031 | 0.034 | 0.027 | 0.059 | 0.044 | 0.014 | 0.003 | 0.005 | −0.001 | −0.003 | 0.001 | 0.001 | – | ||
| MAC | 0.051 | 0.024 | 0.034 | 0.037 | 0.067 | 0.029 | 0.010 | 0.007 | 0.002 | 0.005 | −0.002 | −0.002 | – | |||
| SWA | 0.057 | 0.032 | 0.040 | 0.026 | 0.057 | 0.053 | 0.015 | 0.009 | −0.005 | 0.008 | −0.012 | – | ||||
| LAV | 0.061 | 0.029 | 0.035 | 0.035 | 0.048 | 0.045 | 0.001 | 0.006 | −0.005 | −0.003 | − | |||||
| BUN | 0.058 | 0.034 | 0.042 | 0.042 | 0.060 | 0.061 | 0.014 | 0.005 | −0.002 | – | ||||||
| TOR | 0.053 | 0.023 | 0.028 | 0.035 | 0.066 | 0.056 | 0.013 | 0.006 | – | |||||||
| MAN | 0.064 | 0.036 | 0.035 | 0.025 | 0.065 | 0.059 | 0.021 | – | ||||||||
| NOW | 0.047 | 0.033 | 0.045 | 0.035 | 0.056 | 0.027 | – | |||||||||
| HOM | 0.106 | 0.083 | 0.078 | 0.064 | 0.106 | – | ||||||||||
| TOW | 0.116 | 0.092 | 0.106 | 0.080 | – | |||||||||||
| ROT | 0.099 | 0.078 | 0.063 | – | ||||||||||||
| KIN | 0.064 | 0.032 | – | |||||||||||||
| MON | 0.001 | – | ||||||||||||||
| FRE | – |
Statistically significant pairwise differences are shaded. Ocean-island populations are denoted by bold, urban-island populations by italics and open mainland populations by standard font. Refer to Fig. 1 for full population names and locations. Red: P < 0.001; orange: 0.001 < P < 0.01; yellow: 0.01 < P < 0.05.
Genetic differentiation amongst 15 populations of white-fronted chats represented by (a) ordination and (b) group-averaged clustering of the pairwise Dest matrix using PRIMER. The ocean-island (FRE, MON, KIN, ROT – blue) and urban-island (TOW, HOM – black) populations differed significantly from each other and from all the open mainland populations (NOW, MAN, TOR, BUN, LAV, SWA, MAC, CAR, HAY – red) as determined by pairwise FST. Refer to Appendix 2 for pairwise Dest matrix.
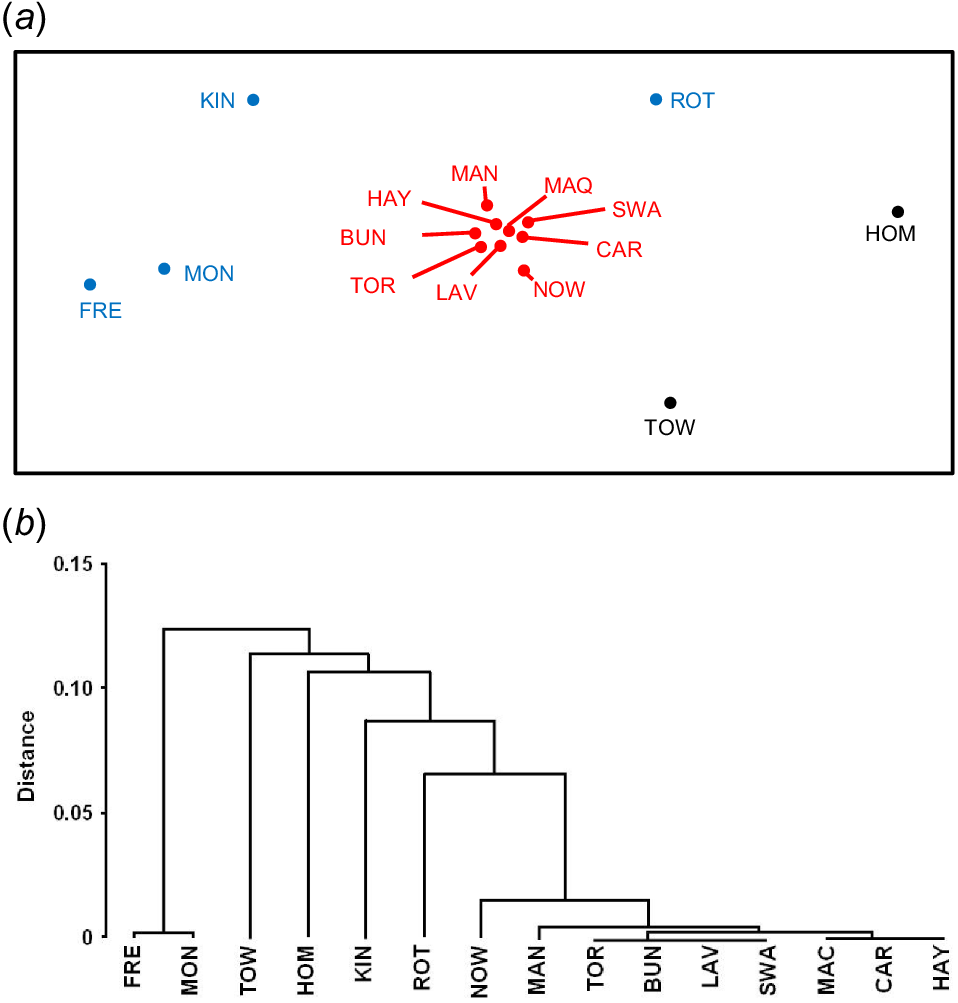
There was no evidence of genetic isolation by distance across mainland populations (Fig. 6) despite the large geographic distances compared with the proximity of island populations (Mantel R2 = 0.154).

Discussion
The white-fronted chat is a threatened species that may be susceptible to population decline due to habitat fragmentation, yet conservation efforts are hindered by a limited understanding of the species’ dispersal capacity and genetic connectivity. Sampling across the ~3000 km breadth of the species’ geographical range, genetic analysis revealed a lack of isolation by distance, and no population differentiation in white-fronted chats across mainland Australia, apart from two populations surrounded by an urban matrix that have been described previously (Major et al. 2014). In contrast, the populations on three oceanic islands were genetically distinct from the mainland populations and from each other, even though in one case the extent of the oceanic barrier from the mainland was only 18 km. These findings are highly relevant for understanding the species’ dispersal capacity, biogeographic history, and requirements for conservation.
While the north–south range of the white-fronted chat is continuous (Fig. 1) the east–west distribution is separated by both the Great Dividing Range and the Nullarbor Plain, with only scattered records of the species across the southern coastal fringe of Australia. This effective discontinuity has previously been postulated as a biogeographical barrier to the eastern and western distribution of the species, with a western subspecies, E. a. westralensis, distinguished by its paler colouration, separated from the eastern E. a. albifrons (Mathews 1912). However, this morphological variation has been disputed, ultimately resulting in the rejection of this subspecies (Keast 1958). Our genetic analysis supports this decision. In contrast, significant genetic structure has been identified by microsatellite analysis over much smaller spatial scales for other small passerines such as the eastern yellow robin (Eopsaltria australis), which exhibits strong north/south population structuring across a 1500 km continuous extent of suitable habitat in eastern Australia (Pavlova et al. 2013). Moreover, this species does not span the east/west extent of the continent, with the congeneric western yellow robin (E. griseogularis) replacing it in the west. Several other genera of small passerine have distinct eastern and western counterparts, e.g. eastern (Acanthorhynchus tenuirostris) and western (A. superciliosus) spinebills (Christidis and Boles 2008). The contrasting absence of any population structuring for the white-fronted chat both along latitudinal and longitudinal gradients suggests that the species has a strong capacity for dispersal, at least across non-urbanised land. White-fronted chats have been recorded in a range of open habitats including saltmarsh, chenopod shrublands and farmland but are generally absent from forests and woodlands (Higgins et al. 2001). Because these open habitats are relatively continuous, unlike southern Australian woodlands that have suffered severe habitat fragmentation, isolation by resistance or isolation by distance is less likely to be observed in white-fronted chats than in similar-sized woodland passerines including confamilial honeyeaters (Amos et al. 2014). In contrast, the open-habitat frequenting tawny-crowned honeyeater (Gliciphila melanops) shows no structure between south-eastern and south-western populations (Dolman and Joseph 2012). The lack of any isolation by distance observed in white-fronted chats is also consistent with earlier description of the species as being nomadic (Keast 1958).
Differences in nomadic behaviour, and by inference mobility, have historically been considered an important driver of subspeciation in Epthianura (Keast 1958) and for the lack of subspeciation in mainland E. albifrons. However, Keast (1958) identified a significant difference in bill length in Tasmanian E. albifrons and considered Bass Strait to be an effective barrier to gene flow, supporting the subspecies E. albifrons tasmanica described by Mathews (1912). Taxonomic delineation of Tasmanian E. albifrons has since been rejected (Schodde and Mason 1999) with the assertion that there were no morphological differences and presumably at least sporadic movements of this nomadic species across Bass Strait. Similar-sized passerines, e.g. flame robin (Petroica phoenicea), silvereye (Zosterops lateralis) and grey fantail (Rhipidura albiscapa), are known to cross Bass Strait (Garnett et al. 1991), making it reasonable to infer, prior to this study, that white-fronted chats might do likewise. However, unlike these recognised migrants, white-fronted chats have ‘short, broad, somewhat rounded wings’ (Higgins et al. 2001) rather than the longer, pointed wings more typical of migrants (Vágási et al. 2016).
Morphometrics of the same individuals as those sampled in the current study revealed significant differences in body size between island and mainland populations (Major 2012). This was interpreted as indicative of a restricted gene flow across oceanic barriers, challenging the assumption of movement across Bass Strait. The highly distinct genetic structures of the mainland, Tasmanian and geographically intermediate King Island populations observed in the present study support this challenge and perhaps justify reassessment of subspecies status. Regardless, the logical implication of these collective data is that white-fronted chats are not as highly mobile as has been interpreted from their oft-stated nomadic status: their movements, or the breeding success of migrants, are insufficient to prevent genetic drift or local adaptation. This establishes a paradox in that the lack of genetic differentiation across the mainland compared with species like E. australis is explained by high mobility, but that the differentiation between islands and the mainland is explained by a lack of it.
A plausible explanation of this paradox is that nomadism and flight capability may not be correlated. While chats can be nomadic, flying between areas of transient high food availability (Major 1991b), between drought and rainfall areas (Williams and Main 1976), or between patches of discontinuous habitat (Lindsay et al. 2015), this does not mean that they are capable fliers over long distances. They may have the predilection to move, but limitations in flight morphology may mean that they require rest stops, preventing them from traversing inhospitable habitat in which they cannot land. In contrast, species such as Z. lateralis, R. albiscapa and P. phoenicea are migrants with strong flight capability (Garnett et al. 1991), but they are also extremely territorial with high breeding-site fidelity, facilitating genetic differentiation. With weak flight capability, chats may not readily be able to traverse an oceanic barrier where resting opportunities are unavailable. Given that chats are never found in urban habitats and are particularly sensitive to human disturbance (Jenner et al. 2011), urban areas may also form a hostile barrier leading to genetic differentiation among relict populations surrounded by urban encroachment.
Our microsatellite data do not have the resolution to determine how the differentiation of the island populations has evolved, and future research measuring gene flow using an SNP array would be rewarding. However, it seems most likely that the island populations are relicts of a more continuous population. In the case of the urban islands (Homebush Bay and Towra Point), museum records indicate that prior to urbanisation, birds were found in wetlands that linked the remnant saltmarshes, creating a continuous distribution across what is now a major urban centre (Jenner et al. 2011). In the case of the oceanic islands (Rottnest Island, King Island and Tasmania), all three were joined to the mainland before sea-level rise over the last 7000–12,000 years. Genetic drift and/or local adaptation are likely to have occurred since separation, with some evidence of loss of genetic diversity in these smaller populations, and more recently in the small urban isolates.
Although the white-fronted chat is relatively abundant and remains secure in the more southern part of its range, a lack of strong dispersal ability preventing it from crossing oceanic and urban barriers invokes lessons for future conservation. The two urban populations in this study are listed as Endangered, and the species as Vulnerable in New South Wales (NSWSC 2010a, 2010b). Saltmarsh is the preferred habitat for the species and the natural fragmentation of this specialist habitat is being further fragmented by anthropogenic development and climate change, particularly in the coastal zone (Laegdsgaard et al. 2009; Ashcroft and Major 2013). Genetic structuring has also been identified among populations of the congeneric and Critically Endangered yellow chat (Epthianura crocea) (Houston et al. 2017), another habitat specialist with highly disjunct distributions (Keast 1958). This study demonstrates that it would be foolhardy to consider that the nomadic disposition of chats insulates them from habitat fragmentation. Populations isolated by hostile barriers such as expanses of water (e.g. Rottnest Island, King Island, Tasmania) or urbanised land (e.g. Homebush Bay, Towra Point) should be considered isolated populations and managed accordingly.
Data availability
Raw microsatellite data are provided as a Supplementary Table. Feather samples from which DNA was extracted are curated in the Australian Museum Tissue Collection.
Declaration of funding
This project was funded by grants from Lake Macquarie City Council and the Hermon Slade Foundation.
Acknowledgements
We are grateful to Joëlle Catherine and Greta Frankham for assistance with DNA extractions and to Katherine Oxenham, Ben Jenner, John Martin, Kurtis Lindsay, Kate Ravich and Petra Hanke for their assistance in the field. Birds were banded under Australian Bird and Bat Banding Scheme licence no. A1166. Approval to catch birds in each state was granted by permits from the respective wildlife authorities: New South Wales (S12586), Tasmania (FA10075), Victoria (10005367) and Western Australia (SF007844).
References
Amos JN, Harrisson KA, Radford JQ, White M, Newell G, Mac Nally R, Sunnucks P, Pavlova A (2014) Species- and sex-specific connectivity effects of habitat fragmentation in a suite of woodland birds. Ecology 95(6), 1556-1568.
| Crossref | Google Scholar | PubMed |
Ashcroft MB, Major RE (2013) Importance of matrix permeability and quantity of core habitat for persistence of a threatened saltmarsh bird. Austral Ecology 38(3), 326-337.
| Crossref | Google Scholar |
Coulon A, Fitzpatrick JW, Bowman R, Lovette IJ (2010) Effects of habitat fragmentation on effective dispersal of Florida scrub-jays. Conservation Biology 24(4), 1080-1088.
| Crossref | Google Scholar | PubMed |
Crawford NG (2010) SMOGD: software for the measurement of genetic diversity. Molecular Ecology Resources 10(3), 556-557.
| Crossref | Google Scholar | PubMed |
Dolman G, Joseph L (2012) A species assemblage approach to comparative phylogeography of birds in southern Australia. Ecology and Evolution 2(2), 354-369.
| Crossref | Google Scholar | PubMed |
Evanno G, Regnaut S, Goudet J (2005) Detecting the number of clusters of individuals using the software structure: a simulation study. Molecular Ecology 14(8), 2611-2620.
| Crossref | Google Scholar | PubMed |
Excoffier L, Lischer HEL (2010) Arlequin suite ver 3.5: a new series of programs to perform population genetics analyses under Linux and Windows. Molecular Ecology Resources 10(3), 564-567.
| Crossref | Google Scholar | PubMed |
Fan H, Guo W, Lin B, Hu Z, Wang C, Li S (2024) The influence of wing morphology upon intraspecific divergence in birds: a global study of subspecies richness. Avian Research 15, 100188.
| Crossref | Google Scholar |
Fandos G, Talluto M, Fiedler W, Robinson RA, Thorup K, Zurell D (2023) Standardised empirical dispersal kernels emphasise the pervasiveness of long-distance dispersal in European birds. Journal of Animal Ecology 92, 158-170.
| Crossref | Google Scholar | PubMed |
Garnett ST, Sutton P, Lowe K, Gray S (1991) Land bird movements across north-east Bass Strait, autumn 1988. Corella 15(1), 1-7.
| Google Scholar |
Haddad NM, Brudvig LA, Clobert J, Davies KF, Gonzalez A, Holt RD, Lovejoy TE, Sexton JO, Austin MP, Collins CD, Cook WM, Damschen EI, Ewers RM, Foster BL, Jenkins CN, King AJ, Laurance WF, Levey DJ, Margules CR, Melbourne BA, Nicholls AO, Orrock JL, Song DX, Townshend JR (2015) Habitat fragmentation and its lasting impact on Earth’s ecosystems. Science Advances 1(2), e1500052.
| Crossref | Google Scholar | PubMed |
Haig SM, Bronaugh WM, Crowhurst RS, D’Elia J, Eagles-Smith CA, Epps CW, Knaus B, Miller MP, Moses ML, Oyler-McCance S, Robinson WD, Sidlauskas B (2011) Genetic applications in avian conservation. The Auk 128(2), 205-229.
| Crossref | Google Scholar |
Houston W, Aspden W, Elder R, Black R, Neaves L, King A, Major R (2017) Restricted gene flow in the endangered Capricorn Yellow Chat Epthianura crocea macgregori: consequences for conservation management. Bird Conservation International 28(1), 116-125.
| Crossref | Google Scholar |
Jakobsson M, Rosenberg NA (2007) CLUMPP: a cluster matching and permutation program for dealing with label switching and multimodality in analysis of population structure. Bioinformatics 23(14), 1801-1806.
| Crossref | Google Scholar | PubMed |
Jenner B, French K, Oxenham K, Major RE (2011) Population decline of the white-fronted chat (Epthianura albifrons) in New South Wales, Australia. Emu 111(1), 84-91.
| Google Scholar |
Jost L (2008) GST and its relatives do not measure differentiation. Molecular Ecology 17(18), 4015-4026.
| Crossref | Google Scholar | PubMed |
Kays R, Crofoot MC, Jetz W, Wikelski M (2015) Terrestrial animal tracking as an eye on life and planet. Science 348(6240), aaa2478.
| Google Scholar |
Keast A (1958) The relationship between seasonal movements and the development of geographic variation in the Australian chats, (Epthianura Gould and Ashbyia North (Passeres: Muscicapidae, Malurinae)). Australian Journal of Zoology 6(1), 53-68.
| Crossref | Google Scholar |
Keast A (1968) Seasonal movements in the Australian honeyeaters (Meliphagidae) and their ecological significance. Emu 67(3), 159-209.
| Crossref | Google Scholar |
King AG, Cooke GM, Johnson RN, Major RE (2012) Development and multiplex genotyping of eighteen novel microsatellite markers for a threatened saltmarsh bird Epthianura albifrons (Meliphagidae). Conservation Genetics Resources 4, 893-896.
| Crossref | Google Scholar |
Lindsay KJ, Allen AP, Major RE (2015) Can spatial and temporal food variability explain the winter foraging movements of a threatened saltmarsh insectivore? Austral Ecology 40(2), 160-169.
| Crossref | Google Scholar |
Major RE (1991a) Breeding biology of the white-fronted chat Epthianura albifrons in a saltmarsh near Melbourne. Emu 91(4), 236-249.
| Crossref | Google Scholar |
Major RE (1991b) Flocking and feeding in the white-fronted chat Ephthianura albifrons: the relationship between diet, food availability and patch selection. Australian Journal of Ecology 16(3), 395-406.
| Crossref | Google Scholar |
Major RE (2012) Latitudinal and insular variation in morphology of a small Australian passerine: consequences for dispersal distance and conservation. Australian Journal of Zoology 60(3), 210-218.
| Crossref | Google Scholar |
Major RE, Johnson RN, King AG, Cooke GM, Sladek JLT (2014) Genetic isolation of endangered bird populations inhabiting saltmarsh remnants surrounded by intensive urbanization. Animal Conservation 17(5), 419-429.
| Crossref | Google Scholar |
Mathews GM (1912) A reference-list to the birds of Australia. Novitates Zoologicae 18, 171-446.
| Google Scholar |
Niebuhr BBS, Wosniack ME, Santos MC, Raposo EP, Viswanathan GM, da Luz MGE, Pie MR (2015) Survival in patchy landscapes: the interplay between dispersal, habitat loss and fragmentation. Scientific Reports 5, 11898.
| Crossref | Google Scholar | PubMed |
NSWSC (2010a) White-fronted chat (Epthianura albifrons) population in the Sydney Metropolitan Catchment Management Authority area – endangered population listing. New South Wales Scientific Committee. Available at https://www2.environment.nsw.gov.au/topics/animals-and-plants/threatened-species/nsw-threatened-species-scientific-committee/determinations/final-determinations/2008-2010/white-fronted-chat-epthianura-albifrons-endangered-population-listing [accessed 1 January 2025]
NSWSC (2010b) White-fronted chat (Epthianura albifrons) – vulnerable species listing. New South Wales Scientific Committee. Available at https://www2.environment.nsw.gov.au/topics/animals-and-plants/threatened-species/nsw-threatened-species-scientific-committee/determinations/final-determinations/2008-2010/white-fronted-chat-epthianura-albifrons-vulnerable-species-listing [accessed 1 January 2025]
Paradis E, Baillie SR, Sutherland WJ, Gregory RD (1998) Patterns of natal and breeding dispersal in birds. Journal of Animal Ecology 67(4), 518-536.
| Crossref | Google Scholar |
Pavlova A, Amos JN, Joseph L, Loynes K, Austin JJ, Keogh JS, Stone GN, Nicholls JA, Sunnucks P (2013) Perched at the mito-nuclear crossroads: divergent mitochondrial lineages correlate with environment in the face of ongoing nuclear gene flow in an Australian bird. Evolution 67(12), 3412-3428.
| Crossref | Google Scholar | PubMed |
Peakall R, Smouse PE (2006) GENALEX 6: genetic analysis in excel. Population genetic software for teaching and research. Molecular Ecology Notes 6(1), 288-295.
| Crossref | Google Scholar |
Pritchard JK, Stephens M, Donnelly P (2000) Inference of population structure using multilocus genotype data. Genetics 155(2), 945-959.
| Crossref | Google Scholar | PubMed |
Sullivan BL, Wood CL, Iliff MJ, Bonney RE, Fink D, Kelling S (2009) eBird: a citizen-based bird observation network in the biological sciences. Biological Conservation 142(10), 2282-2292.
| Crossref | Google Scholar |
Vágási CI, Pap PL, Vincze O, Osváth G, Erritzøe J, Møller AP (2016) Morphological adaptations to migration in birds. Evolutionary Biology 43, 48-59.
| Crossref | Google Scholar |
Williams CK, Main AR (1976) Ecology of Australian chats (Epthianura Gould) season movements, metabolism and evaporative water loss. Australian Journal of Zoology 24(3), 397-416.
| Crossref | Google Scholar |
Appendix 1.Significance probabilities of pairwise comparisons of genetic diversity measured by (a) effective number of alleles, and (b) unbiased heterozygosity.
Statistical differences were determined by Wilcoxon paired-sample signed rank tests implemented in JMP®, ver. 17.2. SAS Institute Inc., Cary, NC, 1989–2023. Statistically significant pairwise differences are shaded. Ocean-island populations are denoted by bold, urban-island populations by italics and open mainland populations by standard font. Refer to Fig. 1 for full population names and locations.
| (a) | FRE | MON | KIN | ROT | TOW | HOM | NOW | MAN | TOR | BUN | LAV | SWA | MAC | CAR | HAY | |
|---|---|---|---|---|---|---|---|---|---|---|---|---|---|---|---|---|
| HAY | 0.151 | 0.380 | 0.569 | 0.043 | 0.007 | 0.001 | 0.677 | 0.176 | 0.717 | 0.970 | 0.677 | 0.380 | 0.470 | 1.000 | – | |
| CAR | 0.151 | 0.339 | 0.424 | 0.016 | 0.001 | 0.002 | 0.519 | 0.110 | 0.970 | 0.470 | 0.519 | 0.339 | 0.204 | |||
| MAC | 0.077 | 0.092 | 0.129 | 0.002 | 0.001 | 0.002 | 0.092 | 0.016 | 0.151 | 0.204 | 0.519 | 0.016 | ||||
| SWA | 0.380 | 0.733 | 0.733 | 0.021 | 0.002 | 0.110 | 0.970 | 0.569 | 0.211 | 1.000 | 0.204 | |||||
| LAV | 0.233 | 0.677 | 0.677 | 0.016 | 0.002 | 0.007 | 0.470 | 0.110 | 0.850 | 0.970 | ||||||
| BUN | 0.204 | 0.339 | 0.424 | 0.034 | 0.003 | 0.002 | 0.622 | 0.151 | 0.424 | |||||||
| TOR | 0.129 | 0.151 | 0.204 | 0.003 | 0.002 | 0.005 | 0.339 | 0.064 | ||||||||
| MAN | 0.301 | 0.910 | 0.677 | 0.110 | 0.002 | 0.014 | 0.791 | |||||||||
| NOW | 0.092 | 0.970 | 0.970 | 0.092 | 0.002 | 0.052 | ||||||||||
| HOM | 0.970 | 0.077 | 0.028 | 0.569 | 0.176 | |||||||||||
| TOW | 0.176 | 0.007 | 0.007 | 0.016 | P < 0.01 | |||||||||||
| ROT | 1.000 | 0.204 | 0.016 | P < 0.05 | ||||||||||||
| KIN | 0.151 | 0.519 | ||||||||||||||
| MON | 0.077 | |||||||||||||||
| FRE | – |
| (b) | FRE | MON | KIN | ROT | TOW | HOM | NOW | MAN | TOR | BUN | LAV | SWA | MAC | CAR | HAY | |
|---|---|---|---|---|---|---|---|---|---|---|---|---|---|---|---|---|
| HAY | 0.204 | 1.000 | 1.000 | 0.176 | 0.027 | 0.043 | 0.482 | 0.718 | 0.622 | 0.733 | 0.691 | 0.970 | 0.691 | 0.677 | – | |
| CAR | 0.077 | 0.569 | 0.733 | 0.021 | 0.002 | 0.054 | 0.970 | 0.292 | 0.569 | 0.850 | 0.569 | 0.987 | 0.104 | |||
| MAC | 0.034 | 0.176 | 0.176 | 0.002 | 0.001 | 0.021 | 0.380 | 0.034 | 0.970 | 0.206 | 0.380 | 0.339 | ||||
| SWA | 0.204 | 0.677 | 0.569 | 0.017 | 0.002 | 0.204 | 0.662 | 0.413 | 0.776 | 0.970 | 0.531 | |||||
| LAV | 0.077 | 0.470 | 0.464 | 0.005 | 0.002 | 0.092 | 0.791 | 0.129 | 0.637 | 0.677 | ||||||
| BUN | 0.052 | 0.391 | 0.458 | 0.023 | 0.005 | 0.041 | 0.662 | 0.226 | 0.329 | |||||||
| TOR | 0.052 | 0.211 | 0.129 | 0.005 | 0.002 | 0.110 | 0.691 | 0.077 | ||||||||
| MAN | 0.151 | 0.910 | 0.734 | 0.052 | 0.012 | 0.266 | 0.424 | |||||||||
| NOW | 0.027 | 0.519 | 0.470 | 0.027 | 0.002 | 0.151 | ||||||||||
| HOM | 0.622 | 0.424 | 0.339 | 0.677 | 0.110 | |||||||||||
| TOW | 0.301 | 0.021 | 0.021 | 0.041 | P < 0.01 | |||||||||||
| ROT | 0.850 | 0.129 | 0.110 | P < 0.05 | ||||||||||||
| KIN | 0.077 | 0.850 | ||||||||||||||
| MON | 0.021 | |||||||||||||||
| FRE | – |
Appendix 2.Genetic distance among populations calculated by pairwise Dest, calculated using SMOGD (Crawford 2010).
Ocean-island populations are denoted by bold, urban-island populations by italics and open mainland populations by standard font. Refer to Fig. 1 for full population names and locations.
| FRE | MON | KIN | ROT | TOW | HOM | NOW | MAN | TOR | BUN | LAV | SWA | MAC | CAR | HAY | ||
|---|---|---|---|---|---|---|---|---|---|---|---|---|---|---|---|---|
| HAY | 0.137 | 0.072 | 0.080 | 0.063 | 0.107 | 0.065 | 0.018 | 0.001 | 0.014 | 0.001 | 0.001 | 0.005 | 0.000 | −0.008 | – | |
| CAR | 0.160 | 0.077 | 0.081 | 0.058 | 0.095 | 0.085 | 0.017 | 0.002 | 0.006 | 0.000 | 0.000 | 0.000 | 0.000 | – | ||
| MAC | 0.151 | 0.071 | 0.073 | 0.087 | 0.132 | 0.061 | 0.021 | 0.005 | 0.002 | 0.001 | 0.000 | 0.000 | – | |||
| SWA | 0.106 | 0.059 | 0.102 | 0.026 | 0.092 | 0.095 | 0.002 | 0.003 | −0.001 | 0.001 | −0.006 | – | ||||
| LAV | 0.138 | 0.066 | 0.092 | 0.076 | 0.075 | 0.107 | 0.000 | 0.004 | −0.001 | 0.005 | – | |||||
| BUN | 0.155 | 0.061 | 0.082 | 0.095 | 0.087 | 0.151 | 0.031 | 0.008 | 0.000 | – | ||||||
| TOR | 0.145 | 0.053 | 0.066 | 0.082 | 0.105 | 0.122 | 0.006 | 0.009 | – | |||||||
| MAN | 0.144 | 0.071 | 0.054 | 0.033 | 0.106 | 0.130 | 0.029 | – | ||||||||
| NOW | 0.075 | 0.083 | 0.118 | 0.074 | 0.061 | 0.047 | – | |||||||||
| HOM | 0.227 | 0.210 | 0.188 | 0.124 | 0.186 | – | ||||||||||
| TOW | 0.203 | 0.167 | 0.203 | 0.119 | – | |||||||||||
| ROT | 0.194 | 0.182 | 0.124 | – | ||||||||||||
| KIN | 0.150 | 0.060 | – | |||||||||||||
| MON | 0.002 | – | ||||||||||||||
| FRE | – |