

The Arid Zone Monitoring Project: combining Indigenous ecological expertise with scientific data analysis to assess the potential of using sign-based surveys to monitor vertebrates in the Australian deserts
Sarah Legge A B * , Naomi Indigo C D , Darren M. Southwell E F , Anja Skroblin F , Tida Nou C , Alys R. Young F G , Jaana Dielenberg H , David P. Wilkinson H , Diego Brizuela-Torres I , M N , Catherine Lynch O , O , Katherine Tuft X , Keith Bellchambers Y , Kevin Bradley M , Kim Webeck Z , AC , Martin Dziminski AD , O , Rick Southgate M , Rob Brandle S , Stephen van Leeuwen AL , Thalie Partridge Z AM , Thomas M. Newsome AN ,
 A
B
C
D
E
F
G
H
I
J
K
L
M
N
O
P
Q
R
S
T
U
V
W
X
Y
Z
AA
AB
AC
AD
AE
AF
AG
AH
AI
AJ
AK
AL
AM
AN
AO
AP
Abstract
Deserts cover large areas and support substantial biodiversity; however, like other biomes, they are experiencing biodiversity loss. Monitoring biodiversity trends in deserts is rare, partly because of the logistical challenges of working in remote areas. This is true also in Australia, which has one of the largest and least populated desert areas worldwide, has suffered marked biodiversity loss since European colonisation, and has minimal large-scale biodiversity monitoring. However, Indigenous people of many Traditional Owner groups continue to live in, and care for, these deserts. Over the past two decades, Indigenous ranger groups have been collecting species records by using sign-based surveys, adding to work begun in the 1980s by researchers and government scientists. In sign-based surveys, the presence (or absence) of species is recorded by searching on sandy substrates for tracks, scats, burrows and diggings in a fixed area, or a fixed time. Such surveys combine the tracking skills of Indigenous people with robust analytical methods. Here, we describe a desert-wide project that collated and analysed existing sign-based data to explore its potential for local-, regional- and national-scale biodiversity monitoring. The Arid Zone Monitoring Project also provided guidance about future monitoring designs and data-collection methods for varying survey objectives. The project collated data from 44 groups and individuals, comprising almost 15,000 surveys from over 5300 unique sites, with almost 49,000 detections of 65 native and 11 introduced species, including threatened, and culturally significant species. Despite heterogeneity in survey objectives and data collection methods, we were able to use the collated data to describe species distributions and understand correlates of suitable habitat, investigate temporal trends, and to simulate the monitoring effort required to detect trends in over 25 vertebrate species at regional and national scales. Most importantly, we built a large collaboration, and produced informative maps and analyses, while respecting the intellectual property and diverse aspirations of the project partners. With this foundation in place, a national sign-based monitoring program for medium–large desert vertebrates seems achievable, if accompanied by overarching coordination and survey support, training, standardised data collection, improved sampling design, centralised data curation and storage, and regular communication.
Keywords: desert fauna, Indigenous ecological knowledge, Indigenous tracking skills, introduced species, monitoring, population trends, species distribution models, track-based surveys.
| Short summary and translation |
| Our old people taught us how to recognise tracks and scats of different animals. Looking for tracks and scats is a good way to be on Country and pass knowledge from older to younger people. If we search for animal signs regularly, we can collect information on which animals are present, and whether their numbers are going up or down. In this project, we come together to talk about our animals and the bigger picture of what is happening in the desert. |
| Pitjantjatjara: Nganaṉanya nintiringi Aṉangu puḻka tjuṯangku tjina munu kuna tjuṯa ngurkantankunytjaku. Animal kutjupa tjuṯaku. Ngurintjaku tjina tjuṯa munu kuna tjuṯa panya ngurangka munu ma-nintitjaku Aṉangu puḻka tjuṯangka tjitji tjuṯakutu. Panya nganaṉa ngurkantanyi nyanga palunya tjananya munula mantjlpai animals nyaa: tjuṯa nyinanyi kuwari tjinguruya tjuṯaringanyi manta mankuraringu. Ka project nyangangka nganaṉa ma-ungkupai tjukurpa Tjuta. Kutjupa tjuṯa picture puḻka nyakuntjikitjangku. Nyaanganyi animal tjuṯa nganampa ngurangka. [Translated by Jeanie Robin.] |
| Pintupi Luritja: Ngunampa kapali tjumuku ngunanya nintinu tjina kuna mituntjaku kukaku. Nangunyi tjinaku kunaku ngunampa ngurra palyalinku tinatjutanya nintitjaku wimatjutanya. Nganana nungunyi kukuku tjunguru tjuna uparing/tjunguru tjuna tjutaring. Nanana tjungurinkula wankanyi ngunampa kukatjara tjuna yaltjirinyi tjutangka. [Translated by Ebony West.] |
| A short video about our project can be seen here (or access the video from the Supplementary material). |
The project includes contributions from Indigenous people of many different language groups across Australia’s deserts. Here we include translations of the summary in two languages, Pitjantjatjara and Pintupi Luritja, whose speakers are located centrally in the Australian deserts. In the main text of the paper, animal names are translated into several different languages, to highlight the diversity of groups involved in the project, and the strong place-based connections of people to Country.
Introduction
Almost a fifth of the world’s land mass is covered by deserts, supporting substantial biodiversity (Safriel et al. 2005). Yet, deserts attract less conservation investment and biodiversity monitoring and research attention than do other biomes (Durant et al. 2012), even though they have experienced high rates of biodiversity loss (Durant et al. 2014; Soultan et al. 2019). Biodiversity loss is now being exacerbated by climate-change effects, occurring faster in deserts than in forested and mountainous environments (Loarie et al. 2009).
These global patterns are evident in Australia, the driest inhabited continent. Pre-colonisation by Europeans, Australian deserts had a distinctive endemic mammal fauna. However, since colonisation, approximately 60% of mammal species have become extinct and the distributions of many other species have been reduced, owing to threats including habitat degradation, changed fire regimes, and invasive species (Burbidge and McKenzie 1989; McKenzie et al. 2007; Woinarski et al. 2015; Legge et al. 2023). The attrition is continuing, and understanding the distribution and trends of native and invasive species is fundamental for conservation management (Legge et al. 2018; Likens and Lindenmayer 2018). These biodiversity declines have inextricable social and cultural dimensions; the wellbeing of Australian Traditional Owners is inseparable from the well-being of their Country (‘healthy country, healthy people’, Cameron 2020). Therefore, endeavours to address Indigenous disadvantage in desert communities must also understand the ecological context, namely, the species present, the threats present and how they can be managed, and the enduring stewardship of Country, that traditional knowledge systems represent (Cameron 2020; Heaton 2021).
However, monitoring animal populations in Australia’s deserts is challenging. In these low-productivity environments, desert species are often spread patchily over vast areas at very low densities (Morton et al. 2011). Many species are nocturnal and cryptic, so detecting individuals is difficult (Dickman et al. 2018). Populations of many species are nomadic, or go through cycles of boom and bust in response to infrequent rainfall events (Letnic and Dickman 2010; Yang et al. 2010), which can make it difficult to distinguish trends from natural fluctuations. The deserts are also remote, with limited access, especially after heavy rainfall, making monitoring logistically difficult and expensive.
Sign-based surveys, i.e. systematic searches of animal tracks, scats, burrows and diggings, are a method that can be used to monitor populations of many desert animal species over large areas (Allen et al. 1996; Southgate et al. 2005; Southgate and Moseby 2008). The sandy substrates of deserts are particularly suited to searching for animal tracks and other signs. The technique can be achieved at larger scales than trapping surveys, because it is simpler, cheaper (not requiring a large time or equipment investment) and appropriate for detecting a broader range of species than are aerial counts (Keeping et al. 2018; Lunney et al. 2018). More importantly, it builds on the strong ecological and tracking traditions of Indigenous peoples who continue to be custodians of desert Country, including many areas now in Australia’s reserve system (Robin et al. 2022). Sign-based surveys bring tracking skills and interests of Indigenous peoples into a methodological framework that allows for quantitative analysis (Keeping et al. 2018). Similarly, the efforts and incidental sightings from citizen scientists can also be incorporated into national-scale survey designs (Benshemesh et al. 2018).
Sign has been used to survey for invasive and threatened species in Australia’s deserts, for specific purposes. For example, sign-based surveys were used in the Tanami Desert to record the distribution of the bilby (Macrotis lagotis, walpajirri in Warlpiri), a nationally threatened marsupial (Southgate et al. 2005, 2007), and as part of a regional biodiversity survey program (Central Land Council and Low Ecological Services 2018). Sign-based surveys were also used to map changes in distribution of the crest-tailed mulgara (Dasycercus cristicauda, amperte in Arrernte), dusky hopping mouse (Notomys fuscus, wilkiniti in Dieri) and other species after the arrival of rabbit calicivirus (Pedler et al. 2016). They were used to understand the influence of habitat and seasonality on the occurrence of medium–large mammals (Paltridge and Southgate 2001), the influence of fire and predators on the distribution of the brush-tailed mulgara (Dasycercus blythii, murtja or arutju in Pitjantjatjara) (Masters et al. 1997), and identify key threats to the great desert skink (Liopholis kintorei, warrarna in Warlpiri) (Moore et al. 2015; Moore et al. 2018; Paltridge et al. 2020). Recently, sign-based monitoring has been used to highlight the changes in fauna abundance inside and outside conservation fences (McGregor et al. 2020; Moseby et al. 2020).
Sign-based surveys have become a widely used tool for many Indigenous ranger and Traditional Owner (Traditional Custodian) groups and land-management organisations. They can provide employment, and importantly, they provide opportunities for people to continue cultural practices on Country and facilitate intergenerational knowledge transfer from elders to youth, as well as share skills cross-culturally with other scientists. Survey data can also help direct management actions and inform Healthy Country reporting on Indigenous Protected Areas (IPAs; these are areas managed by Indigenous peoples for cultural and conservation outcomes, and recognised as part of the National Reserve System through voluntary agreements with the Australian Government). For example, sign-based surveys have been used by Traditional Owners of the Kiwirrkurra IPA to examine whether cat hunting reduces cat activity around threatened species populations of the bilby (ninu in Pintupi) and great desert skinks (tjalapa in Pintupi) (Kiwirrkurra and Paltridge 2020; Paltridge et al. 2020). On the Matuwa IPA, the Wiluna Martu rangers used sign-based surveys to assess the post-translocation dispersal and survivorship of golden bandicoots (Isoodon auratus, mingajurru in Walmajarri) (Blythman et al. 2020). Trends in bilbies (mankarr in Manyjilyjarra), a culturally significant species, are being monitored using sign-based surveys on the Martu Native Title Determination (Skroblin et al. 2022).
These local uses for sign-based surveys have been augmented by a few large-scale programs, such as regional surveys for bilbies (narlgumirdi in Yawuru) in the Pilbara and Kimberley (e.g. Moore et al. 2024), and the Bilby Blitz in 2017–2018, a large-scale survey effort, coordinated across many ranger groups operating within the bilby (jitarru in Karajarri) distribution (Paltridge 2016). Data from these surveys have been partly collated in a pilot system developed by Central Land Council and the Atlas of Living Australia. In a second example, great desert skinks (mulyamiji in Manyilijarra) have been monitored at some local sites for 20 years, with data collated across sites and used to inform the species recovery plan (Indigenous Desert Alliance 2023). More recently, over a dozen desert-ranger groups have undertaken burrow searches for great desert skinks (mulyamiji in Kartujarra) in March 2023 and 2024, coordinated by the Indigenous Desert Alliance.
These various projects suggest that if sign-based survey data could be collated from the many groups and individuals that use the technique, and if the data collection was sufficiently standardised, and the sampling design was robust, the combined dataset could be used to describe species distributions and trends at local, regional and even national scales. This idea has been discussed over many years during arid-zone species recovery and biodiversity management meetings (Southgate and Moseby 2008). The standardised data collection method (a fixed area, fixed time search) was included in a field guide designed to encourage uptake of the technique (Moseby et al. 2009, 2023). Nevertheless, most sign-based data have not been collated, curated, analysed or reported, frustrating many ranger groups concerned that collecting data never leads anywhere. Authors of the 2021 State of the Environment report similarly noted that better coordination of data collected by Traditional Owners would enhance reporting of the environmental outcomes ascribed to Indigenous management practices and IPAs (Cresswell et al. 2021). This context led to the Arid Zone Monitoring (AZM) Project, which ran between 2019 and 2021.
The AZM Project supported groups and individuals who used sign-based surveys, especially Indigenous groups, in three ways. First, the project aimed to demonstrate the potential uses of a collated national dataset. This proof-of-concept was crucial because rangers, Traditional Owners, and other data providers needed tangible examples of the value from such a collaboration. Second, the AZM Project aimed to provide guidance about monitoring design and data-collection methods to help groups achieve their local objectives more effectively. This would encourage groups to continue to collect sign-based survey data with consistency, allowing for aggregation of regional- and national-scale analyses. Third, the project aimed to describe the sampling effort required to establish regional and national coordinated monitoring programs that would track changes in the populations of key native species, including threatened species, culturally significant species, and invasive species across the Australian deserts.
Here, we describe how we developed the collaboration to collate multiple, diverse datasets into one AZM national dataset. We report on the scale and content of the dataset, and outline the key information products shared with project partners. This included a Species Profiles Manual, with information on species detected in sign-based surveys, and guidance for improving data collection and future monitoring design. We discuss the dataset value (and limitations) for describing spatio-temporal patterns in species distributions, and consider the potential for using sign-based surveys in a national monitoring program across Australia’s deserts.
Developing the collaboration and defining the project area
We developed the project collaboration over 2 years, by iteratively discussing the project with people and groups associated with survey work in the deserts. The purpose of these discussions was to understand how the project could be most useful to project collaborators, to identify what data were available, to understand what the data-sharing sensitivities were, and to begin the process of developing formal data-sharing arrangements. The array of collaborators was diverse, and geographically dispersed. The project included individual ranger groups, Indigenous organisations, state agency staff, university researchers and consultants, and non-governmental organisation (NGO) staff. We made personal contact with each individual and group and attended many desert gatherings (e.g. land-management regional meetings, Indigenous Desert Alliance conferences, Species of the Desert conference), to build relationships and refine the aims of the project collaboratively. Focus workshops were held in some geographic areas where a shared discussion among collaborators was needed.
Once each collaborator was ready to participate in the project, data sharing was formalised through a data licence. The template licence included the following critical provisions: the data would remain the intellectual property of the data provider and be held confidentially by the project; the project outputs would not disclose the locations of sensitive species records; and project collaborators would approve the project outputs and be given the opportunity to be co-authors in any outputs. Developing the data licence with any one partner took up to 18 months, especially if the authority to approve rested with a group that met infrequently. For example, some Prescribed Body Corporate boards, Traditional Owner and Ranger Advisory Committees, and IPA management committees meet only bi-annually or annually.
We developed data licences for 21 project partners, representing 40 data providers (including 29 ranger groups), as some data licenses covered multiple groups administered by one organisation. Four additional partners preferred to join the project and share data without having a data licence in place, making 44 data providers. As well as building the collaboration with people and groups that hold sign-based survey data, we also interacted with several organisations interested in the project outputs, and with organisations that support Indigenous land management and Healthy Country Planning. The model of developing bilateral relationships and data licences, rather than a single, multi-partner agreement, was time-consuming, but it meant that the specific context and needs of each partner could be fully respected, and it maximised buy-in to the project.
Project area
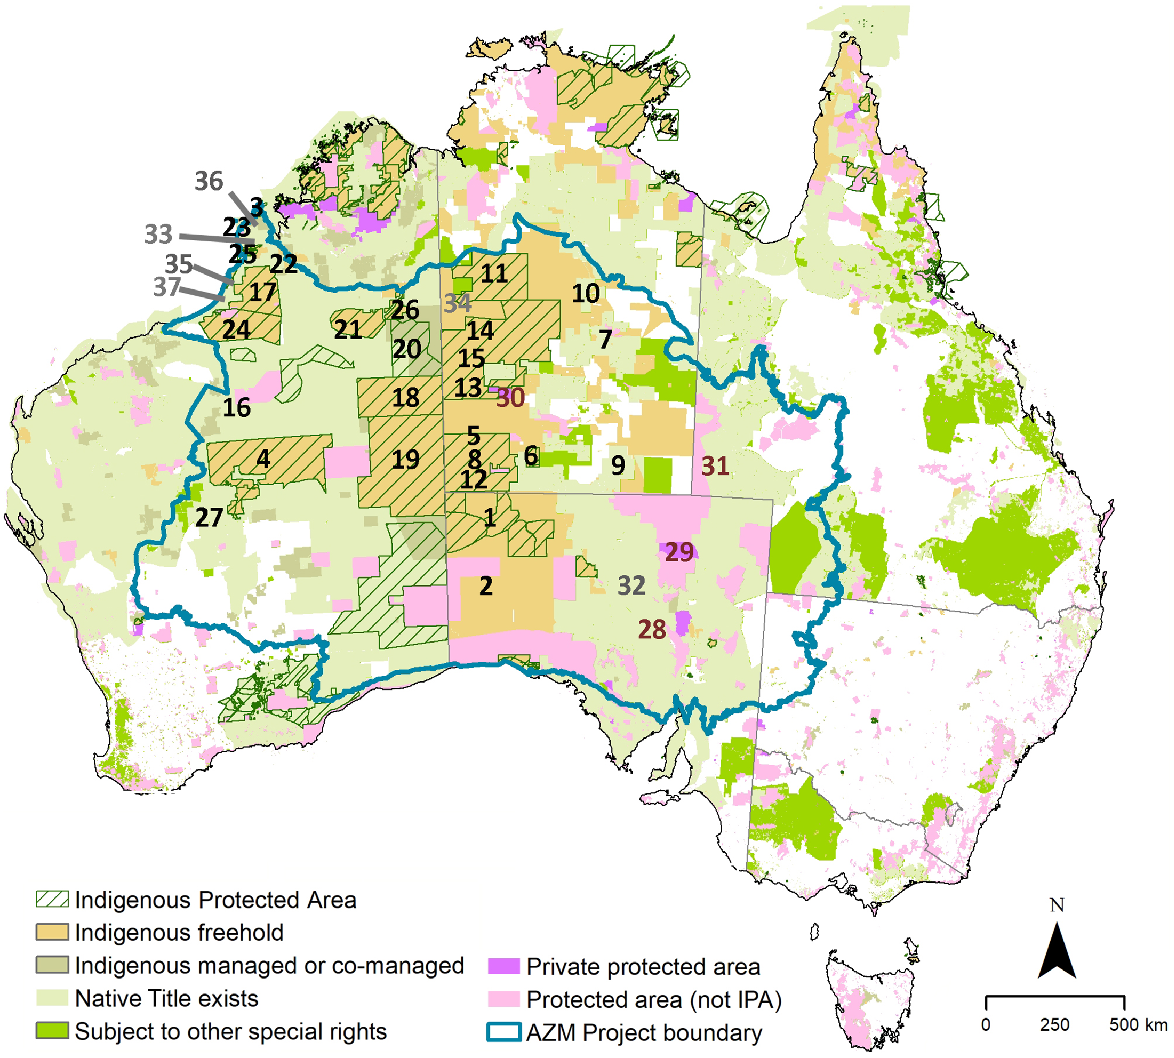
The project area covered 3,273,140 km2 (>42% of Australia’s land area) and was defined by IBRA subregional boundaries (Thackway and Cresswell 1997), such that all sites in the contributed data were enclosed by the boundary. This resulting project area included all of Australia’s major deserts, with an extension in the north-west to include the Pindanland subregion (Dampierland bioregion), which has substrates suitable for sign-based surveys. A small extension was also made into the Augustus, Fortescue, and Chichester subregions (Gascoyne and Pilbara bioregions), to include sites surveyed by Martu People and Kanyirninpa Jukurrpa rangers (Fig. 1). Defining the project boundary was necessary for setting the ‘environmental envelope’ used in habitat-suitability modelling.
The Arid Zone Monitoring Project area (within the blue–green boundary) overlaid on a background showing areas that are owned, or managed or co-managed, by Indigenous groups across Australia. Areas also designated as Indigenous Protected Areas (IPAs) are shown in green hatching. Protected areas (public or private) in the National Reserve System that are not IPAs are shown in light or dark pink. Spatial data on Native Title determinations are from the National Native Title Tribunal (NNTT 2024), on tenures from Australian Bureau of Agricultural and Resource Economics and Sciences (ABARES 2020), and on the IPAs from Commonwealth of Australia (Commonwealth of Australia 2023). Data providers are shown with numbers, as follows: Indigenous groups: 1, Aṉangu Pitjantjatjara Yankunytjatjara (rangers on 5 IPAs: Antara-Sandy Bore, Apara Makiri Punti, Kalka-Pipalyatjara, Walalkara, Watarru); 2, Alinytjara Wilurara landscapes (comprising multiple ranger groups and communities); 3, Kimberley Land Council Land and Sea Management Unit; 4, Birriliburu; 5, Central Land Council (CLC) Aṉangu Luritjiku; 6, CLC Angas Downs; 7, CLC Anmatyerr and Illeuwurru; 8, CLC Kaltukatjara; 9, CLC Ltyentye Apurte; 10, CLC Muru-warinyi Ankkul; 11, CLC North Tanami; 12, CLC Tjakura; 13, CLC Warlpiri Nyirripi; 14, CLC Warlpiri Willowra; 15, CLC Warlpiri Yuendumu; 16, Kanyirninpa Jukurrpa (4 rangers groups: Jigalong, Kunawarritji, Parnngurr, Punmu); 17, Karajarri; 18, Kiwirrkurra; 19, Ngaanyatjarra Council (3 ranger groups: Blackstone, Warburton, Warakurna); 20, Ngururrpa; 21, Ngurrara; 22, Nyikina Mangala; 23, Nyul Nyul; 24, Nyangumarta; 25, Yawuru; 26, Paruku; 27, Wiluna Martu; NGOs: 28, Arid Recovery; 29, Kalamurina Wildlife Sanctuary; 30, Newhaven Wildlife Sanctuary and Newhaven Warlpiri Rangers; 31, Save the Bilby; Government/Industry: 32, South Australian (SA) Department of Environment and Water; 33, Kimberley Mineral Sands; 34, Terrestrial Ecosystem Research Network; 35, Western Australian (WA) Department of Biodiversity, Conservation and Attractions; 36, WA Main Roads; 37, Jackett. Data from individual researchers usually came from these providers, except for additional data from Newsome (same area as 34), and Southgate (SA–Qld).
Collating data into the Arid Zone Monitoring national dataset
The data providers included Indigenous ranger groups, government scientists, university scientists, NGOs and consultants, who had collected sign-based data between 1982 and 2021. Their work had a range of objectives, from surveys to describe occurrences of single species (and potentially changes over time) to general fauna surveys. Many datasets arose from programs that sought to provide opportunities for on-Country trips and knowledge exchange. Datasets arrived as excel worksheets, outputs from cybertracker or app-based data collection systems such as Fulcrum, and as scans of hardcopy datasheets. Some data were collected using standardised methods, such as 2-hectare plot searches, or structured road transects; or timed plotless searches. Other contributions were species detection information that had been collected opportunistically. The contributed datasets had disparate structures, data fields, and naming conventions. For example, the Centralian blue-tongue lizard (Tiliqua multifasciata, lungkara in Walmajarri) was denoted by 22 different names across the contributed datasets. Some records were duplicated across two or more datasets, for example, when data collectors had provided copies of their data to state depositories, and this project received data from both sources.
We developed a workflow, using Excel and scripting in R (ver. 4.1.0, R Foundation for Statistical Computing, Vienna, Austria, see https://www.r-project.org/), to bring the information into a single dataset, with aligned data fields and a consistent naming convention (Indigo et al. 2021). We checked for misaligned spatial information, species identification, or observation dates, and enhanced the information quality of those records where possible. We also identified and omitted duplicate records, by overlaying a 1 km by 1 km grid over the project area, giving every grid cell a unique ID (hereafter called ‘site’), then coalescing detections for a particular species in a single grid cell with the same collection date into one presence record. This step winnowed out duplicate data, even if coordinates had been recorded slightly differently across input datasets. Visits to sites on different dates were called ‘site surveys’.
Overall summaries of spatial, temporal and taxonomic patterns of detections
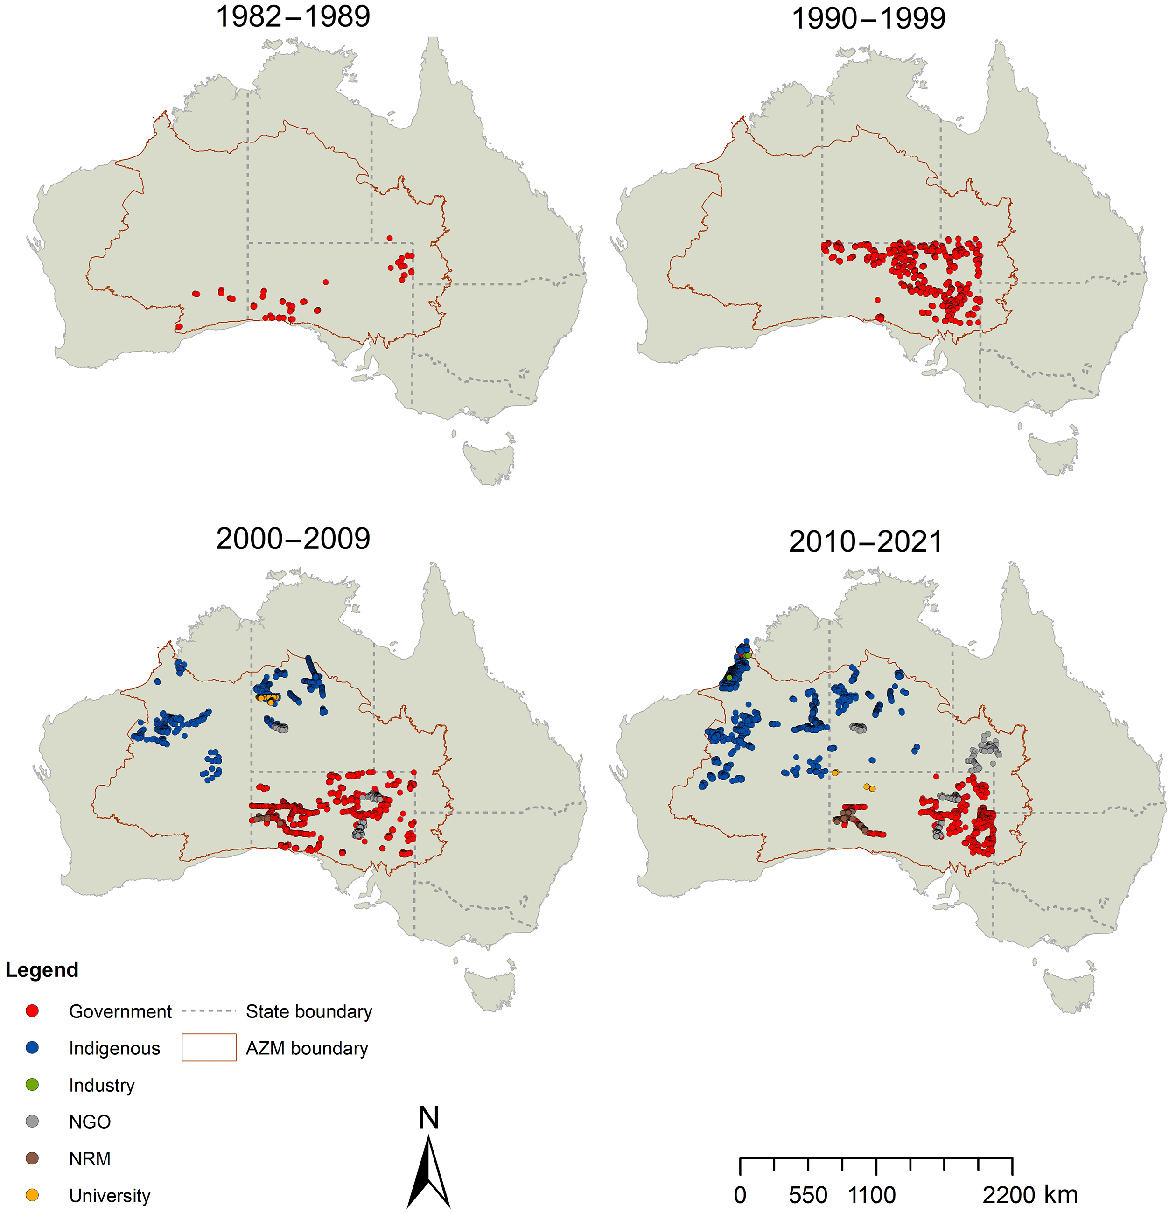
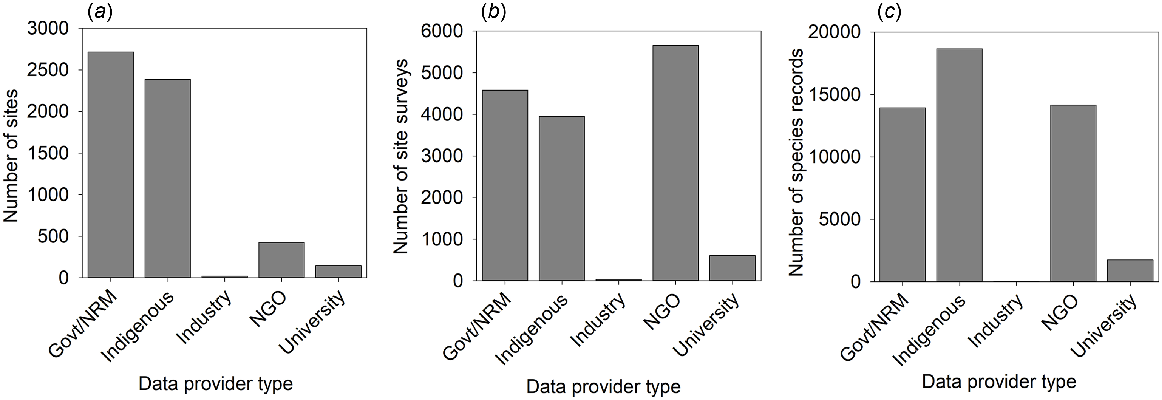
The final dataset contained 48,525 animal-species records, from 14,815 site surveys conducted at 5363 unique sites. Records were available from the southern deserts in the first two decades (1980s, 1990s), whereas the northern deserts contributed data collected from 2000 onward (Fig. 2). Note that some sign-based data from the Northern Territory exist from 1990s, but were not shared into the AZM database; these could be used in future to extend the time series for this region. Over the 40-year period, the types of organisations or individuals conducting surveys has shifted; earlier datasets were mostly provided by SA government agencies (including datasets collected by individual researchers and consultants), whereas Indigenous, NGO and Natural Resource Management groups tended to contribute data from the past two decades, corresponding to the emergence of ranger teams and the growth in on-ground NGOs since the 2000s (Fig. 2). Overall, Indigenous groups were responsible (either solely, or by collaborative work) for the largest number of records (38%). NGOs contributed the most site surveys (38%) from repeated visits over several years to a smaller set of sites (Fig. 3).
Sites surveyed by all data providers (coloured dots show data-provider type), for each decade from the 1980s to 2021.
The number of (a) sites (unique 1 km2 location), (b) site surveys (1 km2 location visited (sampled) on one date), and (c) species records (one species detected in one site survey) by data-provider type in the national dataset. Collaborations between Indigenous groups and Industry, University, and Government are all combined into the Indigenous category.
Which species are sign-based surveys most suitable for?
The national dataset contains 39,817 records of 76 unique vertebrate species, including 27 native mammal species, 11 introduced mammal species, 4 bird species and 34 reptile species. The remaining 8708 records (18% of all records) were of sign that was not attributed to a species, but was identified to genus level, or a higher group level (Fig. 4).
Histogram of detections of bird (all), mammal and reptile species and groups. For mammals, only species with >25 records are included; for reptiles, only species with >10 records are included. Photos show some of the more commonly detected native species, dingo (warnapari in Warlpiri), yellow-spotted monitor (Varanus panoptes, jalangardi in Yawuru), and Australian bustard (Ardeotis australis, patata in Wiluna Martu Wangka). Photos Wikicommons, S. Legge, I. Fraser. Scientific names for all common names displayed in the figure are available in Supplementary material.
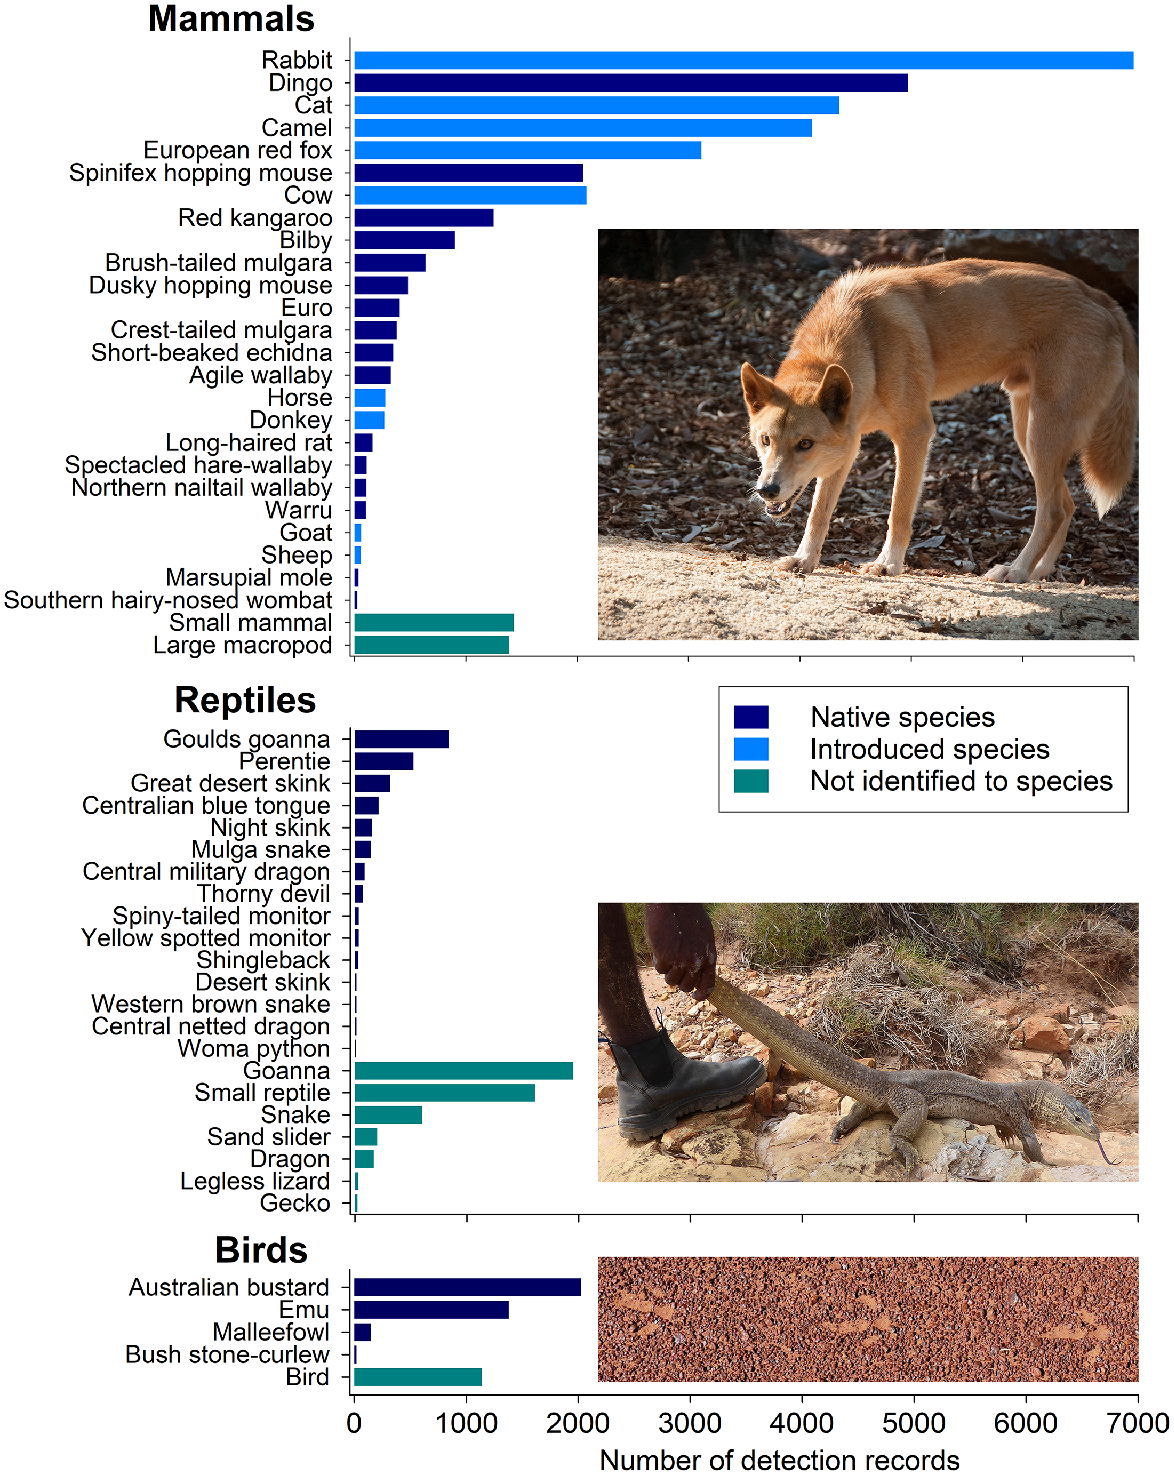
Self-evidently, sign-based surveys are most useful for species with tracks that can be reliably identified, and that live in habitats with sandy substrates. The species detected, and the number of records for each, show that the method favours medium–large mammals, large reptile species, and large bird species (Fig. 4). All introduced mammals in the desert have tracks that allow for identification to species, apart from the house mouse (Mus musculus), which was potentially recorded as ‘small mammal’ on some surveys. Because most medium-sized native mammals of Australian deserts are extinct, introduced species dominate the records within mammals. Five of the top seven most frequently recorded species are introduced and include rabbits (Oryctolagus cuniculus, rapita in Pitjantjatjara), cats (Felis catus, miyawu in Walmajarri), camels (Camelus dromedarius, camula in Pintupi), red foxes (Vulpes vulpes, waltaki in Walmajarri), and cows (Bos taurus, buluku in Warlpiri). Dingoes (Canis familiaris dingo; kurriti in Karajarri) were the most frequently detected native species, followed by spinifex hopping mouse (Notomys alexis; tarkawaṟa in Pitjantjatjara) (Fig. 4).
Whether a species can be identified from sign depends on the conditions during sampling and the skill and knowledge of the observer. Even some large species are sometimes difficult to identify from sign. The two large desert macropods, namely euros (Osphranter robustus; kanyala in Pintupi) and red kangaroos (Osphranter rufus; marlu in Manyjilyjarra, Kartujarra), were recorded moderately often. However, records of ‘large macropod’, which could have been either euros or red kangaroos, or occasionally even grey kangaroos (Macropus giganteus, Macropus fuliginosus; kurlpirr in Ngaanyatjarra), were recorded almost as frequently (46% of all large macropods; Fig. 4), showing that distinguishing between the tracks of these species can be challenging. Similarly, distinguishing small mammal species is difficult; hopping mice have distinctive tracks; however, in the areas where congeners co-occur, distinguishing among them is usually not possible. This is also the case for goanna species, which is why 58% of goanna records are for the genus (Fig. 4). As well as the identification challenges, in many contexts Indigenous peoples do not distinguish linguistically among species. For example, different native mice species and house mice can all be called mingkiri by Pitjantjatjara speakers, even if expert-knowledge holders understand that they are identifying a different type of mouse with a different ecology. Translating this knowledge into a data-collection system may not be considered necessary, or the data could be recorded incorrectly if screen and datasheet prompts are not set up appropriately. Where species identification is hard, or complicated by translation issues, recording the sign at the higher level is best, because misidentification could have negative flow-on effects to later analyses.
Some threatened species and species significant to Traditional Owners, such as bilbies (nationally Vulnerable, EPBC Act, Jidardu in Nyikina Mangala), great desert skinks (nationally Vulnerable; Aran in Anmatyerr), dusky hopping mouse (nationally Vulnerable; Wilkiniti in Dieri), and perentie (Varanus giganteus; Tilti in Wiluna Martu Wangka), were detected often relative to their distribution and abundance, because surveys have been deliberately undertaken where they were most likely to occur.
Sign-based surveys are not suitable for documenting the presence of smaller-bodied species with tracks similar to those of other species with overlapping distributions (e.g. small birds, geckos, dragons, skinks, many small mammals), nor species that prefer rocky habitats over sandy substrates (e.g. kowari, Dasyuroides byrnei; kariri in Dieri). Other survey techniques are more appropriate for these species. Some species often searched for during sign-based surveys may be better sampled with alternative survey techniques. A good example is the two species of marsupial mole (Notorcytes caurinus, kakarratul in Manyjilyjarra; Notorcytes typhlops, itjaritjari in Pitjantjatjara), with only 34 detection records in the AZM national dataset between them, despite being species of great interest to many groups who survey. Digging sampling trenches is a much better survey technique for detecting marsupial moles (mantararrarr in Walmajarri) (Benshemesh 2014). In addition, sign-based surveys provide data on presence, or occupancy, but other methods will usually be required for estimating activity, density, or abundance.
Key information products
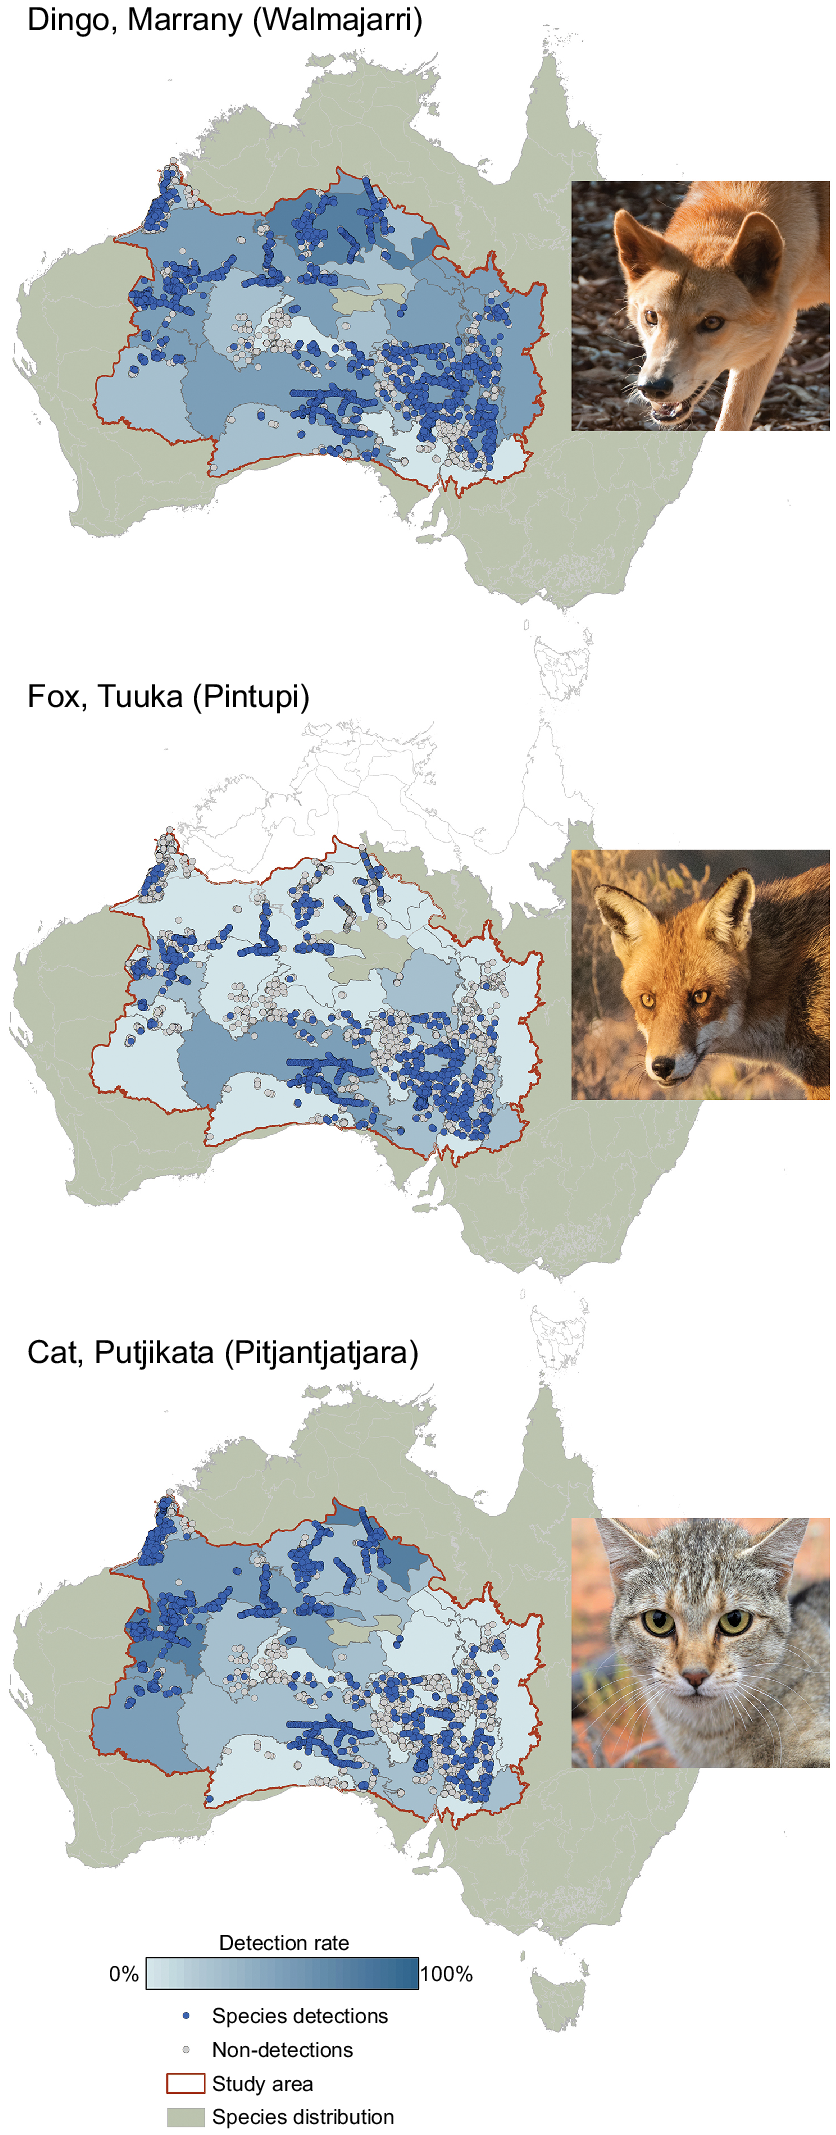
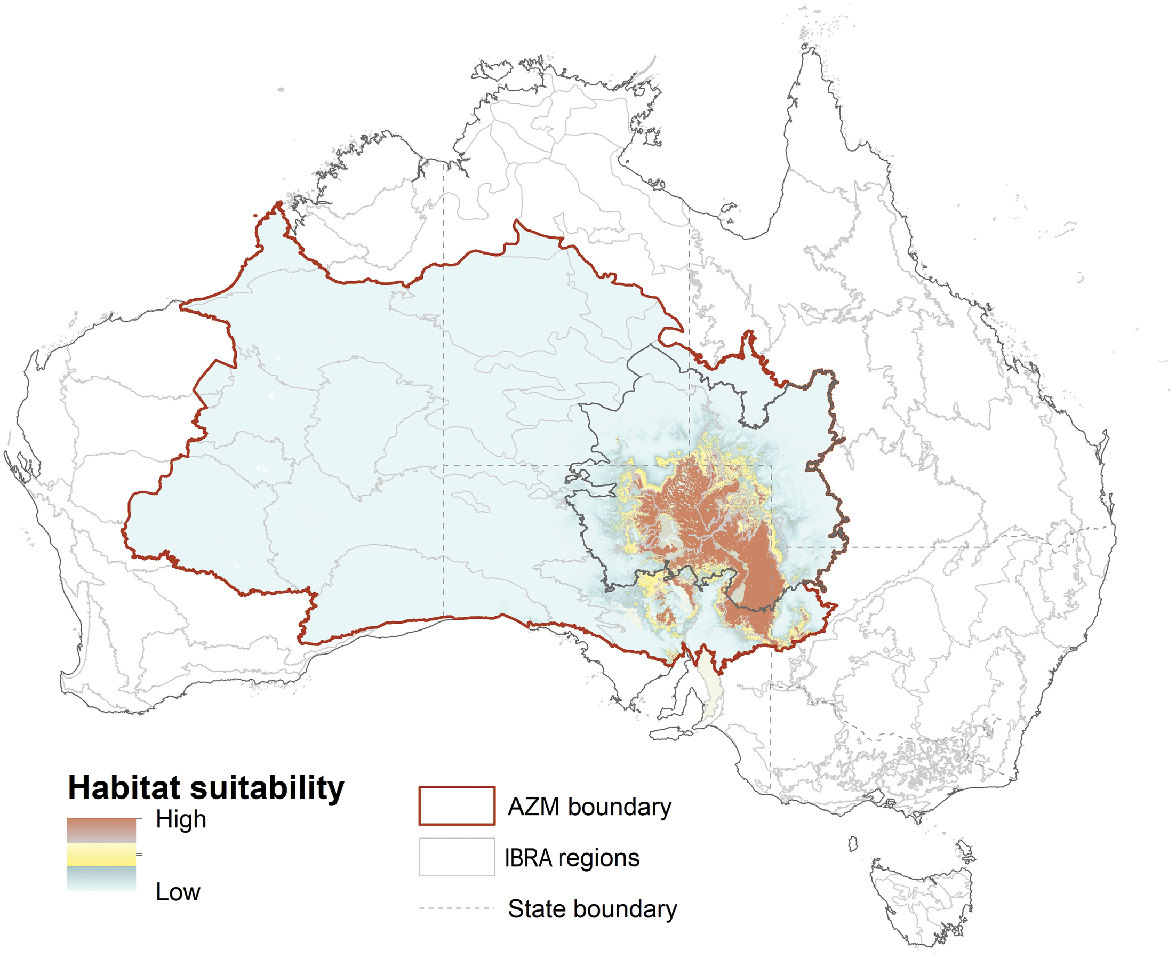
For publicly available project outputs, we aimed to summarise information in the dataset as richly as possible, while ensuring that high-resolution location data for species were not disclosed. We also aimed to create a resource for future reference. A key information product here was a ‘Species Profiles Manual’ that integrated spatial data visualisations with species information (AZM Project 2021a). For all species and some species groups, the manual contains photographs of the animal(s) and its sign (tracks, scats, burrows, digging), hints on identification (including if other species have similar tracks), information on habitat and diet, and key threats. Each species entry includes maps showing where it has been detected using sign-based surveys during each decade since 1980, and how the detection rate varies across bioregions (Fig. 5). For species with at least 20 detections, we used Maxent to predict and display suitable habitat across the whole project area (Fig. 6). The modelling considered climate variables such as annual, seasonal and daily temperature and rainfall, landform variables such as elevation and slope, soil variables, such as clay content, and habitat variables such as the amount and condition of vegetation and fire frequency (Indigo et al. 2021; Southwell et al. 2023). The purpose of the modelling was to identify places that groups and individuals could target in future surveys. An example of an account in the manual for one species, the Australian bustard (parrkarra in Karajarri, partarta in Kartujarra), is in Supplementary material, and the entire manual, or individual species profiles, can be downloaded (AZM Project 2021a). In addition, the AZM Project contributed to a revised edition of the Tales in the Sand field guide, which includes updated datasheet templates and recording guidance (Moseby et al. 2023).
Examples of maps showing spatial variation in the detection rates for dingoes, foxes and cats across the deserts. For each species, sites with detections are shown in blue dots; sites with absences are open dots. The bioregions are outlined in grey, then shaded to show the detection rate out of all surveys in that bioregion. Dingoes are widespread but recorded less often south of the dog fence in South Australia. Fox detections are more common in the southern bioregions, and cats are detected more often in the northern bioregions. The presence of each species in bioregions outside the desert is shown by olive shading. Photos: Wikicommons, N. Rakotopare, H. McGregor.
Example of Maxent output displaying suitable habitat for the dusky hopping mouse, wilkiniti in Dieri, within the AZM project area.
Trend analyses
Many project partners are interested in changes in animal populations over time. To address this, time-series information is ideal, with sites re-surveyed multiple times over several years. Without such repeated observations over space and time, the variability in species abundance across areas could bias the detection rates, giving the false impression of population trends. Similarly, in ecosystems with highly dynamic population numbers, repeated and regular sampling is needed to capture the boom-and-bust events. However, in practice, 72% of the sites in the AZM project dataset were visited only within 1 year (once or multiple times), making it difficult to estimate population trends.
For some species that are widespread and reasonably common, whose sign is usually recorded if detected, and which are not usually the focus of targeted survey, some trend information can be gleaned from looking at changes in the bioregional detection rates over time. Another approach has been to find areas with a higher survey effort maintained over time, even if the same sites were not revisited, and then to explore the climatic and environmental drivers of detections in focal species. Although such modelling methods are feasible for select species and regions, uncovering population changes in detections across a broader suite of species (particularly rarer species), and in priority areas, requires a more robust monitoring design where surveys are repeated at a core set of sites. Establishing and maintaining such a monitoring program from the outset saves time, money and effort.
Improving survey practice and monitoring design
Sign-based surveys are conducted by partners to meet many local objectives, and all could contribute to regional or national monitoring of native and introduced species, threatened species and culturally significant species, if data include a core set of fields, and are recorded reliably. We performed a series of inter-related analyses on monitoring design and data collection, to support groups and individuals to design surveys that suit their objectives, and to collect data efficiently and effectively.
There are several variations of sign-based surveys being used across Australia. For any given method, people have tailored variations on the method to fit with their monitoring objectives and local context. In addition, the type of data that people collect during surveys has changed, and people use several different data-collection mechanisms, from paper datasheets to app-based systems. Although the differences in method (e.g. 2-hectare plot vs transect) can be accommodated in analyses, inconsistencies in data-recording fields, and inconsistencies in data quality, increased the challenges of the AZM Project when collating and interpreting data collected by multiple data providers. Streamlining data collection to a core set of fields, with instructions on how to collect that information consistently, makes it more feasible to combine sign-based data from many different groups and individuals.
Working with tracking experts, we surveyed the range of data-collection templates in use and produced a streamlined data-collection sheet with core data fields that would support national monitoring (AZM Project 2021b). The new data-collection sheet was trialled and finessed in surveys conducted by rangers and Traditional Owners working with Aṉangu Pitjantjatjara Yankunytjatjara Land Management and the AZM Project team (AZM Project and APY LM 2021). This data-recording template can be used nationally, regardless of the sign-based survey method. Data fields that could be filled from other national spatial datasets, such as broad vegetation type, soil type, and topography, were omitted from the template. Data fields that were particularly vulnerable to inconsistency among data providers were either revised to reduce interpretational ambiguity or dropped. Even with a rationalised data-collection template, differences in tracker skill and experience can lead to inconsistencies in the collected data. Training is needed to minimise this potential problem. The revised template includes new sections for metadata on key attributes of the design and type of survey that are critical for optimising the analysis potential. This includes noting whether surveys are targeting one species, or all species, so that potential survey biases can be identified, and so that the absence (as well as presence) of species can be confidently recognised. Absence data are critical for some types of analysis. The template includes advice about when to abort surveys; recording tracking conditions can help understand detectability, but nothing can ‘repair’ collecting data in poor tracking conditions. Additional fields that are valuable for local survey purposes, or to capture cultural information while on Country, can be added to the template if needed. The revised recording template of the AZM Project has been adopted by the Ecological Field Monitoring Protocols assembled by the Terrestrial Ecosystems Research Network (Cox et al. 2023), and a revised edition of Tales in the Sand (Moseby et al. 2023).
The AZM Project aimed to support groups to achieve their local monitoring objectives, while also encouraging data collection that could contribute to regional- and national-scale monitoring for species occurrence and trends. Like all biological surveys, sign-based surveys need to be designed carefully to provide data that can be used to answer questions about species distributions, habitat preferences, trends or management effectiveness. The most appropriate monitoring design is influenced by how common species are, how easily their sign is detected, and the monitoring objective. Discussions and workshops with groups showed that their survey objectives reflect concerns about supporting knowledge exchange, and improving knowledge about the distribution of native and invasive species and efficacy of management. They were grouped mainly into the following categories:
‘Getting old people and young people out on Country together’ (sharing knowledge)
‘See what animals are there’ and ‘Know if animals have enough food’ (species inventory and habitat preferences)
‘Know if the animals finishing’ (monitoring changes over time)
‘To see where we should hunt cats’ (guiding management)
‘To see if burning is making a difference for the animals’ (measure management effectiveness)
The number of sites, where they should be and whether sites should be revisited are quite different for a program that aims to share knowledge, from those for a program that aims to monitor changes in occupancy or condition over time. The AZM Project developed some broad guidelines to help groups and individuals improve the design of their sign-based monitoring, depending on their objective (AZM Project 2021c). For example, for a monitoring program that aims to pick up changes in detection rates at the local or IPA scale, sampling 40 sites each year (from a set of ~80 sites, and ideally revisiting ~10 of them in the same survey season), split across the main sandy habitat types, should pick up changes in occupancy of the more common species that occur on sandy substrates. This task would take a ranger team 1–2 weeks. Increasing the number of sites sampled in a year increases the chance of picking up change, especially if the change is small. If there are rare species that are survey targets, it is worthwhile having extra sites clustered in the area or the preferred habitat where that species occurs. Alternatively, if an objective is to detect range shifts under climate change, then adding sites just outside the current habitat could be worthwhile.
At the regional scale, the AZM Project worked with the South Australian partners to compare the statistical power of different monitoring designs for detecting changes in the occupancy of animal populations. The analysis was based on data collected in that region, with habitat-suitability maps developed from those data. It explored the optimal survey designs for achieving a range of potential objectives such as detecting changes in species with a small range, versus changes in species with a large distribution, as well as the monitoring design required to detect small versus large changes in occupancy of those populations (Southwell et al. 2023). This work indicated that for a regional monitoring program, about 200 sites are needed to pick up moderate (~30%) declines for most species. These sites could be spread across several IPAs, national parks, and other properties, so that any one team is sampling only part of a whole set of sites.
The AZM Project also considered designs for a national-scale monitoring program, by exploring whether there were species representation ‘gaps’ in the existing survey network that could be targeted if monitoring were to be expanded. This analysis was based on habitat-suitability models built from the AZM national dataset, augmented by data from the Atlas of Living Australia. It showed that the existing survey network already covers many regions of high predicted species richness (D. M. Southwell, unpubl. data). This is not surprising, given that some surveys have purposely targeted the known distributions of threatened, range-restricted, and culturally significant species such as the bilby (mangaban in Nyul Nyul) and dusky hopping mouse (wilkiniti in Dieri). However, some species-rich areas outside of the existing survey network are under-surveyed, and scattered through the deserts, and adding survey effort in these locations would be worthwhile (D. M. Southwell., unpubl. data). Based on this national expansion analysis, and the South Australian regional-monitoring design optimisation (Southwell et al. 2023), a national monitoring program for 25–30 species of medium–large mammals and larger reptiles and birds (including threatened, culturally significant, and introduced species) would need to include 600 sites. About 200 sites should be spread across each of the northern and southern deserts, and another 200 sites clustered within the ranges of key species with smaller distributions, such as great desert skink (tjakura in Wiluna Martu Wangka) in the north, and dusky hopping mouse (wilkiniti in Dieri) and crest-tailed mulgara (D. cristicauda, amperte in Arrernte) in the south. More sites will be needed if partners have additional objectives that they want to incorporate (e.g. understanding local-scale trends; or detecting a smaller change in occupancy of a priority species). Such variations mean that the overall network of monitoring sites may exceed 600. Sites should be situated near tracks, so that access is feasible, and should be revisited at least twice every 5 years; about a fifth of sites should be sampled twice in the same year, so that detectability can be estimated and used to improve the analysis. Sites would need to be monitored long term, to account for the marked seasonal and temporal fluctuations of desert ecosystems.
How were project results communicated back to project partners
The AZM Project comprised a diverse array of partners, interested in different project outputs, and with different preferences for receiving those outputs. All Indigenous ranger groups privately received information packages, including graphics highlighting their data contributions to the AZM national dataset, detection rates for species on their Country, a map series showing the specific detection locations of species on Country, and their curated data as an Excel file. Some Indigenous ranger groups wanted to discuss how they could use sign-based monitoring most effectively in their own programs, and to understand how their work fitted in with the regional or national effort. The project team worked with these ranger groups individually, showing them the most relevant outputs, in the most appropriate form, and often iterating those outputs on the basis of feedback received. Face-to-face meetings and workshops were supplemented with online meetings during 2020–2021, owing to COVID-related travel disruptions. Ranger team coordinators and land council staff facilitated these conversations. Other partners, including researchers, were potentially more interested in the scientific aspects of analysis and monitoring design.
In addition to these tailored interactions, the AZM Project produced a suite of publicly available outputs, with the approval of partners. These included the Species Profiles Manual summarising the data collected for each species, guidance for survey design, templates for data collection and storage, journal publications, a revised edition of Tales in the Sand, and a comprehensive report that brought all the activity and products together into one overview (all available at https://www.nespthreatenedspecies.edu.au/projects/arid-zone-monitoring-surveys-for-vertebrates-across-arid-and-semi-arid-zones#RESULTS). We also created a video (Supplementary material), an interactive website (www.AridZoneMonitoring.org.au), built on a ShinyApp, with key map and graph visualisations from the project, allowing viewers to explore the temporal and spatial patterns of data in the AZM national dataset in a way that maintains data confidentiality (i.e. the precise locations of individual species detections are not displayed and users cannot zoom in on maps), with links for downloading species profiles, design and data-collection guidance.
Conclusions and next steps
The AZM Project has been a proof-of-concept, demonstrating that a very large volume of sign-based data has already been collected across Australian deserts, and that Indigenous ranger groups continue to use this survey approach. Sign-based surveys are an excellent forum for getting mixed generations of people out on Country to share knowledge; the technique leverages the tracking skills and interests of many Indigenous peoples, it is non-invasive, which has logistic and social acceptability advantages, and it can be used to collect information on multiple species at once. Sign-based surveys are particularly valuable for monitoring introduced mammals, and native species of mammals, birds and reptiles with distinctive sign, including some threatened species, and some culturally significant species.
The AZM Project managed to collate existing sign-based data despite considerable heterogeneity in survey objectives, methods and data-collection templates. The collated data are useful for describing species distributions and building species habitat-suitability models, and investigating temporal and spatial trends for some species and areas. Most importantly, the project has shown that it is possible to build a large and diverse partnership that produces useable data compilations and analyses, while respecting the intellectual property and diverse interests of the partners. Key principles underlying the collaboration included developing individual contact with each potential partner and understanding their specific context and needs, respecting different partners’ processes for entering collaborations, ensuring that any sensitivities about data sharing and visualisations were discussed and heard, and committing to seek approval from every partner before any project output was made public.
With this foundation in place, what are the possible next steps? Supporting individual partners to design surveys to meet their local objectives is an ongoing need. Building on this fundamental purpose, a national monitoring program based on 600 sites would mean that each partner would need to survey 10–20 sites annually (given the AZM Project involved >40 data providers). To be sustainable, such a program would need recurrent funding for the field-survey component, so that training and surveys can be built into ranger, state agency, NGO, and researcher workplans. Training could be based on the Yitaki Maninjaku Ngurungka (Reading the Country) Training Framework recently developed by expert Warlpiri animal trackers, with the Central Land Council (Warlpiri Knowledge Holders 2024). The Framework is designed for integration into IPA programs and ranger work plans. It is culturally based and aims to support exchange of the knowledge and skills required to track animals expertly. A national monitoring program would need a coordinator to nurture the collaborations and be a conduit for data flow, internal and external communication and connection, field officers to support groups by training locally based rangers in data collection and management and survey design, and an analyst to curate, analyse and report, and to provide ongoing analytical support to project partners. It would also make sense for a database designer to automate parts of the data-collation and reporting process, so that partners could upload new data and generate reports for their local area as well as at larger scales, using a password-protected pathway so that data confidentiality is maintained. Precedents for such a program exist, such as the national malleefowl (Leipoa ocellata, ngaṉamara in Pitjantjatjara) monitoring program (Benshemesh et al. 2018). Given the potential of a national monitoring program to provide information to state and national environmental reports, government funding seems appropriate, and additional philanthropic support is also an option.
Most of the desert is under direct management by Traditional Owners (Fig. 1), and Indigenous rangers and Traditional Owners contribute more data than does any other data-provider type (Fig. 3); in large areas of the desert, they are the only data provider. It would therefore be appropriate if a project to deliver nationally coordinated sign-based desert surveys was led or co-led by an Indigenous organisation, with project objectives that are co-developed by all project partners, and the data stored securely with oversight from the lead Indigenous organisation. Partnerships with universities could facilitate the inclusion of scientific expertise into the project.
Is a national monitoring program across Australian deserts realistic? Biodiversity monitoring in Australia has a checkered history (Legge et al. 2018; Lindenmayer et al. 2022); globally, monitoring in deserts lags behind that of other biomes (Durant et al. 2012); and Australian deserts are more sparsely populated than most deserts worldwide (UNEP 2006). However, many different Traditional Owner groups continue to live in Australian deserts and remain culturally connected to Country (Robin et al. 2022). Australian desert country has one of the largest networks of Indigenous-managed land in the world (Garnett et al. 2018; O’Bryan et al. 2021) and contains a high proportion of Australia’s biodiversity (Renwick et al. 2017). The AZM Project has shown the potential scale and value of the survey and monitoring work already conducted by desert people. Coordinated monitoring across this biome could provide information on biodiversity trends over a very large portion of the country, help inform the development of Indigenous-led recovery strategies for threatened species (e.g. Indigenous Desert Alliance 2023) and culturally significant species (Goolmeer et al. 2022), while supporting Indigenous-led management with the social, cultural, economic and biodiversity outcomes that this brings (Campbell 2011; Garnett et al. 2018; Robin et al. 2022).
Data availability
For privacy reasons, the AZM dataset is not publicly available. Contact the lead author for more information.
Conflicts of interest
The lead author (Sarah Legge) is an editor-in-chief for Wildlife Research. Two other authors (Stephen van Leeuwen; Marlee Hutton, contact for the Kimberley Land Council Land and Sea Management Unit) are guest editors for the Indigenous and cross-cultural wildlife research Collection. A fourth author (Thomas Newsome) is an associate editor for Wildlife Research. To mitigate this potential conflict of interest they had no editor-level access to this manuscript during peer review.
Declaration of funding
This project was supported by funding from the Australian Government’s National Environmental Science Program through the Threatened Species Recovery Hub. The surveys conducted by the South Australian Government (including in the Landscape Regions) were funded through Australian Government grants; surveys conducted by the Western Australian Government was funded by state grants and offset funding. The contributions to the project from Arid Recovery, Save the Bilby, and Australian Wildlife Conservancy were each funded by philanthropic support. Ranger work across the deserts is funded by Commonwealth and State government funding, and philanthropy.
Acknowledgements
The project area includes the Country of many Indigenous groups: we acknowledge these Traditional Owners and their ongoing custodianship, and pay respects to their past and present Elders. We thank the many Indigenous rangers and coordinators, Traditional Owners, government and non-government staff, NGO and university scientists, who have worked so hard to collect sign-based data over the years and to improve our shared understanding of Australia’s deserts: too many to list here, but we acknowledge you with gratitude. Groups or people that shared data or substantially supported the project but are not co-authors include Liam Grimmett, Nelika Hughes, Taleah Watego, Mitch Duley (Thunderbird), Geyle Williams (EnviroMINDed), Lesley Gibson and Bruce Greatwich (Western Australian Department of Biodiversity, Conservation and Attractions), John Silver (Main Roads), Hannah Cliff (Indigenous Desert Alliance), and Sam Rando (Central Land Council). The CLC especially want to shout out to Christine Michaels, Alice Henwood, Helen Wilson, Myra Herbert, and Nelson Tex for their tracking work over the years. Thanks go to Jeanie Robin for translating the summary into Pitjantjatjara, and to Ebony West for translating the summary into Pintupi Luritja.
References
ABARES (2020) Australia’s Indigenous land and forest estate (2020). Department of Agriculture, Fisheries and Forestry, Canberra, Australia. Available at https://www.agriculture.gov.au/abares/forestsaustralia/forest-data-maps-and-tools/spatial-data/indigenous-land-and-forest
Allen L, Engeman R, Krupa H (1996) Evaluation of three relative abundance indices for assessing dingo populations. Wildlife Research 23, 197-205.
| Crossref | Google Scholar |
AZM Project and APY LM (2021) Sandplot surveys on APY Lands. NESP Threatened Species Recovery Hub and APY Land Management, Brisbane, Qld, Australia. Available at www.nespthreatenedspecies.edu.au/media/ggwbls1b/apy-lands-field-trip-report_lowres.pdf
AZM Project (2021a) Arid zone monitoring – species profiles. NESP Threatened Species Recovery Hub, Brisbane, Qld, Australia. Available at https://www.nespthreatenedspecies.edu.au/media/jsypmqty/azm-species-profiles-complete-digital_v2_lowres.pdf
AZM Project (2021b) Data recording and entry templates for arid zone monitoring. NESP Threatened Species Recovery Hub, Brisbane, Qld, Australia. Available at https://www.nespthreatenedspecies.edu.au/publications-and-tools/data-recording-and-entry-templates-for-arid-zone-monitoring
AZM Project (2021c) Monitoring design for track-based surveys. NESP Threatened Species Recovery Hub, Brisbane, Qld, Australia. Available at https://www.nespthreatenedspecies.edu.au/media/nsbhkpc4/azm-monitoring-design-for-track-based-surveys.pdf
Benshemesh J (2014) Backfilled tunnels provide a novel and efficient method of revealing an elusive Australian burrowing mammal. Journal of Mammalogy 95, 1054-1063.
| Crossref | Google Scholar |
Benshemesh J, Southwell D, Lahoz-Monfort JJ, Hauser C, Rumpff L, Bode M, Burnard T, Wright J, Wintle BA (2018) The national malleefowl monitoring effort: citizen scientists, databases and adaptive management. In ‘Monitoring threatened species and ecological communities’. (Eds S Legge, DB Lindenmayer, NR Robinson, BC Scheel, DM Southwell, BA Wintle) pp. 387–396. (CSIRO Publishing: Melbourne, Vic., Australia)
Blythman M, Lohr C, Sims C, Morris K (2020) Translocation of Golden Bandicoots, Isoodon auratus barrowensis, from a fenced enclosure to unfenced managed land on Matuwa (formally Lorna Glen) September 2015: Final Report. Department of Biodiversity Conservation and Attractions, Perth Western Australia 43.
Burbidge AA, McKenzie NL (1989) Patterns in the modern decline of Western Australia’s vertebrate fauna: causes and conservation implications. Biological Conservation 50, 143-198.
| Crossref | Google Scholar |
Cameron L (2020) ‘Healthy Country, Healthy People’: Aboriginal embodied knowledge systems in human/nature interrelationships. The International Journal of Ecopsychology (IJE) 1, 3.
| Google Scholar |
Campbell D (2011) Application of an integrated multidisciplinary economic welfare approach to improved wellbeing through Aboriginal caring for country. The Rangeland Journal 33, 365-372.
| Crossref | Google Scholar |
Central Land Council and Low Ecological Services (2018) Tanami Regional Biodiversity Monitoring (2005, 2009, 2012). Central Land Council. Version 1. Terrestrial Ecosystem Research Network. Available at https://doi.org/10.4227/05/5b172fd19d319
Commonwealth of Australia (2023) Dedicated Indigenous protected areas. Department of Climate Change, Energy, the Environment and Water and National Indigenous Australians Agency, Canberra, ACT, Australia. Available at https://www.environment.gov.au/fed/catalog/search/resource/details.page?uuid=%7BC64658F0-95AD-4209-8D1E-F94BD0A4E827%7D
Cox B, McCallum K, O’Neill S, Bignall J, Peacock D, Sparrow B (2023) Sign-based fauna survey module. In ‘Ecological field monitoring protocols using the ecological monitoring system Australia’. (Eds S O’Neill, K Irvine, A Tokmakoff, B Sparrow). (TERN: Adelaide, SA, Australia). Available at https://www.tern.org.au/wp-content/uploads/Signs-based-Fauna-Module-v1_20230721.pdf
Cresswell ID, Janke T, Johnston EL (2021) Australia state of the environment 2021: Overview, independent report to the Australian Government Minister for the Environment, Commonwealth of Australia. Commonwealth of Australia, Canberra, ACT, Australia. Available at https://soe.dcceew.gov.au/sites/default/files/2022-07/soe2021-overview.pdf
Durant SM, Pettorelli N, Bashir S, Woodroffe R, Wacher T, De Ornellas P, Ransom C, Abáigar T, Abdelgadir M, El Alqamy H, et al. (2012) Forgotten biodiversity in desert ecosystems. Science 336, 1379-1380.
| Crossref | Google Scholar | PubMed |
Durant SM, Wacher T, Bashir S, Woodroffe R, De Ornellas P, Ransom C, Newby J, Abáigar T, Abdelgadir M, El Alqamy H, et al. (2014) Fiddling in biodiversity hotspots while deserts burn? Collapse of the Sahara’s megafauna. Diversity and Distributions 20, 114-122.
| Crossref | Google Scholar |
Garnett ST, Burgess ND, Fa JE, Fernández-Llamazares Á, Molnár Z, Robinson CJ, Watson JEM, Zander KK, Austin B, Brondizio ES, Collier NF, Duncan T, Ellis E, Geyle H, Jackson MV, Jonas H, Malmer P, McGowan B, Sivongxay A, Leiper I (2018) A spatial overview of the global importance of Indigenous lands for conservation. Nature Sustainability 1, 369-374.
| Crossref | Google Scholar |
Goolmeer T, Skroblin A, Grant C, van Leeuwen S, Archer R, Gore-Birch C, Wintle BA (2022) Recognizing culturally significant species and Indigenous-led management is key to meeting international biodiversity obligations. Conservation Letters 15, e12899.
| Crossref | Google Scholar |
Heaton AP (2021) Saving Australia’s native flora and fauna with Aboriginal peoples’ ecological knowledge and expertise. International Journal of Arts and Social Science 4, 106-109.
| Google Scholar |
Indigenous Desert Alliance (2023) Looking after Tjakura, Tjalapa, Mulyamiji, Warrarna, Nampu. A National Recovery Plan for the Great Desert Skink (Liopholis kintorei). Department of Climate Change, Energy, the Environment and Water, Canberra, ACT, Australia. Available at www.dcceew.gov.au/environment/biodiversity/threatened/recovery-plans
Indigo N, Skroblin A, Southwell D, Grimmett L, Nou T, Young A, Legge S, AZM Project Partners (2021) Arid zone monitoring project report. NESP Threatened Species Recovery Hub, Project 3.2.5 report, Brisbane, Qld, Australia. Available at https://www.nespthreatenedspecies.edu.au/media/b2epqhfh/azm-project-report_lowres.pdf
Keeping D, Burger JH, Keitsile AO, Gielen M-C, Mudongo E, Wallgren M, Skarpe C, Foote AL (2018) Can trackers count free-ranging wildlife as effectively and efficiently as conventional aerial survey and distance sampling? Implications for citizen science in the Kalahari, Botswana. Biological Conservation 223, 156-169.
| Crossref | Google Scholar |
Legge S, Rumpff L, Garnett ST, Woinarski JCZ (2023) Loss of terrestrial biodiversity in Australia: magnitude, causation, and response. Science 381, 622-631.
| Crossref | Google Scholar | PubMed |
Letnic M, Dickman CR (2010) Resource pulses and mammalian dynamics: conceptual models for hummock grasslands and other Australian desert habitats. Biological Reviews 85, 501-521.
| Crossref | Google Scholar | PubMed |
Lindenmayer DB, Woinarski J, Legge S, Maron M, Garnett ST, Lavery T, Dielenberg J, Wintle BA (2022) Eight things you should never do in a monitoring program: an Australian perspective. Environmental Monitoring and Assessment 194, 701.
| Crossref | Google Scholar |
Loarie SR, Duffy PB, Hamilton H, Asner GP, Field CB, Ackerly DD (2009) The velocity of climate change. Nature 462, 1052-1055.
| Crossref | Google Scholar | PubMed |
Lunney D, Purcell B, McLeod S, Grigg G, Pople T, Wolter S (2018) Four decades of research and monitoring the populations of kangaroos in New South Wales: one of the best long-term datasets in Australia. Australian Zoologist 39, 784-800.
| Crossref | Google Scholar |
McGregor H, Read J, Johnson CN, Legge S, Hill B, Moseby K (2020) Edge effects created by fenced conservation reserves benefit an invasive mesopredator. Wildlife Research 47, 677-685.
| Crossref | Google Scholar |
McKenzie NL, Burbidge AA, Baynes A, Brereton RN, Dickman CR, Gordon G, Gibson LA, Menkhorst PW, Robinson AC, Williams MR, Woinarski JCZ (2007) Analysis of factors implicated in the recent decline of Australia’s mammal fauna. Journal of Biogeography 34, 597-611.
| Crossref | Google Scholar |
Moore D, Kearney MR, Paltridge R, McAlpin S, Stow A (2015) Is fire a threatening process for Liopholis kintorei, a nationally listed threatened skink? Wildlife Research 42, 207-216.
| Crossref | Google Scholar |
Moore D, Kearney MR, Paltridge R, McAlpin S, Stow A (2018) Feeling the pressure at home: predator activity at the burrow entrance of an endangered arid-zone skink. Austral Ecology 43, 102-109.
| Crossref | Google Scholar |
Moore HA, Yawuru Country Managers, Bardi Jardi Oorany Ranger, Nyul Nyul Rangers, Nyikina Mangala Rangers, Gibson LA, Dziminski MA, Radford IJ, Corey B, Bettink K, Carpenter FM, Mcphail R, Sonneman T, Greatwich B (2024) Where there’s smoke, there’s cats: long-unburnt habitat is crucial to mitigating the impacts of cats on the Ngarlgumirdi, greater bilby (Macrotis lagotis). Wildlife Research 51, WR23117.
| Crossref | Google Scholar |
Morton SR, Stafford Smith DM, Dickman CR, Dunkerley DL, Friedel MH, McAllister RRJ, Reid JRW, Roshier DA, Smith MA, Walsh FJ, Wardle GM, Watson IW, Westoby M (2011) A fresh framework for the ecology of arid Australia. Journal of Arid Environments 75, 313-329.
| Crossref | Google Scholar |
Moseby KE, McGregor H, Hill BM, Read JL (2020) Exploring the internal and external wildlife gradients created by conservation fences. Conservation Biology 34, 220-231.
| Crossref | Google Scholar | PubMed |
NNTT (2024) Native title determinations. National Native Title Tribunal, Brisbane, Qld, Australia. Available at http://www.nntt.gov.au/assistance/Geospatial/Pages/DataDownload.aspx
O’Bryan CJ, Garnett ST, Fa JE, Leiper I, Rehbein JA, Fernández-Llamazares Á, Jackson MV, Jonas HD, Brondizio ES, Burgess ND, Robinson CJ, Zander KK, Molnár Z, Venter O, Watson JEM (2021) The importance of indigenous peoples’ lands for the conservation of terrestrial mammals. Conservation Biology 35, 1002-1008.
| Crossref | Google Scholar | PubMed |
Paltridge R, Southgate R (2001) The effect of habitat type and seasonal conditions on fauna in two areas of the Tanami Desert. Wildlife Research 28, 247-260.
| Crossref | Google Scholar |
Paltridge R, Ward NN, West JT, Crossing K (2020) Is cat hunting by Indigenous tracking experts an effective way to reduce cat impacts on threatened species? Wildlife Research 47, 709-719.
| Crossref | Google Scholar |
Pedler RD, Brandle R, Read JL, Southgate R, Bird P, Moseby KE (2016) Rabbit biocontrol and landscape-scale recovery of threatened desert mammals. Conservation Biology 30, 774-782.
| Crossref | Google Scholar | PubMed |
Renwick AR, Robinson CJ, Garnett ST, Leiper I, Possingham HP, Carwardine J (2017) Mapping Indigenous land management for threatened species conservation: an Australian case-study. PLoS ONE 12, e0173876.
| Crossref | Google Scholar | PubMed |
Robin L, Robin K, Camerlenghi E, Ireland L, Ryan-Colton E (2022) How Dreaming and Indigenous ancestral stories are central to nature conservation: perspectives from Walalkara Indigenous Protected Area, Australia. Ecological Management & Restoration 23, 43-52.
| Crossref | Google Scholar |
Safriel U, Adeel Z, Niemeijer D, Puigdefabregas J, White R, Lal R, Winslow M, Ziedler J, Prince S, Archer E, King C, Shapiro B, Wessels K, Nielsen TT, Portnov B, Reshef I, Thornell J, Lachman E, McNab D (2005) Dryland systems. In ‘Ecosystems and human well-being: current state and trends. Findings of the condition and trends working group’. (Eds R Hassan, R Scholes, N Ash) pp. 623–662. (Island Press)
Skroblin A, Carboon T, Bidu G, Taylor M, Bidu N, Taylor W, Taylor K, Miller M, Robinson L, Williams C, Chapman N, Marney M, Marney C, Biljabu J, Biljabu L, Jeffries P, Samson H, Charles P, Game ET, Wintle B (2022) Developing a two-way learning monitoring program for Mankarr (Greater Bilby) in the Western Desert, Western Australia. Ecological Management & Restoration 23, 129-138.
| Crossref | Google Scholar |
Soultan A, Wikelski M, Safi K (2019) Risk of biodiversity collapse under climate change in the Afro-Arabian region. Scientific Reports 9, 955.
| Crossref | Google Scholar |
Southgate R, Paltridge R, Masters P, Nano T (2005) An evaluation of transect, plot and aerial survey techniques to monitor the spatial pattern and status of the bilby (Macrotis lagotis) in the Tanami Desert. Wildlife Research 32, 43-52.
| Crossref | Google Scholar |
Southgate R, Paltridge R, Masters P, Carthew S (2007) Bilby distribution and fire: a test of alternative models of habitat suitability in the Tanami Desert, Australia. Ecography 30, 759-776.
| Crossref | Google Scholar |
Southwell D, Skroblin A, Moseby K, Southgate R, Indigo N, Backhouse B, Bellchambers K, Brandle R, Brenton P, Copley P, Dziminski MA, Galindez-Silva C, Lynch C, Newman P, Pedler R, Rogers D, Roshier DA, Ryan-Colton E, Tuft K, Ward M, Zurell D, Legge S (2023) Designing a large-scale track-based monitoring program to detect changes in species distributions in arid Australia. Ecological Applications 33, e2762.
| Crossref | Google Scholar |
Thackway R, Cresswell ID (1997) A bioregional framework for planning the national system of protected areas in Australia. Natural Areas Journal 17, 241-247.
| Google Scholar |
Woinarski JCZ, Burbidge AA, Harrison PL (2015) Ongoing unraveling of a continental fauna: decline and extinction of Australian mammals since European settlement. Proceedings of the National Academy of Sciences 112, 4531-4540.
| Crossref | Google Scholar |
Yang LH, Edwards KF, Byrnes JE, Bastow JL, Wright AN, Spence KO (2010) A meta-analysis of resource pulse–consumer interactions. Ecological Monographs 80, 125-151.
| Crossref | Google Scholar |