

Here kitty-kitty: lure choice for predator attraction in a temperate environment
Alexandra J. Paton A * , Barry W. Brook A B and Jessie C. Buettel A B
A
B
Abstract
Camera traps have become a crucial tool for monitoring predators and are frequently deployed with lures to boost detection. Feral cats, a problematic invasive species in Australia, are commonly monitored using camera traps with lures. Despite the additional effort required for lure deployment, it remains unclear which lures are effective for monitoring feral cats.
Our study aimed to address this knowledge gap and assess the impact of various lure treatments on feral cat detection and activity. We also examined the response of other predators, such as Tasmanian devils and spotted-tailed quolls, to the lures and explored how their activity influenced feral cat visitation.
We deployed food, olfactory and visual lures, along with a null treatment across four grids of 16 camera traps over a period of 4 months in south-eastern Tasmania.
We observed increased feral cat detection with food (odds ratio = 3.69, 97.5% CI = 1.04, 13.2) and visual lures (odds ratio = 5.95, CI = 1.75, 20.2), but not olfactory lures (odds ratio = 1.88, CI = 0.55, 6.51). Examining only sites where cats were detected, food (odds ratio = 3.35, CI = 1.27, 8.9), visual (odds ratio = 3.39, CI = 1.41, 8.1) and olfactory (odds ratio = 2.7, CI = 1.02, 7.1) lures all increased feral cat visitation to the camera traps. Tasmanian devil and spotted-tailed quoll activity increased 4.85-fold (CI = 2.89, 8.1) and 4.94-fold (CI = 2.92, 8.4) when using the food lure, and 4.24-fold (CI = 2.5, 7.2) and 3.49-fold (CI = 2.03, 6.0) when using the olfactory lure. Whereas a positive relationship existed between devil and cat activity overall (β = 0.49, s.e. = 0.15, P ≤ 0.001), negative associations were found between devil and cat activity in the presence of food (β = −0.36, s.e. = 0.19, P = 0.057) and olfactory (β = −0.42, s.e. = 0.20, P = 0.026) lures.
Our findings demonstrated the effectiveness of lures in temperate environments for feral cat monitoring but highlighted potential interspecific interactions that reduce feral cat visitation.
We recommend a thoughtful consideration of the environment and resident species to ensure effective lure use and to minimise unintended negative influences on the capture of target species.
Keywords: attractant, behaviour, Dasyurus maculatus, invasive, rainforest, remote-sensing, Sarcophilus harrisii, trail camera.
Introduction
Over the past two decades camera traps have become a popular tool to detect and monitor predators (Meek et al. 2015). This technology allows for cost-effective, non-intrusive monitoring of elusive, wide-ranging predators through large-scale deployment and autonomous operation (Hofmeester et al. 2017; Wearn and Glover-Kapfer 2019). Despite their advantages, the static nature of camera traps, and reliance on animals passing through a limited area for capture, pose challenges when monitoring low-density species, compromising our confidence in identifying a ‘true absence’ at a study site and, thus, our capacity to estimate occupancy and activity (Si et al. 2014; Pirie et al. 2016; Kays et al. 2020).
To enhance the likelihood of capturing a predator with a camera trap, the following three main approaches can be considered: prolonging monitoring times or deploying a greater number of camera-trap units (Si et al. 2014; O’Connor et al. 2017; Kays et al. 2020), or increasing the attractiveness of a camera-trap site through lures and optimised placement (Read et al. 2015). The probability of capturing a species or an individual increases in tandem with extended monitoring times (Kays et al. 2020). However, in conservation scenarios involving reintroductions or invasive species eradication, time constraints often limit the feasibility of this option. Alternatively, increasing the number of camera-trap units can address this issue, but each unit costs between US$100 and $500 (Trolliet et al. 2014), and deploying additional camera traps escalates field effort and incurs associated expenses, a constraint often dictated by the budget limitations of control programs (Helmstedt et al. 2016; Kompas et al. 2019). Instead of increasing the number of camera traps, researchers frequently opt to enhance predator capture rates by employing attractants (Moseby et al. 2004; Read et al. 2015; Nichols et al. 2019; Wysong et al. 2020). These attractants encompass combinations of visual, olfactory, auditory and food-based lures (Lazenby and Dickman 2013; Read et al. 2015; Fancourt 2016), offering incentives to entice predators to visit and potentially linger at a camera trap. Lures, known for their affordability, have become a standard methodology in the field of camera trapping.
However, experiments and metanalyses have found that visual, auditory, olfactory and food lures have limited effect on the detection rates of feral cats (Read et al. 2015; Stokeld et al. 2016; Price et al. 2019; Goldingay 2024), a highly destructive invasive predator (Hamer et al. 2021). Only one study has described a lure that significantly increases cat detection (Lohr et al. 2024). This lure utilised a novel dripper that regularly dispenses cat urine, continuously refreshing the lure for a period of 15–17 days (Lohr et al. 2024). Nonetheless, a variety of eclectic lures are deployed in tandem with camera traps in many feral cat monitoring attempts in a bid to increase detection and return rates.
Traditional olfactory and food lures incur additional servicing requirements compared with passive camera-trap surveys. Camera traps can operate for between 6 months to a year without servicing, contingent on battery life and model specifications, whereas most olfactory and food lures need to be changed within 20 days of deployment to maintain potency (Price et al. 2019; Fidino et al. 2020). Consequently, even though lures can complement short-term camera-trap monitoring, they incur higher servicing costs for long-term monitoring, such as eradication efforts or population recovery programs. Moreover, the use of lures carries the inevitable risk of attracting predators other than cats if present. This shift in predator behaviour has the potential to affect feral cat detection and activity, influencing the reliability of information derived from these surveys (Fielding et al. 2022).
In this study, our objective is to assess the efficacy of three popular lures for attracting feral cats to camera traps. We achieve this by (i) quantifying the impact of lures on feral cat detection and activity, as well as individual visitation, (ii) quantifying the impact of time since lure deployment on the probability of daily detection of feral cats, (iii) determining the impact of lures on the detection and activity of Tasmanian devils and spotted tailed quolls and (iv) assessing whether and how lures affect interactions between native predators and feral cats.
Materials and methods
Study design
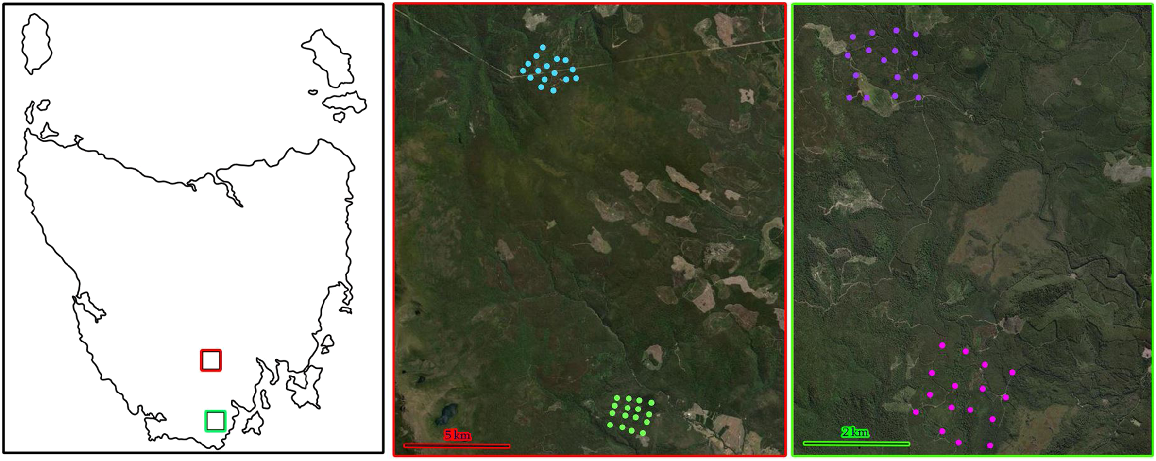
We established four camera-trap monitoring sites, each consisting of a 4 × 4 grid-array of Cuddeback trail cameras (X-Change Model 1279 with a Xenon-bulb white flash) in south-eastern Tasmania (Fig. 1). This model of camera trap was chosen because of a combination of all-weather robustness, relative affordability of the Cuddeback cameras at ~A$250 (Rovero et al. 2013) and fast trigger speed of 0.25 s. Other popular brands have a similar trigger speed but a greater cost. For example, the Swift Enduro is valued at ~A$300 and has a 0.35-s trigger speed, and the Reconyx HP2X Hyperfire 2 has a trigger speed of 0.2 s, but costs ~A$800. Cuddeback cameras have also been reported in multiple other studies as being reliable for predator monitoring (Apps and McNutt 2018; Curveira-Santos et al. 2021; Sievert et al. 2023). Sites were chosen on the basis of known cat presence in the general area informed by data collected nearby in a pre-existing long-term camera-trapping network (Paton et al. 2022). Camera traps were positioned between 500 and 300 m apart, such that individual cats could be re-captured across multiple cameras (Hamer et al. 2022). They were placed on game trails and in natural arenas to minimise theft and the influence of roads on feral-cat detection, while still providing an open area (~2 × 2 m), such that the camera’s field of view would not be obstructed in this densely forested environment.
On the left, a map of Tasmania with the Styx Valley sites boxed in red, and the Picton region sites in green. In the middle panel, the two Styx valley sites, with the southern, blue points representing the Styx Tall Tree Forest Reserve, and the green points being Wild Bee Forest Reserve. On the right are the two Picton region sites, with the purple points representing the northern Esperance River cameras, and the pink representing the southern Esperance River cameras. Note the difference in scale between the middle and right panels. Satellite imagery ©2024 TerraMetrics, and map data ©2024 Google.
Lure choice
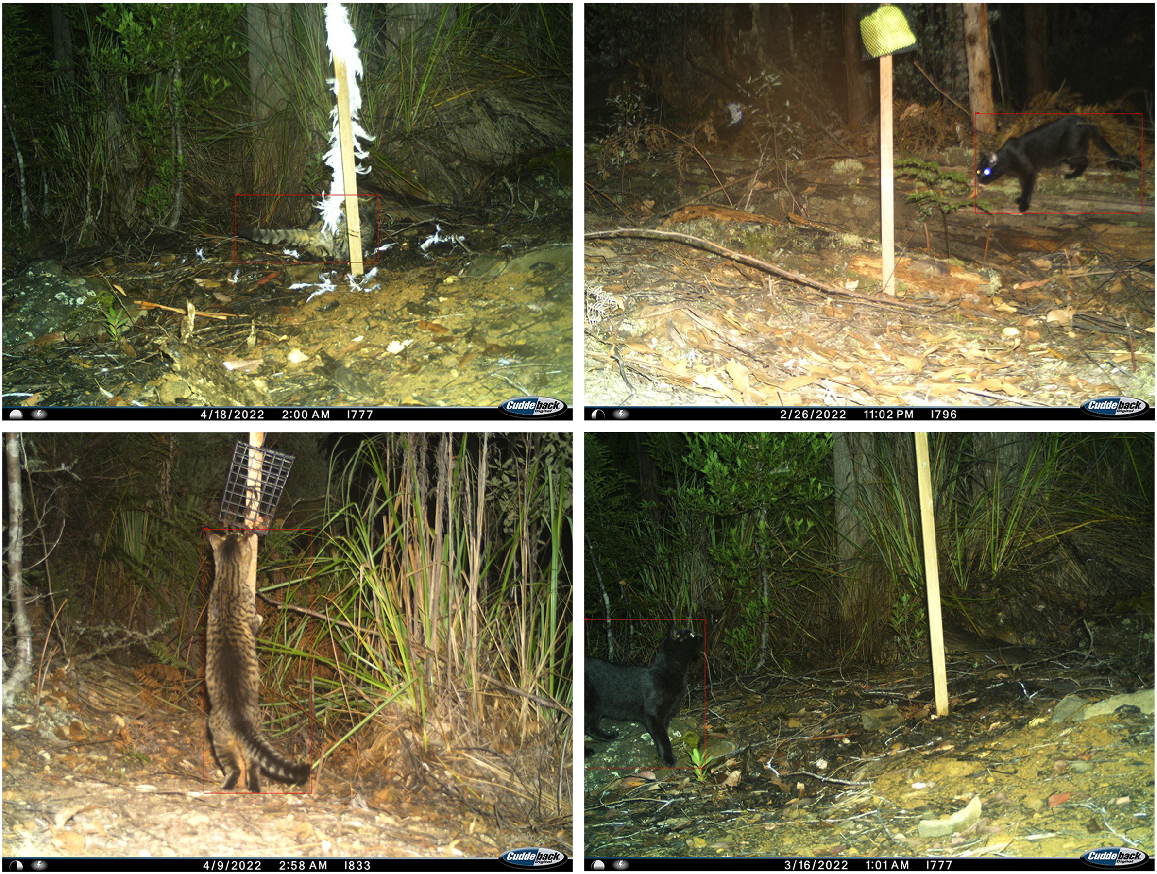
We identified tuna oil and feathers as commonly used lures across feral cat studies (Edwards et al. 1997; Molsher 2001; Bengsen et al. 2011; Rees et al. 2019). Our olfactory lure consisted of a microfibre cloth was soaked in 80 mL of tuna oil and placed inside a metal crabbing bag to prevent destruction and ensure odour diffusion (Fig. 2). We used white feather boas, cut to ~45 cm long, as our visual lure. Wallaby meat was selected as our food lure because of its high rate of usage by cats within Fielding et al. (2022), its affordability, and the lack of consistency in the meat chosen within past literature. Approximately 1 kg of wallaby meat was placed in a metal cage to prevent dragging out of camera view, while still being accessible for consumption (Fig. 2). All three lure treatments were attached to the top of a 90-cm wooden stake. Camera traps were deployed for a passive acclimation period (no-lures) from October 2021 to February 2022, at which time lures were deployed across all four grids. Lure treatments (including no-lure control) were rotated on 27–40-day cycles (depending on field logistics) in a Latin square design.
Examples of each lure treatment used in this study. Top left: a visual lure of a feather boa being attacked by a feral cat. Top right: an olfactory lure of a cloth soaked in tuna oil and contained in a metal, mesh crabbing bag. Bottom left: a food lure of wallaby meat suspended in a metal cage. Bottom right: null treatment of a wooden stake.
Statistical analyses
To examine differences in cat activity among lures, the proportion of days with at least one cat observation (PDE) was calculated for each camera trap and lure combination.
This is a common metric for activity used within camera-trap studies that corrects for differences in effort (O’Brien 2011; Read et al. 2015). However, although this metric is common, and the calculation is identical, the terminology is inconsistent, with some authors referring to it as ‘relative activity’ or ‘probability of daily detection’ instead. Average PDE and standard errors were calculated using the bootstrap method, by using the boot package (ver. 1.3-31, A. Canty and B. D. Ripley, see https://cran.r-project.org/package=boot; Davison and Hinkley 1997) in R (ver. 4.4.1, R Foundation for Statistical Computing, Vienna, Austria, see https://www.r-project.org/).
Influence of lures on detection at a camera trap
We examined how lure type influenced the probability of detecting feral cats, Tasmanian devils and spotted-tailed quolls at each camera trap by using logistic regression mixed-effects models, using the lme4 package (ver. 1.1-35.5, see https://CRAN.R-project.org/package=lme4; Bates et al. 2015) in R. We used the detection (1) or absence (0) of the relevant species at a camera-trap site as our response variable. Predictor variables were selected a-priori and included lure type, vegetation type (National Vegetation Information System Major Vegetation Groups layer; see www.environment.gov.au), fraction of photosynthetically absorbed radiation (FPAR) (Biodiversity and Climate Change Virtual Laboratory (BCCVL; see bccvl.org.au), recorded from 2000 to 2014), and the PDE (relative activity) of Tasmanian devils and spotted-tailed quolls. Vegetation type and FPAR were chosen for the assumed potential influence of vegetation on lure detectability (e.g. visual lure visibility). All continuous predictors were scaled to between −1 and 1 prior to modelling. We included a nested random effect of camera trap within grid site for all models to account for unmeasured differences between each camera trap and their respective sites.
Influence of lures and predator activity on capture rate
We examined the impact of lure type on feral cat, Tasmanian devil and spotted-tailed quoll capture rate through a generalised mixed-effects model by using the lme4 package in R. We used a Poisson distribution, and the number of events for the relevant species for each lure and site as our response. We used the same fixed and random effects as the detection model, as well as a continuous predictor of ‘run days’ to account for differences in effort during lure deployment. To examine whether lures invoke changes in how feral cats and Tasmanian devils use camera-trap sites, we also included an interaction term between Tasmanian devil and lure type within the feral cat model. This predictor was selected a priori on the basis of the findings of Fielding et al. (2022). Evidence for multicollinearity was detected for the interaction term between spotted-tailed quoll activity and lure type: (GVIF = 183.87, GVIF(1÷(2 × d.f.)) = 2.38) as well as spotted-tailed quoll activity: (GVIF = 67.34, GVIF(1÷(2 × d.f.)) = 8.2), and as such the interaction term between lures and quolls was not included within the feral cat model.
Individual identification
To enhance the comparison of feral cat captures among different lures, we individually identified each cat by their unique markings on the legs and flank. Black cats, being indistinguishable from one another, were categorised as ‘unmarked’ due to the lack of discernible markings. Cats that were unable to be identified were categorised as ‘unknown’. Given the substantial proportion of cats that could not be identified, we are providing only aggregate data, such as the number of sites visited, and events recorded for each identifiable individual.
Influence of time on lure attraction
To assess the impact of time on the effectiveness of lures, we standardised our sampling period by limiting our analysis to the initial 27 days of operation. We then used a logistic regression mixed-effects model, using the daily detection of feral cats, Tasmanian devils or spotted-tailed quolls as the response. We used time since lure deployment, lure type and an interaction term between these as fixed effects, and camera trap nested within site as a random effect as predictors within these models.
Results
Our camera traps operated for a total of 7713 trap days. Survey effort was similar among lure treatments; null = 1947 days, food = 1933 days, olfactory = 1933 days and visual = 1900 days. We captured 9393 animal images in total. The most images were captured when food lures were deployed (3641), followed by the olfactory (2749), visual (2383), null (1959) treatments. We captured 1802 images of three target species, including 120 feral cat images across 35 cameras, 868 spotted-tailed quoll images across 46 cameras, and 641 Tasmanian devil images from 47 cameras.
Influence of lures on feral cat detection, capture and interspecies relationships
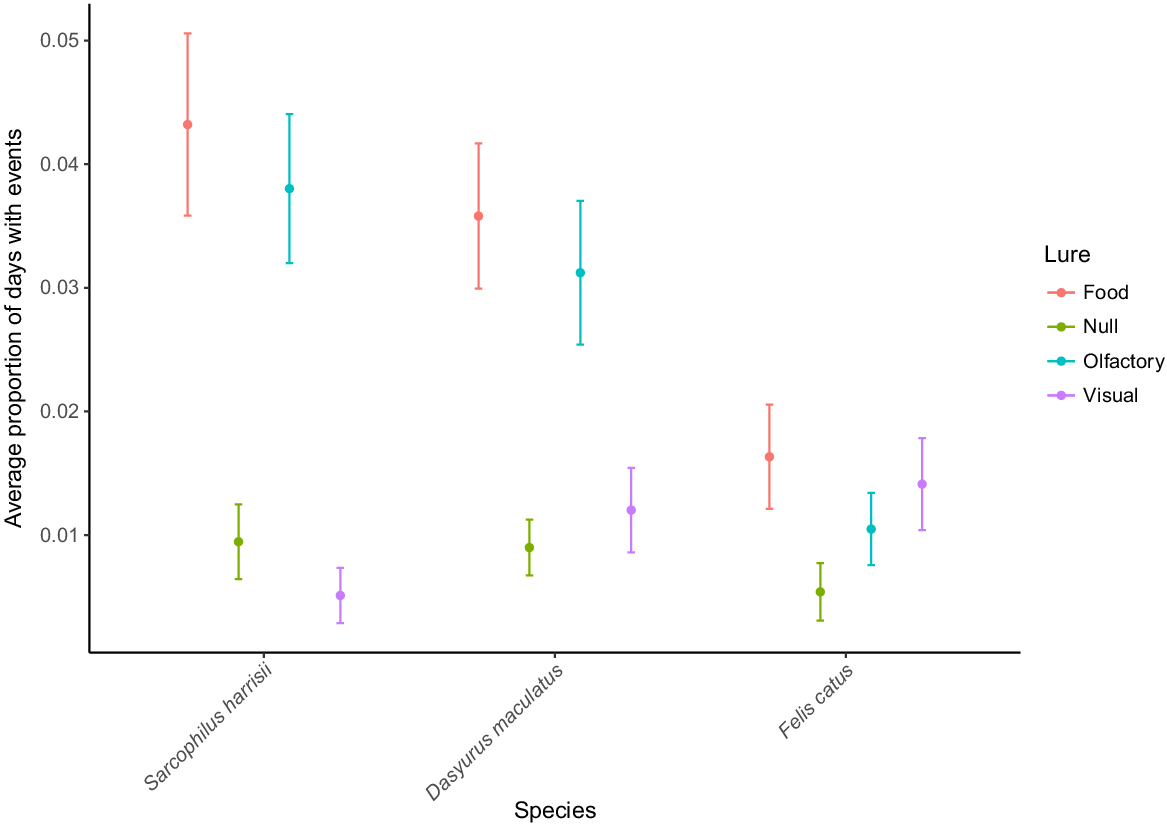
Food lures had the highest PDE for feral cats (Fig. 3). This was supported by our models, which showed that feral cat detection and activity increased 3.69-fold (CI = 1.04, 13.2) and 3.35-fold (CI = 1.27, 8.9) respectively, when using food lures (Table 1). The visual lure also markedly improved feral cat detection (odds ratio = 5.95, CI = 1.75, 20.2) and capture rate (odds ratio = 3.39, CI = 1.41, 8.1) (Table 1). The olfactory lure nearly tripled feral cat capture rate, but it did not influence site detection (Table 1).
Mean values of the average proportion of camera operating days a species was captured by lure (PDE), where food lures are shown in red, null treatments green, olfactory blue and visual purple. Error bars represent one standard error (s.e.) derived from bootstrapping.
| Species | Lure | Events | Mean PDE | Site detection OR | Site events OR | Daily detection OR | Time:lure OR | |
|---|---|---|---|---|---|---|---|---|
| Felis catus | Null | 18 | 0.5% (s.e. = 0.2%) | – | – | – | – | |
| Food | 80 | 1.6% (s.e. = 0.4%) | 3.69 (CI = 1.04, 13.2) | 3.35 (CI = 1.27, 8.9) | 2.7 (CI = 0.8, 8.6) | 1.01 (CI = 0.93, 1.11) | ||
| Olfactory | 32 | 1% (s.e. = 0.3%) | 1.88 (CI = 0.55, 6.51) | 2.7 (CI = 1.02, 7.1) | 0.9 (CI = 0.3, 3.5) | 1.05 (CI = 0.96, 1.15) | ||
| Visual | 34 | 1.4% (s.e. = 0.4%) | 5.95 (CI = 1.75, 20.2) | 3.39 (CI = 1.41, 8.1) | 1.0 (CI = 0.3, 3.5) | 1.09 (CI = 0.99, 1.19) | ||
| Sarcophilus harrisii | Null | 22 | 0.9% (s.e. = 0.3%) | – | – | – | – | |
| Food | 371 | 4.3% (s.e. = 0.7%) | 4.51 (CI = 1.71, 11.) | 4.85 (CI = 2.89, 8.1) | 2.4 (CI = 1.1, 5.5) | 1.06 (CI = 0.99, 1.23) | ||
| Olfactory | 191 | 3.8% (s.e. = 0.6%) | 8.87 (CI = 3.25, 24.2) | 4.24 (CI = 2.5, 7.2) | 2.1 (CI = 0.9, 5.0) | 1.06 (CI = 0.99, 1.12) | ||
| Visual | 22 | 0.5% (s.e. = 0.2%) | 0.32 (CI = 0.1, 1.04) | 0.5 (CI = 0.23, 1.12) | 0.6 (CI = 0.2, 2.0) | 0.99 (CI = 0.89, 1.09) | ||
| Dasyurus maculatus | Null | 19 | 0.9% (s.e. = 0.2%) | – | – | – | – | |
| Food | 582 | 3.6% (s.e. = 0.6%) | 2.68 (CI = 1.02, 7) | 4.94 (CI = 2.92, 8.4) | 2.2 (CI = 1.0, 6.0) | 1.04 (CI = 0.98, 1.10) | ||
| Olfactory | 135 | 3.1% (s.e. = 0.6%) | 4.5 (CI = 1.75, 11.6) | 3.49 (CI = 2.03, 6.0) | 3.2 (CI = 1.3, 7.95) | 1.01 (CI = 0.95, 1.07) | ||
| Visual | 111 | 1.2% (s.e. = 0.003) | 1.02 (CI = 0.38, 2.75) | 1.56 (CI = 0.85, 2.9) | 0.8 (CI = 0.3, 2.3) | 1.04 (CI = 0.97, 1.11) |
Significant positive effects (i.e. confidence intervals do not overlap with a ratio of 1) are highlighted in bold. The difference between the null treatment and a lure was deemed significant if the 95% confidence intervals of the odds ratio of the null did not overlap with those of the lure treatment. OR, odds ratio.
Food and olfactory lures markedly increased the activity of Tasmanian devils and spotted-tailed quolls at the camera traps (Fig. 3). This trend was supported by the two models for Tasmanian devil detection and capture rate, as well as the two models for spotted-tailed quoll detection and capture rate (Table 1). The olfactory lures had the greatest impact on Tasmanian devil and spotted-tailed quoll detection, increasing the odds of observing these species at a site 8.87-fold (CI = 3.25, 24.2) and 4.5-fold (CI = 1.75, 11.6) respectively. Food lures had the greatest impact on the capture rate of Tasmanian devils (odds ratio = 4.8, CI = 2.89, 8.1) and spotted-tailed quolls (odds ratio = 4.94, CI = 2.92, 8.4) (Table 1). The visual lure had no impact on the detection or capture rate of either of these predators (Table 1).
There was a positive relationship between feral cat and Tasmanian devil events overall (β = 0.49, s.e. = 0.15, P ≤ 0.001). However, the interaction term in the mixed-effects model demonstrated that the number of cat events captured at a camera site decreased as devil events increased while using food lures (β = −0.36, s.e. = 0.19, P = 0.057) and olfactory lures (β = −0.42, s.e. = 0.20, P = 0.026). This effect was not found for visual lures (β = 0.08, s.e. = 0.29, P = 0.79).
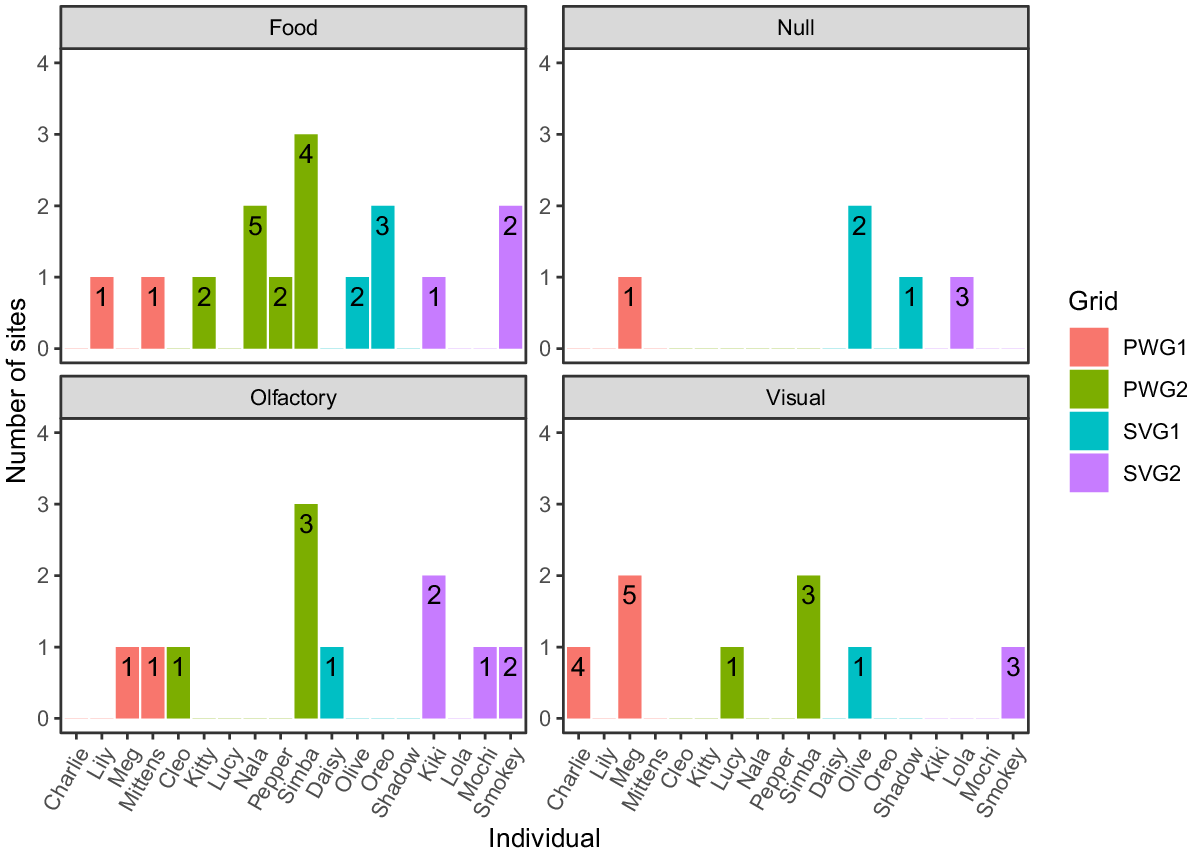
Of the 120 cat observations, 59 events could be identified to an individual level. A further 47 were unmarked, and 14 were unknown. Of the unmarked cats, 17, 12, 11 and 9 events were captured using the olfactory, meat, visual and null treatments respectively. Eighteen individual cats were identified, with the majority being encountered only at one camera trap (Fig. 4). The lure with the greatest number of individual cats varied between each of the grid sites, although food lures captured the most individuals overall (Fig. 4).
A bar plot displaying individual responses to each of the four lure treatments. The number of camera-trap sites where an individual was observed is displayed on the y-axis, and the number of captures of each individual is displayed within each bar. The colour of the bar denotes the grid site where the individual was captured. Unmarked and unknown cats were excluded from this graph.
Influence of time on lure attractiveness
Time did not influence the attractiveness of the lures for any species within 27 days (Table 1). The food lure and the olfactory lures increased the probably of detecting a Tasmanian devil and a spotted-tailed quoll on a given day, irrespective of time since deployment (Table 1).
Discussion
Lures increased feral cat detection and activity across our camera traps. Feral cat detection at a camera trap significantly increased when using the meat or visual lure, and feral cat activity at a site increased with all three lure treatments. This trend was consistent when examining individuals, with all three lure treatments detecting more cats, across more sites, than did the null treatment. Lure attractiveness did not seem to diminish over time within our study period either for feral cats or for Tasmanian devils and spotted-tailed quolls. These latter two predators exhibited higher detectability and increased activity when we deployed meat or olfactory lures. However, an increase in devil capture rates at camera traps owing to meat or olfactory lures corresponded with a decrease in feral cat captures, indicating a negative interaction between these species.
Optimal lures for feral cats
Contrary to previous research, our study showed a significant increase in both detection and activity levels of feral cats with the use of visual lures. Although this lure attracted fewer individuals than did meat or olfactory treatments, it led to high rates of re-visitation. An array of eclectic visual lures has been used to monitor cats in previous studies, including hanging CDs, toy windmills, feathers, flashing bicycle lights and pink flagging tape (Edwards et al. 1997; Molsher 2001; Read et al. 2015). However, previous studies have not conclusively shown that visual lures affect cat detection rates. For instance, Read et al. (2015) did formal tests on the impact of flashing lights and aluminium dishes, concluding that these had no effect on feral cat visitation. The success in our study with visual lures (i.e. feather boas) may be attributed to their resemblance to feral cat prey, which aligns with the visual hunting instincts of feral cats (Stokeld et al. 2016). In contrast, the visual lures described above do not intuitively provide an incentive to feral cats and may even elicit an avoidance response, as expected from a neophobic predator.
The food lure not only increased cat detection and activity but also attracted the highest number of individuals. Meanwhile, the olfactory lure boosted feral cat activity and resulted in the detection of more individuals than either the null or visual lures. These findings align with the observation of Fielding et al. (2022) of feral cats frequently visiting macropod carcass sites across northern Tasmania and the Bass Strait islands, despite feral cats rarely feeding on carrion on mainland Australia. However, our results differ from those of Read et al. (2015) and Stokeld et al. (2016), who reported no change in cat activity or detection in response to food or olfactory lures in arid environments. An important distinction between these studies is their location. The cooler, wetter climate of Tasmania is likely to preserve the palatability of food and olfactory lures, as observed in other temperate lure trials (Ragg et al. 2000), whereas these lure types may dry out and lose potency in arid regions. Lohr et al. (2024) demonstrated the effectiveness of olfactory lures in arid landscapes using ‘drippers,’ which continuously dispense cat urine over several days, overcoming the issue of potency loss. It is therefore important that researchers carefully assess the environmental conditions and logistic constraints of their study site before deciding to deploy lures and consider creative practical approaches to maintaining lure attractiveness.
It should be noted that our study models detection at the camera-trap site, in addition to activity, as our key response variables, as has been done in previous lure trials on cats in Australia (Read et al. 2015). Other lure trials have measured different metrics, including time spent at the camera trap (Tourani et al. 2020) or bait uptake at the cameras (Tobajas et al. 2022). Although our results indicated that these lures increased the probability of detecting a feral cat within the field of view of the camera, the distance from which feral cats were attracted to the lures (via scent rather than visual detection) is unknown.
Influence of time on lure attractiveness
Over our 27-day study period, lure attractiveness appeared unaffected by time. Yet, logically, food and olfactory lures would likely need frequent refreshing because of food consumption or the diminishing palatability and potency of the smell (Lavelle et al. 2017). Notably, by the time we rotated the lure treatments, many food lures were already depleted. This leads us to speculate that lure visitation might decline over an extended period. Investigating the long-term effectiveness and appeal of visual lures and their potential loss of ‘novelty’ could provide valuable insights into their use.
Impact of lures on Tasmanian devils and spotted-tailed quolls
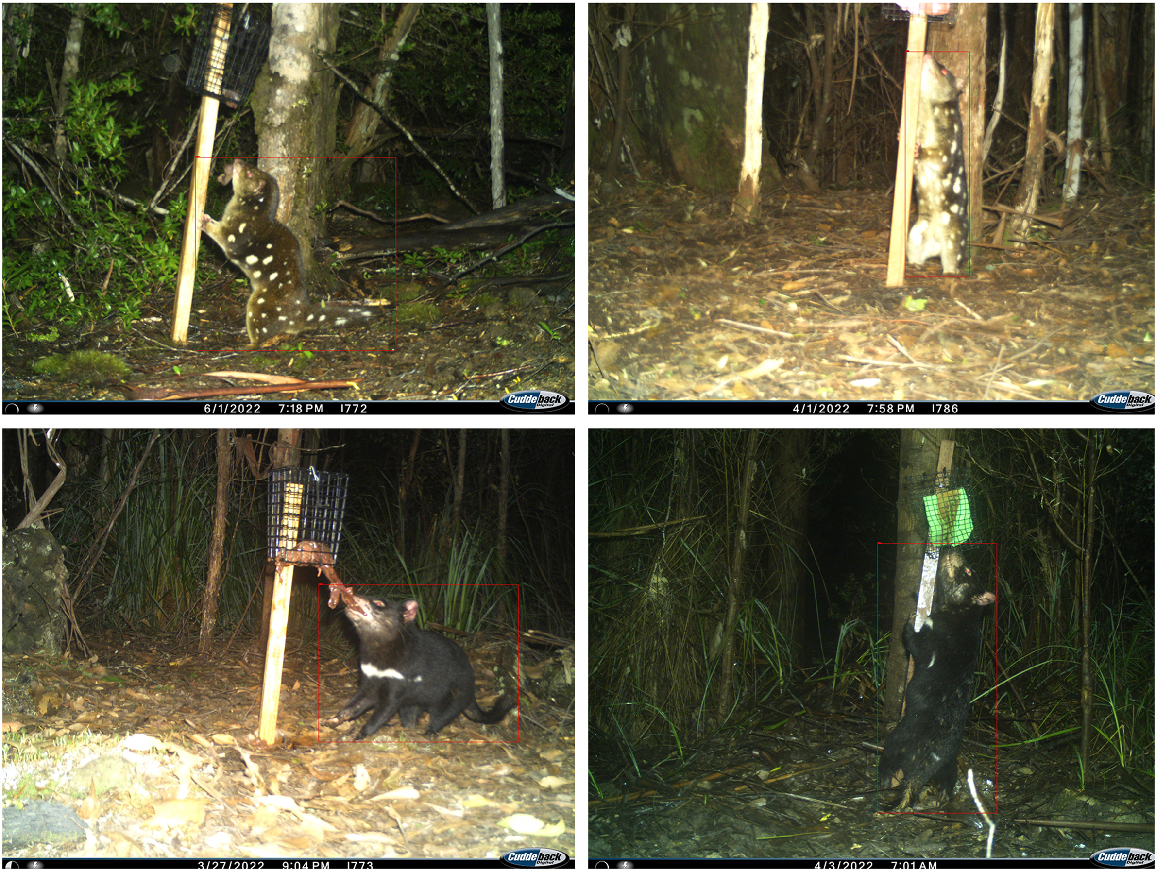
It is unsurprising that the capture rate of Tasmanian devils and spotted-tailed quolls increased in response to the tuna-oil and wallaby-meat lures. Similar lures have been shown to be successful in baiting these species into pipe and cage traps in previous research (Jones et al. 2004). Although our methodology prioritised comparing capture rates rather than delving into detailed observations of predator behaviours (e.g. video footage or burst images), we did observe devils and quolls frequently attacking, wrestling and climbing on the lures (Fig. 5). The pronounced response of these predators to the food and olfactory lure treatments provided an opportunity to examine the impact of their increased activity on feral cats, as intended.
The relationship between feral cats, Tasmanian devils and lures
We observed a positive relationship between the activity of Tasmanian devils and feral cats, which may be due to the both predators frequently using similar trails (Wysong et al. 2020). Although we placed our camera traps solely on games trails and natural clearings to minimise the influence of human-made structures, it is likely that some trails were commonly used by both species. This shared use of established paths could explain the correlation in their recorded activity. Despite this positive overall correlation, the number of feral cat events captured at a camera trap decreased as the number of Tasmanian devil events increased in response to a food or olfactory lure.
This observation is consistent with the findings of Fancourt (2016) within eastern Tasmania. In their study, feral cats and Tasmanian devils were found to occupy the same areas, defined as 2-km transects with 10 camera traps spaced 200 m apart; yet, they found a negative correlation in abundance indices (i.e. PDE) at each camera trap. Fancourt logically posited that that Tasmanian devils and cats may avoid each other temporally and at fine spatial scales. However, all 207 of Fancourt’s (2016) camera traps were deployed with mutton-bird oil as the chosen olfactory lure. As such, Fancourt’s (2016) findings may be reflective of the relationship between Tasmanian devils and cats only when in the presence of lures that result in unusually high devil activity. A similar finding was produced by Lazenby and Dickman (2013), who used a tuna-emulsion lure and ‘tinned cat food in jelly’ as a food incentive for all camera traps in their survey. Those authors reported that ‘feral cats [in south-east Tasmania] were detected consistently less often at cameras where devils were detected’ (p. 9) and related this finding to devils being a ‘dominant predator’ capable of suppressing feral cat activity. Given their smaller size, feral cats are likely to be subordinate in encounters with Tasmanian devils, as demonstrated by their behaviour around carrion (Fielding et al. 2022). However, our findings indicate a positive correlation between Tasmanian devil and feral cat activity at camera trap when no food or olfactory lures are present. This suggests that such lures might elicit territorial responses by Tasmanian devils, potentially deterring feral cats through behaviours such as lingering at the site, anal dragging and growling. Future research could examine how the time spent by each predator species at a camera trap affects the detectability and activity of the target species, by using burst images or video capture. This metric is useful for researchers trying to identify predators individually or examine behaviour, and has been shown to increase with the use of olfactory lures (Lohr et al. 2024). It would also be useful to examine the relationship between Tasmanian devil and feral cat activity across passive camera traps at a larger scale.
Our findings on the negative interspecies interactions between Tasmanian devils and feral cats in the context of lure presence have significant implications for our understanding of feral cat ecology across mainland Tasmania. Past camera-trap research focused on monitoring both feral cats and Tasmanian devils has commonly employed lures, typically of the olfactory type, in an effort to maximise cat detection (Lazenby and Dickman 2013; Fancourt et al. 2015; Andersen et al. 2016; Fancourt 2016; Cunningham et al. 2020). The consistent use of lures throughout these studies may have led to underestimates of feral cat prevalence or overestimates of the impact of Tasmanian devils on feral cat occurrence. We strongly recommend that future surveys aiming to concurrently target feral cats and other predators carefully consider the consequences of influencing species behaviour through lure usage.
Data availability
All data and code will be made available on GitHub: https://github.com/AlexJPaton/LureManuscript.
Declaration of funding
Funding was provided to Prof. Barry Brook by the Australian Research Council (FL160100101).
Acknowledgements
A huge thank you goes to Lenah Valley Game Meats for their donation of the wallaby meat used within this study. Additionally, thanks go to Grace Honeyman, Tim McDonald, Averil Dare, Niam Askey-Doran, Carlos Novoa and Tara van Voorthuizen for volunteering to come on field work during this project.
References
Andersen GE, Johnson CN, Jones ME (2016) Sympatric predator odour reveals a competitive relationship in size-structured mammalian carnivores. Behavioral Ecology and Sociobiology 70, 1831-1841.
| Crossref | Google Scholar |
Apps P, McNutt JW (2018) Are camera traps fit for purpose? A rigorous, reproducible and realistic test of camera trap performance. African Journal of Ecology 56, 710-720.
| Crossref | Google Scholar |
Bates D, Mächler M, Bolker B, Walker S (2015) Fitting linear mixed-effects models using lme4. Journal of Statistical Software 67(1), 1-48.
| Crossref | Google Scholar |
Bengsen A, Butler J, Masters P (2011) Estimating and indexing feral cat population abundances using camera traps. Wildlife Research 38, 732-739.
| Crossref | Google Scholar |
Cunningham CX, Johnson CN, Jones ME (2020) A native apex predator limits an invasive mesopredator and protects native prey: Tasmanian devils protecting bandicoots from cats. Ecology Letters 23, 711-721.
| Crossref | Google Scholar | PubMed |
Curveira-Santos G, Sutherland C, Santos-Reis M, Swanepoel LH (2021) Responses of carnivore assemblages to decentralized conservation approaches in a South African landscape. Journal of Applied Ecology 58, 92-103.
| Crossref | Google Scholar |
Edwards GP, Piddington KC, Paltridge RM (1997) Field evaluation of olfactory lures for feral cats (Felis catus L.) in central Australia. Wildlife Research 24, 173-183.
| Crossref | Google Scholar |
Fancourt BA (2016) Avoiding the subject: the implications of avoidance behaviour for detecting predators. Behavioral Ecology and Sociobiology 70, 1535-1546.
| Crossref | Google Scholar |
Fancourt BA, Hawkins CE, Cameron EZ, Jones ME, Nicol SC (2015) Devil declines and catastrophic cascades: is mesopredator release of feral cats inhibiting recovery of the eastern quoll? PLoS ONE 10, e0119303.
| Crossref | Google Scholar |
Fidino M, Barnas GR, Lehrer EW, Murray MH, Magle SB (2020) Effect of lure on detecting mammals with camera traps. Wildlife Society Bulletin 44, 543-552.
| Crossref | Google Scholar |
Fielding MW, Cunningham CX, Buettel JC, Stojanovic D, Yates LA, Jones ME, Brook BW (2022) Dominant carnivore loss benefits native avian and invasive mammalian scavengers. Proceedings of the Royal Society B: Biological Sciences 289, 20220521.
| Crossref | Google Scholar |
Goldingay RL (2024) The influence of bait and camera type on detection of a spectrum of medium-sized Australian mammals. Australian Mammalogy 46, AM23020.
| Crossref | Google Scholar |
Hamer RP, Gardiner RZ, Proft KM, Johnson CN, Jones ME (2021) A triple threat: high population density, high foraging intensity and flexible habitat preferences explain high impact of feral cats on prey. Proceedings of the Royal Society B: Biological Sciences 288, 20201194.
| Crossref | Google Scholar |
Hamer RP, Andersen GE, Hradsky BA, Troy SN, Gardiner RZ, Johnson CN, Jones ME (2022) Differing effects of productivity on home-range size and population density of a native and an invasive mammalian carnivore. Wildlife Research 49, 158-168.
| Crossref | Google Scholar |
Helmstedt KJ, Shaw JD, Bode M, Terauds A, Springer K, Robinson SA, Possingham HP (2016) Prioritizing eradication actions on islands: it’s not all or nothing. Journal of Applied Ecology 53, 733-741.
| Crossref | Google Scholar |
Hofmeester TR, Rowcliffe JM, Jansen PA (2017) A simple method for estimating the effective detection distance of camera traps. Remote Sensing in Ecology and Conservation 3, 81-89.
| Crossref | Google Scholar |
Jones ME, Paetkau D, Geffen E, Moritz C (2004) Genetic diversity and population structure of Tasmanian devils, the largest marsupial carnivore. Molecular Ecology 13, 2197-2209.
| Crossref | Google Scholar | PubMed |
Kays R, Arbogast BS, Baker-Whatton M, Beirne C, Boone HM, Bowler M, Burneo SF, Cove MV, Ding P, Espinosa S, et al. (2020) An empirical evaluation of camera trap study design: how many, how long and when? Methods in Ecology and Evolution 11, 700-713.
| Crossref | Google Scholar |
Kompas T, Chu L, Van Ha P, Spring D (2019) Budgeting and portfolio allocation for biosecurity measures. Australian Journal of Agricultural and Resource Economics 63, 412-438.
| Crossref | Google Scholar |
Lavelle MJ, Snow NP, Fischer JW, Halseth JM, VanNatta EH, VerCauteren KC (2017) Attractants for wild pigs: current use, availability, needs, and future potential. European Journal of Wildlife Research 63, 86.
| Crossref | Google Scholar |
Lazenby BT, Dickman CR (2013) Patterns of detection and capture are associated with cohabiting predators and prey. PLoS ONE 8, e59846.
| Crossref | Google Scholar |
Lohr CA, Nilsson K, Johnson A, Pittway B, Hamilton N, Onus M, Algar D (2024) Lures change the detectability of feral cats on the arid landscape. Biological Invasions 26, 817-828.
| Crossref | Google Scholar |
Meek PD, Ballard G-A, Vernes K, Fleming PJS (2015) The history of wildlife camera trapping as a survey tool in Australia. Australian Mammalogy 37, 1-12.
| Crossref | Google Scholar |
Molsher RL (2001) Trapping and demographics of feral cats (Felis catus) in central New South Wales. Wildlife Research 28, 631-636.
| Crossref | Google Scholar |
Moseby KE, Selfe R, Freeman A (2004) Attraction of auditory and olfactory lures to feral cats, red foxes, European rabbits and burrowing bettongs. Ecological Management & Restoration 5, 228-231.
| Crossref | Google Scholar |
Nichols M, Ross J, Glen AS, Paterson AM (2019) An evaluation of systematic versus strategically-placed camera traps for monitoring feral cats in New Zealand. Animals 9, 687.
| Crossref | Google Scholar |
O’Connor KM, Nathan LR, Liberati MR, Tingley MW, Vokoun JC, Rittenhouse TAG (2017) Camera trap arrays improve detection probability of wildlife: investigating study design considerations using an empirical dataset. PLoS ONE 12, e0175684.
| Crossref | Google Scholar | PubMed |
Paton AJ, Buettel JC, Brook BW (2022) Evaluating scat surveys as a tool for population and community assessments. Wildlife Research 49, 206-214.
| Crossref | Google Scholar |
Pirie TJ, Thomas RL, Fellowes MDE (2016) Limitations to recording larger mammalian predators in savannah using camera traps and spoor. Wildlife Biology 22, 13-21.
| Crossref | Google Scholar |
Price CJ, Banks PB, Greggor AL (2019) What evidence exists on the effectiveness of different types of olfactory lures as attractants for invasive mammalian predators? A systematic map protocol. Environmental Evidence 8, 12.
| Crossref | Google Scholar |
Ragg JR, Mackintosh CG, Moller H (2000) The scavenging behaviour of ferrets (Mustela furo), feral cats (Felis domesticus), possums (Trichosurus vulpecula), hedgehogs (Erinaceus europaeus) and harrier hawks (Circus approximans) on pastoral farmland in New Zealand: implications for bovine tuberculosis transmission. New Zealand Veterinary Journal 48, 166-175.
| Crossref | Google Scholar | PubMed |
Read JL, Bengsen AJ, Meek PD, Moseby KE (2015) How to snap your cat: optimum lures and their placement for attracting mammalian predators in arid Australia. Wildlife Research 42, 1-12.
| Crossref | Google Scholar |
Rees MW, Pascoe JH, Wintle BA, Le Pla M, Birnbaum EK, Hradsky BA (2019) Unexpectedly high densities of feral cats in a rugged temperate forest. Biological Conservation 239, 108287.
| Crossref | Google Scholar |
Rovero F, Zimmermann F, Berzi D, Meek P (2013) ‘Which camera trap type and how many do I need?’ A review of camera features and study designs for a range of wildlife research applications. Hystrix 24, 148-156.
| Crossref | Google Scholar |
Si X, Kays R, Ding P (2014) How long is enough to detect terrestrial animals? Estimating the minimum trapping effort on camera traps. PeerJ 2, e374.
| Crossref | Google Scholar | PubMed |
Sievert O, Comley E, Phiri W, Davis RS (2023) Using camera traps to assess carcass use and the intraguild dynamics of understudied African mesocarnivores. Food Webs 36, e00287.
| Crossref | Google Scholar |
Stokeld D, Frank ASK, Hill B, Choy JL, Mahney T, Stevens A, Young S, Rangers D, Rangers W, Gillespie GR (2016) Multiple cameras required to reliably detect feral cats in northern Australian tropical savanna: an evaluation of sampling design when using camera traps. Wildlife Research 42, 642-649.
| Crossref | Google Scholar |
Tobajas J, Descalzo E, Mateo R, Ferreras P (2022) Using lures for improving selectivity of bait intake by red foxes. Wildlife Research 49, 129-136.
| Crossref | Google Scholar |
Tourani M, Brøste EN, Bakken S, Odden J, Bischof R (2020) Sooner, closer, or longer: detectability of mesocarnivores at camera traps. Journal of Zoology 312, 259-270.
| Crossref | Google Scholar |
Trolliet F, Vermeulen C, Huynen M-C, Hambuckers A (2014) Use of camera traps for wildlife studies. A review. Biotechnologie, Agronomie, Société et Environnement 18, 446-454.
| Google Scholar |
Wearn OR, Glover-Kapfer P (2019) Snap happy: camera traps are an effective sampling tool when compared with alternative methods. Royal Society Open Science 6, 181748.
| Crossref | Google Scholar | PubMed |
Wysong ML, Iacona GD, Valentine LE, Morris K, Ritchie EG (2020) On the right track: placement of camera traps on roads improves detection of predators and shows non-target impacts of feral cat baiting. Wildlife Research 47, 557-569.
| Crossref | Google Scholar |