

Towards automated detection of the endangered southern black-throated finch (Poephila cincta cincta)
Slade Allen-Ankins A * , Juan Mula Laguna A and Lin Schwarzkopf A
A
Abstract
Biodiversity is declining worldwide, with many species decreasing in both number and range. Acoustic monitoring is rapidly becoming a common survey method in the ecologist’s toolkit that may aid in the conservation of endangered species, but effective analysis of long-duration audio recordings is still challenging.
The aims of this study were to: (1) develop and test call recognisers for the endangered southern black-throated finch (Poephila cincta cincta) as well as the similar sounding, but non-endangered, double-barred finch (Taeniopygia bichenovii); and (2) compare the ability of these recognisers to detect these species with that of on-ground bird surveys at under-surveyed locations in the Desert Uplands bioregion which is at the edge of the known range of the black-throated finch.
A range of convolutional neural network call recognition models were built and tested for both target species, before being deployed over new audio recordings collected at 25 sites during 2020, 2021 and 2022, and compared with the results of on-ground bird surveys at those same sites.
Call recognisers for both species performed well on test datasets from locations in the same area as the training data with an average area under the precision-recall curve (PRAUC) of 0.82 for black-throated finch and 0.87 for double-barred finch. On-ground bird surveys in the Desert Uplands bioregion detected black-throated finches at two locations in different years, and our call recognisers confirmed this with minimal post-validation of detections. Similar agreement between methods were obtained for the double-barred finch, with site occupancy in the Desert Uplands bioregion confirmed with audio recognition in all nine surveys with on-ground detections, as well as during four additional surveys that had no on-ground detections.
Using call recognisers to survey new locations for black-throated finch presence was equally successful as on-ground surveys, and with further refinements, such as retraining models with examples of commonly misclassified vocalisations added to the training data, minimal validation should be required to detect site presence.
Acoustic monitoring should be considered as a valuable tool to be used alongside manual surveys to allow effective monitoring and conservation of this endangered species.
Keywords: acoustic monitoring, black-throated finch, call recogniser, conservation, convolutional neural network, double-barred finch, machine learning, threatened species.
Introduction
The rapid loss of biodiversity worldwide demands urgent conservation action (Barnosky et al. 2011; Ceballos et al. 2020). However, knowledge of the distribution of endangered and rare species is often limited, hampering conservation efforts (Gaston and Rodrigues 2003; Grand et al. 2007). On-ground surveys typically have high operational costs, limiting the spatial and temporal scale at which surveys can be conducted, potentially missing important sites that may be worth preserving because they are occupied by the species of interest (Darras et al. 2019). Efficient and low-cost monitoring methods that allow effective monitoring at the scales required are needed, and will ultimately lead to better-informed conservation management practices.
Passive acoustic monitoring has recently emerged as a powerful tool for surveying rare and endangered birds, as audio recorders can have greater temporal and spatial coverage than human-based surveys, allowing more cost-effective monitoring (Digby et al. 2013; Gibb et al. 2019; Pérez-Granados and Traba 2021; Schwarzkopf et al. 2023). Recording may be particularly useful for nomadic and migratory species or those with low site-fidelity, which may be missed by traditional surveys that typically consist of very short visits (Venier et al. 2012). There are, however, still considerable challenges in analysing long-duration audio recordings. Despite the promise of machine learning methods for audio analysis, manual identification of species vocalisations through audio playback and spectrogram visualisation is still common, although becoming less prevalent as new techniques become available (Priyadarshani et al. 2018; Sugai et al. 2019). The reliance on manual identification makes it difficult to scale acoustic monitoring efforts, and subsampling of audio, typically employed by these studies, may reduce detectability (Sugai et al. 2020). This may be particularly true for rare species where a lot of audio data may be required to capture relatively few vocalisations. Therefore, there is a need to develop and test automated methods of detecting rare and endangered species vocalisations from audio recordings.
Call recognisers are increasingly used by ecologists to process audio recordings, as they employ automated sound recognition algorithms that can search large amounts of audio data for the vocalisation of interest (Stowell et al. 2019; Ruff et al. 2020; Eichinski et al. 2022; Teixeira et al. 2022). Many software-based solutions for call recognisers exist, however performance can be poor and often varies among approaches (e.g. Waddle et al. 2009; Lemen et al. 2015; Rocha et al. 2015; Crump and Houlahan 2017; Schroeder and McRae 2020). Additionally, many call recogniser studies still use small datasets for testing purposes, rather than recordings from passive acoustic monitoring (Priyadarshani et al. 2018). Recently, convolutional neural networks (CNNs) have emerged as state-of-the-art tools for image recognition and have also been successfully used to recognise species vocalisations from spectrograms (Incze et al. 2018; Efremova et al. 2019; Ruff et al. 2020; Kahl et al. 2021). CNN-based call recognisers are highly effective at finding patterns in spectrograms, using a range of filters to detect features present in the image, and as opposed to many other approaches, they do not require the user to select and program call features that are useful for recognition, rather CNN-based call recognisers learn them automatically from the data used to train them. These advantages allow them to outperform previous models, and consequently, most modern sound recognition models use CNNs trained on spectrograms (Kahl et al. 2021).
As CNN-based call recognisers learn features automatically from data, they typically require a lot of labelled examples to train an effective model (Eichinski et al. 2022). This may be particularly challenging for rare and endangered species, which often have very few existing recordings for training purposes. Additionally, often the intended goal is to deploy a recogniser to new locations where soundscape characteristics may be different, potentially reducing performance (Eichinski et al. 2022). Before relying on CNN-based recognisers deployed in locations with novel soundscapes, their performance must be evaluated within the context of that novel soundscape.
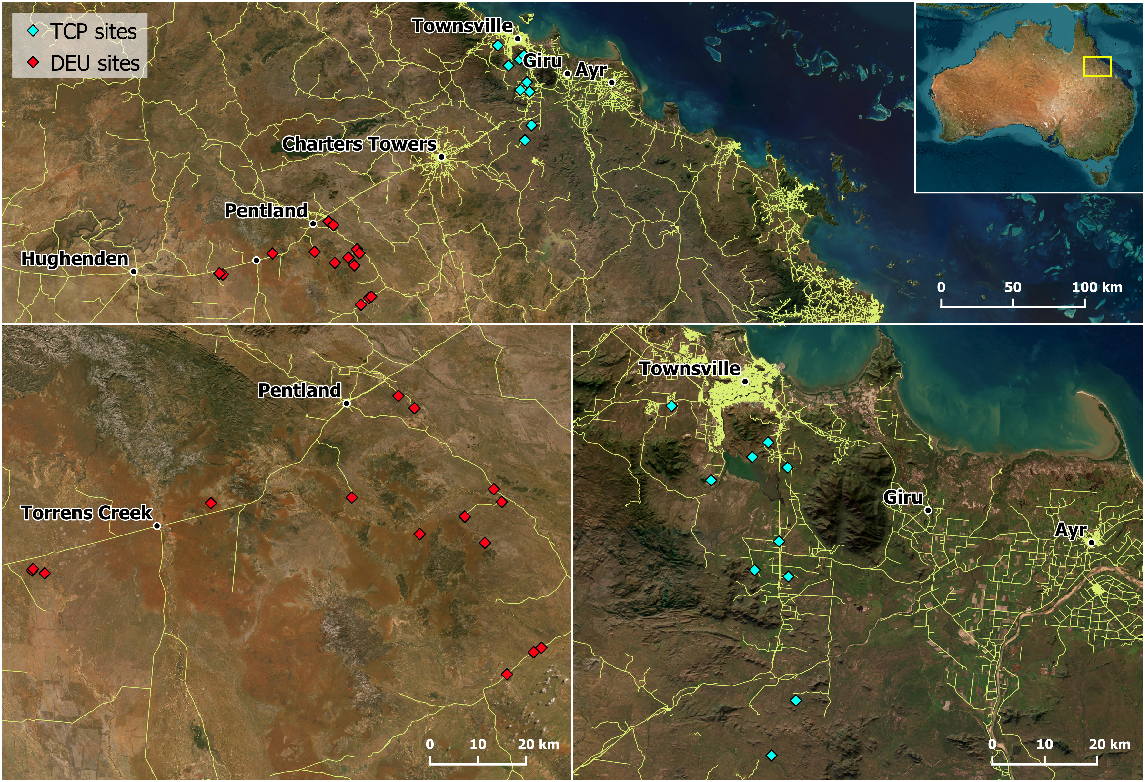
The southern subspecies of the black-throated finch (Poephila cincta cincta) is a small granivorous bird endemic to North-East Queensland. Historically, southern black-throated finches occupied open woodlands and savannas in a broad area between north-eastern New South Wales and the headwaters of the Burdekin and Lynd Rivers in north-eastern Queensland, (Mula Laguna et al. 2019). However, southern black-throated finches (hereafter BTFS) are estimated to have lost 88% of their former distribution in the last four decades, with current records concentrated within two main stronghold areas (Fig. 1): the Townsville Coastal Plain subregion, and the eastern half of the Desert Uplands bioregion (as described by the Department of the Environment, Interim Biogeographic Regionalisation for Australia ver. 7, 2012). This rapid decline has granted their listing as ‘Presumed Extinct’ under New South Wales’ Biodiversity Conservation Act 2016, and ‘Endangered’ both in Queensland and nationally under the Nature Conservation Act 1992, and the Commonwealth Environment Protection and Biodiversity Conservation Act 1999, respectively. Their disappearance is primarily associated with the high rate of habitat clearing within their historic range (Reside et al. 2019), although stock grazing, modified fire regimes, and invasive vegetation are likely to have contributed via mechanisms that are still uncertain.
Map showing both Townsville Coastal Plains (TCP; blue) and Desert Uplands (DEU; red) sites (top) and zoomed maps of both regions (bottom).
Monitoring remaining BTFS populations has become a top priority to help identify areas required to ensure their persistence, but this task can be costly and labour-intensive. BTFS have become rare, occurring in low densities within vast areas of open woodland. Most of this habitat falls within large private properties primarily dedicated to cattle grazing and other extractive industries, which limits access. These factors, added to the small size and inconspicuous behaviour of BTFS can often make detecting them difficult, especially in remote and sparsely populated regions where operational costs of searching may be higher.
As an alternative, passive acoustic monitoring devices can offer a more effective and cost-efficient method to aid in monitoring this endangered bird. Despite their low abundance and otherwise inconspicuous behaviour, BTFS often use contact calls when flocking, foraging, or drinking. Thus, the strategic placement of recording devices near waterholes can prove an effective method for detecting BTFS presence by multiplying survey effort while lowering operational costs.
In this study we aimed to develop and test the performance of a CNN-based call recogniser for the endangered southern subspecies of the black-throated finch. We specifically wanted to test whether we could use passive acoustic recorders to detect the presence of BTFS at remote locations that have not been surveyed for a long time, or where habitat models predict they could occur (Mula Laguna 2020). In addition, we also developed a recogniser for the more common, but similar sounding, double-barred finch (Taeniopygia bichenovii – hereafter DBF). The two taxa are closely related, and overlap through all of BTFS present range, occupying similar habitat types (Vanderduys et al. 2016). They are also both granivorous species and often forage and drink together in mixed-species flocks (Vanderduys et al. 2016). A recogniser for the DBF may be useful for looking at the difference in site use between the two species to understand the specific habitat requirements of the BTFS. The development of a call recogniser for the BTFS will help aid conservation efforts by providing a new tool that can allow increased monitoring effort to document their range and track population change through time.
Materials and methods
Training audio recordings
As we did not know if southern black-throated finches occurred in our new target area (the Desert Uplands bioregion), we used recordings from the Townsville Coastal Plain subregion, a nearby area that supports BTFS populations, to provide the necessary example vocalisations to train our convolutional neural network (Fig. 1). One site was surveyed in August–October 2018, and four sites surveyed in September 2020, with a total of 175.3 h of audio collected. All recordings took place between 07:30 and 09:30. Recordings were made at 96 kHz using bioacoustic recorders (Bioacoustic Audio Recorder – BAR, Frontier Labs, Brisbane, Australia), before being resampled to 44.1 kHz as this reduced storage requirements, sped up analysis, and covers the frequency range of both species vocalisations (i.e. 1.5–6.5 kHz).
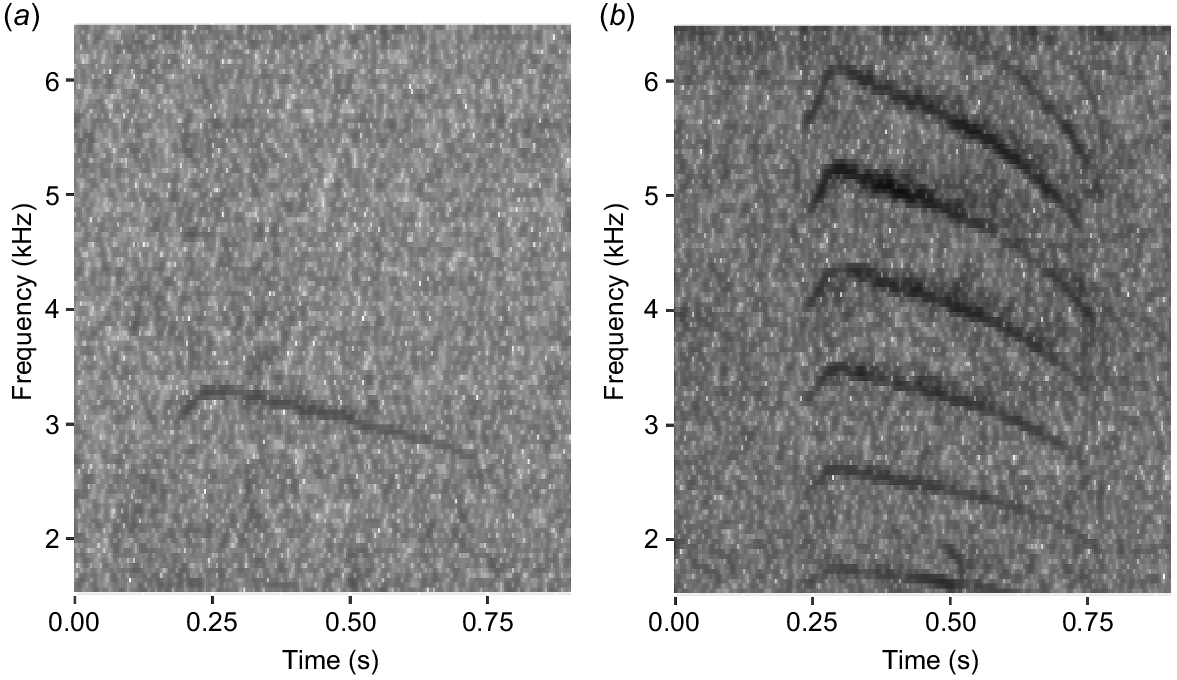
All training recordings were manually examined using Raven Pro ver. 1.6 (Cornell Lab of Ornithology, NY, USA) and fully annotated for all vocalisations of BTFS and DBF (Fig. 2). A total of 7473 BTFS vocalisations (2018: 3576; 2020: 3897) and 3157 DBF vocalisations (2018: 2135; 2020: 1022) were identified in the training recordings.
Example spectrograms of vocalisations for (a) black-throated finch (Poephila cincta cincta), and (b) double-barred finch (Taeniopygia bichenovii).
Spectrograms of all labelled vocalisations (positive examples) and all other audio (negative examples) were generated for the entire set of audio recordings using a 0.672 s segment duration with frequency limits of 1.5–6.5 kHz which covers the entire frequency range of target vocalisations. All spectrograms were produced in R ver. 3.6.1 using seewave (Sueur et al. 2008; R Core Team 2019) with a window length of 1024 samples and an overlap between successive windows of 85%, before being resized to a resolution of 187 × 187 pixels for use in convolutional neural networks (CNNs), as most CNN architectures require equal sized input images.
Convolutional neural networks
We tested three different CNN architectures: Inception v3 (Szegedy et al. 2016), ResNet50 (He et al. 2016) and Inception-ResNet v2 (Szegedy et al. 2017). To estimate the efficacy of these models on new recordings, as well as to determine the best performing CNN architecture for our task, models trained on the 2018 recordings were tested against the 2020 recordings and vice versa (Fig. 3). Separate models were trained for each species (i.e. binary classification).
Flowchart of the data preparation, model training and model evaluation steps used for developing CNN recognisers for the southern black-throated finch and the double-barred finch.
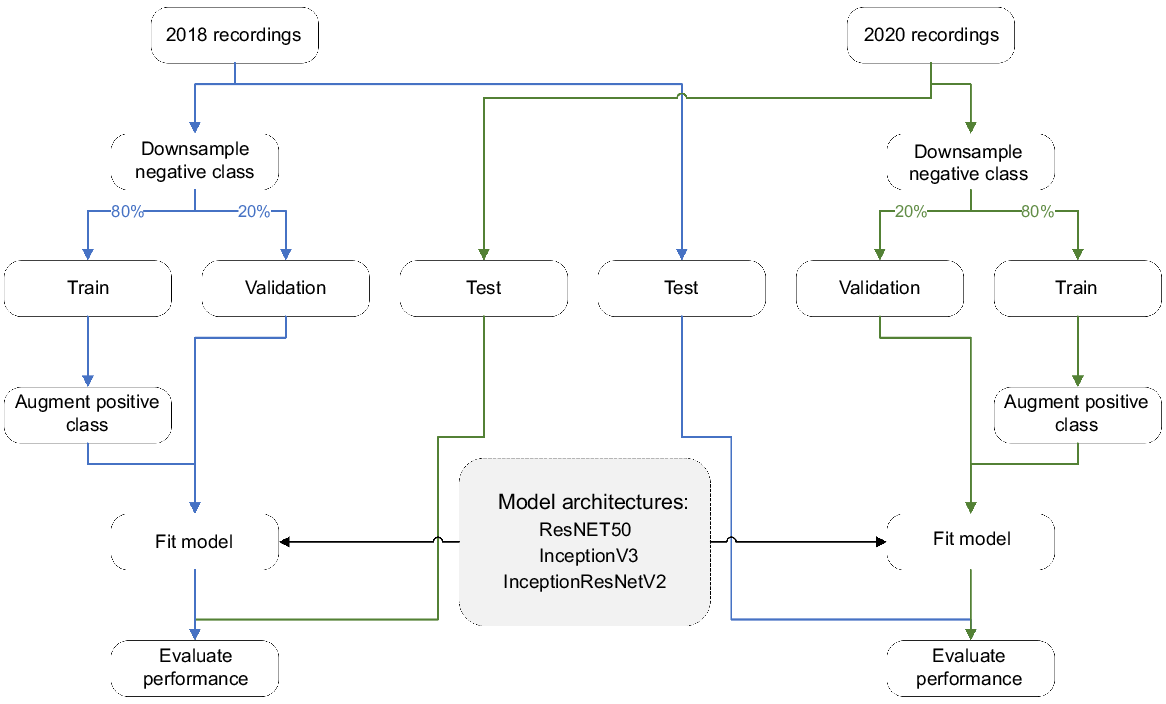
For both species and years, positive examples (<4000) were greatly outnumbered by negative examples (>200,000), which can cause issues for model fitting (Buda et al. 2018). One way to handle this issue is to downsample (i.e. subset) the negative class to match the size of the positive class. However, because the negative class in our use case is ‘all other sound’, this would remove important information from the model training. Instead, we chose to use a combination of downsampling the negative class and upsampling the positive class. The negative class was downsampled to 50,000 examples to keep model training times reasonable. Examples of both classes were then split into training (80%) and validation (20%) sets. The positive class in the training set was upsampled using augmentation to match the number of negative examples (i.e. 40,000). Augmented examples (AE) were generated by using a combination of random shifts along the time (±20 pixels) and frequency (±10 pixels) axes, as well as by mixing randomly selected negative examples (NE) with positive examples (PE) according to:
where ‘factor’ was a random value between 0.5 and 1. This approach is known as pixel-wise mixing (Lewy and Mańdziuk 2023) and was used to generate realistic new examples of our target class with overlapping non-target sounds (e.g. other birds, rain, wind etc.), which are likely to be commonly encountered by the final models when deployed on long-duration soundscape recordings. The validation sets were left as original (i.e. no upsampling/augmentation), so that they contained positive and negative examples at ratios that were closer to those expected in real recordings (Fig. 3).
To prevent overfitting, models were trained with an early stopping procedure. Model training was stopped when validation loss (i.e. performance on the validation data) failed to decrease by at least 0.002 for five epochs in a row (i.e. min delta = 0.002, patience = 5). The final model weights were then taken from the epoch that had the best (i.e. lowest) validation loss. All models were trained in R vers 3.6.1 (R Core Team 2019), using keras (v2.3; Allaire and Chollet 2020) and tensorflow (v2.2; Allaire and Tang 2020) on a NVIDIA Quadro T1000 GPU.
Testing procedure
Models trained on each year’s training dataset were tested on the other dataset without downsampling, with the average F1-score (i.e. the harmonic mean of precision and recall) across both models used to determine which CNN architecture performed the best. Model performance was also evaluated at a range of thresholds to determine which threshold maximised F1-score (Supplementary Fig. S1). To determine how well the models predicted actual number of BTFS and DBF vocalisations in individual recordings, the number of vocalisations detected by the recogniser per recording were compared with the number of actual labelled vocalisations.
For making predictions on new recordings, final models for BTFS and DBF were trained using the best performing CNN architecture and all available training data (i.e. both 2018 and 2020 recordings).
Surveying for black-throated finches in new locations
To evaluate the effectiveness of the CNNs to detect BTFS at new habitats, audio recorders were deployed to record in the morning for approximately 1 week (mean: 9.14 days; range: 6–13 days) at 10 sites in the Townsville Coastal Plains bioregion (TCP; a known area of BTFS occurrence) in 2020, and 15 sites in the Desert Uplands bioregion (DEU) during 2020, 2021, and 2022. The sites located in the DEU bioregion were of primary interest, however given the high possibility that BTFS would not be found there, the 10 sites in the TCP bioregion surveyed in 2020 would be useful for further evaluating recogniser performance. A total of 1982 h of recordings were collected across the 25 sites during 2020, 2021 and 2022 and analysed using the CNN models.
We carried out surveys during the early wet or late dry season to ensure that other ephemeral water sources were scarce, maximising the chances that birds would visit the chosen watering spots. We selected survey sites based on (1) the presence of a permanent or semi-permanent water source (e.g. dams, waterholes or cattle troughs), (2) the proximity to seemingly suitable habitat based on on-site observations and habitat suitability projections (Mula Laguna 2020), and (3) in some cases the vicinity to a historical BTFS record (unpubl. data Black-throated Finch Recovery Team).
To determine the effectiveness of acoustic surveys at detecting the presence of our target species, we compared the results with those from manual bird surveys. At each recording site, we completed two 1-h waterhole point-count surveys for finch species, one following the deployment of the recorder, and one on collection. Additionally, we conducted four 200-m timed (15 minute) transect surveys starting at the waterhole, two upon deployment and two upon collection. As the target species are often in low abundance and inconspicuous, the addition of the transect survey was used to detect instances where the target species was in the general vicinity of the waterhole but missed by the point count. These instances could be used to evaluate whether the longer deployment duration of the audio recorders was sufficient to detect the species.
Even with good performance from our CNN recognisers, many detections were likely to be generated when running over 1000s of hours of audio recordings, requiring a lot of manual verification. Therefore, to evaluate the site presence of both species, only 200 detections with the highest model confidence scores for each site in each year were validated. As this approach does not allow calculation of precision and recall curves for the recordings in the new location, something that would take substantial validation effort, we instead plotted the number of validations per site necessary until no new sites were identified as being occupied by each of the target species.
Results
Performance on test data
Performance of the different CNN architectures varied across test sets, but in general, for both species, InceptionV3 was the best performing recogniser, followed by InceptionResnetV2, while ResNet50 had the poorest performance (Fig. 4). The area under the precision-recall curve was greater for all DBF models than the equivalent BTFS models (Table S1).
Precision-recall curves for each model predicting vocalisations of black-throated finch (a and b), and double-barred finch (c and d). Models (a) and (c) are trained on 2018 recordings and predicted on 2020 recordings. Models (b) and (d) are trained on 2020 recordings and predicted on 2018 recordings.
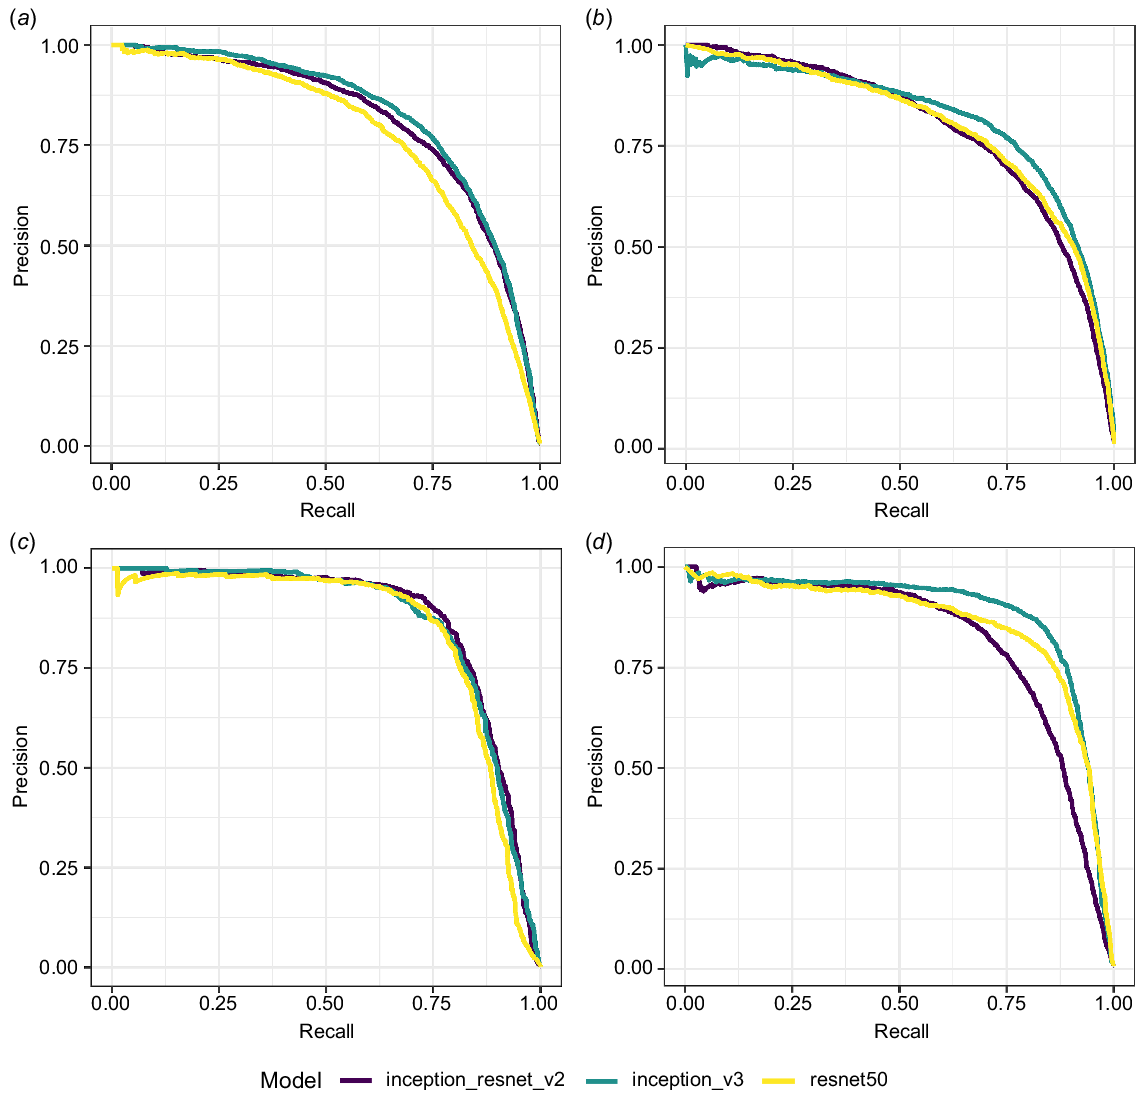
For each model, the ideal threshold was selected based on F1-score (Fig. S1). The InceptionV3 model had the highest average performance for both species across the two test data sets (Table 1). The average threshold that maximised F1-score was 0.885 for BTFS and 0.83 for DBF.
| Species | Model | 2018 | 2020 | |||||
|---|---|---|---|---|---|---|---|---|
| Recall | Precision | F1 | Recall | Precision | F1 | |||
| Black-throated finch | InceptionResnetV2 | 0.758 | 0.731 | 0.744 | 0.720 | 0.733 | 0.727 | |
| InceptionV3 | 0.740 | 0.779 | 0.759 | 0.768 | 0.756 | 0.762 | ||
| ResNet50 | 0.679 | 0.755 | 0.715 | 0.727 | 0.735 | 0.731 | ||
| Double-barred finch | InceptionResnetV2 | 0.782 | 0.868 | 0.823 | 0.751 | 0.781 | 0.766 | |
| InceptionV3 | 0.764 | 0.865 | 0.811 | 0.839 | 0.849 | 0.844 | ||
| ResNet50 | 0.761 | 0.863 | 0.809 | 0.838 | 0.790 | 0.813 | ||
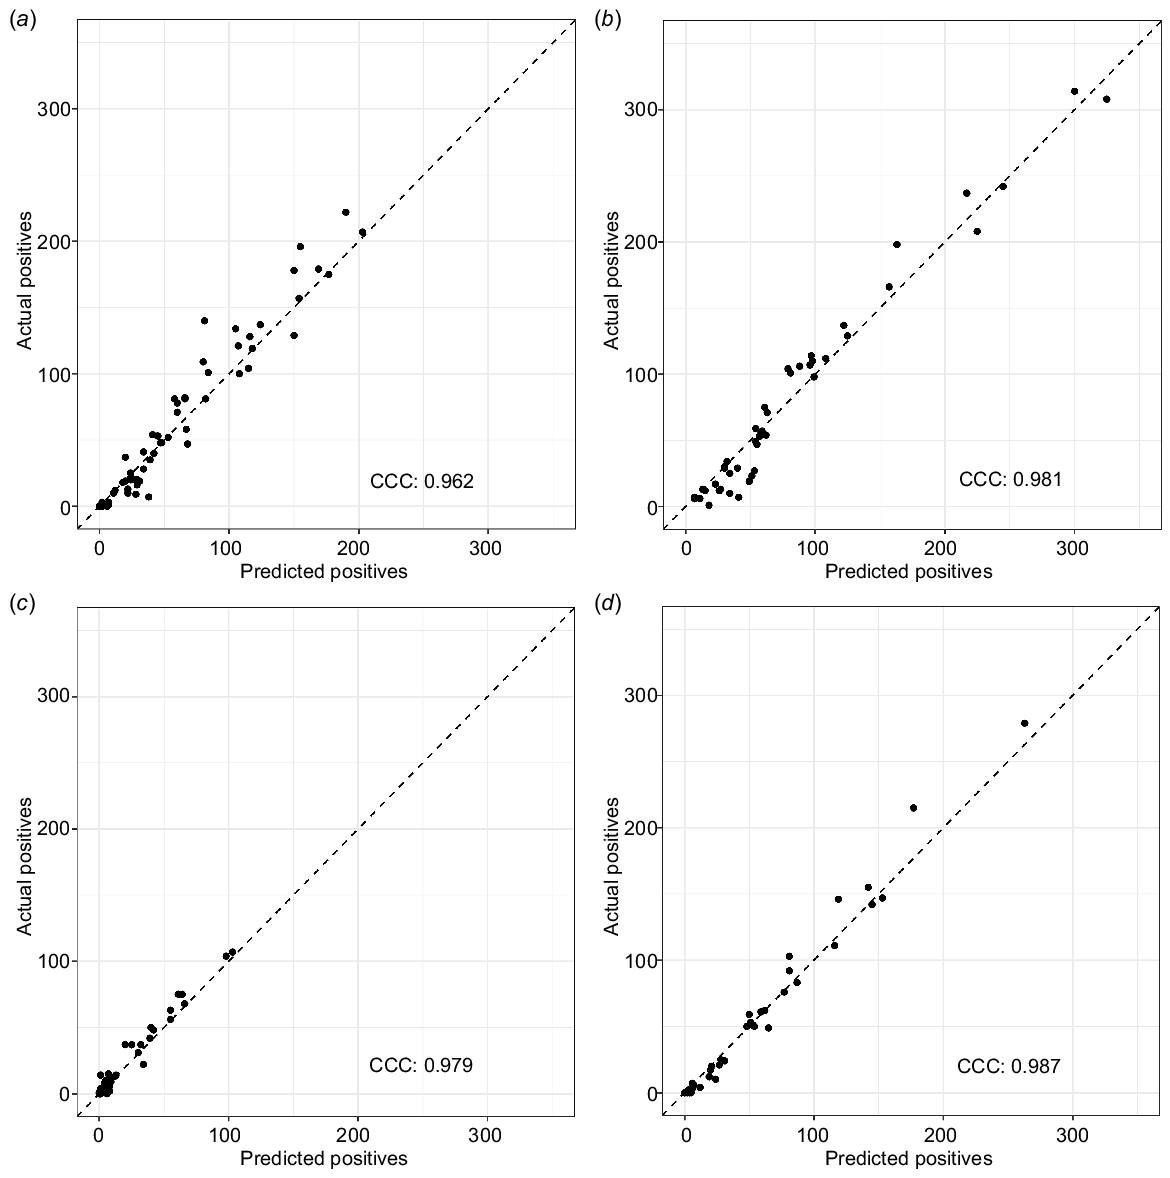
There was very high agreement (concordance correlation coefficient (CCC) > 0.95) between the number of vocalisations detected by the recogniser and the true number of vocalisations manually verified in each recording for both species and test data sets (Fig. 5).
The number of predicted vocalisations in a recording plotted against the number of actual vocalisations in a recording for black-throated finch (a and b), and double-barred finch (c and d). Models (a) and (c) are trained on 2018 recordings and predicted on 2020 recordings. Models (b) and (d) are trained on 2020 recordings and predicted on 2018 recordings. Model predictions are based on the InceptionV3 model using a threshold which maximised F1 score. The concordance correlation coefficient (CCC) value measures the fit of the predictions, with one being near-perfect agreement.
Detections on new recordings at new locations
The InceptionV3 model for each species was applied to 1982 h of audio recordings collected from 25 sites surveyed in 2020, 2021 and 2022, and the 200 detections with the highest model confidence scores for each site in each year were validated. A total of 7000 BTFS detections were checked and 211 were true-positives. A total of 7000 DBF detections were checked and 1649 were true-positives. It took approximately 8 h to check the detections of both species (i.e. ~4 h per species).
There was good agreement between the site occupancy determined using audio detections and those from manual bird surveys (Tables 2, 3 and S2). In the TCP bioregion, BTFS were detected at four sites using manual surveys, with audio detections also at those same four sites as well as two more (Table S2). DBF were detected at nine of the ten TCP sites surveyed, with audio detections at all of the same sites (Table S2).
| Site | 2020 | 2021 | 2022 | ||||||||||
|---|---|---|---|---|---|---|---|---|---|---|---|---|---|
| P | T | A | P | T | A | P | T | A | |||||
| DLDL | 0 | 0 | 0 | 0 | – | – | – | – | – | – | – | – | |
| 0 | 0 | 0 | – | – | – | – | – | – | |||||
| DRGS | 0 | 0 | 0 | 0 | – | – | – | – | – | – | – | – | |
| 0 | 0 | 0 | – | – | – | – | – | – | |||||
| DURO | 0 | 0 | 0 | 0 | 0 | 0 | 0 | 0 | 0 | 0 | 0 | 0 | |
| 0 | 0 | 0 | 0 | 0 | 0 | 0 | 0 | 0 | |||||
| DURT | 0 | 0 | 0 | 0 | 0 | 0 | 0 | 0 | 0 | 0 | 0 | – | |
| 0 | 0 | 0 | 0 | 0 | 0 | 0 | 0 | 0 | |||||
| DMRR | 0 | 0 | 0 | 0 | 0 | 0 | 0 | 0 | 0 | 0 | 0 | 0 | |
| 0 | 0 | 0 | 0 | 0 | 0 | 0 | 0 | 0 | |||||
| DMRB | 0 | 0 | 0 | 0 | 0 | 0 | 0 | – | 0 | 0 | 0 | 0 | |
| 0 | 0 | 0 | 0 | 0 | 0 | 0 | 0 | 0 | |||||
| DBKL | 0 | 0 | 0 | – | 0 | 0 | 0 | – | 0 | 0 | 0 | 0 | |
| 0 | 0 | 0 | 0 | – | – | – | 0 | 0 | |||||
| DBKD | – | – | – | – | – | – | – | – | 0 | 0 | 0 | 0 | |
| – | – | – | – | – | – | – | – | – | |||||
| DBKT | 0 | 0 | 0 | 0 | – | – | – | – | – | – | – | – | |
| 0 | 0 | 0 | – | – | – | – | – | – | |||||
| DBKR | – | – | – | – | 0 | 0 | 0 | – | – | – | – | – | |
| – | – | – | 0 | 0 | 0 | – | – | – | |||||
| DPRD | 0 | 0 | 0 | 0 | 0 | 0 | 0 | – | 0 | 0 | 0 | 0 | |
| 0 | 0 | 0 | 0 | 0 | 0 | 0 | 0 | 0 | |||||
| DPRR | 0 | 0 | 0 | 0 | 0 | 0 | 0 | 1 | – | – | – | – | |
| 0 | 0 | 0 | 3 | 6 | 3 | – | – | – | |||||
| DPRM | – | – | – | – | – | – | – | – | 15 | 2 | 0 | 1 | |
| – | – | – | – | – | – | 0 | 0 | 0 | |||||
| DLTO | – | – | – | – | 0 | 0 | 0 | 0 | 0 | 0 | 0 | 0 | |
| – | – | – | 0 | 0 | 0 | 0 | 0 | 0 | |||||
| DLTT | – | – | – | – | 0 | 0 | 0 | – | 0 | 0 | 0 | 0 | |
| – | – | – | 0 | 0 | 0 | 0 | 0 | 0 | |||||
Numbers for point count and transect surveys represent the number of individual birds detected, while for audio detections 0, no true-positives and 1, at least one true-positive. Dash (–) represents not surveyed or missing audio. Detection, non-detection, and missing data are coloured blue, red and grey respectively to enhance readability. Point count and transect surveys (x2) were conducted both at the start and end of acoustic recorder deployment.
| Site | 2020 | 2021 | 2022 | ||||||||||
|---|---|---|---|---|---|---|---|---|---|---|---|---|---|
| P | T | A | P | T | A | P | T | A | |||||
| DLDL | 0 | 0 | 0 | 1 | – | – | – | – | – | – | – | – | |
| 0 | 0 | 0 | – | – | – | – | – | – | |||||
| DRGS | 0 | 0 | 0 | 0 | – | – | – | – | – | – | – | – | |
| 0 | 0 | 0 | – | – | – | – | – | – | |||||
| DURO | 0 | 0 | 0 | 0 | 0 | 0 | 0 | 0 | 0 | 0 | 0 | 0 | |
| 0 | 0 | 0 | 0 | 0 | 0 | 0 | 0 | 0 | |||||
| DURT | 0 | 0 | 0 | 0 | 0 | 0 | 0 | 0 | 0 | 0 | 0 | – | |
| 0 | 0 | 0 | 0 | 0 | 0 | 0 | 0 | 0 | |||||
| DMRR | 0 | 1 | 0 | 1 | 0 | 0 | 0 | 0 | 1 | 10 | 0 | 1 | |
| 6 | 0 | 3 | 0 | 0 | 0 | 5 | 0 | 2 | |||||
| DMRB | 0 | 0 | 0 | 0 | 0 | 0 | 0 | – | 0 | 0 | 0 | 0 | |
| 0 | 0 | 0 | 0 | 0 | 0 | 0 | 0 | 0 | |||||
| DBKL | 6 | 0 | 0 | – | 0 | 0 | 0 | – | 5 | 0 | 0 | 1 | |
| 3 | 0 | 0 | 0 | – | – | – | 0 | 0 | |||||
| DBKD | – | – | – | – | – | – | – | – | 0 | 0 | 0 | 0 | |
| – | – | – | – | – | – | – | – | – | |||||
| DBKT | 9 | 0 | 0 | 1 | – | – | – | – | – | – | – | – | |
| 0 | 0 | 0 | – | – | – | – | – | – | |||||
| DBKR | – | – | – | – | 0 | 0 | 0 | – | – | – | – | – | |
| – | – | – | 0 | 0 | 0 | – | – | – | |||||
| DPRD | 9 | 6 | 0 | 1 | 20 | 15 | 0 | – | 5 | 0 | 24 | 1 | |
| 14 | 2 | 0 | 12 | 5 | 0 | 0 | 5 | 0 | |||||
| DPRR | 0 | 0 | 0 | 1 | 0 | 0 | 0 | 1 | – | – | – | – | |
| 0 | 0 | 0 | 20 | 18 | 12 | – | – | – | |||||
| DPRM | – | – | – | – | – | – | – | – | 58 | 20 | 0 | 1 | |
| – | – | – | – | – | – | 3 | 0 | 11 | |||||
| DLTO | – | – | – | – | 0 | 0 | 0 | 1 | 0 | 0 | 0 | 1 | |
| – | – | – | 0 | 0 | 0 | 0 | 0 | 0 | |||||
| DLTT | – | – | – | – | 0 | 0 | 0 | – | 0 | 0 | 0 | 1 | |
| – | – | – | 6 | 0 | 0 | 0 | 2 | 0 | |||||
Numbers for point count and transect surveys represent the number of individual birds detected, while for audio detections 0, no true-positives and 1, at least one true-positive. Dash (–) represents not surveyed or missing audio. Detection, non-detection, and missing data are coloured blue, red and grey respectively to enhance readability. Point count and transect surveys (x2) were conducted both at the start and end of acoustic recorder deployment. Bold indicates disagreement between site presence determined using on-site surveys and audio recordings.
In the DEU bioregion, BTFS were only detected during two surveys using manual methods, at site DPRR in 2021 and site DPRM in 2022 (Table 2). These two surveys were also the only times where BTFS were detected using audio recordings. There were more true-positive BTFS detections at DPRM in 2022 (54), where BTFS numbers were greater during point counts (i.e. at the recorder location) than at DPRR in 2021 (3), where BTFS we more common in the transect surveys (i.e. away from the recorder location). In the DEU bioregion, DBF were detected during nine surveys using manual methods (excluding surveys with missing audio – one site in 2020, and two sites in 2021), and all of those surveys had true-positive audio detections following validation. Additionally, four surveys without detections of DBF during manual surveys had true-positive audio detections (Table 3). Using the acoustic recorders, the proportion of days with true-positive detections (number of days detected/number of days recorded) (mean ± s.d.) was higher for BTFS at TCP sites (0.49 ± 0.26) than at DEU sites (0.28 ± 0.26). The proportion of days with true-positive detections was also higher for DBF at TCP Sites (0.82 ± 0.27) than at DEU Sites (0.44 ± 0.26).
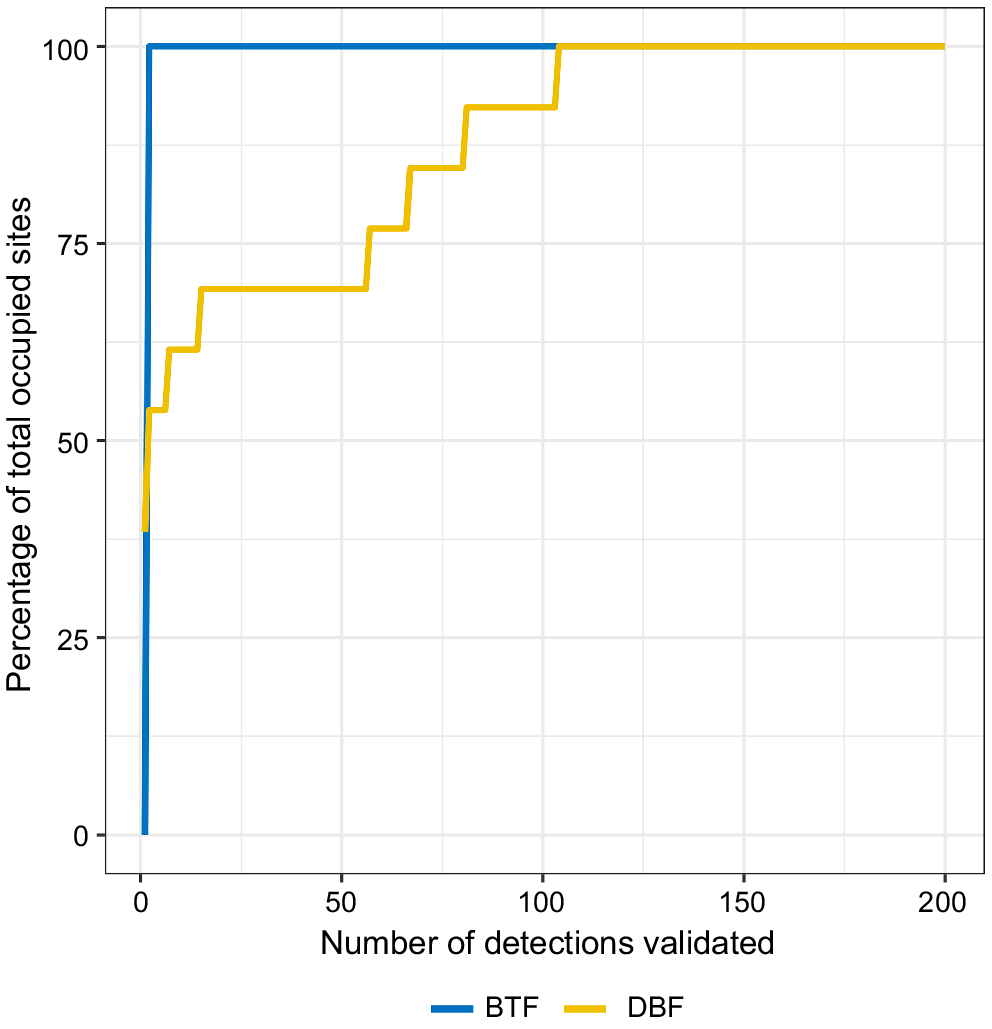
True-positive vocalisations for both species, if present, were always amongst the highest confidence scores output from their respective models (Figs S2 and S3), with the number of occupied sites identified plateauing well within the validation effort for both species (i.e. most occupied sites were identified very early in the validation process; Fig. 6). In fact, BTFS site presence for both TCP and DEU bioregions were the same when labelling the top 200 detections as when labelling only the top five detections (Fig. 6). Similarly for DBF, most occupied sites required little validation effort, however, we still identified some occupied sites at ~100 validations as these locations had many false-positive vocalisations with high model confidence scores (Figs 6 and S3).
The percentage of total occupied sites identified by validation effort (i.e. the number of model detections validated) for the southern black-throated finch (BTFS, blue), and the double-barred finch (DBF, yellow).
To determine whether the call recognisers missed any vocalisations of the two target species, a random selection of two 2-min audio segments were selected from each survey day at each site and manually inspected (>7 h of audio). No vocalisations from either target species were detected at any locations that had not already had true-positive detections amongst the top 200 detections from the respective CNN models.
Misclassifications
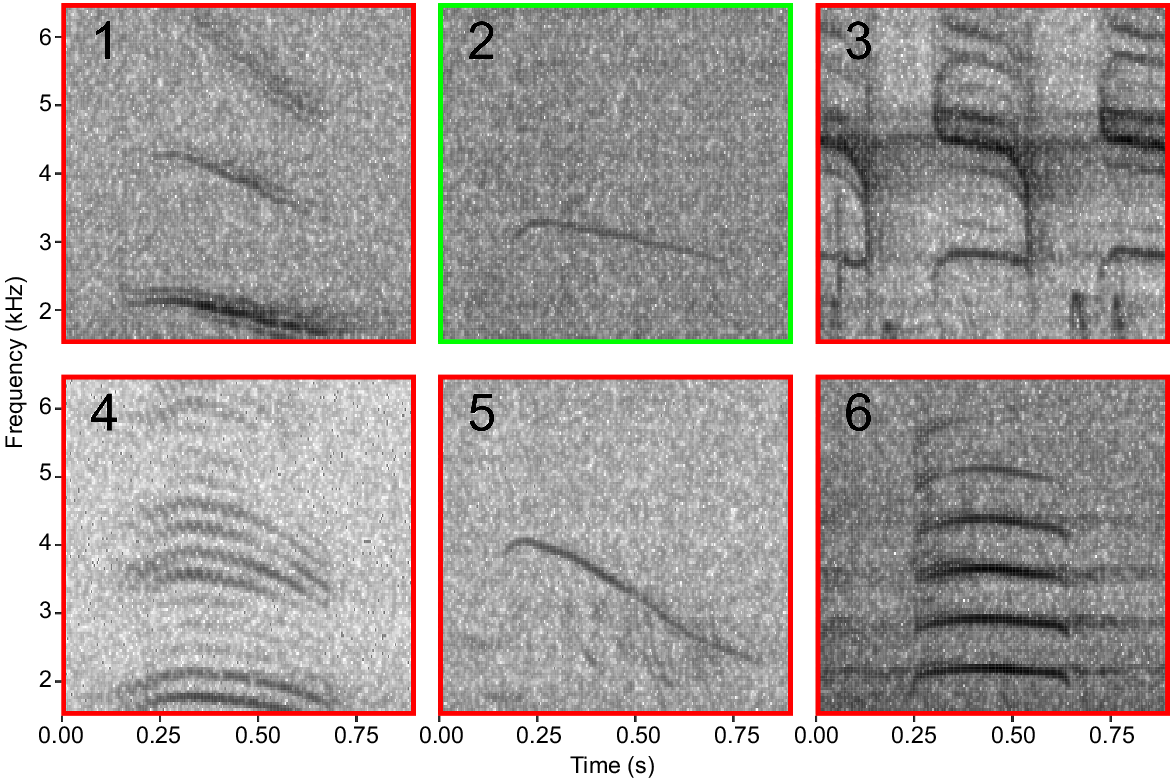
While validating the top detections from each species model, consistent sources of misidentification were identified for potential use in training future iterations of the models. Many incorrect detections of BTFS were other bird species with similar shaped vocalisations such as Australian magpie, magpie-lark, Australian raven, and double-barred finch (Fig. 7). The case was similar for DBF, with Australian raven and red-tailed black cockatoo vocalisations being the most common misclassifications.
Discussion
We used passive acoustic recorders and developed CNN-based call recognisers to survey for the endangered southern subspecies of the black-throated finch (Poephila cincta cincta), and the double-barred finch (Taeniopygia bichenovii). We achieved high classification performance on test datasets and were able to locate new sites occupied by the species in subsequent years, using passive acoustic recorders and minimal manual verification. We found strong agreement between site occupancy determined with our call recogniser and manual bird surveys, showing that CNN-based recognisers can be used successfully for detecting vocalisations of a rare and endangered bird. Deployments of acoustic recorders for longer periods and at more sites represent a manageable way to survey for the black-throated finch effectively, aiding in the conservation of this endangered species.
Even though our recognisers had high performance on test datasets and a strong correlation between the number of detections and the number of actual vocalisations, manual verification of recogniser output was still required to accurately determine site presence at the new locations surveyed. For example, while the site with the most true-positive black-throated finch detections was also the site with the highest number of raw detections, the site with the second highest number of raw detections did not have any true-positive black-throated finch vocalisations. A combination of automated and manual analysis of acoustic monitoring data is still a very common method employed, as highly accurate call recognition remains difficult in many systems (Sugai et al. 2019). Manual verification of recogniser output may be particularly needed when being deployed to new locations outside the original training domain (Eichinski et al. 2022), with further refinement necessary if confidence that the number of detections accurately represents the number of target vocalisations is required.
Despite most survey periods returning apparent black-throated finch detections that turned out to be false-positives, these were quite low in number, and it is encouraging that only a minimal amount of post-validation was required to verify true-positive vocalisations during the two survey periods that also had confirmed visual sightings during manual surveys. Even a low false-positive rate would result in false-positives being much more numerous than true-positives for a rare species like black-throated finch when analysing a large amount of audio recordings. The manual verification of the top 200 detections per site for all 3 years of recordings took only ~8 h for both species, representing an almost 250-fold reduction in time compared to manual listening of the entire audio dataset. This is also significantly more cost-effective than sending paid experts to survey locations to conduct manual bird surveys. The deployment durations used in this study were relatively short (<2 weeks), and longer deployments as part of a dedicated monitoring program would provide increased ability to detect the presence of the black-throated finch as they move around the environment. While they are generally considered sedentary, their seasonal home range (50.8 ha) is much larger than the area captured by audio recorders, and they are known to make occasional long-distance movements (>15 km) as resource availability changes (Rechetelo et al. 2016). The semi-automated approach presented here opens the possibility to survey for the black-throated finch at greater temporal and spatial scales, improving our ability to monitor this endangered species.
Site occupancy of the more common double-barred finch was largely the same between manual surveys and the acoustic recogniser after post-validation. Double-barred finches were successfully detected using the acoustic recogniser for all surveys with a corresponding manual survey detection, including for one survey which only had manual detections in the transect survey. However, for a few survey periods, post-validation of up to 100 detections was required before a true-positive vocalisation was found. Double-barred finches were also correctly detected from audio recordings in four survey periods that had no detections from manual surveys, suggesting the longer temporal period sampled with acoustic recordings over manual surveys increases the likelihood of detecting presence, even on the short recorder deployment times used in this study. However, it should be noted that equipment failure resulted in a lack of audio data for analysis during two surveys periods that had double-barred finch detections from manual surveys.
The proportion of days with true-positive detections of both species was lower at the new deployment locations (Desert Uplands bioregion) than at the sites in the region used for training the recognisers (Townsville Coastal Plains bioregion). Our recognisers may have reduced performance when deployed at locations that were outside the training domain. The reduction in performance may be due to the presence of non-target species in the new locations that cause false-positives, differences in the behaviour of our target species, or simply reflect lower abundances in these environments. Indeed, three of the five commonly misclassified species were more common in DEU sites than TCP sites. In addition, bird species richness was ~33% higher at DEU sites than TCP sites with an average of 10 more species. These differences in the bird community between the training locations and the deployment locations may be a cause of the apparent lower performance of the recognisers. There are several potential changes to our recognisers that may improve performance. The training data used for both species came from a set of recordings that were both limited in spatial scale (i.e. four sites) and temporal scale (i.e. 2 weeks). Therefore, it is not unexpected that recogniser performance would decrease when applying it to recordings from a new location and at different times of year. New locations will have different soundscapes due to different vocal fauna and environmental conditions (wind, tree cover, etc.). These soundscape differences may reduce the ability of the models to generalise effectively to new environments (Lauha et al. 2022). Improvements could be made by including a few recordings from the new location in the training data (Lasseck 2019), particularly if there are plans to survey these locations over a long period of time.
The negative examples used to train models for both species were selected randomly from amongst all unlabelled audio for the respective target species. Therefore, another way to improve recogniser performance may be to target the common sources of error encountered when deploying the recogniser to improve CNN performance in future iterations. Given that most misclassifications encountered during post-validation at the new locations were of other bird species with similarities in the shape of their vocalisations when viewed on a spectrogram, adding examples of these misclassifications to the training data for future iterations would likely lead to recogniser improvements. This iterative process of recogniser development may be particularly important when attempting to use a recogniser developed using data from one location at another location (Eichinski et al. 2022).
Increased information on the distribution and population trends of the southern black-throated finch have been highlighted as key research priorities to aid in the conservation of the species (Mula Laguna et al. 2019). The call recogniser developed and tested here provides a critical first step for helping provide this information using acoustic monitoring techniques that should allow increased temporal and spatial resolution of survey efforts to help complement other more established survey techniques.
Conclusion
Here we present an approach for surveying the endangered southern black-throated finch using audio recordings that successfully detected vocalisations at two new locations at the edge of their range. This method will be useful for surveying new locations for black-throated finch presence as audio recorders can be deployed for long periods of time and analysed with less human effort required than traditional bird surveys. We expect that further improvements to these recognisers could be made by adding misclassified examples to the training data, particularly those of bird species with similar shapes to their calls. An effective recogniser for this species will allow monitoring at large temporal and spatial scales with relatively low investment, allowing assessment of habitat characteristics associated with presence, as well as detecting temporal trends in occupancy and distribution, both of which provide useful information to help inform on-ground management efforts.
Data availability
Audio recordings are available at https://www.ecosounds.org/projects/1134. Scripts and final models are available at https://github.com/Slade-AA/Black-throatedFinchRecogniser.
Declaration of funding
This research was supported by Department of Transport and Main Roads, and Lendlease.
Acknowledgements
We thank Sushmita Mukherji, Tom Bruce, and Daniel González-Paredes for help with conducting bird surveys, and Corryn Porteus, Kelsey Griffith, and Jaimie Hopkins for help with labelling vocalisations. This study was conducted under permission of Animal Ethics at James Cook University (permit numbers A2547 and A2434).
References
Allaire JJ, Chollet F (2020) Keras: R interface to ‘keras’. Available at https://CRAN.R-project.org/package=keras
Allaire JJ, Tang Y (2020) Tensorflow: R interface to ‘tensorflow’. Available at https://CRAN.R-project.org/package=tensorflow
Barnosky AD, Matzke N, Tomiya S, Wogan GOU, Swartz B, Quental TB, Marshall C, McGuire JL, Lindsey EL, Maguire KC, Mersey B, Ferrer EA (2011) Has the Earth’s sixth mass extinction already arrived? Nature 471, 51-57.
| Crossref | Google Scholar | PubMed |
Buda M, Maki A, Mazurowski MA (2018) A systematic study of the class imbalance problem in convolutional neural networks. Neural Networks 106, 249-259.
| Crossref | Google Scholar | PubMed |
Ceballos G, Ehrlich PR, Raven PH (2020) Vertebrates on the brink as indicators of biological annihilation and the sixth mass extinction. Proceedings of the National Academy of Sciences 117, 13596-13602.
| Crossref | Google Scholar |
Crump PS, Houlahan J (2017) Designing better frog call recognition models. Ecology and Evolution 7, 3087-3099.
| Crossref | Google Scholar | PubMed |
Darras K, Batáry P, Furnas BJ, Grass I, Mulyani YA, Tscharntke T (2019) Autonomous sound recording outperforms human observation for sampling birds: a systematic map and user guide. Ecological Applications 29, e01954.
| Crossref | Google Scholar | PubMed |
Digby A, Towsey M, Bell BD, Teal PD (2013) A practical comparison of manual and autonomous methods for acoustic monitoring. Methods in Ecology and Evolution 4, 675-683.
| Crossref | Google Scholar |
Eichinski P, Alexander C, Roe P, Parsons S, Fuller S (2022) A convolutional neural network bird species recognizer built from little data by iteratively training, detecting, and labeling. Frontiers in Ecology and Evolution 10, 810330.
| Crossref | Google Scholar |
Gaston KJ, Rodrigues ASL (2003) Reserve selection in regions with poor biological data. Conservation Biology 17, 188-195.
| Crossref | Google Scholar |
Gibb R, Browning E, Glover-Kapfer P, Jones KE (2019) Emerging opportunities and challenges for passive acoustics in ecological assessment and monitoring. Methods in Ecology and Evolution 10, 169-185.
| Crossref | Google Scholar |
Grand J, Cummings MP, Rebelo TG, Ricketts TH, Neel MC (2007) Biased data reduce efficiency and effectiveness of conservation reserve networks. Ecology Letters 10, 364-374.
| Crossref | Google Scholar | PubMed |
Kahl S, Wood CM, Eibl M, Klinck H (2021) BirdNET: a deep learning solution for avian diversity monitoring. Ecological Informatics 61, 101236.
| Crossref | Google Scholar |
Lasseck M (2019) Bird species identification in soundscapes. CLEF (Working Notes) 2380,.
| Google Scholar |
Lauha P, Somervuo P, Lehikoinen P, Geres L, Richter T, Seibold S, Ovaskainen O (2022) Domain-specific neural networks improve automated bird sound recognition already with small amount of local data. Methods in Ecology and Evolution 13, 2799-2810.
| Crossref | Google Scholar |
Lemen C, Freeman PW, White JA, Andersen BR (2015) The problem of low agreement among automated identification programs for acoustical surveys of bats. Western North American Naturalist 75, 218-225.
| Crossref | Google Scholar |
Lewy D, Mańdziuk J (2023) An overview of mixing augmentation methods and augmentation strategies. Artificial Intelligence Review 56, 2111-2169.
| Crossref | Google Scholar |
Mula Laguna J, Reside AE, Kutt A, Grice AC, Buosi P, Vanderduys EP, Taylor M, Schwarzkopf L (2019) Conserving the endangered black-throated finch southern subspecies: what do we need to know? Emu - Austral Ornithology 119, 331-345.
| Crossref | Google Scholar |
Pérez-Granados C, Traba J (2021) Estimating bird density using passive acoustic monitoring: a review of methods and suggestions for further research. Ibis 163, 765-783.
| Crossref | Google Scholar |
Priyadarshani N, Marsland S, Castro I (2018) Automated birdsong recognition in complex acoustic environments: a review. Journal of Avian Biology 49, jav-01447.
| Crossref | Google Scholar |
Rechetelo J, Grice A, Reside AE, Hardesty BD, Moloney J (2016) Movement patterns, home range size and habitat selection of an endangered resource tracking species, the black-throated finch (Poephila cincta cincta). PLoS ONE 11, e0167254.
| Crossref | Google Scholar | PubMed |
Reside AE, Cosgrove AJ, Pointon R, Trezise J, Watson JEM, Maron M (2019) How to send a finch extinct. Environmental Science & Policy 94, 163-173.
| Crossref | Google Scholar |
Rocha LHS, Ferreira LS, Paula BC, Rodrigues FHG, Sousa-Lima RS (2015) An evaluation of manual and automated methods for detecting sounds of maned wolves (Chrysocyon brachyurus illiger 1815). Bioacoustics 24, 185-198.
| Crossref | Google Scholar |
Ruff ZJ, Lesmeister DB, Duchac LS, Padmaraju BK, Sullivan CM (2020) Automated identification of avian vocalizations with deep convolutional neural networks. Remote Sensing in Ecology and Conservation 6, 79-92.
| Crossref | Google Scholar |
Schroeder KM, McRae SB (2020) Automated auditory detection of a rare, secretive marsh bird with infrequent and acoustically indistinct vocalizations. Ibis 162, 1033-1046.
| Crossref | Google Scholar |
Schwarzkopf L, Roe P, Mcdonald PG, Watson DM, Fuller RA, Allen-Ankins S (2023) Can an acoustic observatory contribute to the conservation of threatened species? Austral Ecology 48, 1230-1237.
| Crossref | Google Scholar |
Stowell D, Wood MD, Pamuła H, Stylianou Y, Glotin H (2019) Automatic acoustic detection of birds through deep learning: the first bird audio detection challenge. Methods in Ecology and Evolution 10, 368-380.
| Crossref | Google Scholar |
Sueur J, Aubin T, Simonis C (2008) Seewave, a free modular tool for sound analysis and synthesis. Bioacoustics 18, 213-226.
| Crossref | Google Scholar |
Sugai LSM, Silva TSF, Ribeiro JW, Jr, Llusia D (2019) Terrestrial passive acoustic monitoring: review and perspectives. BioScience 69, 15-25.
| Crossref | Google Scholar |
Sugai LSM, Desjonquères C, Silva TSF, Llusia D (2020) A roadmap for survey designs in terrestrial acoustic monitoring. Remote Sensing in Ecology and Conservation 6, 220-235.
| Crossref | Google Scholar |
Teixeira D, Linke S, Hill R, Maron M, van Rensburg BJ (2022) Fledge or fail: nest monitoring of endangered black-cockatoos using bioacoustics and open-source call recognition. Ecological Informatics 69, 101656.
| Crossref | Google Scholar |
Vanderduys EP, Reside AE, Grice A, Rechetelo J (2016) Addressing potential cumulative impacts of development on threatened species: the case of the endangered black-throated finch. PLoS ONE 11, e0148485.
| Crossref | Google Scholar | PubMed |
Venier LA, Holmes SB, Holborn GW, Mcilwrick KA, Brown G (2012) Evaluation of an automated recording device for monitoring forest birds. Wildlife Society Bulletin 36, 30-39.
| Crossref | Google Scholar |
Waddle JH, Thigpen TF, Glorioso BM (2009) Efficacy of automatic vocalization recognition software for anuran monitoring. Herpetological Conservation and Biology 4, 384-388.
| Google Scholar |