

Analysis of soil erosion dynamics and its driving factors in the Qilian Mountains of Qingdong
Mingyuan Li A # , Xiaohuang Liu B C # , Jianli Ding A * , Wenbo Zhang B C , Ran Wang B C , Xinping Luo B C , Liyuan Xing B C , Chao Wang C and Honghui Zhao C
A
B
C
Handling Editor: Abdul Mouazen
Abstract
The conservation of soil and water has become an important foundational project of worldwide social and economic development in the 21st century, especially for the protection and development of critical ecological function areas in Western China.
To clarify the current status of soil erosion and its drivers in the alpine temperate forest-grass subregion of Qilian Mountains in Qingdong (ATFSQMQ).
Based on GIS technology, the Universal Soil Loss Model (RUSLE) and Geographical detector were used to simulate the extent of soil erosion and assess the drivers of soil erosion in the ATFSQMQ from 2001 to 2020, and the Patch-generating Land Use Simulation (PLUS) model and Coupled Model Intercomparison Project Phase 6 (CMIP6) model were used to predict the future soil erosion in the study area.
(1) The soil erosion modulus of the ATFSQMQ decreased going from northwest to southeast, and soil erosion increased during the 2001–2020 period, and the average soil erosion modulus increasingly fluctuated. (2) Micro-erosion is the main form of soil erosion; from 2001 to 2020, regions with micro-erosion and mild erosion decreased, while those with moderate, strong, solid, and severe erosion increased slightly. (3) Vegetation cover is the dominant factor affecting soil erosion, and the synergistic effect of vegetation cover and precipitation has the highest explanatory power.
The soil erosion modulus fluctuated and increased from 2001 to 2020, but will gradually improve in the future.
The analyses in this paper can shed light on the current state of soil erosion and the drivers behind it, enabling the government to target soil erosion area management.
Keywords: CMIP6, driving factors, geographical detector, PLUS model, Qingdong Qilian mountains, RUSLE model, soil erosion, spatio-temporal analysis.
Introduction
Soil erosion involves the detachment or destruction of soil and its parent material at the soil surface, followed by transportation and subsequent deposition under the influence of external forces such as water, wind, and gravity (Liu et al. 2018). China is one of the countries with the most severe soil erosion rates. According to the ‘National Soil and Water Conservation Bulletin (2021)’ (Ministry of Water Resources of the People’s Republic of China 2021), a total of 267.42 × 10⁴ km2 of China’s land has undergone soil erosion, accounting for 28.21% of the entire mainland area. Soil erosion can lead to various environmental problems, such as soil fertility declines, aridification, sedimentation in rivers leading to an increased risk of flooding, and crop yield declines (Oldeman et al. 1991). Therefore, investigation of soil erosion and its dynamic monitoring are significant and crucial for effective regional soil and water conservation and ecological environment protection.
Measuring soil erosion has always been a core issue in soil erosion research. Yet, currently, soil erosion modelling is an effective approach for estimating and predicting rates of soil erosion (Zhang et al. 2023a). The existing soil erosion models may be classified into two main categories: physical, empirical (Zhou and Zhou 2004). The physical model has trouble quantifying some parameters in a given study area, and it is difficult to ensure the accuracy of its results. The empirical model is widely used because of its robust applicability and high simulation accuracy (Qin et al. 2018). In this model, the modified Universal Soil Loss Equation (RUSLE model) is commonly applied in related research in China and abroad because of its high precision, wide application range, and strong manoeuvrability (Ostovari et al. 2017; Bircher et al. 2022; Räsänen et al. 2023). In China, the RUSLE model has been applied to the upper reaches of the Yellow River Basin (Li et al. 2022a) and the Tibetan Plateau (Teng et al. 2018; Yang et al. 2018) as well as other typical regions, yielding excellent results. It has the advantages of high precision and fast data processing (Liang et al. 2021). Currently, scenario simulation of soil erosion trends under climate change is a pressing research issue (Shi et al. 2020). By coupling erosion models with land use simulation models, a more comprehensive and accurate simulation of soil erosion trends can be achieved. The Patch-generating Land Use Simulation (PLUS) model is a new model (Liang et al. 2021) developed based on traditional land use simulation models, such as the FLUS and CA-Markov models.
The alpine temperate forest-grass subregion of Qilian Mountains in Qingdong (ATFSQMQ), which includes Qilian Mountain National Park, Sanjiangyuan National Park, as well as some areas of the Zoige grassland-wetland, is a crucial segment of the Qinghai-Tibet Plateau’s ecological shield zone. This subregion is designated as a significant area within China’s overarching strategic plan for the conservation and rehabilitation of vital ecosystems. The vegetation types in this expansive study area consist mostly of alpine meadow and alpine grassland, but the resilience of these ecosystems is poor (Zhang et al. 2019). With human population growth and associated socio-economic trends, there has been a gradual increase in development and construction projects in the ATFSQMQ. Various human activities have destroyed many excellent pastures and natural vegetation, to varying degrees, rendering the study area’s soil and water conservation capacity in a state of decline. At present, existing research on soil erosion has only focused on small areas, such as the Qilian Mountains (Chen et al. 2020; Peng et al. 2022; Tong et al. 2022), Zoige Wetland (Wang et al. 2011), and Longwu West Mountain (Wu 2021). There are surprisingly few studies on soil erosion covering the entire alpine temperate forest and grass area in Northwest China, and the research published so far mainly analyses the influence of single factors upon the soil erosion process, leaving the influence of multiple factors and their interactions relatively understudied. Therefore, this paper aimed to analyse the distribution pattern of soil erosion in the ATFSQMQ, over a recent 20-year period (from 2001 to 2020), by applying the RUSLE model. The second objective was to explore the driving factors behind soil erosion in the study area by using Geographical detector (Chen et al. 2024) and to predict its soil erosion intensity in future years (2025, 2030, and 2050) by combining the PLUS and Coupled Model Intercomparison Project Phase 6 (CMIP6) models (Eyring et al. 2016). The findings will provide much-needed scientific support for improving soil erosion management and governmental decision-making in the study area.
Study area and data sources
Study area
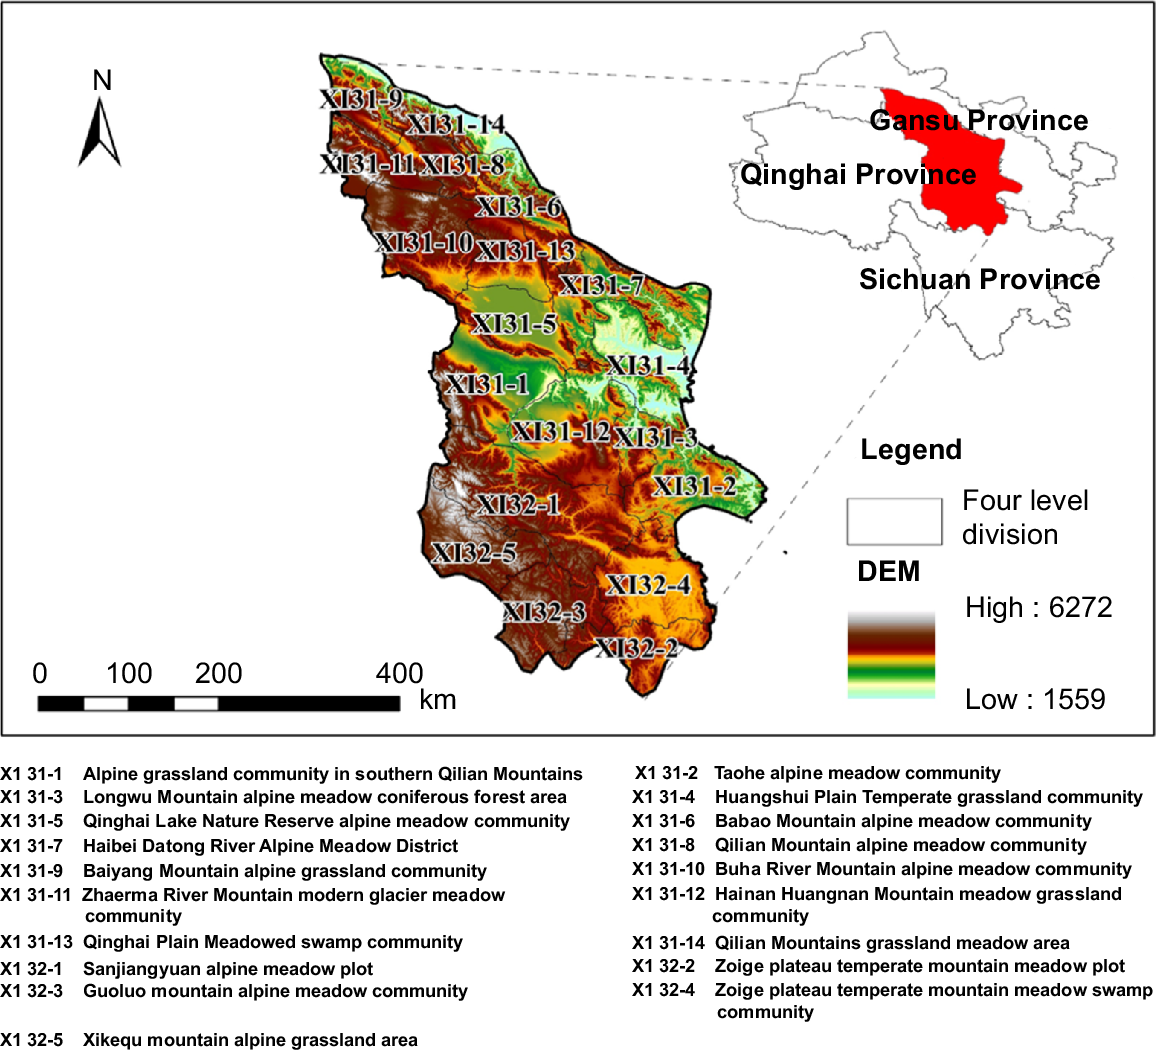
This paper’s study area is based on the secondary zoning done by Zhang et al. (2020) according to the rule of territorial differentiation of natural resources (Zhang et al. 2020). The ATFSQMQ is located in the alpine altitude section and includes the Qilian Mountains, Golog Mountains, and other mountain ranges in the region, whose terrain is complex and generally high in the west and low in the east. Geographically, the study area lies between 32°20′−39°52′N and 96°52′−104°00′E, covering ~235,000 km2 at an average elevation of 3642 m (Fig. 1), where two major lakes can be found, Qinghai Lake and Lake Harra. Average annual temperature ranges from −12.8°C to 9.7°C and annual precipitation is between 100 and 800 mm; the latter is decreasing from south to north. Soil types here mainly include alpine desert soil, alpine meadow soil, and alpine grassland soil, among others. The vegetation is dense, mostly alpine meadow and alpine grassland. The study area was divided into 19 fourth-level natural divisions, whose specific distribution is shown in Fig. 1 below.
Data sources
The data in this study comprised six parts: precipitation, Normalised Difference Vegetation Index (NDVI), land use, soil properties, Digital Elevation Model (DEM), and CMIP6 future precipitation. (1) Precipitation data were obtained from the National Tibetan Plateau Science Data Center, by downloading the monthly values for 2001–2020 from China’s 1-km resolution month-by-month precipitation dataset (Peng 2020). (2) The vegetation cover index (NDVI) data were obtained from the National Earth System Science Data Center (http://www.geodata.cn/), by downloading the 1-km resolution month-by-month NDVI dataset of China (2001–2020); this was synthesised on a monthly basis from MODIS data for monthly maximum values from January 2001 to December 2020. (3) Land use data were obtained from the China District 1990–2020 year-by-year 30-m resolution land use classification dataset, downloaded for the period 2001–2020 (Yang and Huang 2021). (4) The soil attribute data, obtained from the Harmonised World Soil Database (HWSD), have an original resolution of 1000 m, downloaded from the National Tibetan Plateau Scientific Data Center (http://data.tpdc.ac.cn/) (He 2019). (5) The digital elevation model (DEM) data, specifically the SRTMDEM with a 90-m resolution, were accessed from the geospatial data cloud platform. (http://www.gscloud.cn/). (6) Future precipitation data came from the SSP245 scenario MRI-ESM2.0 climate precipitation data for 2020, 2030, and 2050; this was downloaded from the National Tibetan Plateau Science Data Center’s (NTPSDC) 1-km resolution multi-scenario multi-model month-by-month precipitation dataset for China for 2021–2100 (Peng 2022).
Methods
Soil erosion model: RUSLE
We employed the RUSLE model, which can predict the soil erosion rate for a defined area, to study the intensity of this process for the ATFSQMQ. In our analysis, we resampled the remote sensing products in ArcGIS to a uniform resolution of 1000 m, which is the lowest resolution among the products used.
In Eqn 1, A is the soil erosion modulus (t/(km2 a); R is the precipitation erosivity factor, expressed in units of MJ mm·(km2 h)−1; K is the soil erodibility factor, expressed in units of (t km2 h)·(MJ km2 mm)−1; C is the cover-management factor; P is the support practice factor; L is the slope length factor; and, S is the slope factor.
The precipitation erosivity factor R mainly conveys the potential capacity of soil loss caused by rainfall. In this paper, R is estimated from annual rainfall totals, using the equation established by Zhang and Fu (2003):
where P is the average annual rainfall (mm) and R is the average multi-year precipitation erosivity force.
Soil erodibility factor K is mainly an index to assess soil erosion resistance. It is typically used to reflect how sensitive soil is to erosion. For the K-value calculation, the EPIC algorithm was run in this paper (Zhang et al. 2007).
In the above Eqns 3 and 4, SAN refers to the soil sand content in the 0–30-cm depth layer (%); CLA is the soil clay content in the top 0–30 cm (%); SIL denotes the soil silt content within the 0–30-cm layer (%); C represents the soil organic carbon content for the 0–30-cm soil profile; and SN1 represents the soil structure factor.
The vegetation cover factor C is the ratio of soil erosion under a particular crop or vegetation cover to that occurring on continuous bare fallow land (under the same conditions as other factors). This factor can express the effect of vegetation cover and management practices for mitigating or inhibiting soil erosion. Here, vegetation cover was calculated using the image element dichotomous model established by Wang et al. (2011). The linear composite image element decomposition method, as proposed by Cai et al. (2000), predicts the vegetation cover factor according to the following:
In the above two Eqns 5 and 6, NDVI refers to the actual Normalised Difference Vegetation Index values observed, NDVIsoil represents the NDVI values of pure bare soil pixels, while NDVIveg denotes the NDVI values of pixels that are entirely covered by vegetation, fc denotes vegetation coverage while C is the vegetation cover and management factor.
The soil and water conservation measure factor P refers to the ratio of the total soil erosion volume when certain soil and water conservation measures are implemented to the total soil erosion volume when no soil and water conservation measures are implemented, under the condition that other factors remain the same. Based on the summarised work of Tian et al. (2007) combined with pertinent land use information, the value of P corresponding to each land use type included in the study area was determined (Table 1).
L is the slope length factor, defined as a power function of slope length, while S is the slope steepness factor, this indicating the slope degree of a point on the ground surface. Here, methods of the national standard topographic factor calculation and the fourth National Soil Erosion Census Technical Regulations were used (Soil Conservation Monitoring Center 2009).
In the above Eqns 7–9, the S is the slope factor; L is the slope length factor; n is the slope length index, dimensionless; λ is the slope length (m); θ is the slope degree (°). Slope and Flow Length in ArcGIS was utilised to calculate the slope and slope length of the DEM, then substituted into Eqns 7–9 for calculation.
Geographical detector
Geographical detector is a new spatial analysis model developed by Wang et al. (2010) and which can be used to clarify the driving factors behind a pattern or process by detecting the spatial stratification heterogeneity of elements. It consists of four detectors: factor detector, interaction detector, risk detector, and ecological detector. In the present study, factor detector could be used to explore whether a certain influencing factor is the main cause of soil erosion, for which the degree of differentiation is inferred from the corresponding q-value. Interaction detector can explore the synergistic effects of influencing factors on soil erosion. Risk detector can determine whether there are significant differences between different layers of a single influencing factor, which could be used to identify high-risk areas of soil erosion. Ecological detector is able to compare two influencing factors to see whether their spatial distributions are significantly different.
In the above Eqn 10, the q represents the explanatory power of a factor; N denotes the dependent variable of soil erosion or the stratification of influencing factors; Ah refers to the number of units within stratum h; is the variance of stratum h; A is the total number of units; and σ2 is the variance of the study area. Geographical detector software conducts significance testing on the q value to determine if the impact of factors on the dependent variable is statistically significant, thereby differentiating the factors that truly influence the outcomes from mere random fluctuations.
In this paper, four categories of influencing factors are tested: vegetation cover, elevation, slope, and precipitation. Vegetation cover is categorised into five classes using an equal-interval classification method: 0–0.1, 0.1–0.25, 0.25–0.5, 0.5–0.75, and 0.75–1. Elevation is categorised into four classes using the method of natural breaks: <2600, 2600–3600, 3600–4600, and >4600 m. Slope is categorised into six classes according to the classification by Wang et al. (2018): 0–5°, 5–10°, 10–15°, 15–25°, 25–35°, and >35°. Finally, precipitation is divided into seven classes using an equal-interval classification method: <200, 200–300, 300–400, 400–500, 500–600, 600–700, and 700–807 mm.
PLUS model
The PLUS model is a new model based on the FLUS model. It integrates two modules: a rule-mining method based on land expansion analysis, and a cellular automata (CA) model running a multi-type random seed mechanism. PLUS can provide a better explanation for influencing factors of various land use changes and higher accuracy of simulation results. To do that, it uses the random forest to sample the land use expansion area to obtain the probability of each type of land use arising, via the spatial characteristics of each type of land expansion part and driving factors between the land use data of two different periods. Specifically, the selection of the 2010 and 2020 periods for our study is scientifically justified based on the representativeness and availability of the data, which captures a period of rapid land use change in China. The final land use type is determined by combining it with the CA model of multiple, random patch seeds (Liang et al. 2021).
CA-Markov model
The Markov model is a well-established prediction method that relies on the current state to predict the next state. It is a random motion law of state change, accidentally discovered by Russian mathematician A. A. Markov when studying Brownian motion. The PLUS model is based on this concept, and utilised to predict future land use types by considering the transitions based on the current state of the land use pattern.
In the Eqn 11 above, the notation of i, j = 1, 2.., n represents the land use types before and after their transfer, respectively; pij is the land use area transfer probability matrix.
Results
Temporal variation in soil erosion
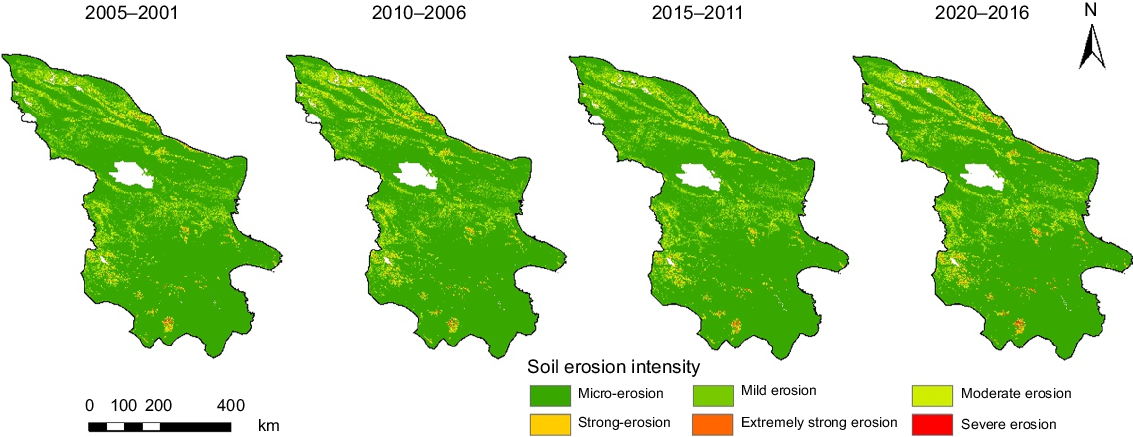
The soil erosion intensity in the study area was graded following the SL190-2007 ‘Soil Erosion Classification and Grading Standard’ and divided into six levels (micro-degree, mild, moderate, strong, extreme strong, and severe erosion) according to the erosion type area of the Northwest Loess Plateau. These levels are delineated as follows: micro-degree erosion with an annual soil loss rate of less than 1000 t/(km2 a), mild erosion ranging from 1000 to 2500 t/(km2 a), moderate erosion between 2500 and 5000 t/(km2 a), strong erosion falling within the 5000–8000 t/(km2 a) range, extreme strong erosion with a rate of 8000–15,000 t/(km2 a), and severe erosion indicating a rate above 15,000 t/(km2 a). According to the RUSLE model, the average soil erosion intensity of the study area in 2001–2005, 2006–2010, 2011–2015, and 2016–2020 was calculated (Fig. 2). Evidently, from the distribution of soil erosion intensity in those four periods, the micro-erosion and mild erosion areas in the study area were the most widely occurring, most of these concentrated at <4000 m a.s.l. The combined regions of moderate and strong erosion accounted for ~7% of the entire study area, with most of these found in its the northern, central, and southwestern parts. The extreme strong and severe erosion regions together accounted for 0.3% of the entire study area, these mainly concentrated in high-altitude zones such as the Qilian Mountains and Guoluo Mountains.
Classification of soil erosion intensity in the alpine temperate forest-grass subregion of Qilian Mountains in Qingdong during 2001–2020.
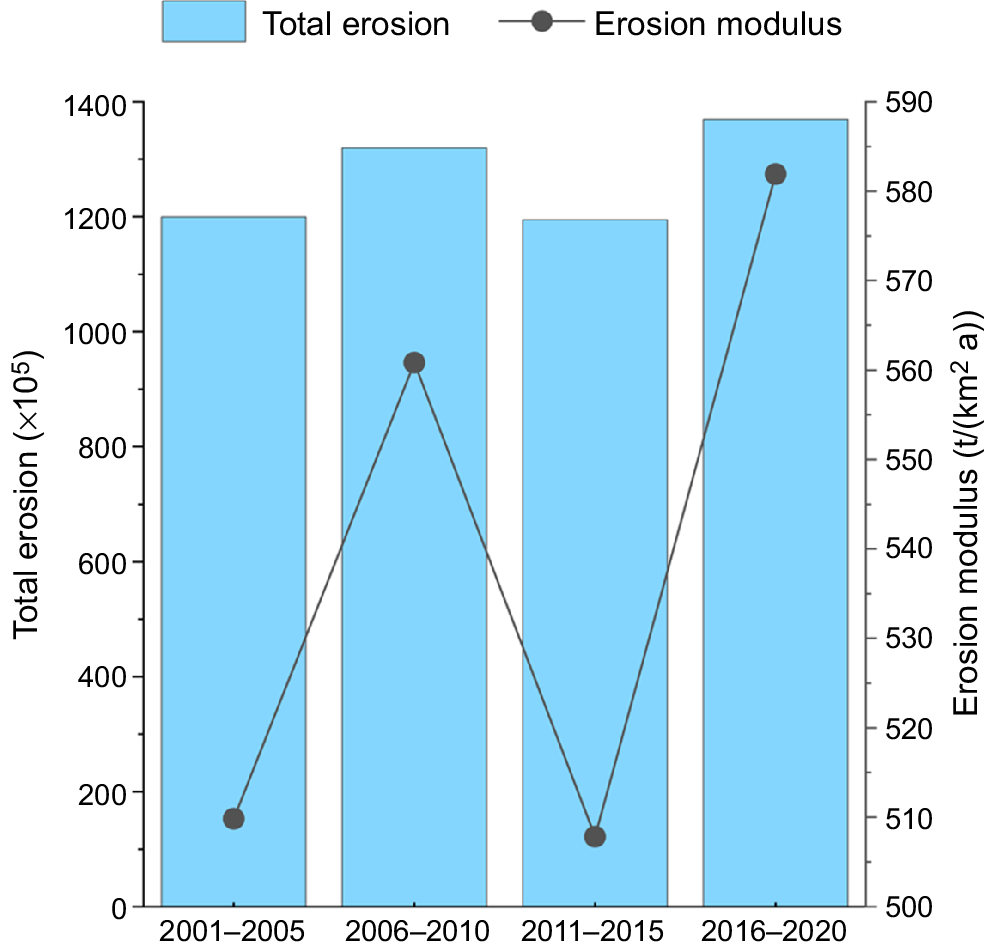
The changes in total erosion and erosion modulus in Fig. 3 show that the annual average total erosion in the ATFSQMQ for the periods 2001–2005, 2006–2010, 2011–2015, and 2016–2020 were 1200.53, 1320.59, 1195.82, and 1370.23 × 105 t/a, respectively. Over the 20-year span, there was a cumulative increase in total erosion of 169.70 × 10⁵ t. The mean erosion modulus values were 509.85, 560.83, 507.84, and 581.91 t/(km2 a) for each respective period. The comparison between the initial period (2001–2005) and the final period (2016–2020) shows an overall increase of 14.13% in the erosion modulus. However, this increase masks the variability in erosion patterns, which intensified in 2001–2010, were mitigated in 2011–2015, and then intensified again in 2016–2020. This underscores the non-linear nature of soil erosion changes in the ATFSQMQ, influenced by various environmental and anthropogenic factors.
According to the erosion intensity values’ distribution, soil erosion predominately occurred as micro-erosion (affecting 81.49% of the study area) and light erosion (10.84%), whereas the area proportions of the remaining categories were all <10%. Importantly, the intensity coverage decreases with the increase in grade, and severe erosion was found in only 0.02% of the study area. By examining the change in area of each erosion intensity (Table 2), it is evident that of micro-erosion peaked in 2010–2015 and underwent a slight decline in 2016–2020; that of mild erosion continued to decline in 2001–2020; the areas of moderate, strong, and extreme strong erosion fluctuated and generally expanded overall in 2001–2020, peaking in 2016–2020. The areas incurring severe erosion fluctuated, tending to increase in proportion during 2001–2020, reaching its lowest point in 2006–2010 and markedly increasing during 2016–2020.
| Particular period (years) | Micro-erosion (%) | Mild erosion (%) | Moderate erosion (%) | Strong erosion (%) | Extremely strong erosion (%) | Severe erosion (%) | |
|---|---|---|---|---|---|---|---|
| 2001–2005 | 81.77 | 11.42 | 5.45 | 1.11 | 0.24 | 0.01 | |
| 2006–2010 | 80.89 | 10.88 | 6.27 | 1.66 | 0.29 | 0.01 | |
| 2011–2015 | 82.21 | 10.81 | 5.47 | 1.22 | 0.27 | 0.02 | |
| 2016–2020 | 81.08 | 10.23 | 6.33 | 1.81 | 0.52 | 0.03 |
Spatial distribution of soil erosion in the fourth-level natural regionalisation
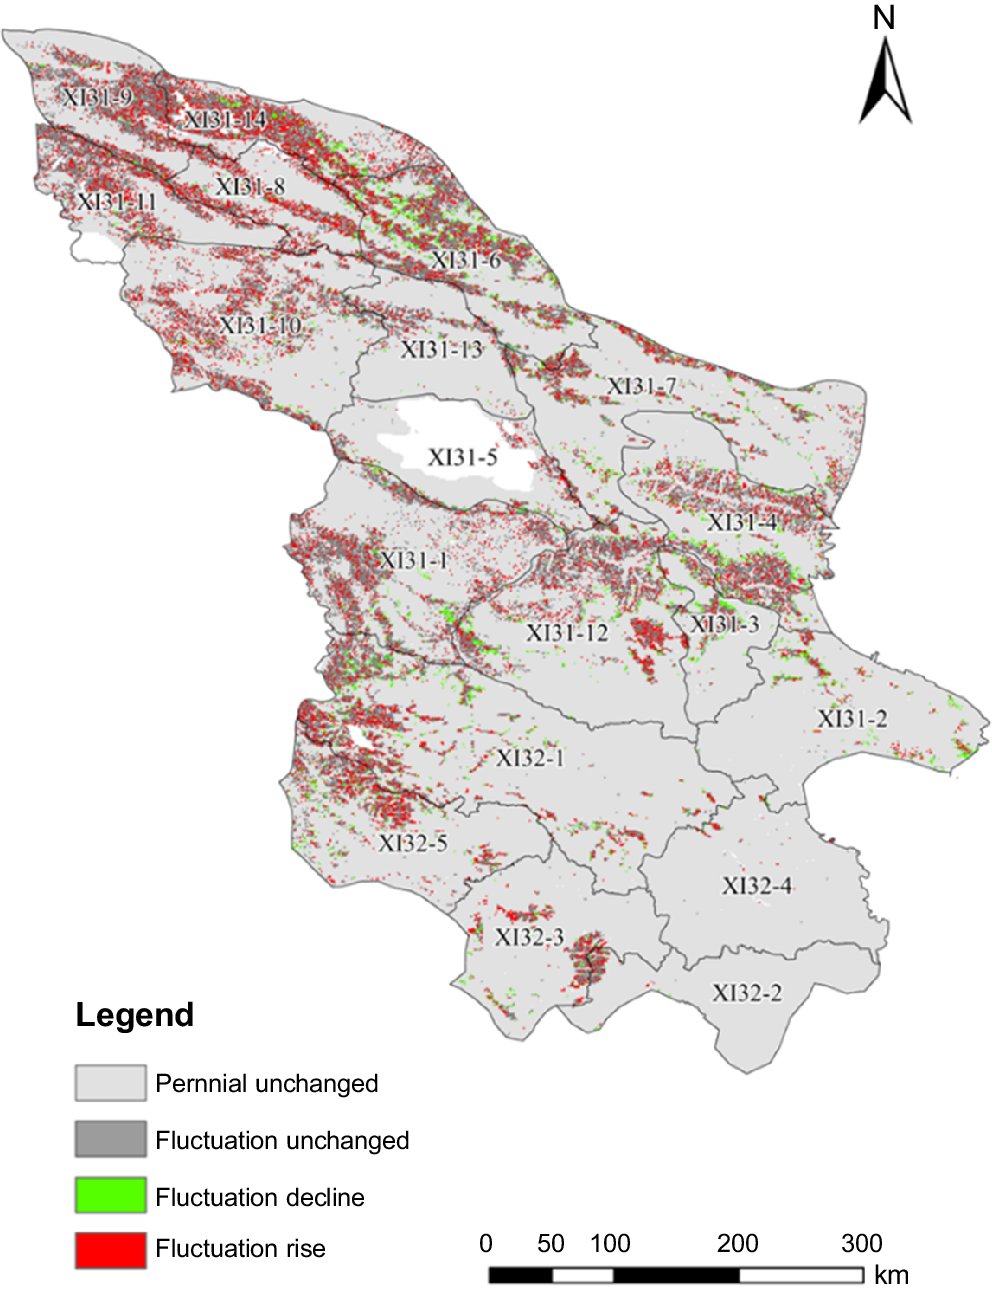
In this paper, the trends in changes to soil erosion intensity in the ATFSQMQ from 2001 to 2020 were analysed. The final results were divided into four types. First, fluctuation rise: in this pattern, soil erosion intensity undergoes fluctuations, with periods of increase and decrease; however, the overall trend is an increase in erosion intensity by the end of the study period compared to the initial state in 2001–2005). Second, perennial unchanged: This category indicates that soil erosion intensity has remained consistent throughout the study period, with no significant variations from the initial state observed in 2001–2005. Third, fluctuation unchanged: this pattern is characterised by soil erosion intensity that experiences both increases and decreases over the study period; despite these fluctuations, the final intensity at the end of 2016–2020 is equivalent to the initial intensity at the beginning of the study, indicating no net change in erosion intensity. Fourth, fluctuation decline: similar to ‘fluctuation rise’, this category also involves fluctuations in soil erosion intensity; the key difference is that the final intensity at the end of 2016–2020 is lower than the initial intensity in 2001–2005, reflecting a net decrease in erosion intensity despite the fluctuations (visualised in Fig. 4). Soil erosion was generally stable from 2001 to 2020, and the perennial unchanged area accounts for approximately 78.67% of the total area studied. A comparative analysis between Figs 2 and 4 reveals a striking congruence between the areas of perennial stability and those classified within the micro-erosion category. This alignment suggests that regions with lower erosion intensities exhibit a greater degree of stability over time. The area of the fluctuation invariant zone accounted for 13.14% of entire study area. The proportion of land characterised as fluctuation rising and fluctuation decline were 6.24% and 1.95%, respectively. These fluctuation areas, which are experiencing more substantial soil losses, demonstrate a more dynamic behaviour. This dynamism may be indicative of a higher sensitivity to environmental factors or human activities. Spatially, places where the fluctuation of soil erosion intensity increased were mainly distributed in the northwest parts of the study area (Baiyang Mountain alpine grassland community, Qilian Mountain alpine meadow community, Qilian Mountains grassland meadow area, Zhaerma River Mountain modern glacier meadow community, Buha River Mountain alpine meadow community, Babao Mountain alpine meadow community), as well as its central parts (Huangshui Plain Temperate grassland community, Hainan Huangnan Mountain meadow grassland community, alpine grassland community in the southern Qilian Mountains) and several southwest parts (Sanjiangyuan alpine meadow plot, Xikequ mountain alpine grassland area) at high elevation. The areas where the fluctuation of soil erosion intensity tends to have decreased were mostly distributed in the Qilian Mountains grassland meadow area, Babao Mountain alpine meadow community, Haibei Datong River Alpine Meadow District, Huangshui Plain Temperate grassland community, Sanjiangyuan alpine meadow plot, and Longwu Mountain alpine meadow coniferous forest area.
According to the pie charts in Fig. 5, the soil erosion intensity in each region was clearly dominated by micro-erosion. The proportion of land area under micro-erosion is largest in the Zoige plateau temperate mountain meadow swamp community, accounting for 99.43% of the total erosion area, followed by that in the Zoige plateau temperate mountain meadow plot, at 97.58%. By contrast, the proportion of micro-erosion area in the Qilian Mountains grassland meadow area is the smallest, accounting for 51.44% of the total erosion area. From the perspective of the proportion of erosion area with strong and above, that above the strong of Babao Mountain alpine meadow community is the largest, accounting for 6.18% of the total erosion area, followed by that in the Qilian Mountains grassland meadow area, at 4.02%. The corresponding proportion was smallest in the Qinghai Lake Nature Reserve alpine meadow community, this accounting for 0.28% of the total erosion area.
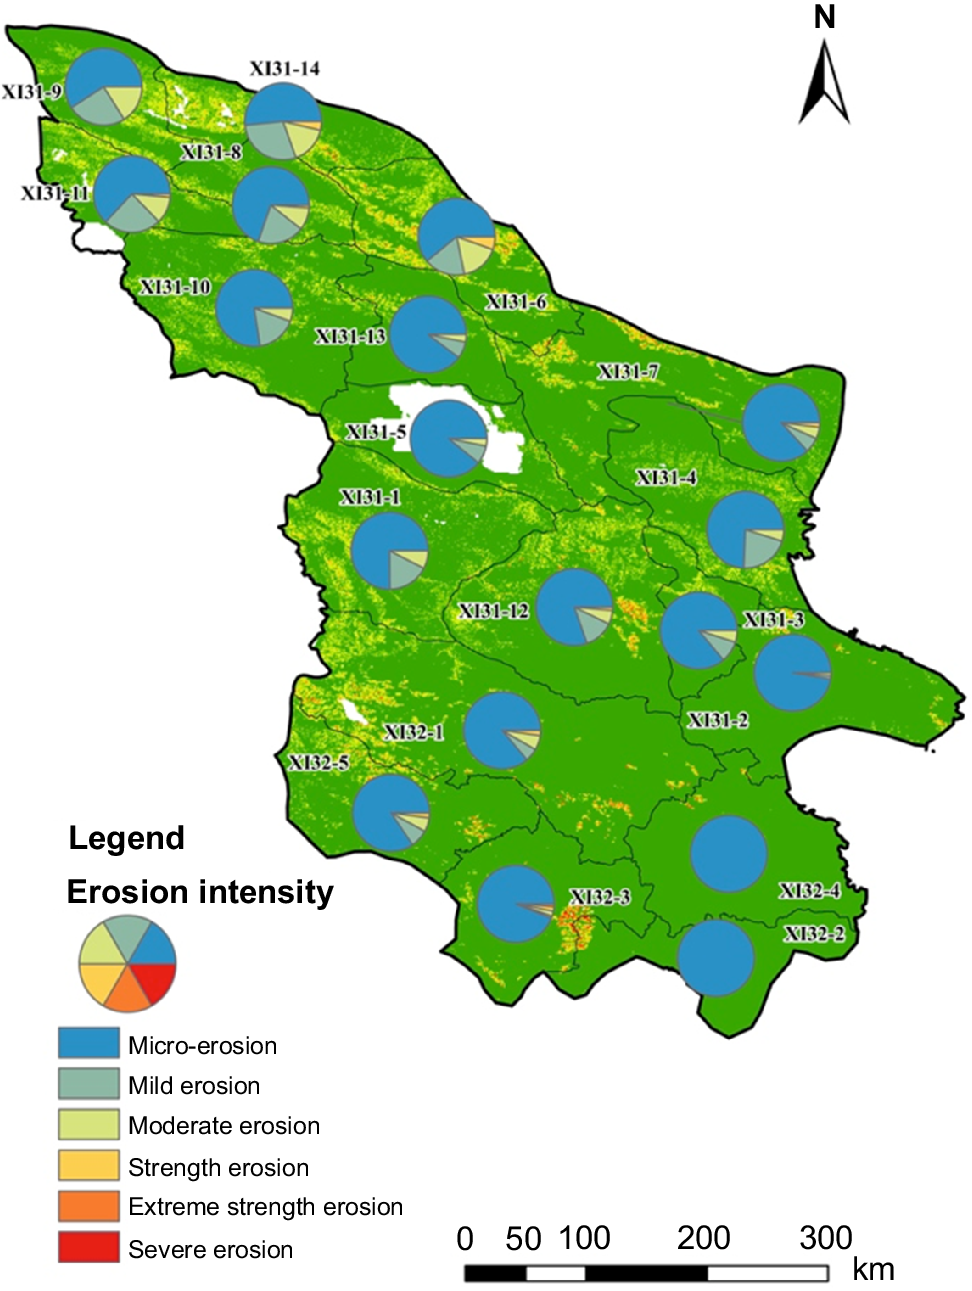
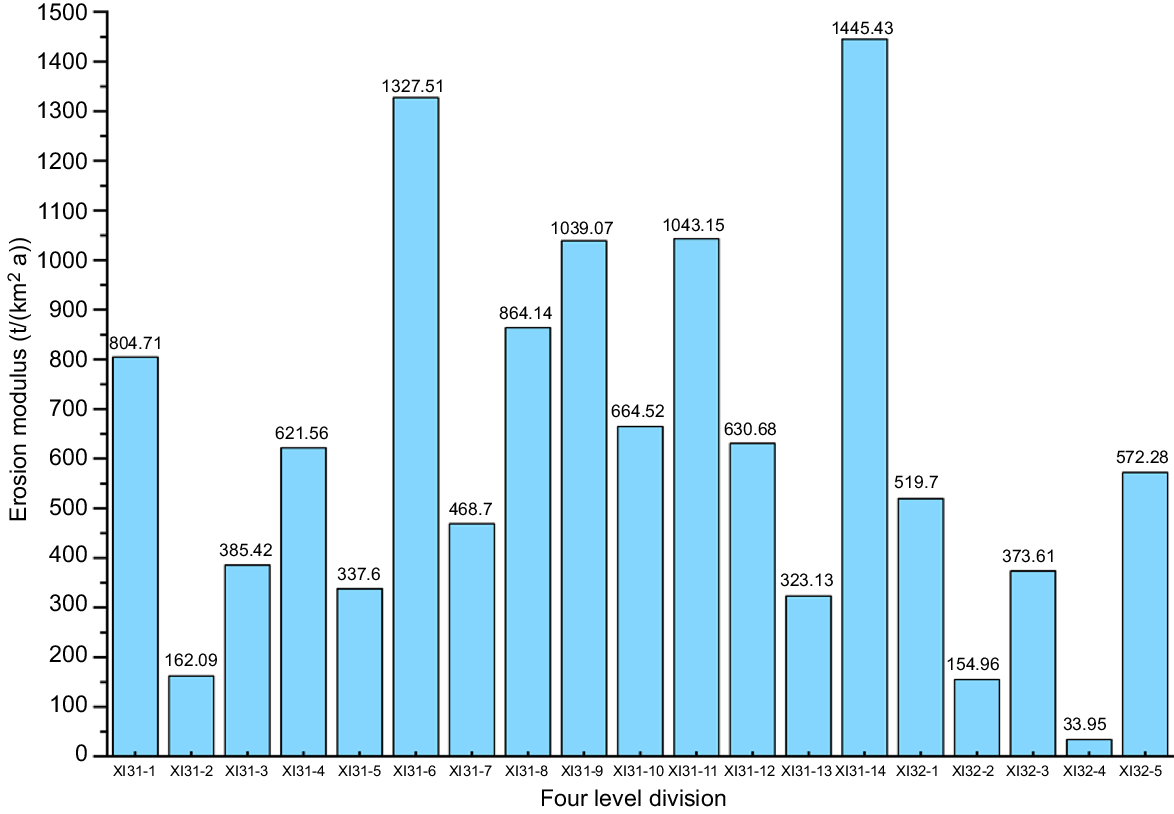
From the soil erosion modulus results in Fig. 6, the highest erosion modulus reached was 1445.43 t/(km2 a) in the Qilian Mountains grassland meadow area, followed by 1327.51 t/(km2 a) in the Babao Mountain alpine meadow community, being lowest at 33.95 t/(km2 a) in the Zoige plateau temperate mountain meadow swamp community. The soil erosion modulus of the Qilian Mountains grassland meadow area is the most serious whereas that of the Zoige plateau temperate mountain meadow swamp community is the least grave situation. In the southern part of the study area, more than 80% of the land was affected by micro-erosion and the erosion modulus was <600 t/(km2 a).
Analysis of factors driving soil erosion
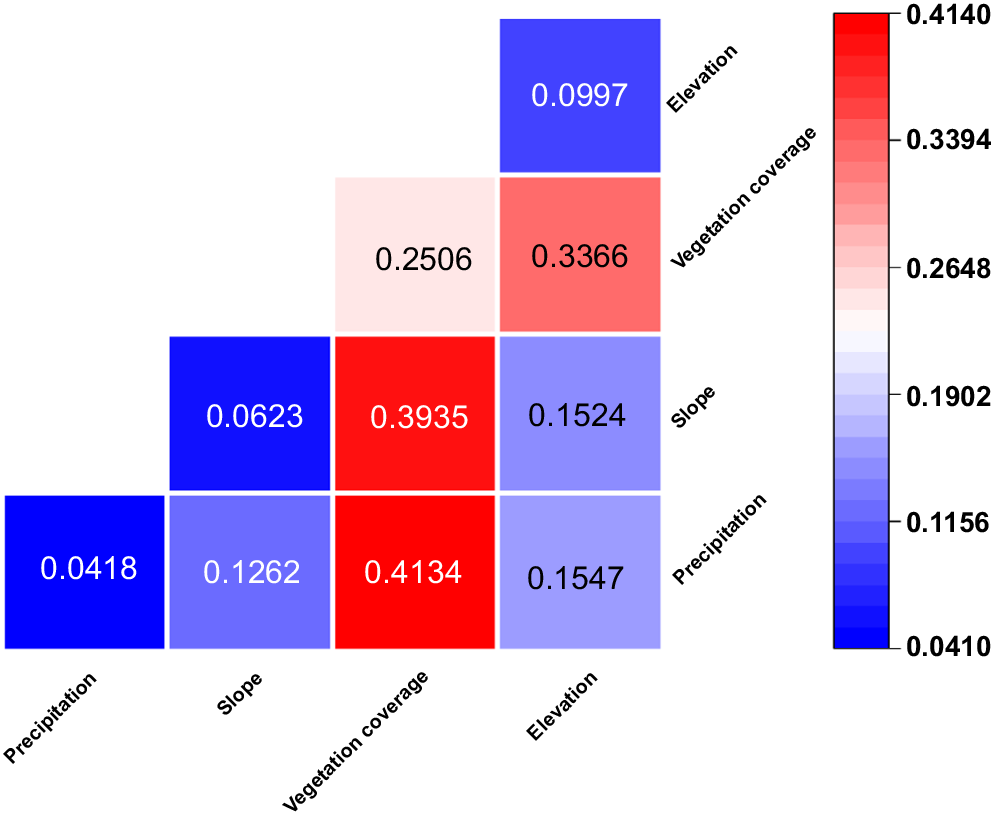
The process of soil erosion is influenced by the interaction of multiple factors, so it is particularly important to determine its driving factors for the subsequent formulation of soil and water conservation policies most suitable for the study area. Here, the results for the driving factors of soil erosion in the study area from 2001 to 2020 obtained by Geographical detector are shown in Table 3, for which each influencing factor passes the 99% significance test. Evidently, there are pronounced differences in the explanatory power among the influencing factors vis-à-vis soil erosion. Their q-values in descending order are: vegetation coverage, elevation, slope, and precipitation. Hence, because it has the greatest q-value by more than two-fold, vegetation coverage was the dominant influencing factor in the study area; followed by elevation and slope; with the influence of precipitation the lowest.
The interactive detection results of Geographical detector are depicted in Fig. 7. This shows that the interaction between different influencing factors can improve their power to explain soil erosion dynamics, in that the q-value (a higher q-value indicates a stronger influence of the independent variable on the dependent variable, while a lower q-value suggests a weaker influence) of the interaction is usually greater than that of either single factor involved. The interaction between vegetation coverage and precipitation was the strongest, whose contribution was 1.64-times that of single factor vegetation coverage, a marked improvement. The second-ranked interaction is that of vegetation coverage and slope, contributing 39.35%. Therefore, it may be inferred that the analysis of soil erosion in the study area should focus on the dominant factor of vegetation coverage and explore its evolution (i.e. regularity, patterning) in concert with precipitation and slope. The synergistic effect of slope and precipitation had the least impact on soil erosion, contributing 12.62%.
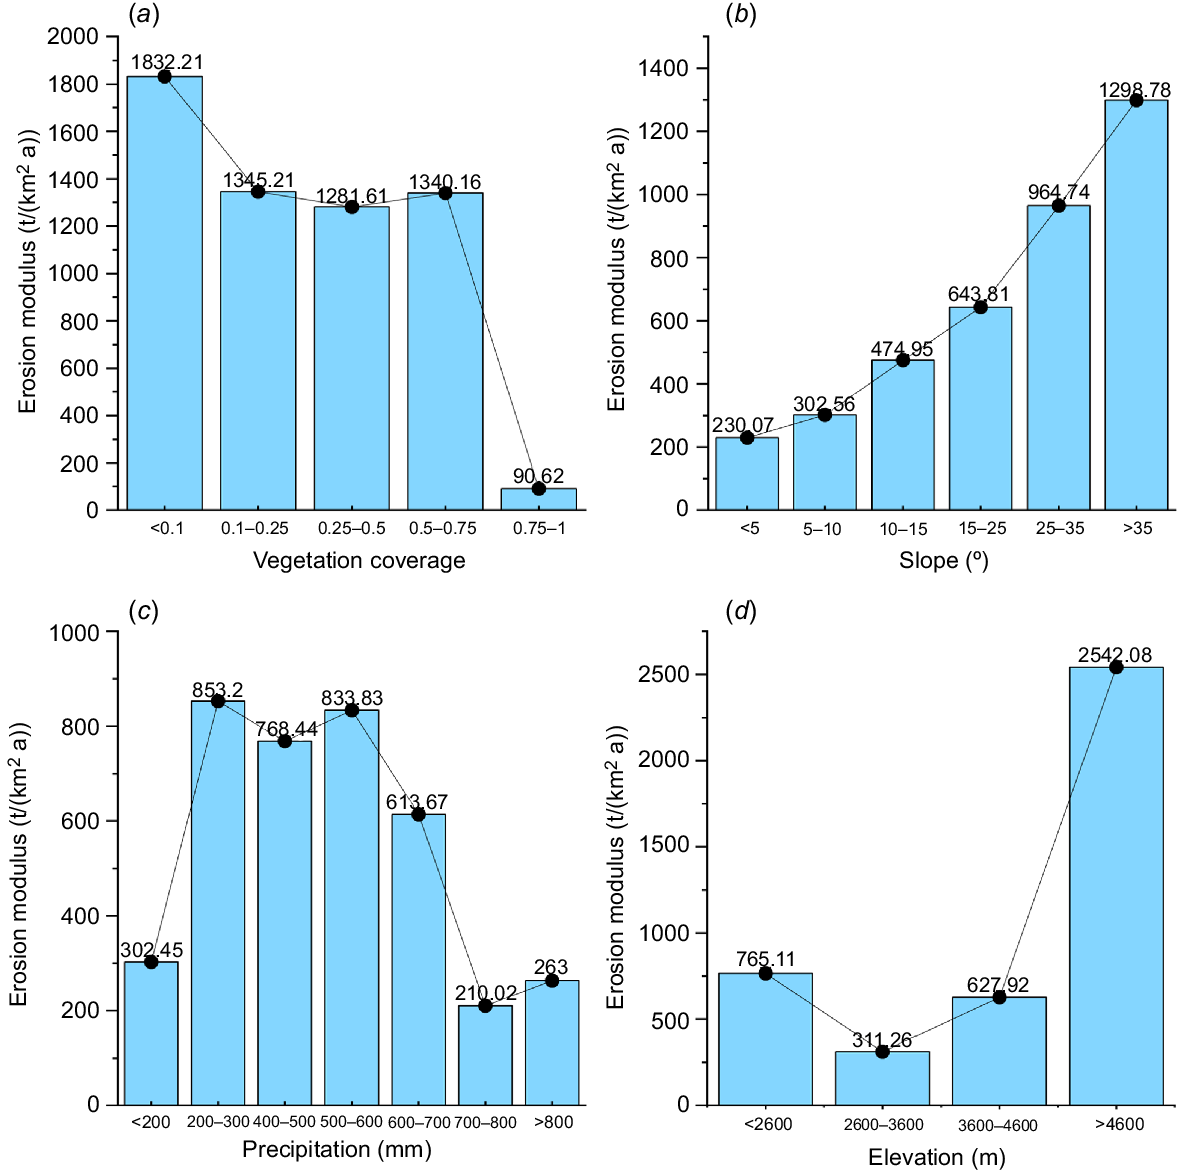
The results of Geographical detector’s risk detection are presented in Fig. 8. Clearly, land whose vegetation coverage is <0.1 are high-risk areas, where the soil erosion modulus is maximal (1832.21 t/(km2 a)). Up to a vegetation coverage of 0.5, soil erosion declines with more vegetation coverage; yet, when the vegetation coverage is 0.5–0.75, there is a slight increase in the soil erosion modulus. However, when vegetation coverage is between 0.75 and 1, there is a significant decrease in the soil erosion modulus. Where the slope is >35° are also high-risk areas, and the soil erosion modulus for the study area increases as the slope steepens. Places with 200–300 mm annual precipitation are high-risk areas as well; soil erosion is generally higher when the precipitation is 200–700 mm, but it is greatly reduced in other areas. The high-risk areas lie above 4600 m, much higher than other areas’ soil erosion modulus.
Average erosion modulus at different intervals in the ‘Alpine temperate forest-grass subregion of Qilian Mountains in Qingdong’. (a) The average soil erosion modulus under different vegetation cover degrees; (b) the average soil erosion modulus at different slope gradients; (c) the average soil erosion modulus under different precipitation conditions; (d) the average soil erosion modulus at different elevation.
Prediction of future soil erosion
We initially utilised the PLUS model to forecast land use for the year 2020 based on the conditions in 2010. This forecast was compared with the actual land use data from 2020, yielding a kappa coefficient of 0.81, indicating a strong agreement between the predicted and observed land use patterns. Given the observed stability in the NDVI values over the recent 5-year period within the study area, we made the decision to utilise the 2020 NDVI data as a proxy for future years. Subsequently, we applied the PLUS model to project land use for the years 2025, 2030, and 2050, which were then coupled with the CMIP6 data ssp245 (medium-speed development and medium-radiation forcing) scenario to predict soil erosion rates in 2025, 2030, and 2050 (Fig. 9). The resulting soil erosion intensity map for those three periods shows that the overall soil erosion in the study area is on a downward trend. Those areas with severe soil erosion are chiefly concentrated in high-elevation areas, and the intensity of erosion is high in the northwest and low in the southeast. By 2050, the study area’s extremely strong and severe erosion will be greatly reduced. Further, minute cases of extreme intensity and severe erosion will be scattered in the Guoluo Mountains. The total amount of erosion (105 t/a) in the study area in 2025, 2030, and 2050 is respectively 1267.00, 1229.31, and 701.89, a reduction of 565.11 × 10⁵ t/a in the 30-year span. The corresponding erosion modulus is 538.32, 522.35, and 298.26 t/(km2 a), thus showing a significant decreasing trend, being reduced by 44.6% over the 25 years.
Soil erosion intensity in the alpine temperate forest-grass subregion of Qilian Mountains in Qingdong during 2025–2050.
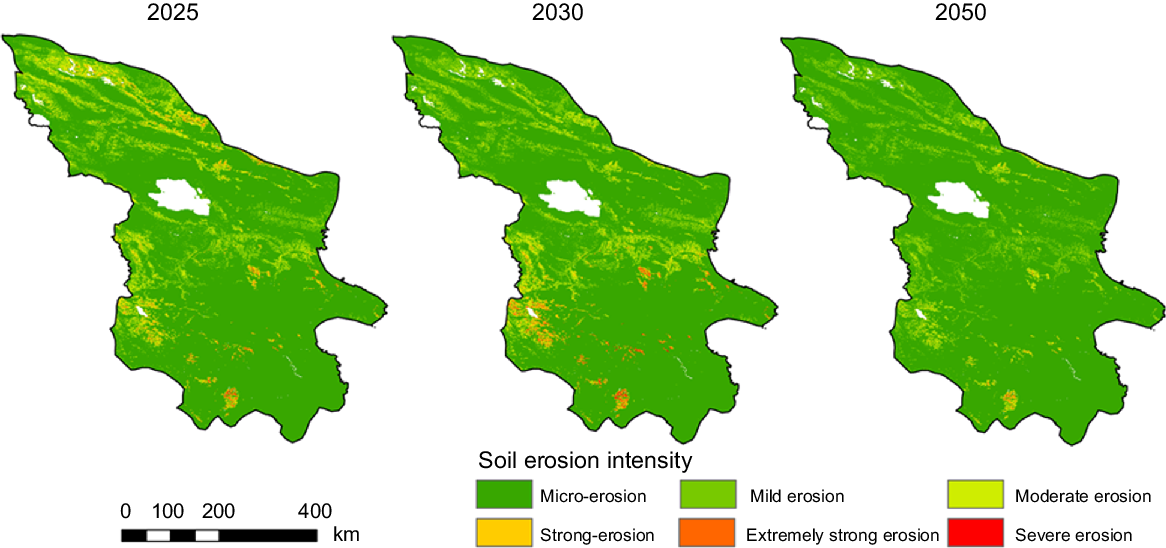
From Table 4, it can be seen that the total area proportion corresponding to micro-erosion and mild erosion are projected to increase while that of moderate or greater erosion will decrease through 2050. These results indicated that the overall soil erosion in the study area should gradually improve over time.
| Erosion intensity level | 2025 (%) | 2030 (%) | 2050 (%) | |
|---|---|---|---|---|
| Micro-erosion | 82.08 | 83.68 | 88.84 | |
| Mild erosion | 10.11 | 9.71 | 8.65 | |
| Moderate erosion | 5.78 | 4.52 | 2.13 | |
| Strong erosion | 1.59 | 1.24 | 0.32 | |
| Extremely strong erosion | 0.42 | 0.74 | 0.06 | |
| Severe erosion | 0.02 | 0.11 | 0.00 |
Discussion
Soil erosion is considered a major environmental threat that is widely prevalent in terrestrial ecosystems (Borrelli et al. 2020). Therefore, it is critical to distinguish the drivers of soil erosion for future soil erosion management. In this paper, Geographical detector let us analyse the varying impacts of various environmental factors (precipitation, slope, vegetation coverage, elevation) on soil erosion in the study area (Table 3). These results showed that vegetation coverage was the principal driving factor of soil erosion, with a contribution of 25.06%. From Fig. 8, it can be seen that the intensity of soil erosion where the vegetation coverage is <10% is the most serious (1832.21 t/(km2 a)), yet that where vegetation coverage is >75% is the slightest (90.62 t/(km2 a)). This is because vegetation has a strong soil-fixing role and impact, as plant roots can reduce soil pore water pressure, thereby increasing the stability of soil aggregates and improving soil shear strength, making soil erosion less likely to occur (Liu et al. 2022). An enhancement in vegetation cover significantly mitigates the splash erosion induced by the impact of raindrops during periods of high precipitation intensity (Bai et al. 2024). Furthermore, according to Zhou’s research in the upper reaches of the Min River basin in southern China, vegetation cover exceeding 70% can significantly reduce the occurrence of extreme soil erosion (Zhou et al. 2008) in the upper reaches of the Minjiang River in Southern China, where vegetation coverage of more than 70% can significantly reduce the prevalence of extreme soil erosion (Zhou et al. 2008). Hence, high vegetation coverage is one of the main factors affecting soil erosion and it can effectively reduce its intensity.
Given that the formation of soil erosion patterns is caused by a combination of factors, such as elevation, precipitation erosion forces, slope steepness, and vegetation cover, how these influence the intensity of soil erosion needs to be analysed in a variety of ways. Geographical detector’s interaction detection can analyse the soil erosion intensity and spatial distribution trends of multiple impact factors. The synergistic effect of vegetation coverage and precipitation can greatly enhance our understanding of the factors contributing to soil erosion (41.34%), as evidenced by the interaction detection heat map in Fig. 7. This is due to the strong interaction between the two factors. High vegetation coverage can effectively reduce soil erosion (Liu et al. 2021; Li et al. 2022b), while heavy rainfall events have the potential to exacerbate soil erosion, especially when the intensity surpasses the protective capabilities of the vegetation cover (Jin et al. 2021; Pan et al. 2022; Zhang et al. 2023b). Vegetation can prevent soil erosion and weaken the erosivity of precipitation by intercepting the latter and reducing the kinetic energy of rainwater to lessen the occurrence of surface runoff. The erosivity of precipitation will increase with a greater precipitation intensity, which will impair the soil protective effect of vegetation (Wang et al. 2023). In the study area, the average annual rainfall is around 450 mm, which suggests that the rainfall amount may be conducive to the development of vegetation that can effectively protect the soil. The second is the vegetation coverage and slope explanatory power of 39.35%. According to the average vegetation coverage of different slope steepness classes in the study area (Table 5), vegetation coverage peaks on slopes of 15–25° and then decreases considerably as the slope steepens. This result is similar to the decreasing trend of vegetation coverage found on land with more than a 25°slope reported by Li and Gong (2021) in Qilian Mountain National Park. Because the slope exceeds 25°, the vegetation decreases rapidly, and with a steeper slope, the soil erosion occurring on that slope section is more severe (Zhang et al. 2017; Zerihun et al. 2018). Therefore, the soil erosion modulus of land with a slope above 25° in the study area increases significantly.
| Slope | <5° | 5–10° | 10–15° | 15–25° | 25–35° | >35° | |
|---|---|---|---|---|---|---|---|
| Vegetation coverage | 0.70 | 0.74 | 0.77 | 0.78 | 0.75 | 0.67 |
Considering the above main factors affecting soil erosion in the study area, for future soil erosion control, the protection and restoration of natural forests and grasslands should be accelerated. Further, the grazing pressure should be determined by grass availability, to promote a dynamic balance between grass and livestock, thereby giving full play to the soil and water conservation functions of forest and grass communities, and mitigating soil erosion in the study area via high vegetation coverage. In those areas with less vegetation coverage and more heavy precipitation, anchoring and strengthening vegetation systems could be considered as a way to dampen the impact of heavy precipitation on soil erosion (Fang 2021; Xu et al. 2022). Mixed forests, especially tree–shrub communities, should be considered in areas with slopes >6°, because they can reduce annual runoff and sediment yield more significantly than do single-canopy layer forests (Gong et al. 2022). In terms of monitoring, the soil erosion in the study area can be observed in real time through ‘the integrated platform of comprehensive observations of natural resource elements’ (Liu et al. 2020; Liu and Liu 2022a, 2022b), so that the soil environment can be restored and controlled reasonably soon after problems are encountered (Fu et al. 2022).
Compared with prior research, we used 5-year average data to analyse the soil erosion dynamics in the study area. Doing so can prevent bias arising from a shift in the overall change trend due to the sudden change of data in a certain period, and can more truly capture the natural soil erosion process and pattern in the study area. Using Geographical detector to analyse the driving factors of soil erosion in the study area provided a robust way to reveal the contribution of each influencing factor of soil erosion. This let us explore the synergistic effects of influencing factors on soil erosion through their interactive detection, advancing the scientific and comprehensive investigation of the causes of soil erosion in the study area. The PLUS model, CMIP6 data ssp245 scenario precipitation data, and multi-year average NDVI were used to predict the future trends of soil erosion dynamics. Based on the aforementioned research, this study analyses the soil erosion conditions and the underlying driving factors in the ATFSQMQ region from 2001 to 2020, and forecasts potential future trends of soil erosion in the ATFSQMQ, which can provide information and reference for soil and water conservation and ecological construction in the area.
Conclusion
This paper combines the RUSLE model with GIS for soil erosion intensity mapping of the ATFSQMQ from 2001 to 2020. The spatial and temporal distribution and changes of soil erosion in the study area and the soil erosion situation of each fourth-level natural division are analysed. The driving factors responsible for shaping soil erosion dynamics are explored by Geographical detector, and future soil erosion intensity maps of 2025, 2030, and 2050 are predicted by coupling the PLUS and CMIP6 models. The main conclusions drawn are as follows:
From 2001 to 2020, the soil erosion in the study area has increased, and the average soil erosion modulus is characterised by wavelike rises. The soil erosion modulus values of the four periods were 509.85, 560.83, 507.84, and 581.91 t/(km2 a). According to the 20-year average erosion modulus of the four natural divisions, the soil erosion in the Qilian Mountains grassland meadow area is the most serious, being least so in the Zoige plateau temperate mountain meadow swamp community. Concerning its spatial distribution, the soil erosion modulus decreases from northwest to southeast.
The dominant driving factor of soil erosion in the study area is vegetation coverage, whose interaction with precipitation has the highest explanatory power. Strengthening grassland restoration and devising a viable social economic development model for regional water resources can help to control soil erosion in the study area. Key management areas are those with vegetation cover less than 0.1, annual precipitation between 200 and 300 mm, slopes greater than 35°, and elevation greater than 4600 m, all of which are at high risk for soil erosion.
According to the prediction results of future soil erosion in three periods of 2025, 2030, and 2050, the areas with strong erosion are primarily distributed in high-elevation areas, and the overall soil erosion problem in the study area is gradually improving over time, in that the total area of micro-erosion and mild soil erosion keeps increasing, while that of area of other grades of erosion is continually decreasing.
Because certain high-resolution data and measurement parameters of soil erosion data are difficult to obtain, the resolution of the study area was set to 1 km in this paper. Arguably, this somewhat limits how refined the model results could be. In future research, the resolution of the data can be enhanced, and field monitoring and geochemical tracing techniques can be employed. Utilising field survey data for calibrating and validating the RUSLE model will yield more accurate results of soil erosion.
Declaration of funding
This study was supported by the Research on Integrated Technology System for Natural Resources Observation and Monitoring (No. DD20230514) and the National Natural Science Foundation of China (No. 41961059).
References
Bai R, Wang X, Li J, Yang F, Shangguan Z, Deng L (2024) The impact of vegetation reconstruction on soil erosion in the Loess plateau. Journal of Environmental Management 363, 121382.
| Crossref | Google Scholar | PubMed |
Bircher P, Liniger HP, Prasuhn V (2022) Comparison of long-term field-measured and RUSLE-based modelled soil loss in Switzerland. Geoderma Regional 31, e00595.
| Crossref | Google Scholar |
Borrelli P, Robinson DA, Panagos P, Lugato E, Yang JE, Alewell C, Wuepper D, Montanarella L, Ballabio C (2020) Land use and climate change impacts on global soil erosion by water (2015–2070). Proceedings of the National Academy of Sciences 117(36), 21994-22001.
| Crossref | Google Scholar |
Cai C, Ding S, Shi Z, Huang L, Zhang G (2000) Study on prediction of soil erosion in small watershed using USLE model and geographic information system IDRISI. Journal of Soil and Water Conservation 2000(02), 19-24.
| Crossref | Google Scholar |
Chen H, Ding W, Zafar TB (2020) Evaluation of soil hydraulic erosion in Qilian Mountain National Park based on USLE model. Science of Soil and Water Conservation in China 18(04), 38-44.
| Crossref | Google Scholar |
Chen S, Wei X, Cai Y, Li H, Li L, Pu J (2024) Spatiotemporal evolution of rocky desertification and soil erosion in karst area of Chongqing and its driving factors. Catena 242, 108108.
| Crossref | Google Scholar |
Eyring V, Bony S, Meehl GA, Senior CA, Stevens B, Stouffer RJ, Taylor KE (2016) Overview of the Coupled Model Intercomparison Project Phase 6 (CMIP6) experimental design and organization. Geoscientific Model Development 9(5), 1937-1958.
| Crossref | Google Scholar |
Fang H (2021) Quantifying farmland shelterbelt impacts on catchment soil erosion and sediment yield for the black soil region, northeastern China. Soil Use and Management 37(1), 181-195.
| Crossref | Google Scholar |
Fu Y, Tan C, Liu X, Sun X, Yuan Z, Zheng Y (2022) Definition, classification, observation and monitoring of natural resources and their application in territorial planning and governance. Geology in China 49(4), 1048-1063.
| Crossref | Google Scholar |
Gong C, Tan Q, Liu G, Xu M (2022) Impacts of mixed forests on controlling soil erosion in China. Catena 213, 106147.
| Crossref | Google Scholar |
Jin F, Yang W, Fu J, Li Z (2021) Effects of vegetation and climate on the changes of soil erosion in the Loess Plateau of China. Science of The Total Environment 773, 145514.
| Crossref | Google Scholar | PubMed |
Li J, Gong C (2021) Topographic differentiation effect of vegetation cover change in Qilian Mountain National Park. Soil and Water Conservation Bulletin 41(03), 228-237.
| Crossref | Google Scholar |
Li H, Guan Q, Sun Y, Wang Q, Liang L, Ma Y, Du Q (2022a) Spatiotemporal analysis of the quantitative attribution of soil water erosion in the upper reaches of the Yellow River Basin based on the RUSLE-TLSD model. Catena 212, 106081.
| Crossref | Google Scholar |
Li X, Zhang Y, Ji X, Strauss P, Zhang Z (2022b) Effects of shrub-grass cover on the hillslope overland flow and soil erosion under simulated rainfall. Environmental Research 214(Pt 1), 113774.
| Crossref | Google Scholar | PubMed |
Liang X, Guan Q, Clarke KC, Liu S, Wang B, Yao Y (2021) Understanding the drivers of sustainable land expansion using a patch-generating land use simulation (PLUS) model: a case study in Wuhan, China. Computers, Environment and Urban Systems 85, 101569.
| Crossref | Google Scholar |
Liu X, Liu J (2022a) Introduction to integrated platform for integrated observation of natural resource elements. China Geology 49(04), 1004.
| Crossref | Google Scholar |
Liu X, Liu J (2022b) Introduction to the comprehensive observation network project of natural resource elements. China Geology 49(03), 678.
| Crossref | Google Scholar |
Liu B, Yang Y, Lu S (2018) Analysis of several commonly used soil erosion terms and their significance in production practice. China Soil and Water Conservation Science 16(01), 9-16.
| Crossref | Google Scholar |
Liu X, Liu X, Cheng S, Gao X, Yun W, Fu Y (2020) Construction and key technologies of comprehensive observation network of natural resource elements in China. Resource Science 42(10), 1849-1859.
| Crossref | Google Scholar |
Liu H, Liu Y-X, Zhao W-W, Peng D (2021) Soil conservation assessment via climate change and vegetation growth scenarios in the Nile River basin. Journal of Mountain Science 18(4), 863-877.
| Crossref | Google Scholar |
Liu J, Zhou Z, Liu J, Su X (2022) Effects of root density on soil detachment capacity by overland flow during one growing season. Journal of Soils and Sediments 22(5), 1500-1510.
| Crossref | Google Scholar |
Oldeman LR, Hakkeling RTA, Sombroek WG (1991) World map of the status of human-induced soil degradation: an explanatory note. 2nd. rev. edn. ISRIC. Available at https://www.isric.org/documents/document-type/isric-report-199007-world-map-status-human-induced-soil-degradation
Ostovari Y, Ghorbani-Dashtaki S, Bahrami H-A, Naderi M, Dematte JAM (2017) Soil loss estimation using RUSLE model, GIS and remote sensing techniques: a case study from the Dembecha Watershed, Northwestern Ethiopia. Geoderma Regional 11, 28-36.
| Crossref | Google Scholar |
Pan L-D, Li R, Shu D-C, Zhao L-N, Chen M, Jing J (2022) Effects of rainfall and rocky desertification on soil erosion in karst area of Southwest China. Journal of Mountain Science 19(11), 3118-3130.
| Crossref | Google Scholar |
Peng Q, Wang R, Jiang Y, Zhang W, Liu C, Zhou L (2022) Soil erosion in Qilian Mountain National Park: dynamics and driving mechanisms. Journal of Hydrology: Regional Studies 42, 101144.
| Crossref | Google Scholar |
Qin W, Guo Q, Cao W, Yin Z, Yan Q, Shan Z, Zheng F (2018) A new RUSLE slope length factor and its application to soil erosion assessment in a Loess Plateau watershed. Soil and Tillage Research 182, 10-24.
| Crossref | Google Scholar |
Räsänen TA, Tähtikarhu M, Uusi-Kämppä J, Piirainen S, Turtola E (2023) Evaluation of RUSLE and spatial assessment of agricultural soil erosion in Finland. Geoderma Regional 32, e00610.
| Crossref | Google Scholar |
Shi Z, Liu Q, Zhang H, Wang L, Huang X, Fang F, Yue Z (2020) Study on soil erosion and conservation in the past 10 years: progress and prospects. Soil Science 57(05), 1117-1127 Available at https://kns.cnki.net/kcms/detail/32.1119.P.20200604.0852.004.html.
| Google Scholar |
Teng H, Liang Z, Chen S, Liu Y, Viscarra Rossel RA, Chappell A, Yu W, Shi Z (2018) Current and future assessments of soil erosion by water on the Tibetan Plateau based on RUSLE and CMIP5 climate models. Science of The Total Environment 635, 673-686.
| Crossref | Google Scholar | PubMed |
Tian J, Li Y, Wang L, Wang J (2007) Application research on soil erosion prediction based on RS and GIS. Journal of Jilin Agricultural University 2007(01), 78-82.
| Crossref | Google Scholar |
Tong S, Cao G, Zhang Z, Yan X, Diao E (2022) Analysis on spatiotemporal variation and migration characteristics of soil erosion on the southern slope of Qilian Mountains. Soil and Water Conservation Research 29(04), 18-27.
| Crossref | Google Scholar |
Wang B, Zhang Z (2023) Response of soil erosion in a typical watershed of the Loess Plateau to the conversion of farmland to forest land use. Transactions of the Chinese Society of Agricultural Engineering 39(12), 60-70.
| Crossref | Google Scholar |
Wang J-F, Li X-H, Christakos G, Liao Y-L, Zhang T, Gu X, Zheng X-Y (2010) Geographical detectors-based health risk assessment and its application in the neural tube defects study of the Heshun Region, China. International Journal of Geographical Information Science 24(1-2), 107-127.
| Crossref | Google Scholar |
Wang Q, Yang W, Nan C, He Z (2011) Evaluation of soil and water loss based on RS and GIS: a case study of Ruoergai County, Sichuan Province. China. . Water Conservation 2011(9), 33-67.
| Crossref | Google Scholar |
Wang H, Gao J, Hou W (2018) Quantitative attribution of soil erosion in different geomorphic pattern type areas of karst based on geoprobes. Journal of Geography 73(09), 1674-1686 Available at https://kns-cnki-net-s.webvpn.xju.edu.cn:8040/kcms/detail/11.1856.P.20180907.1523.010.html.
| Google Scholar |
Wang J, Zhang Y, Li K, Zhang Z, Chen C (2023) Gully internal erosion triggered by a prolonged heavy rainfall event in the tableland region of China’s Loess Plateau. International Soil and Water Conservation Research 11, 610-621.
| Crossref | Google Scholar |
Wu X (2021) Study on soil erosion process and dynamic mechanism of Xishan slope in Longwu. Master’s Thesis, Chengdu University of Technology, China. doi:10.26986/d.cnki.gcdlc.2021.000652
Xu Y, Su C, Huang Z, Yang C, Yang Y (2022) Research on the protection of expansive soil slopes under heavy rainfall by anchor-reinforced vegetation systems. Geotextiles and Geomembranes 50(6), 1147-1158.
| Crossref | Google Scholar |
Yang J, Huang X (2021) The 30 m annual land cover dataset and its dynamics in China from 1990 to 2019. Earth System Science Data 13(8), 3907-3925.
| Crossref | Google Scholar |
Yang Y, Zhao R, Shi Z, Viscarra Rossel RA, Wan D, Liang Z (2018) Integrating multi-source data to improve water erosion mapping in Tibet, China. Catena 169, 31-45.
| Crossref | Google Scholar |
Zerihun M, Mohammedyasin MS, Sewnet D, Adem AA, Lakew M (2018) Assessment of soil erosion using RUSLE, GIS and remote sensing in NW Ethiopia. Geoderma Regional 12, 83-90.
| Crossref | Google Scholar |
Zhang W, Fu J (2003) Estimating rainfall erosivity using different types of rainfall data. Resource Science 25(01), 35-41 https://www.resci.cn/CN/Y2003/V25/I1/35.
| Google Scholar |
Zhang K, Peng W, Yang H (2007) Soil erodibility and its estimation in China. Soil Science 44(01), 7-13.
| Crossref | Google Scholar |
Zhang Y, Zhao Q, Ding S, Cao Z, Liu P, Wu C, Bian Z (2017) Effects of slope and vegetation coverage on hydrodynamic characteristics of overland flow erosion in silty riverbanks. The Journal of Applied Ecology 28(08), 2488-2498.
| Crossref | Google Scholar |
Zhang Q, Ma L, Zhang Z, Xu W, Zhou B, Song M, Qiao A, Wang F, She Y, Yang X, Guo J, Zhou H (2019) Ecological restoration of degraded grassland in alpine region of Qinghai-Tibet: degradation status, restoration measures, effects and prospects. Acta Ecologica Sinica 39(20), 7441-7451.
| Crossref | Google Scholar |
Zhang H, Fan J, Huang L, Tang Y, Yue Y, Yang Y, Liu X (2020) Theoretical research and technical scheme of comprehensive regionalization of natural resources in China. Resource Science 42(10), 1870-1882.
| Crossref | Google Scholar |
Zhang X, Wang D, Ma K, Sun D, Yang F, Lin H (2023a) Spatiotemporal evolution of soil water erosion in Ningxia grassland based on the RUSLE-TLSD model. Environmental Research 236, 116744.
| Crossref | Google Scholar | PubMed |
Zhang B, Chen Z, Shi X, Wu S, Feng H, Gao X, Siddique KHM (2023b) Temporal and spatial changes of soil erosion under land use and land cover change based on Chinese soil loss equation in the typical watershed on the Loess Plateau. Soil Use and Management 39(1), 557-570.
| Crossref | Google Scholar |
Zhenchao Z, Zhouping S (2004) A review of soil erosion model research. Science of Soil and Water Conservation in China 2004(01), 52-56.
| Crossref | Google Scholar |
Zhou P, Luukkanen O, Tokola T, Nieminen J (2008) Effect of vegetation cover on soil erosion in a mountainous watershed. Catena 75(3), 319-325.
| Crossref | Google Scholar |