Soil type, bulk density and drainage effects on relative gas diffusivity and N2O emissions
Camille Rousset A D , Tim J. Clough A , Peter R. Grace B , David W. Rowlings B and Clemens Scheer B C
A Department of Soil and Physical Sciences, Lincoln University, PO Box 85084, Lincoln, 7647, New Zealand.
B Queensland University of Technology, Institute for Future Environments, 2 George Street, Brisbane, Qld, 4000, Australia.
C Institut für Meteorologie und Klimaforschung, Department Atmosphärische Umweltforschung (IMK-IFU), KIT-Campus Alpin, Garmisch-Partenkirchen, Germany.
D Corresponding author. Email: Camille.Rousset@lincolnuni.ac.nz
Soil Research 58(8) 726-736 https://doi.org/10.1071/SR20161
Submitted: 8 June 2020 Accepted: 24 August 2020 Published: 25 September 2020
Abstract
Nitrous oxide (N2O), a greenhouse gas, contributes to stratospheric ozone depletion. Agricultural fertiliser use and animal excreta dominate anthropogenic N2O emissions. Soil relative gas diffusivity (Dp/Do) has been used to predict the likelihood of soil N2O emissions, but limited information exists about how soil N2O emissions vary with soil type in relation to Dp/Do. It was hypothesised that, regardless of soil type, the N2O emissions would peak at the previously reported Dp/Do value of 0.006. Four pasture soils, sieved and repacked to three different bulk densities, were held at nine different soil matric potentials between near saturation and field capacity. Soil nitrate and dissolved organic matter concentrations were adequate for denitrification at all soil matric potentials. Increasing soil bulk density and soil matric potential caused Dp/Do to decline. As Dp/Do declined to a value of 0.006, the N2O fluxes increased, peaking at Dp/Do ≤ 0.006. This study shows that the elevation of N2O fluxes as a Dp/Do threshold of 0.006 is approached, holds across soil types. However, the variability in the magnitude of the N2O flux as Dp/Do declines is not explained by Dp/Do and is likely to be dependent on factors affecting the N2O : (N2O + N2) ratio.
Keywords: agriculture, compaction, denitrification, gas diffusivity, greenhouse gas, matric potential, nitrous oxide, porosity.
Introduction
Nitrous oxide (N2O) is a potent greenhouse gas and currently the dominant ozone depleting substance (Ravishankara et al. 2009). Atmospheric concentrations of N2O have increased since preindustrial times by 20%, from 271 to 332 ppb in 2020, due to land use and land use changes, especially in agriculture (Ciais et al. 2013; NOAA 2020). These agricultural emissions of N2O have been predominately driven by the use of nitrogen (N) fertiliser and the deposition of animal excreta (Davidson 2009). Emissions of N2O from agricultural soils arise from biotic and abiotic processes. Key biological pathways include nitrification, nitrifier-denitrification and denitrification (Zumft 1997; Wrage-Mönnig et al. 2018; Stein 2019). The relative dominance of a given biological pathway depends on substrate supply and the oxygen (O2) status of the soil. In well oxygenated agricultural soils, fertiliser- or excreta-derived ammonia are oxidised, ultimately to nitrate. Under conditions of high ammonium supply, for example following urea fertiliser application, autotrophic ammonia oxidising bacteria (AOB) dominate nitrification (Hink et al. 2018) with N2O emissions resulting from biotic and abiotic reactions of the intermediary metabolites (Stein 2019). Hypoxic conditions stimulate AOB to perform nitrifier-denitrification (Stein 2019). If the soil becomes anaerobic, heterotrophic denitrification becomes the dominant process producing N2O (Butterbach-Bahl et al. 2013; Zhu et al. 2013). Denitrification requires both a carbon (C) source and nitrate, or one of the obligate intermediary N compounds in the denitrification sequence, as substrates. Thus, production of N2O from an agricultural soil is highly dependent on the soil’s O2 status, N substrate availability and in the case of denitrification also the C supply.
Because the diffusion of a gas through water is ∼1 × 10⁴ times slower than in air, the effective diffusion coefficient for O2 in soil is proportional to the volume fraction of soil that is water-filled (Farquharson and Baldock 2008). Consequently, measures of soil water content, such as water-filled pore space (WFPS), have often been used as a predictor for determining the occurrence of denitrification. Farquharson and Baldock (2008) queried the use of WFPS as a predictor for N2O emissions because WFPS is a normalised dimensionless value that fails to quantify the fraction of the entire soil volume that is filled with water, or air, and thus it is not directly proportional to the diffusion of gases. Hence, while adequate for comparing processes in a single soil with a constant soil bulk density (ρb) it becomes problematic when comparing soils with varying soil ρb. This was also demonstrated by Balaine et al. (2013), who showed that soil repacked to varying soil ρb, and maintained at different moisture contents, resulted in peak N2O emissions occurring across a relatively wide range of WFPS. Above an upper limit of WFPS, strongly anaerobic conditions also induce full denitrification, with N2O reduced to dinitrogen (N2). Farquharson and Baldock (2008) went on to suggest that measures of soil water content should be linked to structural parameter(s) to better describe gas diffusion in soils. Relative soil gas diffusivity (Dp/Do) accounts for pore connectivity and continuity of the functional gas pore phase: where Dp is the gas diffusion constant in the soil (m3 soil air m–1 soil s–1) and Do is the gas diffusion coefficient of the same gas in free air (m2 air s–1). Accordingly, Balaine et al. (2013) were able to show that peak N2O emissions were poorly explained by WFPS but a strong linear relationship (P < 0.01, r2 = 0.82) with Dp/Do was observed. Moreover, these N2O peaks emissions from a soil repacked to varying soil ρb and held over a range of soil moisture contents aligned with a threshold value of Dp/Do, equal to 0.006. Furthermore, Balaine et al. (2016) found that when examining cumulative N2O emissions over 35 days there was an increase in N2 emissions at Dp/Do < 0.006. Stepniewski (1981) reported that soils became anaerobic for plant roots at Dp/Do < 0.002. Friedl et al. (2018) confirmed a Dp/Do threshold value (0.006) for denitrification-derived N2O after applying ammonium nitrate to subtropical pasture soils with maximum N2O emissions at Dp/Do = 0.006 on day 1 of the study. However, on day 2 the N2O emissions reached their maximum at Dp/Do = 0.0068 with the shift thought to result from residual O2 at day one and increasing anaerobic conditions on day 2, resulting in the enhanced reduction of N2O to N2 or entrapment of denitrified N2O in the soil. Thus, the relationship between Dp/Do and N2O flux potentially alters with biological O2 demand. After incorporating high C residues into a cropping system, high N2O fluxes were observed at calculated Dp/Do > 0.02, a value considered as a threshold for anaerobiosis (Stepniewski 1981), which was postulated to be due to the high C inputs increasing O2 demand and denitrification activity (Petersen et al. 2013). In grazed pastures, C inputs include root exudation and mineralisation of soil organic matter and these will vary with climate, soil fertility, management and soil type. Hence, the laboratory-defined threshold for peak N2O emissions, recorded by Balaine et al. (2013) for only one soil, may shift due to increased O2 demand. Interestingly, however, Owens et al. (2016) found that after applying ruminant urine to a pasture soil in situ, that the N2O emissions only increased substantially when Dp/Do declined to ∼0.006, consistent with the laboratory observations of Balaine et al. (2013, 2016) and Friedl et al. (2018). Further evaluation of N2O emissions in relation to Dp/Do, under controlled conditions for a range of soils, is still required to better understand the robustness of this threshold.
Thus, the objectives of this experiment were to further evaluate soil Dp/Do in relation to the occurrence of N2O emissions, under controlled conditions, across a wider range of soils, under a range of soil ρb and moistures in order to better validate the results obtained by Balaine et al. (2013, 2016). It was hypothesised that (i) the interactive effects of soil ρb and water content on Dp/Do would result in elevated emissions of N2O when Dp/Do declined to a threshold close to 0.006, (ii) the robustness of Dp/Do as an indicator for N2O emissions would be consistent across different soils and (iii) Dp/Do would indicate the onset of elevated N2O emissions better than WFPS.
Materials and methods
Soil collection and experimental design
Four pasture soils were sampled (0–15 cm depth) in spring 2017: a Wakanui silt loam (Mottled Immature Pallic Soil) from the dairy farm at Lincoln University (43°38′41.3″S, 172°26′34.6″E); a Waipara loam soil (Mottled-argillic Fragic Pallic Soil) from a hill country farm at Limeworks Road, North Canterbury (42°58′2.28″S, 172°38′19.68″E); a Temuka silty loam (Typic Orthic Gley Soil) from a dairy farm near Lincoln (43°39′11.88″S, 172°29′22.92″E); and a well-drained Otorohanga loam (Typic Orthic Allophanic Soil) collected at Ruakura, AgResearch, Hamilton (37°46′44.9″S, 175°18′47.6″E). Soil classifications are as defined by Lilburne et al. (2012). Soils were air-dried and sieved to ≤2 mm and the gravimetric water content was determined (Blakemore et al. 1987). Soil particle densities and particle sizes (Table 1) were analysed using recognised methods (Hao et al. 2008; Kroetsch and Wang 2008). Soil organic C contents (Table 1) were determined by loss on ignition (Blakemore et al. 1987). Repacked soil cores were constructed by compacting sieved soil to a depth of 5 cm into stainless steel (SS) rings (7.3 cm internal diameter, 7.4 cm deep) at bulk densities designated by treatment. The SS-rings had fine nylon mesh placed over the bottom of the ring to prevent soil egress.
The experimental design consisted of four soils, three levels of soil ρb for each soil and nine levels of matric potential (–0.5, –1.0, –2.0, –3.0, –4.0, –5.0, –6.0, –8.0 and –10.0 kPa), replicated four times. Soil ρb treatments for the Wakanui, Waipara and Temuka soils were set at 1.0, 1.1 or 1.2 Mg m–3. However, due to the allophanic nature of the Otorohanga soil and the relatively high organic matter content it could not be packed at 1.2 Mg m–3 and so the soil ρb treatments for this soil were set at 0.9, 1.0 or 1.1 Mg m–3.
So that the soil cores had excess NO3-N substrate available for denitrification the soil cores were presoaked in a KNO3 solution (1800 µg mL–1 NO3-N) for 2 days before being placed on the tension tables. The aim of this was to better enable observations of the effects of soil characteristics (bulk density, matric potential and organic matter content) on N2O emissions. Tension tables were prepared as described by Romano et al. (2002) and soil cores were placed on the tables to equilibrate for 4 days. Before placing soils cores on the tension tables, 10 mL of the KNO3 solution were poured evenly across the tension tables to provide a good connection between soil cores and the tension table. Soil cores were weighed daily to determine when the equilibrium at the desired matric potential was achieved. It was physically impossible to run all soil cores simultaneously. Thus, a total of 108 soil cores (three levels of soil ρb × nine levels of soil matric potential × four types of soil) were on the tension tables at any given time (one replicate), with subsequent replicates run in batches (Balaine et al. 2013). Using a new set of cores, with air-dried repacked soil for each replicate, ensured that the initial soil NO3– concentration and soil conditions were the same for each replicate. The tension tables were sited in a room where the temperature fluctuations were negligible (20 ± 1°C).
N2O and relative gas diffusivity measurements
Nitrous oxide fluxes were measured after soil cores had attained equilibrium on the tension table (4 days). Each soil core was placed in a 1-L Mason jar, which was then sealed with an air-tight lid equipped with a septum. Gas samples (10 mL) were taken at 0, 15 and 30 min after sealing using a 25G hypodermic needle attached to a three-way stopcock, which was connected to a 20-mL glass syringe. Collected gas samples were injected into pre-evacuated 6-mL Exetainer® vials. Immediately before analysis, the gas samples were brought to ambient pressure and then analysed for N2O on a gas chromatograph (Clough et al. 2009). Reference gases, N2O in N2 (0.2 ± 0.004, 1.0 ± 0.01, 2.0 ± 0.04 and 5.0 ± 0.1, supplied by BOC Gas New Zealand) were used for constructing standard curves. The change in N2O concentration over time was used to calculate N2O fluxes (Hutchinson and Mosier 1981).
Measurements of Dp/Do were performed after N2O emission measurement using the method described by Rolston and Moldrup (2002). In brief, repacked soil cores were positioned, isolated, above a chamber that was flushed with an O2-free gas mixture (90% Ar and 10% N2) until the chamber was O2 free. Then, the soil core base was connected to the chamber, allowing ambient air to diffuse through the soil core into the chamber. A precalibrated sensor (KE-12, Figaro Inc.) recorded the increase in the O2 concentration in the chamber. Subsequently, the method of Rolston and Moldrup (2002) was used to calculate Dp/Do. The natural logarithm of the relative concentration of O2 in the chamber (lnCr) was calculated, and Cr was calculated as follows:

where Cg is the concentration of O2 in the chamber at a time t, C0 is the concentration of O2 in the chamber at the beginning of the experiment (t = 0) and Cs is the O2 concentration (20.9%) above the soil core. The linear slope of the plot of lnCr vs t was determined and is equal to:

Then Dp was determined using the calculated value of ε and the value of α1 taken from table 46–1 in Rolston and Moldrup (2002). The soil gas diffusion coefficient in air (Do) was calculated according to Currie (1960).
Soil analyses
After taking N2O samples and measuring Dp/Do the soil cores were extruded into a Ziploc® plastic bag. The soil was well mixed before taking a 10-g subsample to determine gravimetric water content at 105°C for 24 h. A calibrated flat-surface pH electrode was used to measure the pH of the extruded-mixed soil (Broadley James Corp., Irvine, CA, USA). The equivalent of 4 g of dry soil was extracted with 40 mL of 2 M KCl for 1 h to determine inorganic-N concentrations. After filtering (Whatman 42) the extracts were analysed for NO3–-N and NH4+-N on a flow injection analyser (Blakemore et al. 1987). Similarly, dissolved organic carbon (DOC) was extracted using 5-g equivalent of dry soil and 30 mL of deionised water shaken for 30 min before centrifugation (2280 × g for 20 min, at 25°C, model Kubota 8420) and filtration (Whatman 42), with analyses performed on a Shimadzu TOC analyser (Shimadzu Oceania Ltd, Sydney, Australia).
Statistical analyses
Statistical analyses were performed using R studio (version 3.4.3). Data were tested for normality, residual repartition and the homoscedasticity. A log-transformation was applied to the N2O data where conditions for normality were not met. A repeated-measures analysis, using two-way ANOVA, with matric potential and soil ρb as factors, was used to test for overall treatment differences between measured variables, with Tukey’s post-hoc test used to determine specific differences between means. Comparisons were made between soil ρb treatments within soils and across matric potential, and where common soil ρb occurred comparisons were made across soils.
Results
Soil chemical and physical properties
Soil pH varied with soil type (P < 0.05): averaged across soil matric potential, the Waipara, Otorohonga, Temuka and Wakanui soils had soil pH of 5.15, 5.28, 5.73 and 6.00 respectively. As drainage increased (more negative soil matric potential) the soil pH within each soil also decreased (P < 0.05; Fig. 1). The most significant decrease in soil pH was for the Wakanui soil: at –0.5 kPa, soil pH range was 6.34–6.41 and declined to 5.67–5.70 at –10 kPa. For each soil type, increasing soil ρb generally resulted in an increase in soil pH at all levels of soil matric potential (P < 0.05; Fig. 1).

|
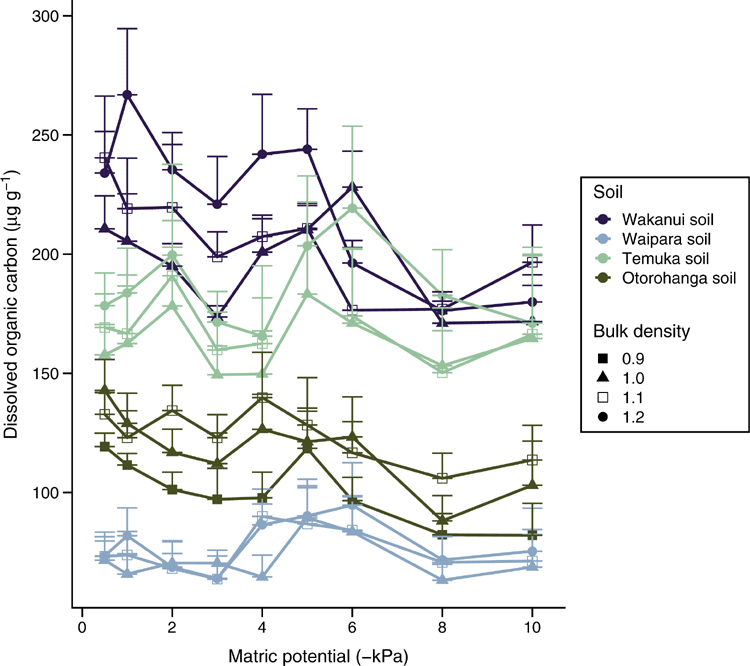
Soil DOC concentrations varied with soil type (P < 0.05): averaged across soil matric potential, the Waipara, Otorohonga, Temuka and Wakanui soils had DOC concentrations of 75, 114, 162 and 208 µg g–1 soil respectively. These soil DOC concentrations either remained relatively stable (Temuka and Waipara soils) or tended to decline (Wakanui and Otorohanga soils) as soil matric potential became more negative (Fig. 2); however, there was no significant interaction between soil ρb and soil matric potential on DOC concentrations within a given soil (P > 0.05). Neither soil ρb nor soil matric potential caused significant changes to DOC concentration for the Waipara or Temuka soils (P > 0.1). However, in the Wakanui and Otorohonga soil, DOC concentrations varied with soil ρb (P < 0.05): DOC concentrations were higher for the highest soil ρb (1.2 and 1.1 Mg m–3) than for the lowest soil ρb (1 and 0.9 Mg m–3). In these same soils, the soil DOC concentrations were significantly lower at –8 and –10 kPa than at –0.5 and –1 kPa (P < 0.05, Fig. 2).
|
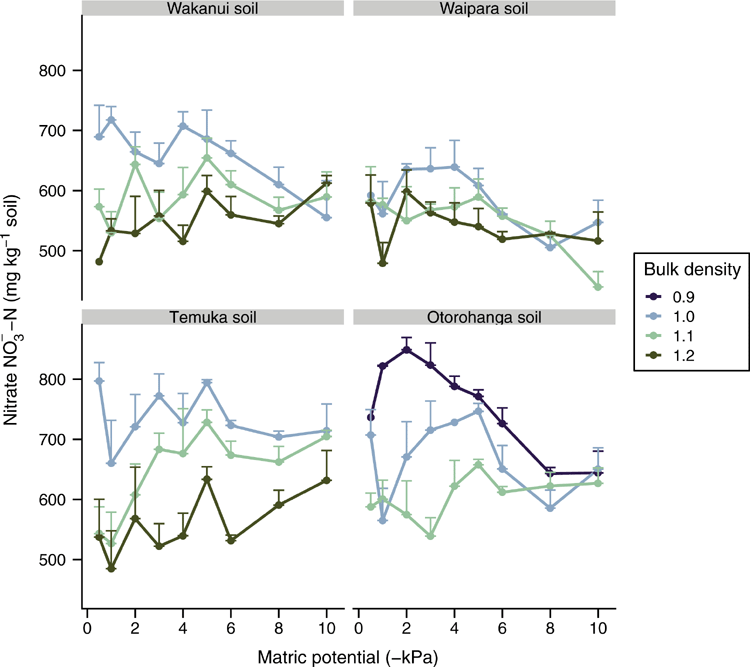
There was no consistent effect of soil matric potential on soil NO3–-N concentrations (Fig. 3). However, soil ρb did affect soil NO3–-N concentrations in the Wakanui soil when averaged across soil matric potential: at 1.0 Mg m–3 these were higher (P < 0.05) than at 1.1 and 1.2 Mg m–3. In the Temuka soil, the NO3–-N concentrations also declined (P < 0.05) as soil ρb increased – when averaged across soil matric potential, equalling 741, 644 and 555 mg NO3–-N kg–1 of soil at soil ρb of 1.0, 1.1 and 1.2 Mg m–3 respectively. Similarly, in the Otorohanga soil at soil ρb of 0.9, 1.0 and 1.1 Mg m–3 average NO3–-N concentrations were 751, 688 and 604 NO3–-N kg–1 respectively (P < 0.05). The Waipara soil was the only soil where NO3–-N concentrations did not vary with soil ρb.
|
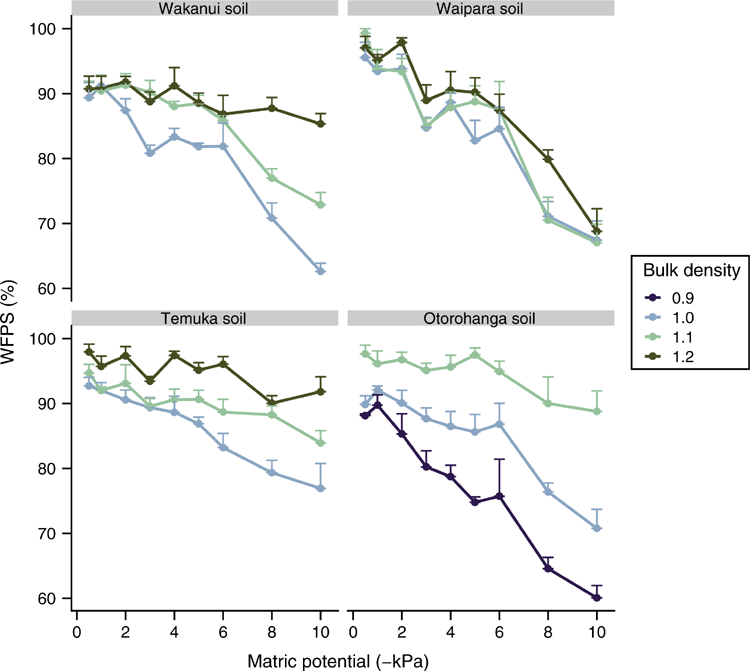
As expected, the soil WFPS decreased with progressively more negative soil matric potentials (P < 0.05) but the rate of decrease varied with soil type: averaged across soil matric potential and soil ρb, the Wakanui, Otorohonga, Waipara and Temuka soils had WFPS values of 85.4%, 85.7%, 86.3% and 90.6% respectively, with corresponding ranges of 60.0–97%, 55.1–100%, 61.4–100% and 68.7–100%. Soil WFPS also varied with soil ρb (P < 0.05), with the lowest WFPS observed at the lowest soil ρb; 1 Mg m–3 for the Wakanui, Waipara and Temuka soils and 0.9 Mg m–3 for the Otorohanga soil. An interaction between soil ρb and matric potential resulted in WFPS declining at a faster rate at lower soil ρb values for all soils, except the Waipara soil (Fig. 4).
|
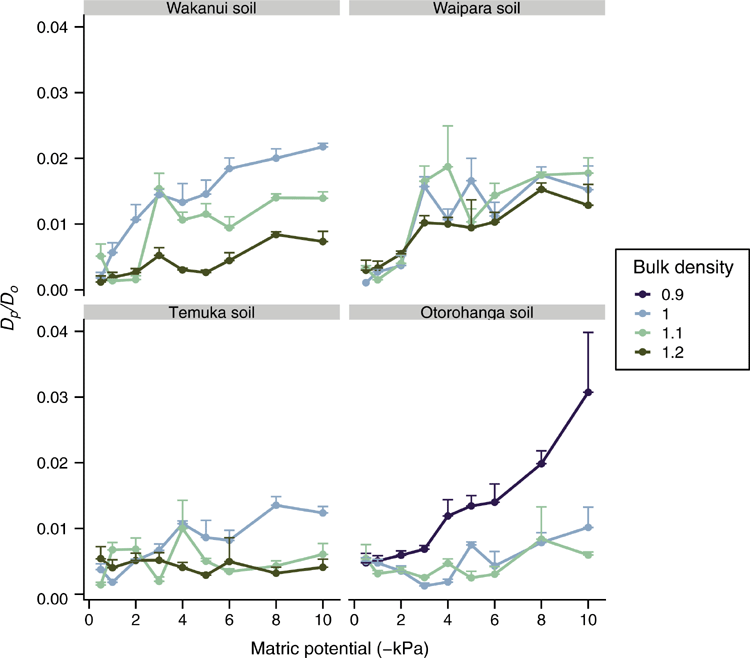
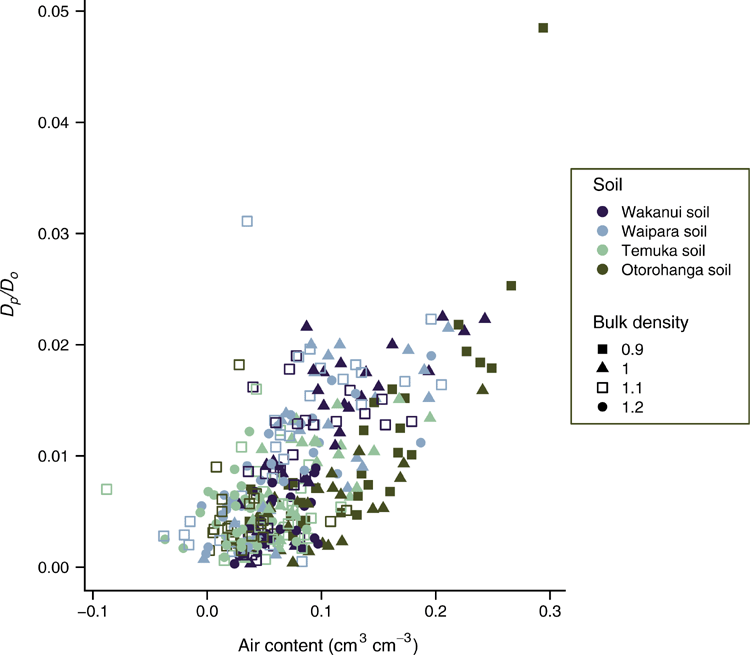
The range in measured mean Dp/Do across the soil matric potential treatments, when averaged across all soil ρb treatments, was 0.003–0.014 for the Wakanui, 0.003–0.015 for the Waipara, 0.004–0.007 for the Temuka soil and 0.005–0.017 for the Otorohanga soil. An interaction between soil ρb and soil matric potential affected Dp/Do in the Wakanui soil, where Dp/Do at 1.2 Mg m–3 was lower (P < 0.05) than at 1.0 Mg m–3 for soil matric potentials below –2 kPa (Fig. 5). The same was observed in the Temuka soil, except that Dp/Do was significantly lower at 1.2 Mg m–3 compared with at 1.0 Mg m–3, for soil matric potentials below –3 kPa (Fig. 5). Similarly, Dp/Do values for 1.0 and 1.1 Mg m–3 were lower for the 0.9 Mg m–3 treatment in the Otorohanga soil below –2 kPa (Fig. 5). However, in the Waipara soil there was no effect of soil ρb on Dp/Do (Fig. 5). A plot of Dp/Do vs soil air-filled porosity showed Dp/Do values over a range of air-filled porosity of 0–0.3 cm3 cm–3 (Fig. 6).
Soil N2O fluxes and relationships with soil physical parameters
For each soil, the N2O-N fluxes were highest at the lowest soil matric potential (–0.5 kPa), with N2O-N fluxes decreasing as soil matric potential decreased (Fig. S1, available as Supplementary material). The range in the N2O-N fluxes varied with soil type (P < 0.05). The highest fluxes occurred in the Otorohanga soil (0.12–691 mg m–2 h–1), closely followed by the Wakanui soil (0.08–660 mg m–2 h–1). The Temuka soil N2O-N fluxes ranged within 0.22–408 mg m–2 h–1 and the lowest N2O-N fluxes occurred in the Waipara soil with 0.07–124 mg m–2 h–1. Soil N2O-N fluxes (P < 0.05) were higher with increasing soil ρb, and in the Temuka and Otorohanga soils where soil ρb and soil matric potential interacted (P < 0.05): soil N2O-N fluxes decreased more slowly at the highest soil ρb as soil matric potential became more negative.
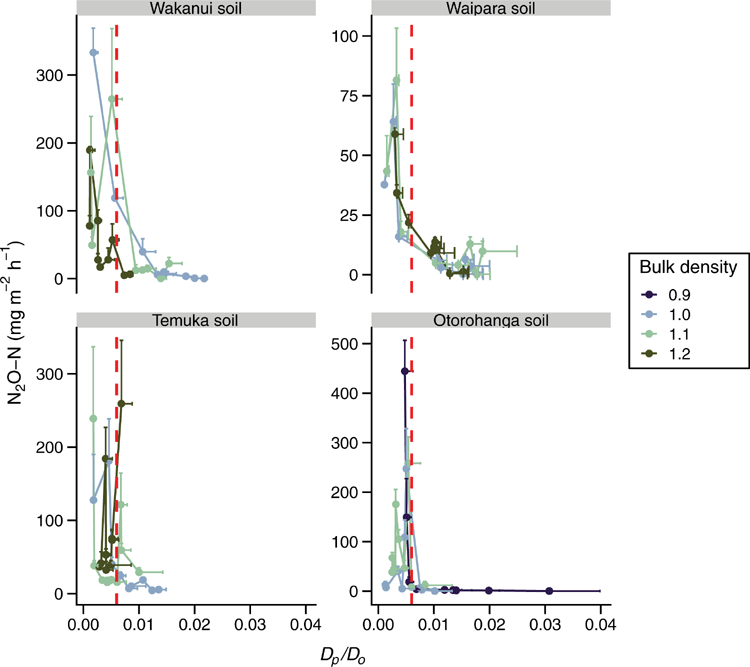
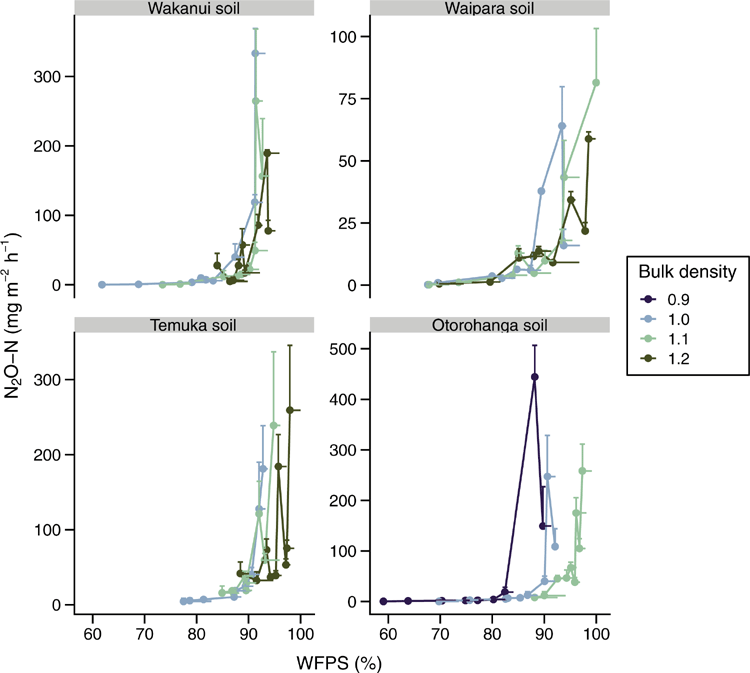
As Dp/Do declined, the N2O-N flux increased with peak N2O fluxes at a Dp/Do value close to or less than 0.006 (Fig. 7). Plotting N2O-N fluxes vs WFPS (Fig. 8) or volumetric soil water content (Fig. S2, available as Supplementary material) showed no clear relationship across soils or soil ρb; but N2O-N fluxes increased with increasing soil moisture, peak N2O-N fluxes occurred at varying WFPS or volumetric soil water content values depending on soil type and soil ρb (Fig. 8, Fig. S2).
Discussion
Soil chemical and physical characteristics
Minimum soil concentrations of NO3– and DOC, required to support denitrification in soil, have previously been reported to be ≥5 mg N kg–1 soil and 40 mg C kg–1 soil respectively (Beauchamp et al. 1980; Ryden 1983). High concentrations of NO3– increase the denitrification rate in the presence of a C substrate (Weier et al. 1993) because the DOC assumes the role of the electron donor during NO3– reduction under denitrifying conditions. Thus, based on the results of this experiment, it can be assumed that the soil NO3–-N and DOC concentrations, which were comparable in magnitude to those previously observed by Balaine et al. (2013), were not limiting for denitrification regardless of soil type or treatment.
Elevated soil pH values, observed in the higher soil ρb treatments, are consistent with such conditions creating more anaerobic conditions (lower Dp/Do and higher WFPS), suitable for denitrification which results in a net release of OH– ions (Wrage et al. 2001). Declines in soil pH with increasing soil drainage were likely the result of reduced denitrification rates or increased rates of mineralisation with ensuing nitrification and subsequent soil acidification as soils were drained.
Soil WFPS decreased as soil matric potential became more negative, with the rate of decrease lower at higher soil ρb because increasing soil ρb (compaction) not only decreases total porosity but also creates a shift in pore size distribution, observed as a reduction in macroporosity and an increase in microporosity (Chamindu Deepagoda et al. 2019b). This results in an increase in the air-entry pressure and a decrease in air-permeability making the soils relatively more anaerobic as soil ρb increases at a given soil matric potential. Soil texture also affects pore size distribution and the reason that the Waipara soil WFPS was less affected by increasing bulk density was most likely the higher sand content of this soil, facilitating the retention of a higher fraction of pore space with macroporosity.
Values of Dp/Do decreased when both soil ρb and soil matric potential increased, resulting in a concurrent decline in air-filled porosity and increasing soil moisture, which in turn enhanced tortuosity of the soil pore network (Chamindu Deepagoda et al. 2019a). Soil Dp/Do values were within the range previously observed for repacked soil cores held over a similar range of soil ρb and moisture (Balaine et al. 2013).
Soil N2O fluxes and relationships with soil physical parameters
Based on the prior studies of Balaine et al. (2013, 2016), it was hypothesised that soil N2O emissions would become elevated as Dp/Do decreased toward 0.006. Using only one soil type, Balaine et al. (2013) found that soil N2O fluxes peaked at Dp/Do of 0.006, regardless of soil ρb, and declined as Dp/Do decreased further. The increase in N2O fluxes occurred as the increasingly anaerobic conditions, as defined by a decline in Dp/Do, created an environment suitable for N2O production. The decline in N2O fluxes, as Dp/Do decreases further, has been shown to be due to N2O being denitrified to N2 (Klefoth et al. 2014; Balaine et al. 2016). In the current study, the interactive effects of soil ρb and soil matric potential generally resulted in enhanced N2O fluxes at Dp/Do close to 0.006, or less, but not necessarily peaking at 0.006. Thus, under the conditions of this study, the variation in the soil C content, postulated to potentially alter the level of O2 consumption, did not cause a significant shift in the Dp/Do value where N2O emissions readily increased. Following a freeze–thaw event, the presence of labile C inducing an increased O2 demand was postulated by Petersen et al. (2013) to be a reason for denitrification activity at Dp/Do > 0.02, a threshold normally considered to indicate the onset of anaerobiosis (Stepniewski 1981). However, Owens et al. (2017) found that in ruminant urine-affected soil, in situ, N2O fluxes also increased when the soil Dp/Do was ~0.006, despite labile C being supplied via plant root exudation. Chamindu Deepagoda et al. (2019a) found that N2O emissions peaked in intact soil cores taken from pastures over a Dp/Do range of 0.005–0.01. Friedl et al. (2018) also found N2O and N2 fluxes from subtropical dairy pasture soils increased exponentially as Dp/Do declined, with maximum N2O fluxes at Dp/Do of 0.0068. Hence, these current results examining a wider number of soils sit well with previous work and support the use of Dp/Do as an interpretive tool for understanding the occurrence of N2O emissions or for predicting the potential for N2O emissions given soil ρb and soil moisture data are available for calculating (e.g. Moldrup et al. 2013). The potential onset of soil N2O emissions has often been considered by determining the degree of WFPS; but, as Farquharson and Baldock (2008) explain, for a given WFPS the volume fraction of air varies depending on the soil ρb. The variable Dp/Do is an integrated measure of the interactive effects of soil ρb and WFPS on air-filled porosity and thus gas diffusion. Hence, the onset of N2O emissions occurs over a relatively wide range of WFPS. This was most noticeable in the Otorohonga soil.
However, the magnitude of the N2O fluxes, and the anticipated decline in the N2O fluxes occurring for Dp/Do < 0.006, was not consistent across soils. In the Otorohanga soil, where the highest N2O fluxes occurred, N2O emissions peaked at Dp/Do of 0.006 regardless of soil ρb and then declined; in the Waipara soil where the lowest N2O fluxes occurred, N2O emissions peaked at a similar Dp/Do, but < 0.006, regardless of soil ρb before declining. This variation in the magnitude and the decline in the N2O fluxes for Dp/Do < 0.006 may be due to other factors affecting the denitrification rate and the N2O : (N2O + N2) ratio. Soil O2 supply acts as the primary determinant of denitrification commencing. Friedl et al. (2018) found a shift in the N2O response to Dp/Do between days 1 and 2 after rewetting of subtropical pasture soils and proposed the presence of residual O2 on day 1 and increasing anaerobic conditions on day 2 to explain the proposed effect of Dp/Do on a relative shift in N2 : N2O partitioning. However, other soil variables, soil pH and anoxic C mineralisation, have also been shown to influence both the denitrification rate and the N2O : (N2O + N2) ratio in pasture soils, with liming and enhanced C supply promoting N2O reduction to N2 and denitrification rates (Samad et al. 2016; Senbayram et al. 2019). Conversely, elevated soil NO3– concentrations may prevent N2O reduction, thus enhancing N2O : (N2O + N2). Recently, this effect of soil NO3– concentration was shown to override the effect of liming with respect to N2O : (N2O + N2) in a sandy cropping soil; high concentrations of NO3– (45 mg N kg–1 soil) almost completely inhibited N2O reduction (Senbayram et al. 2019). Hence, the variation in the four soils used in the current study, in terms of the delayed or lack of N2O reduction, may have been a partial consequence of the relatively high soil NO3– concentrations enhancing N2O : (N2O + N2). Future research is needed to examine the role of these factors in altering N2O : (N2O + N2) with respect to the soil Dp/Do value. In conclusion, this study shows that across a range of soils, varying in texture and C content, the soil Dp/Do value is a valuable, and theoretically robust, tool for determining the onset of N2O emissions when denitrification substrates are present.
Conflicts of interest
The authors declare no conflicts of interest.
Acknowledgements
The authors gratefully acknowledge funding (SOW14-GPLER-SP198-LIN) from the New Zealand Fund for Global Partnerships in Livestock Emissions Research (GPLER), an international research fund set up by the New Zealand Government in support of the Global Research Alliance on Agricultural Greenhouse Gases (GRA). This paper forms part of the PhD thesis of Camille Rousset (2020).
References
Balaine N, Clough TJ, Beare MH, Thomas SM, Meenken ED, Ross JG (2013) Changes in relative gas diffusivity explain soil nitrous oxide flux dynamics. Soil Science Society of America Journal 77, 1496–1505.| Changes in relative gas diffusivity explain soil nitrous oxide flux dynamics.Crossref | GoogleScholarGoogle Scholar |
Balaine N, Clough TJ, Beare MH, Thomas SM, Meenken ED (2016) Soil gas diffusivity controls N2O and N2 emissions and their ratio. Soil Science Society of America Journal 80, 529–540.
| Soil gas diffusivity controls N2O and N2 emissions and their ratio.Crossref | GoogleScholarGoogle Scholar |
Beauchamp EG, Gale C, Yeomans JC (1980) Organic matter availability for denitrification in soils of different textures and drainage classes. Communications in Soil Science and Plant Analysis 11, 1221–1233.
| Organic matter availability for denitrification in soils of different textures and drainage classes.Crossref | GoogleScholarGoogle Scholar |
Blakemore LC, Searle PL, Daly BK (1987) ‘Methods for chemical analysis of soils. Vol. 80.’ (Manaaki-Whenua Press: Lincoln, New Zealand)
Butterbach-Bahl K, Baggs EM, Dannenmann M, Kiese R, Zechmeister-Boltenstern S (2013) Nitrous oxide emissions from soils: how well do we understand the processes and their controls? Philosophical Transactions of the Royal Society of London. Series B, Biological Sciences 368,
| Nitrous oxide emissions from soils: how well do we understand the processes and their controls?Crossref | GoogleScholarGoogle Scholar | 23713126PubMed |
Chamindu Deepagoda TKK, Jayarathne JRRN, Clough TJ, Thomas S, Elberling B (2019a) Soil-gas diffusivity and soil-moisture effects on N2O emissions from intact pasture soils. Soil Science Society of America Journal 83, 1032–1043.
| Soil-gas diffusivity and soil-moisture effects on N2O emissions from intact pasture soils.Crossref | GoogleScholarGoogle Scholar |
Chamindu Deepagoda TKK, Clough TJ, Thomas S, Balaine N, Elberling B (2019b) Density effects on soil‐water characteristics, soil‐gas diffusivity, and emissions of N2O and N2 from a re‐packed pasture soil. Soil Science Society of America Journal 83, 118–125.
| Density effects on soil‐water characteristics, soil‐gas diffusivity, and emissions of N2O and N2 from a re‐packed pasture soil.Crossref | GoogleScholarGoogle Scholar |
Ciais P, Sabine C, Bala G, Bopp L, Brovkin V, Canadell J, Chhabra A, DeFries R, Galloway J, Heimann M, Jones C, Le Quéré C, Myneni RB, Piao S, Thornton PE (2013) ‘Carbon and other biogeochemical cycles. The physical science basis.’ Contribution of Working Group I to the Fifth Assessment Report of the Intergovernmental Panel on Climate Change. (Cambridge University Press: Cambridge, UK)
Clough TJ, Ray JL, Buckthought LE, Calder J, Baird D, O’Callaghan M, Sherlock RR, Condron LM (2009) The mitigation potential of hippuric acid on N2O emissions from urine patches: An in situ determination of its effect. Soil Biology & Biochemistry 41, 2222–2229.
| The mitigation potential of hippuric acid on N2O emissions from urine patches: An in situ determination of its effect.Crossref | GoogleScholarGoogle Scholar |
Currie JA (1960) Gaseous diffusion in porous media. Part 1. A non-steady state method. British Journal of Applied Physics 11, 314–317.
| Gaseous diffusion in porous media. Part 1. A non-steady state method.Crossref | GoogleScholarGoogle Scholar |
Davidson EA (2009) The contribution of manure and fertilizer nitrogen to atmospheric nitrous oxide since 1860. Nature Geoscience 2, 659–662.
| The contribution of manure and fertilizer nitrogen to atmospheric nitrous oxide since 1860.Crossref | GoogleScholarGoogle Scholar |
Farquharson R, Baldock J (2008) Concepts in modelling N2O emissions from land use. Plant and Soil 309, 147–167.
| Concepts in modelling N2O emissions from land use.Crossref | GoogleScholarGoogle Scholar |
Friedl J, De Rosa D, Rowlings DW, Grace PR, Müller M, Scheer C (2018) Dissimilatory nitrate reduction to ammonium (DNRA), not denitrification dominates nitrate reduction in subtropical pasture soils upon rewetting. Soil Biology & Biochemistry 125, 340–349.
| Dissimilatory nitrate reduction to ammonium (DNRA), not denitrification dominates nitrate reduction in subtropical pasture soils upon rewetting.Crossref | GoogleScholarGoogle Scholar |
Hao X, Ball BC, Culley JLB, Carter MR, Parkin GW (2008) Soil density and porosity. In ‘Soil sampling and methods of analysis’. 2nd edn. (Eds MR Carter, EG Gregorich) pp. 743–759. (Taylor & Francis Group: Boca Raton, FL, USA)
Hink L, Gubry-Rangin C, Nicol GW, Prosser JI (2018) The consequences of niche and physiological differentiation of archaeal and bacterial ammonia oxidisers for nitrous oxide emissions. The ISME Journal 12, 1084–1093.
| The consequences of niche and physiological differentiation of archaeal and bacterial ammonia oxidisers for nitrous oxide emissions.Crossref | GoogleScholarGoogle Scholar | 29386627PubMed |
Hutchinson GL, Mosier AR (1981) Improved soil cover method for field measurement of nitrous oxide fluxes. Soil Science Society of America Journal 45, 311–316.
| Improved soil cover method for field measurement of nitrous oxide fluxes.Crossref | GoogleScholarGoogle Scholar |
Klefoth RR, Clough TJ, Oenema O, Van Groenigen JW (2014) Soil bulk density and moisture content influence relative gas diffusivity and the reduction of nitrogen-15 nitrous oxide. Vadose Zone Journal 13, vzj2014.07.0089
| Soil bulk density and moisture content influence relative gas diffusivity and the reduction of nitrogen-15 nitrous oxide.Crossref | GoogleScholarGoogle Scholar |
Kroetsch D, Wang C (2008) Particle Size Distribution. In ‘Soil sampling and methods of analysis’. 2nd edn. (Eds MR Carter, EG Gregorich) pp. 713–725. (Taylor & Francis Group: Boca Raton, FL, USA)
Lilburne LR, Hewitt A, Webb T (2012) Soil and informatics science combine to develop S-map: a new generation soil information system for New Zealand. Geoderma 170, 232–238.
| Soil and informatics science combine to develop S-map: a new generation soil information system for New Zealand.Crossref | GoogleScholarGoogle Scholar |
Moldrup P, Chamindu Deepagoda TKK, Hamamoto S, Komatsu T, Kawamoto K, Rolston DE, de Jonge LW (2013) Structure-dependent water-induced linear reduction model for predicting gas diffusivity and tortuosity in repacked and intact soil. Vadose Zone Journal 12, 1–11.
| Structure-dependent water-induced linear reduction model for predicting gas diffusivity and tortuosity in repacked and intact soil.Crossref | GoogleScholarGoogle Scholar |
NOAA (2020) Global Monitoring Laboratory, Earth System Research Laboratories, nitrous oxide (N2O) combined data set. Available at https://www.esrl.noaa.gov/gmd/hats/combined/N2O.html [verified 6 June 2020].
Owens J, Clough TJ, Laubach J, Hunt JE, Venterea RT, Phillips RL (2016) Nitrous oxide fluxes, soil oxygen, and denitrification potential of urine- and non-urine-treated soil under different irrigation frequencies. Journal of Environmental Quality 45, 1169–1177.
| Nitrous oxide fluxes, soil oxygen, and denitrification potential of urine- and non-urine-treated soil under different irrigation frequencies.Crossref | GoogleScholarGoogle Scholar | 27380064PubMed |
Owens J, Clough TJ, Laubach J, Hunt JE, Venterea RT (2017) Nitrous oxide fluxes and soil oxygen dynamics of soil treated with cow urine. Soil Science Society of America Journal 81, 289–298.
| Nitrous oxide fluxes and soil oxygen dynamics of soil treated with cow urine.Crossref | GoogleScholarGoogle Scholar |
Petersen SO, Ambus P, Elsgaard L, Schjønning P, Olesen JE (2013) Long-term effects of cropping system on N2O emission potential. Soil Biology & Biochemistry 57, 706–712.
| Long-term effects of cropping system on N2O emission potential.Crossref | GoogleScholarGoogle Scholar |
Ravishankara AR, Daniel JS, Portmann RW (2009) Nitrous oxide (N2O): the dominant ozone-depleting substance emitted in the 21st century. Science 326, 123–125.
| Nitrous oxide (N2O): the dominant ozone-depleting substance emitted in the 21st century.Crossref | GoogleScholarGoogle Scholar | 19713491PubMed |
Rolston DE, Moldrup P (2002) Gas diffusivity. In ‘Methods of soil analysis, Part 4, Physical methods’. (Eds. GC Topp, JH Dane JH) pp. 113–1139. (Soil Science Society of America: Madison, WI, USA)
Romano N, Hopmans JW, Dane GH (2002) Water retention and storage. In ‘Methods of soil analysis, Part 4, Physical methods’. (Eds. GC Topp, JH Dane JH) pp. 692–698. (Soil Science Society of America: Madison, WI, USA)
Ryden JC (1983) Denitrification loss from a grassland soil in the field receiving different rates of nitrogen a s ammonium-nitrate. Journal of Soil Science 34, 355–365.
| Denitrification loss from a grassland soil in the field receiving different rates of nitrogen a s ammonium-nitrate.Crossref | GoogleScholarGoogle Scholar |
Samad MS, Bakken LR, Nadeem S, Clough TJ, De Klein CAM, Richards KG, Lanigan GJ, Morales SE (2016) High-resolution denitrification kinetics in pasture soils link N2O emissions to pH, and denitrification to C mineralization. PLoS One 11,
| High-resolution denitrification kinetics in pasture soils link N2O emissions to pH, and denitrification to C mineralization.Crossref | GoogleScholarGoogle Scholar | 26990862PubMed |
Senbayram M, Budai A, Bol R, Chadwick D, Marton L, Gündogan R, Wua D (2019) Soil NO3− level and O2 availability are key factors in controlling N2O reduction to N2 following long-term liming of an acidic sandy soil. Soil Biology & Biochemistry 132, 165–173.
| Soil NO3− level and O2 availability are key factors in controlling N2O reduction to N2 following long-term liming of an acidic sandy soil.Crossref | GoogleScholarGoogle Scholar |
Stein LY (2019) Insights into the physiology of ammonia-oxidizing microorganisms. Current Opinion in Chemical Biology 49, 9–15.
| Insights into the physiology of ammonia-oxidizing microorganisms.Crossref | GoogleScholarGoogle Scholar | 30236860PubMed |
Stepniewski W (1981) Oxygen diffusion and the strength as related to soil compaction. II Oxygen diffusion coefficient. Polish Journal of Soil Science 14, 3–13.
Weier KL, MacRae IC, Myers RJK (1993) Denitrification in a clay soil under pasture and annual crop: losses from 15N-labelled nitrate in the subsoil in the field using C2H2 inhibition. Soil Biology & Biochemistry 25, 999–1004.
| Denitrification in a clay soil under pasture and annual crop: losses from 15N-labelled nitrate in the subsoil in the field using C2H2 inhibition.Crossref | GoogleScholarGoogle Scholar |
Wrage N, Velthof GL, Van Beusichem ML, Oenema O (2001) Role of nitrifier denitrification in the production of nitrous oxide. Soil Biology & Biochemistry 33, 1723–1732.
| Role of nitrifier denitrification in the production of nitrous oxide.Crossref | GoogleScholarGoogle Scholar |
Wrage-Mönnig N, Horn MA, Well R, Muller C, Velthof G, Oenema O (2018) The role of nitrifier denitrification in the production of nitrous oxide revisited. Soil Biology & Biochemistry 123, A3–A16.
| The role of nitrifier denitrification in the production of nitrous oxide revisited.Crossref | GoogleScholarGoogle Scholar |
Zhu X, Burger M, Doaneb TA, Howarth WR (2013) Ammonia oxidation pathways and nitrifier denitrification are significant sources of N2O and NO under low oxygen availability. Proceedings of the National Academy of Sciences of the United States of America 110, 6328–6333.
| Ammonia oxidation pathways and nitrifier denitrification are significant sources of N2O and NO under low oxygen availability.Crossref | GoogleScholarGoogle Scholar | 23576736PubMed |
Zumft WG (1997) Cell biology and molecular basis of denitrification. Microbiology and Molecular Biology Reviews 61, 533–616.
| Cell biology and molecular basis of denitrification.Crossref | GoogleScholarGoogle Scholar | 9409151PubMed |


