

ShinySperm: navigating the sperm proteome landscape
David A. Skerrett-Byrne A B C D * , Raffaele Teperino C D and Brett Nixon A B
A
B
C
D
Abstract
Integrated omics studies hold a crucial role in improving our understanding of reproductive biology. However, the complex datasets so generated are often only accessible via supplementary data files, which lack the capacity for interactive features to allow users to readily interrogate and visualise data of interest.
The intent of this technical note was to develop an interactive web-based application that enables detailed interrogation of a representative sperm proteome, facilitating a deeper understanding of the proteins identified, their relative abundance, classifications, functions, and associated phenotypes.
We developed a Shiny web application, ShinySperm (https://reproproteomics.shinyapps.io/ShinySperm/), utilising R and several complementary libraries for data manipulation (dplyr), interactive tables (DT), and visualisation (ggplot2, plotly). ShinySperm features a responsive user interface, dynamic filtering options, interactive charts, and data export capabilities.
ShinySperm allows users to interactively search, filter, and visualise sperm proteomics data based on key features (e.g. protein classification, sperm cell domain, presence, or absence at different maturation stages). This application responds live to filtering options and enables the generation of interactive plots and tables, thus enhancing user engagement and understanding of the data.
ShinySperm provides a robust platform for the dynamic exploration of epididymal sperm proteome data. It significantly improves accessibility and interpretability of complex datasets, allowing for effective data-driven insights.
This technical note highlights the potential of interactive web applications in reproductive biology and provides a plug and play script for the field to produce applications for meaningful researcher interaction with complex omic datasets.
Keywords: epididymis, fertility, male fertility, proteomics, publicly accessible data, ShinySperm app, sperm, sperm maturation, sperm proteome.
Introduction
Omics research has been at the heart of dissecting complex biological and medical questions over recent decades. The field of reproductive biology is no different, having been the focus for multiple large-scale omics-based studies encompassing the sub-disciplines of genomics, transcriptomics, proteomics, and metabolomics. Taking proteomics as a specific example, the field of reproductive biology has witnessed a 20.6-fold increase in the application of this technology platform over the past 20 years; increasing from 36 publications in 2003 to 740 in 2023, amounting to a grand total of 8,494 publications as of April 2024 (Fig. 1a). A key consideration in terms of maximising the utility of this burgeoning body of omic data is to ensure the generated datasets are publicly available and presented in a format that encourages user interaction. Such a practice of enabling individuals to intuitively interact with the omic data not only enables meaningful comparisons to be drawn between different experimental regimens but ultimately encourages collaboration among the research community.
(a) Timeline of publications based on PubMed search using ‘proteomics’ with keywords ‘reproduction’, ‘male reproduction’, or ‘female reproduction’. (b) Pie chart depicts the distribution of publicly available sperm proteomic datasets across species.
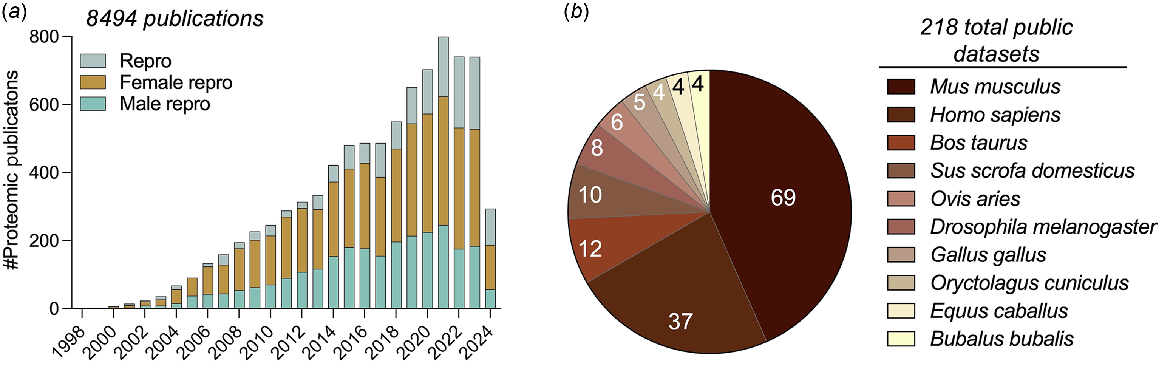
In the proteomics field, the ProteomeXchange (Deutsch et al. 2019) platform was set up to serve this purpose, providing an interface to upload RAW mass spectral data along with the processing of results. Focusing on sperm biology as an example, the ProteomeXchange open access resource currently houses 218 datasets across 68 diverse species (Fig. 1b) including mouse (Skerrett-Byrne et al. 2022), human (Vandenbrouck et al. 2016), boar (Zhang et al. 2022), ram (Pini et al. 2018), koala (Skerrett-Byrne et al. 2021), crocodile (Nixon et al. 2019a), dolphin (Fuentes-Albero et al. 2021), and the fruit fly (Garlovsky et al. 2022). Notably, despite the ProteomeXchange consortium having been established in 2012, among the 1,639 publications identified via a PubMed search with the keywords ‘sperm’ and ‘proteomics’, only approximately 13% (i.e. 216 publications) have directly deposited their RAW data files into this publicly available repository. While this high attrition rate undoubtedly limits the widespread use of the RAW sperm proteomic data generated to date, there does remain a wealth of curated information available.
To realise the full potential of these important omic datasets, we contend that more intuitive interactive platforms are needed beyond that of embedded tables or supplementary tables, such that the data can be harnessed by all researchers without the necessity for highly specialised bioinformatic skillsets. With this goal in mind, we have developed a prototype interactive web-based application, termed ShinySperm, utilising a complex sperm proteomic dataset as our template (Skerrett-Byrne et al. 2022). By incorporating in silico data analysis tools, the ShinySperm interface facilitates a deeper understanding of the proteomic data and allows for the extraction of meaningful information that can be readily tailored to the nuanced research question of interest. Specifically, the original proteomic dataset was generated to provide molecular insight into processes that underpin the functional maturation of mouse spermatozoa as they transverse the highly specialised extra-testicular ductal system known as the epididymis (Nixon et al. 2020). For this purpose, highly enriched populations of epididymal sperm were collected from the proximal caput segment (functionally immature) and the distal cauda segment (functionally mature) before being subjected to quantitative proteomic analyses. Given the transcriptionally and translationally quiescent state of epididymal sperm cells (Hermo et al. 2010), the original study sought to understand the extent of remodelling that occurs to the sperm proteomic architecture arising from interactions with the luminal plasma in which they are bathed (Bedford 2015; Battistone et al. 2019), including important contributions from extracellular vesicles (Zhou et al. 2018; Nixon et al. 2019b).
Methods
Application development and user interface
The ShinySperm application was built using the shiny package (ver. 1.8.1) on RStudio (ver. 2023.12.1), with base R (ver. 4.3.3). Supporting the functionality and aesthetics of this application are several packages, including: DT, ploty, RColorBrewer, dplyr, ggplot2, and shinythemes. The user interface is defined using Shiny’s fluidPage function, which allows for a responsive layout.
The title panel includes a custom logo. The navigation of the application is facilitated by tabsetPanel allowing the addition of multiple interlinked tabs, including ‘Epididymal Sperm Proteome’, ‘Volcano Plot’, ‘Phenotypes’, and ‘Functions’. Each subpanel contains interactive elements such as search boxes, dropdown menus for filtering, and checkboxes to enable specific selections based on gene symbols, protein types, and sperm cell-specific locations.
Dataset source
The epididymal sperm proteomic datasets uploaded to the ShinySperm app, alongside their in silico components, were sourced from Skerrett-Byrne et al. (2022). These table/files were imported into the ShinySperm application as comma-separated value (CSV) files (Supplementary Tables S1–S3).
Data handling, visualisation, and export
ShinySperm integrates several R packages for data handling, visualisation, and export functionality. The DT package provides interactive tables, which are utilised to display searchable and sortable data tables. The dplyr package is used for data interrogation, including filtering and sorting datasets based on user input. For static and interactive visualisations of these datasets, ggplot2 and plotly are employed, respectively. These software packages enable the generation of pie charts, volcano plots, and heatmaps, all with the embedded capacity to display additional information as the user hovers a mouse over the relevant element. User interactions, such as text inputs for gene symbol searches and selections from dropdown menus, trigger reactive expressions defined in the server logic. These expressions dynamically update the data displayed in both the data tables and the visual plots, reflecting user-specified filters and searches.
The ShinySperm application offers data export functionality, allowing users to download filtered datasets and specific visualisations (Table 1). This is achieved using Shiny’s downloadHandler function and the package openxlsx, which together dynamically generate downloadable Microsoft Excel files based on the current state of data filtering, along with the capacity to add a descriptor sheet to the Excel file.
| Panel | File name | Output type | Description | |
|---|---|---|---|---|
| Epididymal sperm proteome | Epididymal_sperm_proteome_Date | Excel | Provides the full complement of protein information in the interactive table. As the user filters the table, the export will reflect the imposed filters. | |
| Volcano plot | newplot | PNG | Reactive to filtering on the first panel, the volcano plot can be exported. | |
| Phenotypes | Epididymal_phenotypes_Date | Excel | Intergrates the interactive table with any mapping phenotypes. Each sperm protein along with its associated phenotype(s) are provided as individual rows for easier offline analysis. | |
| Phenotypes | newplot | PNG | Reactive to filtering on the first panel, the phenotype pie chart can be exported. | |
| Functions | Epididymal_functions_Date | Excel | Intergrates the interactive table with any mapped reproductive functions. Each sperm protein with its function(s) are provided as individual rows for easier offline analysis. | |
| Functions | newplot | PNG | Reactive to filtering on the first panel, the functions heatmap can be exported. |
Results
The ShinySperm application (https://reproproteomics.shinyapps.io/ShinySperm/) was developed to facilitate the interactive exploration of a representative sperm proteomic dataset. Importantly, to move beyond the restrictions imposed by a series of Supplementary Tables and Figures that are traditionally included in publications, our aim was to incorporate multiple in silico analyses relevant to the publication into a user-friendly interactive platform. Moreover, to help disseminate this approach, our aim was to provide a plug and play script for researchers to produce similar applications for their own complex omic datasets. Accordingly, the full coding script has been made available for download from GitHub. This includes notes and annotations designed to help guide the user in relation to each function and how to alter and modify these to tailor the end application for their own specific datasets (https://github.com/DavidSBEire/ShinySperm).
Main panel: interactive proteomic dataset
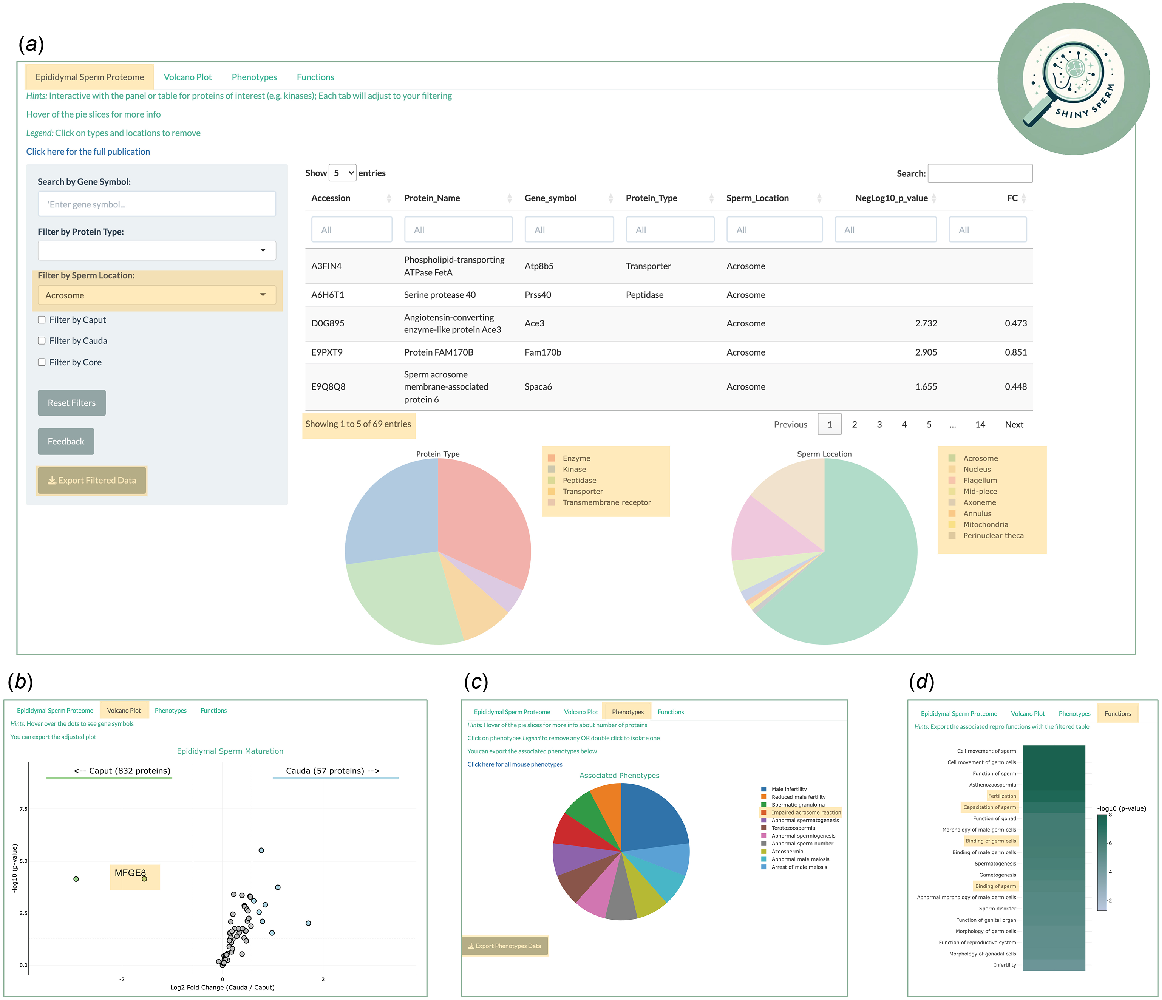
Three files are required to achieve the sum of this application: the original proteomic dataset (Table S1), the associated phenotypes of each protein (Table S2), and the Ingenuity Pathway Analysis (IPA) reproductive outputs (Table S3). Each file can be modified easily at the user’s discretion, but in this case, we focused on alignment with key aspects of the original publication (Skerrett-Byrne et al. 2022). In the main Panel of the application, the user is presented with the interaction table, a ‘live’ version of the proteomic dataset (Table S1), which contains unique identifiers (UniProt Accessions), protein names, gene symbols, protein types, known sperm location, and the comparative quantitative data of the maturing sperm cells: caput (immature) and cauda (mature) (Fig. 2a). Each column has a search feature, whilst the comparison data of fold change and P-value have a sliding scale indicative of the available range. Simultaneously, the dataset is graphed as two pie charts below the table, one for ‘protein type’ and another for ‘sperm cell location’. Both pie charts harbour interactive qualities, such that hovering a mouse over a pie slice reveals both the number and percentage of proteins mapping to that protein type or sperm cell location. The supporting legend facilitates the ability to deselect any groups not of interest (single click), or to focus on a group of interest (double click).
Illustrative example of a user enquiry. (a) Filtered interactive table for sperm acrosome proteins leading to reactive data visualisation of (b) volcano plot, (c) associated phenotypes, and (d) reproductive functions. The golden boxes highlight the points of interest discussed in user example section.
Supporting the table and pie charts is a panel on the left side, providing a search and filter feature. Importantly, any searches or filters performed are reflected instantly in both the table and pie charts. The user has the capacity to search specific gene symbols (e.g. RhoA), filter by protein type (e.g. kinases), and sperm location (e.g. acrosome). In accordance with the findings of the original publication, the user can filter for the full complement of proteins identified in populations of either caput or cauda epididymal sperm, as well as the core sperm proteins retained during maturation. Additionally, the panel provides the capacity to rest all filtering, export the filtered or unfiltered data (Table 1), and importantly, a feedback mechanism facilitating contact with the author of the application.
This panel is the core hub supporting the subsequent tabs. Any searches or filters in the left-hand side panel are promptly adjusted across each of the subsequent tabs.
Side panels: reactive data visualisation
Extending the data presented on the main panel are three side tabs, which are composed of ‘Volcano Plot’, ‘Phenotypes’, and ‘Functions’ (Fig. 2b–d). As indicated by the name, the ‘Volcano Plot’ graphs the comparative data from the interactive table (Fig. 2b). Without filtering, the ggplot package renders the full comparative proteome as an interactive volcano plot. Complemented with aesthetical features, the code provides the capacity to indicate thresholds of significance (FC ± 1.5, P-value ≤ 0.05), colouration to groups of proteins of interest, and visual guides on the graph (arrows and text). Hovering a mouse over each dot point provides the user with the associate gene symbol of the corresponding protein. Additionally, the graph can be exported as a PNG file (Table 1). Integral to the interactive aspect of the application, the volcano plot will react in live time to any filters or searches imposed on the main panel.
Table S2 provides the information that serves as the basis for the phenotypes tab, which links back to the interactive table via a common column, UniProt Accession. The application renders a pie chart of all mapped phenotypes to the identified epididymal sperm proteins, with the same features as the main panel (i.e. hovering a mouse over pie slices) (Fig. 2c). The full repertoire of phenotypes can be exported as an Excel file (Table 1), and likewise, is reactive to any filters imposed on the main panel. The exported file integrates the interactive table with any mapping phenotypes, whereby each sperm protein with its associated phenotype(s) is provided as individual rows. Furthermore, the pie chart can be exported as a PNG file.
The final subpanel leverages the data contained in Table S3, again unified by the common column of UniProt Accession. This IPA file also contains function annotation (reproductive focused), enrichment score of function (−log10P-value), and the predictive activation score (z-score) (Krämer et al. 2013). The application renders these data as a heatmap, displaying the top 20 functions, reactive to filtering and searches performed, with the colour gradient indicative of the enrichment value of that function (Fig. 2d). As with the previous panels, this figure can be exported as either a PNG or Excel file (Table 1). Likewise, the exported Excel file integrates the interactive table with any mapped reproductive function and its associated enrichment and z-score where applicable.
User example
To illustrate the capacity of ShinySperm, Fig. 2 sets out an example case of a user interested in epididymal sperm proteins known to be located in the acrosome. By filtering for acrosome via the side panel under ‘Sperm location’, the interactive table returns 69 proteins and adjusts the pie charts below reflecting the protein type and other known sperm cell locations of those proteins (Fig. 2a). This refined proteome can be extracted via the export button, which reveals six proteins that are apparently lost from the sperm proteome during epididymal maturation and a further four proteins that are gained by the maturing sperm cells. The remaining 59 proteins can be further explored under the ‘Volcano Plot’ tab, which has been adjusted to reflect that filtered dataset (Fig. 2b). All proteins which meet those significant thresholds are coloured by their respective decrease or increase coincident with epididymal maturation. The user can hover a mouse over each protein dot to obtain the gene symbol as highlighted in the gold box, revealing milk fat globule-EGF factor 8 (MFGE8) protein ligand, an important mediator of macromolecular cargo exchange between extracellular vesicles, known as epididymosomes, and maturing epididymal spermatozoa (Nixon et al. 2019b; Trigg et al. 2021).
Progressing to the next subpanel, ‘Phenotypes’, the user is presented with a modified pie chart of all phenotypes mapping to the 69 sperm acrosome proteins, chief amongst them being impaired acrosome reaction (Fig. 2c). Hovering a mouse over the red slice informs the user that only one protein matches to this phenotype. To provide a more detailed summary of phenotypes, a modified Excel file can be exported that includes all of the phenotypic relationships linked to the subset of targeted sperm proteins. The final subpanel renders all significant reproductive functions related to those acrosome sperm proteins as a heatmap (Fig. 2d). Notably, in this example the ‘Functions’ panel identified crucial functions pertaining to acrosome reaction, including ‘capacitation’, ‘fertilisation’, and ‘binding’ of sperm. Finally, the user once more can export these data as an Excel file, providing a stratified approach to their biological exploration of the data.
Conclusion
ShinySperm demonstrates the benefit of embracing powerful computation tools to provide the field with user-friendly interactive interfaces that interweave complex omics data with their in silico analyses. Our hope is that the provision of these intuitive platforms will greatly enhance the accessibility and interpretability of complex omic datasets, thereby maximising the benefit and mitigating the loss of such important data. Moreover, here we provide the blueprint for others to build these platforms without requiring deep coding knowledge. The R script we provide is fully annotated with notes to help guide users to swap, edit, and add to, thus expanding the capabilities of their data (https://github.com/DavidSBEire/ShinySperm).
Data availability
The mass spectrometry proteomics data described in the report is readily available on the PRIDE partner repository with the dataset identifier PXD028834 and the processed Excel files from Skerrett-Byrne et al. (2022). The full coding script supporting this Shiny application can be downloaded from GitHub, which includes notes and annotations to guide the user about each function (https://github.com/DavidSBEire/ShinySperm). All data processing is performed within R to ensure platform independence. The application has been tested on RStudio, ver. 2023.12.1, with base R 4.3.3 and Shiny 1.8.1. All supporting data is freely available at web-application named ShinySperm (https://reproproteomics.shinyapps.io/ShinySperm/).
Declaration of funding
National Health and Medical Research Council (NHMRC) Ideas Grants APP2027880, awarded to B.N., and an NHMRC Emerging Leadership Fellowship (APP2034392) awarded to D.A.S.B.
Acknowledgements
We thank Dr John Schjenken, Dr Heather Murray, Dr Elizabeth Bromfield, Jessica Mulhall, and Shefa’ Aljabali for their support as beta-testers of the ShinySperm application reported herein.
References
Battistone MA, Spallanzani RG, Mendelsohn AC, Capen D, Nair AV, Brown D, Breton S (2019) Novel role of proton-secreting epithelial cells in sperm maturation and mucosal immunity. Journal of Cell Science 133(5), jcs233239.
| Crossref | Google Scholar |
Bedford JM (2015) The epididymis re-visited: a personal view. Asian Journal of Andrology 17(5), 693-698.
| Crossref | Google Scholar | PubMed |
Deutsch EW, Bandeira N, Sharma V, Perez-Riverol Y, Carver JJ, Kundu DJ, García-Seisdedos D, Jarnuczak AF, Hewapathirana S, Pullman BS, Wertz J, Sun Z, Kawano S, Okuda S, Watanabe Y, Hermjakob H, MacLean B, MacCoss MJ, Zhu Y, Ishihama Y, Vizcaíno JA (2019) The ProteomeXchange consortium in 2020: enabling ‘big data’ approaches in proteomics. Nucleic Acids Research 48(D1), D1145-D1152.
| Crossref | Google Scholar |
Fuentes-Albero MC, González-Brusi L, Cots P, Luongo C, Abril-Sánchez S, Ros-Santaella JL, Pintus E, Ruiz-Díaz S, Barros-García C, Sánchez-Calabuig MJ, García-Párraga D, Avilés M, Izquierdo Rico MJ, García-Vázquez FA (2021) Protein identification of spermatozoa and seminal plasma in bottlenose dolphin. Frontiers in Cell Developmental Biology 9, 673961.
| Crossref | Google Scholar |
Garlovsky MD, Sandler JA, Karr TL (2022) Functional diversity and evolution of the drosophila sperm proteome. Molecular & Cellular Proteomics 21(10), 100281.
| Crossref | Google Scholar | PubMed |
Hermo L, Pelletier R-M, Cyr DG, Smith CE (2010) Surfing the wave, cycle, life history, and genes/proteins expressed by testicular germ cells. Part 2: changes in spermatid organelles associated with development of spermatozoa. Microscopy Research and Technique 73(4), 279-319.
| Crossref | Google Scholar | PubMed |
Krämer A, Green J, Pollard J, Jr, Tugendreich S (2013) Causal analysis approaches in ingenuity pathway analysis. Bioinformatics 30(4), 523-530.
| Crossref | Google Scholar | PubMed |
Nixon B, Johnston SD, Skerrett-Byrne DA, Anderson AL, Stanger SJ, Bromfield EG, Martin JH, Hansbro PM, Dun MD (2019a) Modification of crocodile spermatozoa refutes the tenet that post-testicular sperm maturation is restricted to mammals. Molecular & Cellular Proteomics 18(Suppl 1), S58-S76.
| Crossref | Google Scholar | PubMed |
Nixon B, De Iuliis GN, Hart HM, Zhou W, Mathe A, Bernstein IR, Anderson AL, Stanger SJ, Skerrett-Byrne DA, Jamaluddin MFB, Almazi JG, Bromfield EG, Larsen MR, Dun MD (2019b) Proteomic profiling of mouse epididymosomes reveals their contributions to post-testicular sperm maturation. Molecular & Cellular Proteomics 18(Suppl 1), S91-S108.
| Crossref | Google Scholar | PubMed |
Nixon B, Cafe SL, Eamens AL, De Iuliis GN, Bromfield EG, Martin JH, Skerrett-Byrne DA, Dun MD (2020) Molecular insights into the divergence and diversity of post-testicular maturation strategies. Molecular and Cellular Endocrinology 517, 110955.
| Crossref | Google Scholar | PubMed |
Pini T, Rickard JP, Leahy T, Crossett B, Druart X, de Graaf SP (2018) Cryopreservation and egg yolk medium alter the proteome of ram spermatozoa. Journal of Proteomics 181, 73-82.
| Crossref | Google Scholar | PubMed |
Skerrett-Byrne DA, Anderson AL, Hulse L, Wass C, Dun MD, Bromfield EG, De Iuliis GN, Pyne M, Nicolson V, Johnston SD, Nixon B (2021) Proteomic analysis of koala (Phascolarctos cinereus) spermatozoa and prostatic bodies. Proteomics 21(19), e2100067.
| Crossref | Google Scholar | PubMed |
Skerrett-Byrne DA, Anderson AL, Bromfield EG, Bernstein IR, Mulhall JE, Schjenken JE, Dun MD, Humphrey SJ, Nixon B (2022) Global profiling of the proteomic changes associated with the post-testicular maturation of mouse spermatozoa. Cell Reports 41(7), 111655.
| Crossref | Google Scholar | PubMed |
Trigg NA, Stanger SJ, Zhou W, Skerrett-Byrne DA, Sipilä P, Dun MD, Eamens AL, De Iuliis GN, Bromfield EG, Roman SD, Nixon B (2021) A novel role for milk fat globule-EGF factor 8 protein (MFGE8) in the mediation of mouse sperm-extracellular vesicle interactions. Proteomics 21(13–14), e2000079.
| Crossref | Google Scholar | PubMed |
Vandenbrouck Y, Lane L, Carapito C, Duek P, Rondel K, Bruley C, Macron C, Gonzalez de Peredo A, Couté Y, Chaoui K, Com E, Gateau A, Hesse A-M, Marcellin M, Méar L, Mouton-Barbosa E, Robin T, Burlet-Schiltz O, Cianferani S, Ferro M, Fréour T, Lindskog C, Garin J, Pineau C (2016) Looking for missing proteins in the proteome of human spermatozoa: an update. Journal of Proteome Research 15(11), 3998-4019.
| Crossref | Google Scholar | PubMed |
Zhang M, Chiozzi RZ, Skerrett-Byrne DA, Veenendaal T, Klumperman J, Heck AJR, Nixon B, Helms JB, Gadella BM, Bromfield EG (2022) High resolution proteomic analysis of subcellular fractionated boar spermatozoa provides comprehensive insights into perinuclear theca-residing proteins. Frontiers in Cell and Developmental Biology 10, 836208.
| Crossref | Google Scholar | PubMed |
Zhou W, De Iuliis GN, Dun MD, Nixon B (2018) Characteristics of the epididymal luminal environment responsible for sperm maturation and storage. Frontiers in Endocrinology 9, 59.
| Crossref | Google Scholar |