

Reintroduction to the edge of its range: quenda (Isoodon fusciventer) to Wadderin Sanctuary in the eastern wheatbelt of Western Australia
Jeff Short A *
A *
A
Abstract
Quenda (bandicoots, Isoodon fusciventer) have shown a major decline in range since European settlement, contracting to the more mesic coastal and forest zones in south-west Western Australia. Key actions to recover this species include broad-scale fox control, cat control and reintroductions. Most reintroductions have been to coastal and forest habitats.
To monitor the reintroduction of quenda to fox-free habitat of Wadderin Sanctuary in the wheatbelt of Western Australia, close to the eastern and drier margin of the species’ former range.
Relative abundance of the population was monitored over a 12-year period by regular standardised trapping throughout the sanctuary.
Quenda were reintroduced in 2010 and have persisted for >12 years. They were protected from fox predation by an exclusion fence, but were subject to a low level of cat predation for the first 8 years. Quenda showed both a ~20% drop in mean body condition over time and a trend of decreasing number of pouch young per female over time, likely a result of a succession of dry years and intra-and inter-specific competition for food resources. However, despite this, the index of abundance suggests that quenda numbers substantially increased, aided by high annual recruitment, in years following removal of the feral cat.
Quenda appear resilient at this site despite consecutive years of very low rainfall and apparent competition for food resources.
Quenda seem able to persist on the drier margin of their former range when protected from high levels of predation.
Keywords: bandicoot, climatic margin, demography, feral cat, predator exclusion, range limits, sanctuary, SECR, translocation.
Introduction
Until recently, quenda (bandicoots, Isoodon fusciventer) were considered a sub-species of the Southern Brown Bandicoot (Isoodon obesulus) (Travouillon and Warburton 2023), which were once widely distributed in south-west Western Australia, but have largely retreated to the mesic coastal and forest fringes. The species prefers dense understorey vegetation as cover in forest, woodland, shrub, heath and wetland-fringe communities (Paull 2008; Woinarski et al. 2014). Quenda are omnivorous, digging for their food (invertebrates, fungi, root material, bulbs) as well as feeding on fruit and seeds sourced on the ground surface. They are largely nocturnal, sheltering during the day in dome-shaped nests in a shallow scrape under vegetation (Paull 2008).
Quenda are threatened by a range of factors including habitat loss (due to urbanisation on the Swan Coastal Plain near Perth and historically to farming in the wheatbelt east of Perth), predation from foxes (Vulpes vulpes) and feral cats (Felis catus), and increased fire frequency that reduces the density of understorey vegetation (Paull 2008). However, quenda are believed to have increased significantly in recent years at sites where fox control is in place (Morris et al. 1998; Orell 2004) as well as in peri-urban and urban environments (Travouillon and Warburton 2023).
The conservation status of quenda has been downgraded from ‘Near Threatened’ in 1992 to of ‘Least Concern’ in 2002 (Woinarski et al. 2014) at a national level and Priority 4 (rare, near threatened and in need of monitoring) at the state level (Lohr and Valentine 2017). Its current range tends to hug the mesic fringe of south-west Western Australia; while drier areas away from the coast (agricultural areas known colloquially as ‘wheatbelt’) are regarded largely as former distribution not occupied since land clearing associated with European settlement (Travouillon and Warburton 2023).
Quenda is a species that is commonly translocated (Morris et al. 2015; Lohr and Valentine 2017), in part due to the number of individuals available from land clearing for housing and other developments in and around Perth (‘salvage translocations’) or from sites where quenda is deemed a pest species. However, little information is available on the long-term fate of reintroductions, despite reviews suggesting the importance of long-term monitoring (Fischer and Lindenmayer 2000; Short 2009; Sheean et al. 2012; Bubac et al. 2019).
This study details the fate of a population of quenda for 12 years after reintroduction to a managed wheatbelt remnant. This release is close to the geographic and climatic margin of the species’ historical range in Western Australia (Friend 1990).
Reintroduction to the edge of the range potentially involves greater risks to success than those to the core range of the species. Griffith et al. (1989) found that the release of species to the periphery of a species range were substantially less successful than those to the core of the range (48% vs 76%; n = 187). It is likely that there is increased intensity of one or more limiting factors as one moves from the core of a species’ range to the boundary. Demographic explanations for range limits often include inadequate levels of successful reproduction, and/or high levels of mortality resulting from a reduction in resource availability, often due to the presence of competitors (Gaston 2009). High levels of mortality typically occur during or shortly after extreme environmental events, likely due to the interaction between these extreme events and resource availability (Gaston 2009).
This study compares and contrasts demographic properties of a quenda population over time through drought, presence and absence of feral cats, and high and low levels of a likely food competitor, the woylie (Bettongia penicillata).
It addresses four questions:
Can a reintroduced population of quenda establish and persist at the geographic and climatic margin of its historic range?
Does this reintroduction site differ in key climatic attributes (annual rainfall and rainfall variability) from other sites to which quenda have been reintroduced?
Can the monitoring of demographic attributes over time provide insights into key factors impacting the long-term success of the reintroduction?
What are the relative impacts of drought, competitor numbers, and feral cat predation on the relative density and well-being of the quenda population?
Materials and methods
Range and reintroductions within Western Australia
Records of quenda for Western Australia were sourced from NatureMap (https://naturemap.dbca.wa.gov.au/; accessed May 2020). Records were divided into three time intervals (pre-1980, those from 1980 and beyond, and undated).
Translocations of quenda in Western Australia were collated from the literature (Mawson 2004; DEC 2012; Lohr and Valentine 2017; DBCA 2024). The long-term mean annual rainfall and the rainfall variability of translocation sites (10th-percentile of rainfall) were sourced from the Bureau of Meteorology (http://www.bom.gov.au/climate/data/). These were compared across translocation sites by plotting their 10th-percentile of rainfall as a percentage of long-term annual rainfall (mm) against long-term annual rainfall (mm) for each.
Field site
Wadderin (31°59.2′S, 118°24.8′E) is a vegetation remnant located approximately 8 km north north-east of the town of Narembeen in the Western Australian wheatbelt, 280 km east of Perth. The wheatbelt is an area of ~140,000 km2 of intensive agriculture, where more than 90% of native habitat has been cleared for cropping over the past 130 years (Saunders 1989). Remaining remnants of native vegetation are typically small and fragmented, and are often on soils that were unsuitable for cropping. The wheatbelt has a gradient of annual average rainfall ranging from ~650 mm in the west to ~300 mm in the east (Saunders 1989). Narembeen has an annual average rainfall of 332 mm (n = 96), with the bulk of that rain falling in winter (on average 55% falls in the 4 months between May and September).
Wadderin is a reserve vested with the Water Corporation (Water Reserve 20022) but in 2004, a lease was granted to the Shire of Narembeen to create a wildlife sanctuary. In 2007, 427 ha of the remnant were fenced by volunteers from the Narembeen community to exclude exotic predators such as foxes and feral cats.
The barrier fence is 9 km in length and is a wire netting fence (4 cm aperture at ground level changing to 5.5 cm at 20 cm above ground level) 1.8 m high, supported by galvanised steel posts cemented into the ground. The fence, as originally built, was not cat-proof. It had a narrow outward overhang supported by curved returns on galvanised posts, no electric wire, and a 0.5-m apron at ground level on both the inside and outside of the fence. The fence was substantially upgraded in 2015 and 2016 by widening the overhang to 0.6 m, supporting the overhang with fence droppers placed horizontally to ensure it was not drooping at its outer margin to maintain fence height, adding an electrified wire at mid-height, and ensuring the height of the fence was everywhere ≥1.8 m. The fence is not entirely quenda-proof, with quenda having been trapped beyond the fence. Presumably young quenda can pass through the mesh of the rabbit netting. Young bandicoots disperse shortly after weaning when they are ~140 g (Lobert and Lee 1990).
Wadderin has a series of granite outcrops surrounded by a mix of woodland and shrubland vegetation. A total of 67 ha of the sanctuary are granite outcrop (15.6%) and a further 63 ha are shrubland (Melaleuca spp. and Allocasuarina campestris) or mallee Eucalyptus spp. (a combined 14.7%). Woodland communities make up the remainder (245 ha; 57.4%), dominated by extensive areas of jam Acacia acuminata, York gum (Eucalyptus loxophleba), and salmon gum (Eucalyptus salmonophloia). Rock she-oak (Allocasuarina heugeliana) fringes the granite outcrops, occupying some 52 ha (12%). Poison bush (Gastrolobium parviflorum and Gastrolobium spinosum) occur sparsely in shrubland habitat, but not in other habitats.
Woodlands of salmon and York gum had relatively open understoreys. Denser understoreys occurred in shrubland and rock she-oak habitat. Piles of fallen trees, soil and rock created during the grading of the fence-line formed important shelter for quenda around the perimeter of the sanctuary.
Western grey kangaroos (Macropus fuliginosus) increased to high densities in the first years following fencing and had a major visible impact on native vegetation. They have subsequently been reduced to a low level by regular culling. Echidna (Tachyglossus aculeatus) are common within the sanctuary and regularly burrow under the fence and on occasions create potential pathways into the sanctuary for foxes and feral cats, despite weekly fence inspections by community volunteers.
Foxes and feral cats were removed from the sanctuary over the summer of 2007–2008. The sanctuary was baited with meat baits of sodium mono-fluoroacetate (‘1080’) to control foxes (DCLM 1991) and trapped using cage and foot-hold traps to eliminate cats. Despite initial removal of introduced predators, Wadderin has been subject to periodic incursions of feral cats and, less frequently, foxes, prior to the fence upgrade. The key ongoing control action to deal with incursions by foxes was the use of ‘1080’ (‘FOXOFF®’) baits tethered to star pickets at a height of about 0.6 m above the ground (to limit take by woylies and brush-tail possums Trichosurus vulpecula). Since reintroduction of native mammals, feral cats have been controlled by trapping with large treadle-operated cage traps raised on stilts or on horizontal branches at >1.5 m to reduce non-target capture of woylies; or by use of Victor soft-catch traps in trays of soil raised ~0.6 m above ground level.
Fauna monitoring
One or two major trapping surveys to estimate relative abundance were conducted each year following the release of quenda. Small treadle-operated wire mesh cage traps (Sheffield Wire Products, 220 mm × 220 mm × 560 mm) were used to assess the relative abundance of quenda and woylies. Cages were placed out at 100-m intervals around the track network baited with a mixture of peanut butter, rolled oats and sardines. Trap locations were fixed and marked by numbered pickets. There were 96 pickets in the interior of the sanctuary and 88 around the perimeter to give 184 discrete locations within the sanctuary. Trapping was standardised in location and methodology to minimise any potential changes in detectability over time. Fifteen such census surveys were conducted over 13 years averaging 354 trap nights per survey.
In addition, some localised trapping was conducted several times per year, primarily directed at reintroduced banded hare-wallabies (Lagostrophus fasciatus), but with captures dominated by woylies. This trapping included a mix of small and large (310 mm × 300 mm × 725 mm) treadle-operated wire mesh cages and often caught quenda. This included 17 trapping events over 10 years averaging 126 trap nights per survey.
Captured quenda were individually marked, sexed and measured (mass and pes); if female, the presence and size of pouch young or presence of lactating nipples were noted. Initially, quenda were marked with numbered monel ear tags in both ears, but there was a considerable loss of tags over time, particularly for large males. Subsequently, males (from September 2011) and females (from July 2013) were marked with passive integrated transponders (PIT) tags (Trovan ID-100B/1.4).
An estimate of absolute density of quenda was made at the end of the study by trapping two 6 × 8 grids, one in shrubland and one in woodland, over five to seven nights. Small cage traps were spaced 60 m apart. Grids were trapped in October 2022 (shrubland) and April 2023 (woodland).
The presence of feral cats and foxes was assessed by using fixed cameras (Bushnell, Reconyx, and Swift). Five cameras were used from January 2011, increasing to six in January 2012, and eight from November 2013.
Data analysis
The index of relative abundance (trap success) for a given species was calculated as the total captures of all animals of that species at a particular trapping event divided by the number of trap nights multiplied by 100. Trap saturation was a major issue. Census surveys routinely attained trap success of >70% for quenda, woylies, possum (T. vulpecula) and other species. This meant the relationship between absolute density and the index was curvilinear so that a doubling of the index no longer implied a doubling of density. To deal with this, trap success for all species combined was converted to an estimated density of catches per trap (Caughley 1977) for each census survey. This value was then multiplied by the number of quenda captures as a proportion of total captures to give a value of estimated density of captures per trap for quenda.
An index of relative abundance was preferred over an absolute estimate (such as Jolly–Seber mark–recapture) for regular monitoring surveys of quenda as there was unequal opportunity for capture for all quenda across the sanctuary by trapping along the track network (violating a key assumption of mark–recapture methodology: Caughley 1977, Krebs 1999). The distance from any point in the sanctuary to a trap line was up to 400 m. This is more than the diameter of assumed circular home ranges for both male and female quenda (home range estimates of 9.2 ha (male) and 2.1 ha (female): Valentine et al. 2021). Many quenda would have had no traps within their home range and therefore a capture probability of zero.
The relative index of abundance was complemented at the end of the study by estimates of absolute density in two major habitats. Estimates of absolute density were calculated by analysis of spatially explicit capture–recapture (SECR) data using the software DENSITY ver. 5.0 (Efford 2020). The analyses used maximum likelihood estimation, with the buffer set to four times the spatial scale parameter of the half-normal detection function. A habitat mask was used to identify non-habitat (areas beyond the boundary fence). A measure of population size for the sanctuary was calculated by multiplying estimated densities by area of habitat.
One-way ANOVA was used to compare the number of captures by gender and to assess the comparative life span between gender. Mixed models (Gallucci 2019) were used (as there were repeated measures of some individuals over time) to compare weights between genders and the body mass of reproductive and non-reproductive females. Individual indentification (ID) was included as a random effect to account for recaptures of individual quenda over time. The estimation method used was restricted maximum likelihood and the variance of the random effects is given as the intra-class correlation coefficient (ICC).
Body condition was assessed using the method of Krebs and Singleton (1993). A regression of skeletal size (pes length, mm) and body mass (g) was calculated using all available data, excluding quenda on release at translocation and same-trip recaptures. This regression was used to predict body mass from the pes length of each individual. The condition of each individual (condition index, CI) was then assessed as the ratio of observed to predicted body mass. An individual in average condition has a CI = 1; those >1 are in better condition (i.e. observed > predicted body mass); those <1 are in poorer condition.
Mixed models were used to assess the effect of the factors gender (male, female), recruit (a binary variable distinguishing first capture of an individual from subsequent captures) and season (winter, spring, summer, autumn) and the covariates of years since first reintroduction, quenda estimated density of captures per trap, woylie population size (Jolly–Seber estimates from Short (2023)) and rainfall over the previous 3-, 6- and 12-months on condition of all individuals. Individual ID was included as a random effect to account for recaptures of individual quenda over time. Models with various combinations of variables were compared using Akaike information criterion (AIC) to determine the model with best fit to the data.
Similarly, a mixed model was used to assess the effect of the factor season and the covariates rainfall over the previous 3-, 6- and 12-months, years since first reintroduction, quenda estimated density of captures per trap, estimated number of woylies, and CI on the number of pouch young per female with individual ID included as a random effect. Both females with and without pouch young were included in analysis.
The impact of the feral cat on quenda recruitment was assessed by comparing recruitment across two sequential 3-year periods (one with the cat present; one without) in areas close to and distant from the centre of the cat’s activity range as determined from sightings on eight fixed cameras. Results were analysed using χ2 analysis.
Results
Range and reintroductions within Western Australia
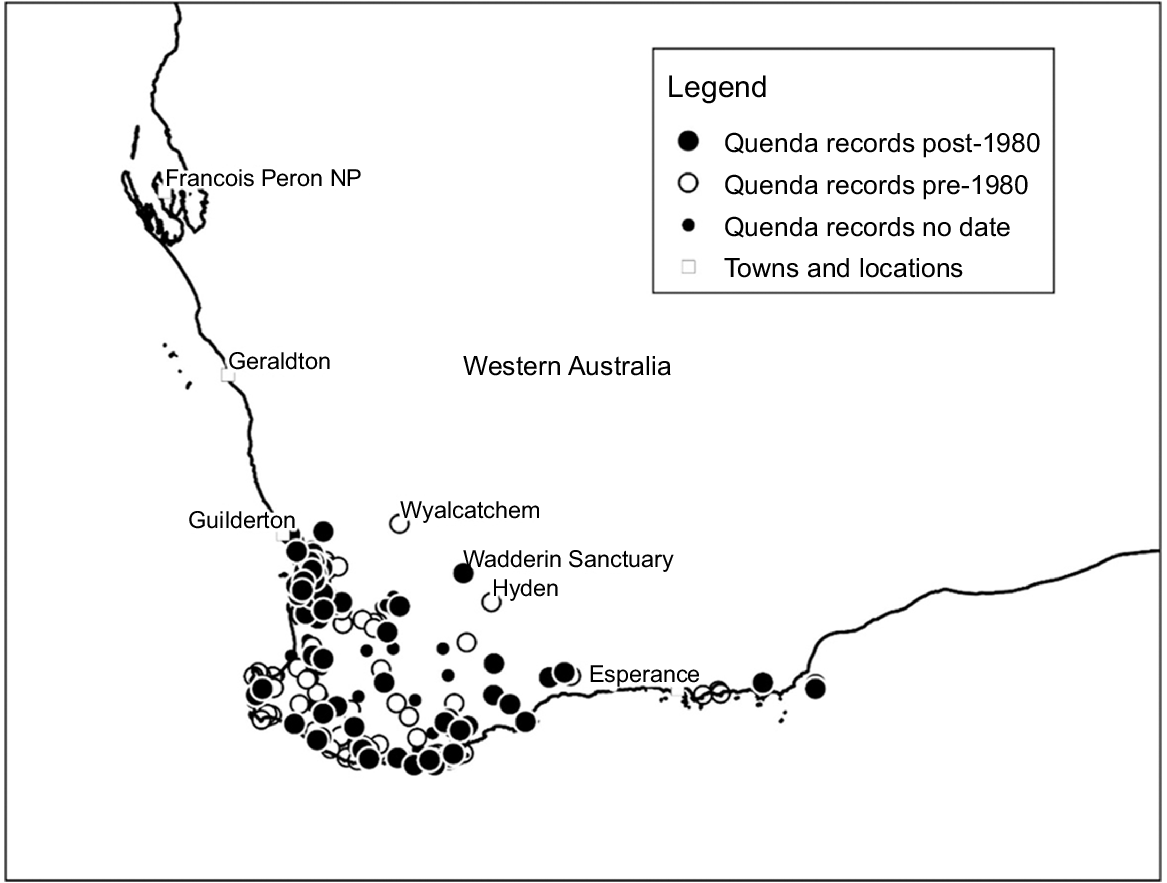
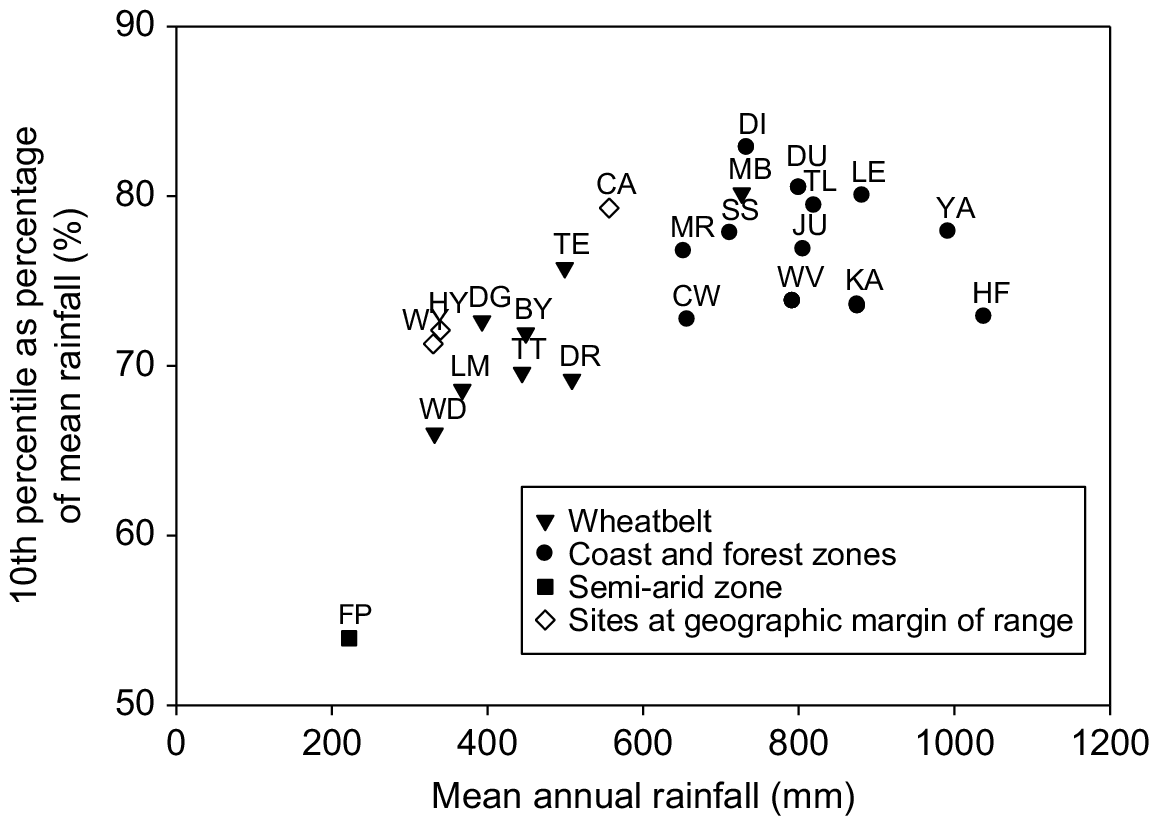
The location of Wadderin Sanctuary relative to the distribution of quenda within south-west Western Australia is in Fig. 1. Quenda extend from north of Guilderton (Hart 1998) to Cape Arid National Park east of Esperance, with most records in near coastal or forest habitat. The reintroduction to Wadderin Sanctuary was to the eastern geographic margin of the species’ former range in the wheatbelt. It is also to the climatic margin. Fig. 2 gives a plot of average annual rainfall against low rainfall extreme (10th percentile of annual average rainfall as a percentage of annual average rainfall) for quenda reintroduction sites and also for sites of historic or current occurrence on the margins of the species’ range (Hyden and Wyalkatchem on the eastern boundary, and Cape Arid in the far south-east). Two clusters and an outlier are evident. The top-right cluster includes higher rainfall coastal and forest sites, the central cluster includes the lower rainfall wheatbelt sites, and the bottom left site is a semi-arid site (a conservation introduction to a site beyond the species’ known historical range). The only exception to this pattern is Mt Barker, which was classified by Friend (1997) as a reintroduction to the wheatbelt, but with a climate more aligned with the coast and forest zones (mean annual rainfall of 727 mm).
The location of Wadderin Sanctuary relative to records for quenda in south-west Western Australia. Location data are from NatureMap (https://naturemap.dbca.wa.gov.au/).
Mean annual rainfall and rainfall variability of quenda translocation sites in south-west Western Australia. Site codes: Francois Peron National Park (FP), Wadderin Sanctuary (WD), Lake Magenta Nature Reserve (LM), Dongolocking Nature Reserve (DG), Tutanning Nature Reserve (TT), Boyagin Nature Reserve (BY), Dryandra Forest (DR), Tenterden (TE), Mt Barker (MB), Julimar Forest (JU), Maralla Road Nature Reserve (MR), Creery Wetlands (CW), Star Swamp Nature Reserve (SS), Dianella Regional Open Space (DI), Woodvale Nature Reserve (WV), Dundas (Road) Nature Reserve (DU), Thompsons Lake Nature Reserve (TL), Karakamia Wildlife Sanctuary (KA), Leschenault Conservation Park (LE), Yalgorup (YA), and Hills Forest (HF). Sites on the margins of the range of quenda are shown as open diamonds: Hyden (HY), Wyalkatchem (WY) and Cape Arid (CA).
There have been some 32 reintroductions of quenda to south-west Western Australia. Most reintroductions (66%) have been to coastal and forest habitats and to areas of higher rainfall (>530 mm annual average rainfall).
Reintroduction of quenda to Wadderin Sanctuary
A total of 31 quenda were reintroduced to Wadderin Sanctuary in three releases in 2010 (Table 1). Quenda were sourced from sites destined for land clearing for housing development in Perth. Initial releases were to shrubland habitat in the south of the sanctuary. Of the original 31 bandicoots reintroduced, all but five were re-captured at some point. The maximum recorded life span post-release was 43.4 months, with a mean of 14.2 months.
| Release date | # Released (M:F) | Mean weight (g) (range) | Source | |
|---|---|---|---|---|
| May 2010 | 14 (5:9) | 1141 (710–1655) | Bibra Lake, Perth | |
| June 2010 | 9 (5:4) | 953 (560–1453) | Jandakot Airport, Perth | |
| August 2010 | 8 (4:4) | 743 (660–925) | Malaga, Perth | |
| Total | 31 |
Reintroductions to Wadderin were in an extremely dry year (2010, annual rainfall of 180 mm; 54% of the long-term mean and the second driest year in the 96 years of records). Conditions have fluctuated greatly over the subsequent 12 years (Fig. 3a) with well-above average annual rainfall in 2011 (475 mm), 2016 (467 mm) and 2017 (474 mm) and well-below average in 2010, 2015 (259 mm), 2019 (222 mm) and 2020 (276 mm). The rainfall for the 2-year periods 2019/2020 and 2009/2010 were the fourth and fifth driest such periods in the rainfall record.
(a) Annual rainfall at Narembeen (2010–2022). The long-term average (332 mm) is shown as the dashed line. (b) Observations of the presence/absence of feral cats and foxes within Wadderin Sanctuary and the removal of five feral cats over time.
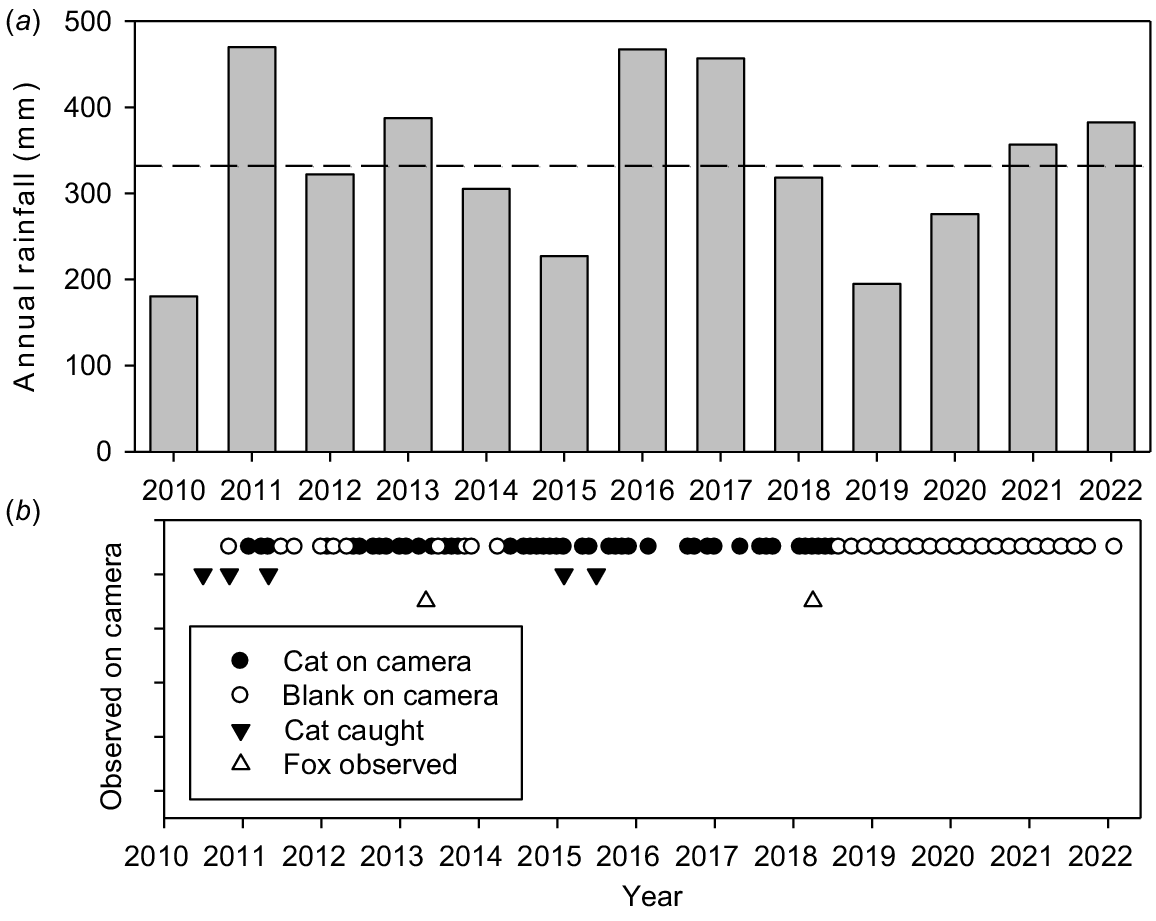
Despite a barrier fence, Wadderin was subject to incursions by feral cats and, to a lesser extent, foxes. Details of observations of predators on fixed cameras within the sanctuary are given in Fig. 3b. Further details on captures of feral cats are given in Short (2023).
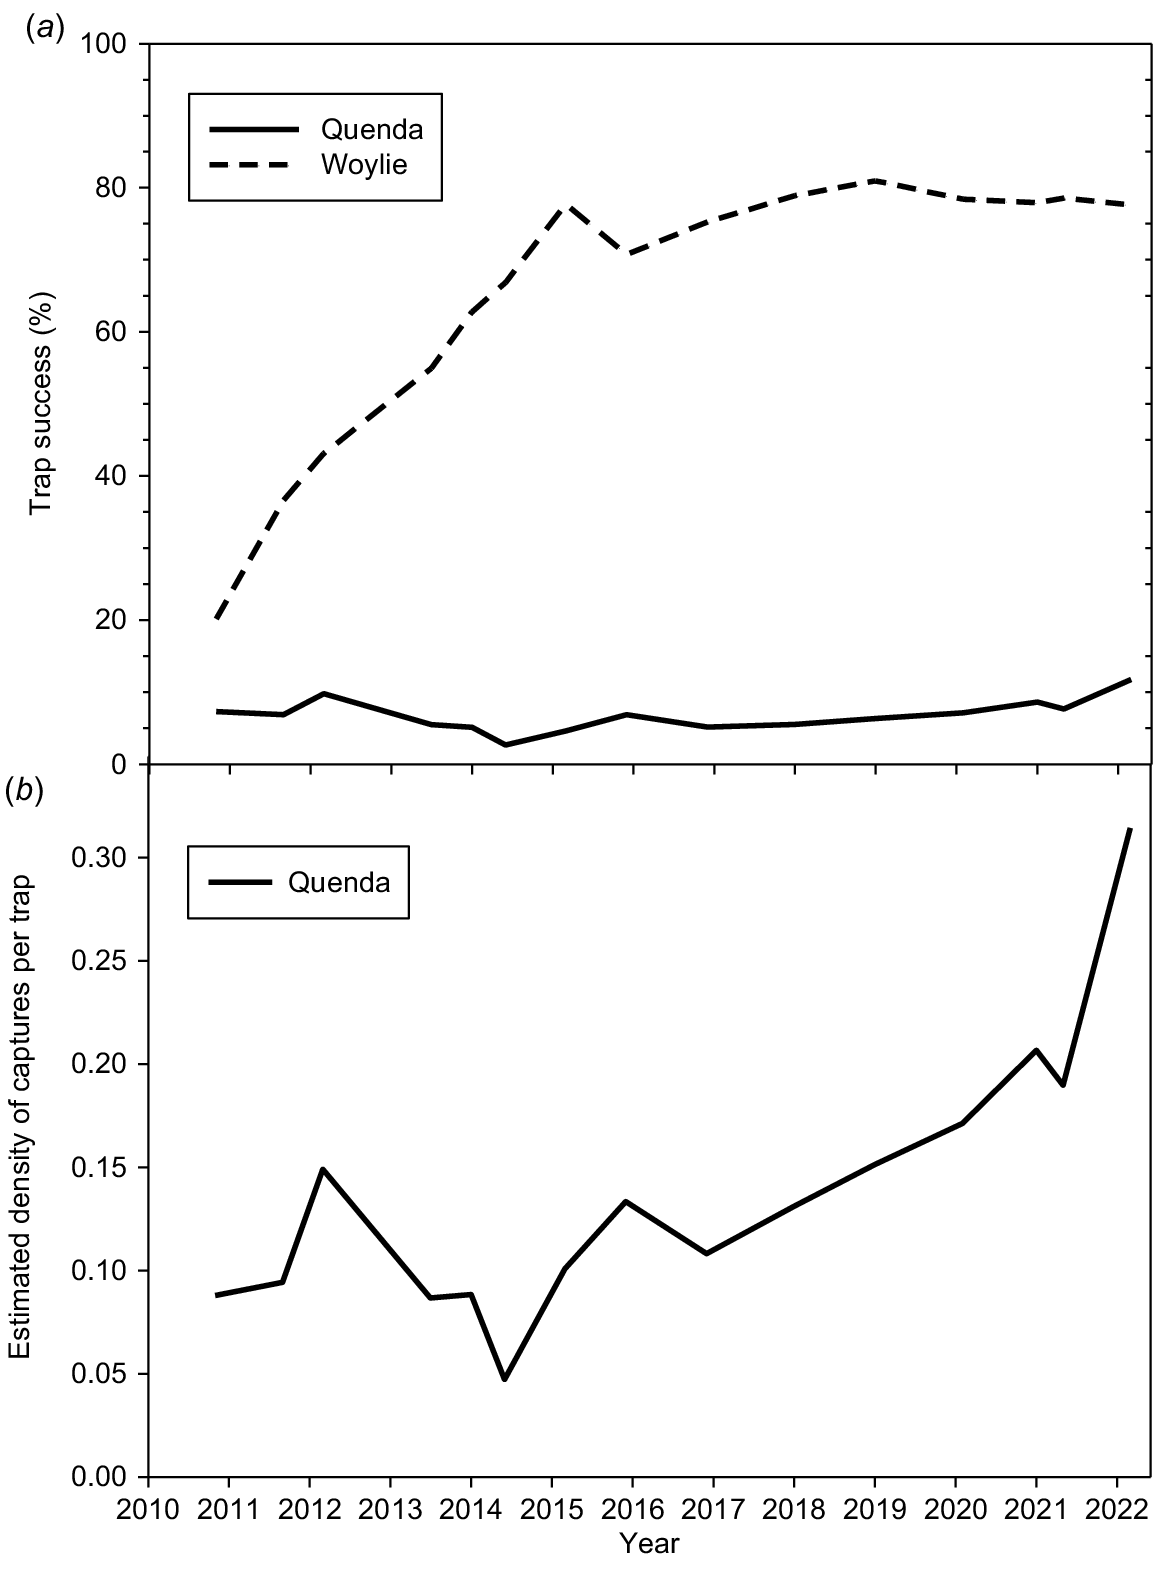
There have been 563 records of capture of 167 individual quenda to April 2022 (excluding those originally released). Comparative trap success for quenda and woylie (also reintroduced in 2010: Short 2023) are in Fig. 4a. Trap success for woylies grew strongly over the first 4 years, while trap success for quendas remained largely static, averaging 6.7% (range, 2.7–11.8%). The high rate of capture of woylies and other species (at times >80% capture success) would have led to trap saturation and consequently a reduction in the number of quenda caught. Fig. 4b shows the capture data corrected for this trap saturation. Quenda showed a 6.7-fold difference in estimated density of captures per trap, with the major rise in the latter 4 years of the study. This compares to a 4.4-fold difference estimated from the index of captures per 100 trap nights. The last trapping session (February/March 2022) showed the highest capture success for quenda (11.8%) and the highest value for estimated density of captures per trap (0.31). The lowest trap success (2.67%) and estimated density of captures per trap (0.05) was in June 2014.
(a) Percentage trap success for quenda and woylie over time at Wadderin Sanctuary (census surveys only). (b) Estimated density of catches of quenda per trap over time at Wadderin Sanctuary (census surveys only).
SECR analysis for shrubland and woodland habitats gave similar results for quenda density (0.51 and 0.47 ha−1: Table 2) suggesting a total population size of ~200 individuals within the sanctuary in 2022/2023. This is a 6.5-fold increase on the number originally reintroduced in 2010 (200/31).
| Attribute | Habitat | ||
|---|---|---|---|
| Shrubland grid | Woodland grid | ||
| Cumulative detected individuals | 19 | 11 | |
| Density (ha−1) ± s.e. | 0.506 ± 0.128 | 0.471 ± 0.170 | |
| g0 | 0.0794 | 0.0717 | |
| sigma | 93.663 | 68.426 | |
| MMDM (m) | 171.3 | 138.1 | |
| Effective sampling area (ha) | 37.7 | 23.5 | |
| Capture probability | 0.42/session; 0.98 overall | 0.33/session; 0.87 overall | |
| Male:female ratio | 14:5 | 7:4 | |
| Trap success all species on grid (%) | 87.3 | 95.0 | |
| Quenda as % of total captures | 21.0 | 8.7 | |
Results are from SECR analysis of trapping grids (6 × 8; 60 m trap spacing).
MMDA, mean maximum distance moved.
There was fierce competition for traps between species, with up to 95% capture success on grids (Table 2). Female quenda appeared under-represented in captures on both grids (Table 2), presumably due to their smaller home ranges and smaller mean maximum distance moved (male, 188 m vs female 109 m on the shrubland grid). Separate analyses of male and female captures of quenda from the shrubland habitat gave a slightly higher combined value for density (0.54 ha−1). There were insufficient captures and recaptures of females to repeat this analysis for the woodland grid. Both factors suggest the estimates above are likely to be under-estimates of true density.
Sex ratio
There was a strong male bias to bandicoots recruited into the population as assessed by trapping. A total of 90 males were known to be recruited, compared with 53 females (1.70:1, M:F). Individual males were caught more frequently than individual females (males, 3.12 captures cf. females, 2.43); however, this difference was not significant (F1, 173 = 3.45; P = 0.065).
Body size
Quendas showed significant dimorphism in body size between the sexes (F1, 208 = 75.7; P < 0.001; ICC = 0.540). Males had a mean mass of 1263 g (range: 250–2170 g) (n = 335); females had a mean mass of 901 g (range: 220–1425 g) (n = 206).
Life span
The maximum recorded age for a female quenda was 49 months, and 35 months for a male. These values may substantially underestimate life-span as they do not take account of age at first capture (mean weight at first capture, 995 g (n = 168)) and survival past last capture. Mean life span was 320 ± 28.5 days (10.7 months). There was no significant difference in mean life-span between the sexes when assessed across all individuals (translocated and first captured prior to 2021) (F1, 156 = 0.13; P = 0.719). Mean life span for year cohorts declined from a peak in 2011 (20.2 months; n = 11) to lows in 2017 and 2018 (0.89 months; n = 3 and 3.1 months; n = 13), before recovering in following years (2019: 10.0 months; n = 22 and 2020: 13.3 months; n = 19). The lows in life span at Wadderin in 2017 and 2018 preceded the drought years of 2019 and 2020, but coincided with peak woylie numbers.
Body condition
A body CI was derived from the ratio of observed to predicted body mass, with predicted mass derived from the equation ‘predicted mass’ = −2197 + 53.67 × ‘hindfoot’ (F1, 483 = 634.1; P < 0.001). CI was best predicted by the variables ‘recruit’ and ‘years since reintroduction’. Recruits (i.e. first capture of an individual) typically were in poorer condition than other individuals (0.90 vs 1.13) (coefficient = 0.1656; P < 0.001). Condition declined with years since reintroduction (coefficient = −0.0126; P < 0.001). The ICC for the model was 0.204. The variable years since reintroduction was strongly correlated with both the quenda index (estimated density of captures per trap) (r = 0.794; P < 0.001) and the measure of woylie numbers (r = 0.712; P < 0.001). Model fit was not improved by adding any combination of the variables: rainfall over the previous 3-, 6- and 12-months, quenda index or woylie numbers.
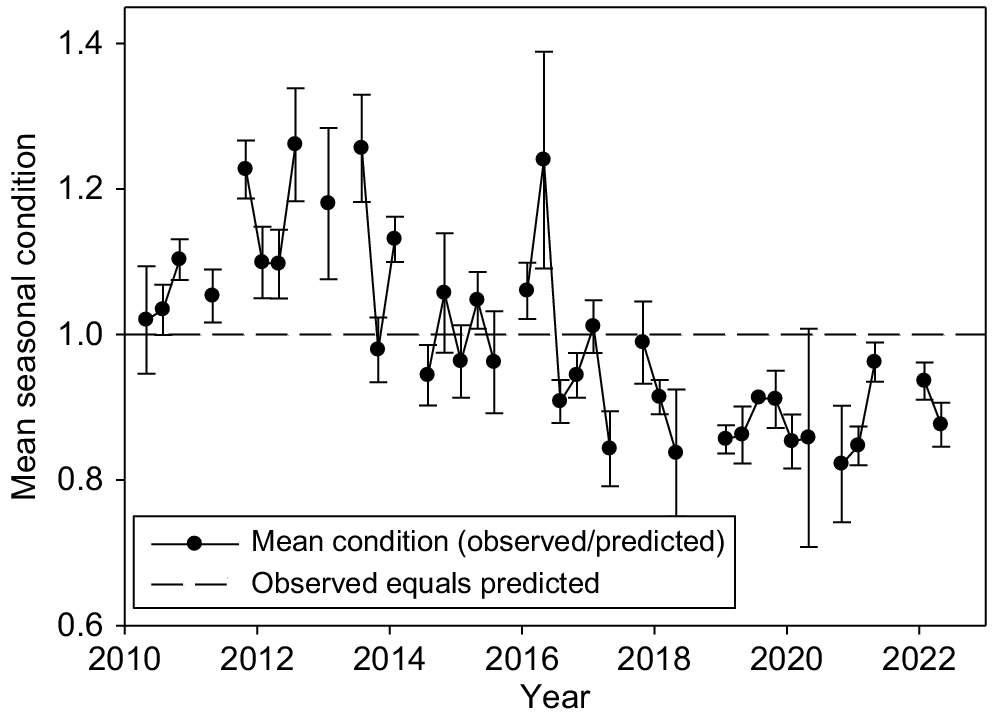
In a separate model with CI as dependent variable, season and gender as independent factors and individual ID as the cluster variable, season was significant (F3, 47 = 2.97; P = 0.03). Mean values were winter: 1.07, spring: 1.07, summer: 0.96 and autumn: 1.00). ICC was 0.37. Mean seasonal body condition (winter, spring, summer and autumn) was plotted against years in Fig. 5. Mean seasonal condition was typically greater than expected in the early years following translocation (2010–2014) before declining to less than expected in later years (2016–2022), showing no recovery despite a return to average rainfall.
Reproduction
The smallest female recorded with a pouch young was 640 g, while the oldest female with pouch young was at minimum 36 months of age. Reproductive female quenda were typically heavier than their non-reproductive counterparts (965 vs 842 g; F1, 152 = 10.5; P = 0.001; ICC = 0.586). The percentage of females carrying pouch young increased with body weight (<800 g, 36%; ≥800 g and <1100 g, 51% and ≥1100 g, 66%).
Female quenda had young in every season of the year, with a slight peak in winter and spring when 56–67% of females had young in their pouch (Table 3). About half of females (49%) carried no young (Table 4). Of these, 12% were pre-reproductive (i.e. <640 g), 9% had recently had a litter (enlarged nipples, no milk), and the remainder (79%) were in apparent anoestrus. Reproductive females typically carried two (50% of 94 females) or three (31%) pouch young with some females having either one young (13%) or four (6%) pouch young. The mean number of pouch young per female (excluding non-reproductive females) was 2.31 ± 0.08 ( ± s.e.).
| Season | # Females | Mean mass (g) | Proportion reproductive | |
|---|---|---|---|---|
| Summer | 88 | 910.3 | 0.43 | |
| Autumn | 62 | 895.7 | 0.45 | |
| Winter | 33 | 929.8 | 0.56 | |
| Spring | 24 | 838.3 | 0.67 |
Reproductive includes females with young or lactating.
| Number of pouch young | Number of females | % | |
|---|---|---|---|
| 0 | 90 | 48.9 | |
| 1 | 12 | 6.5 | |
| 2 | 47 | 25.5 | |
| 3 | 29 | 15.8 | |
| 4 | 6 | 3.3 | |
| Total | 184 | 100 |
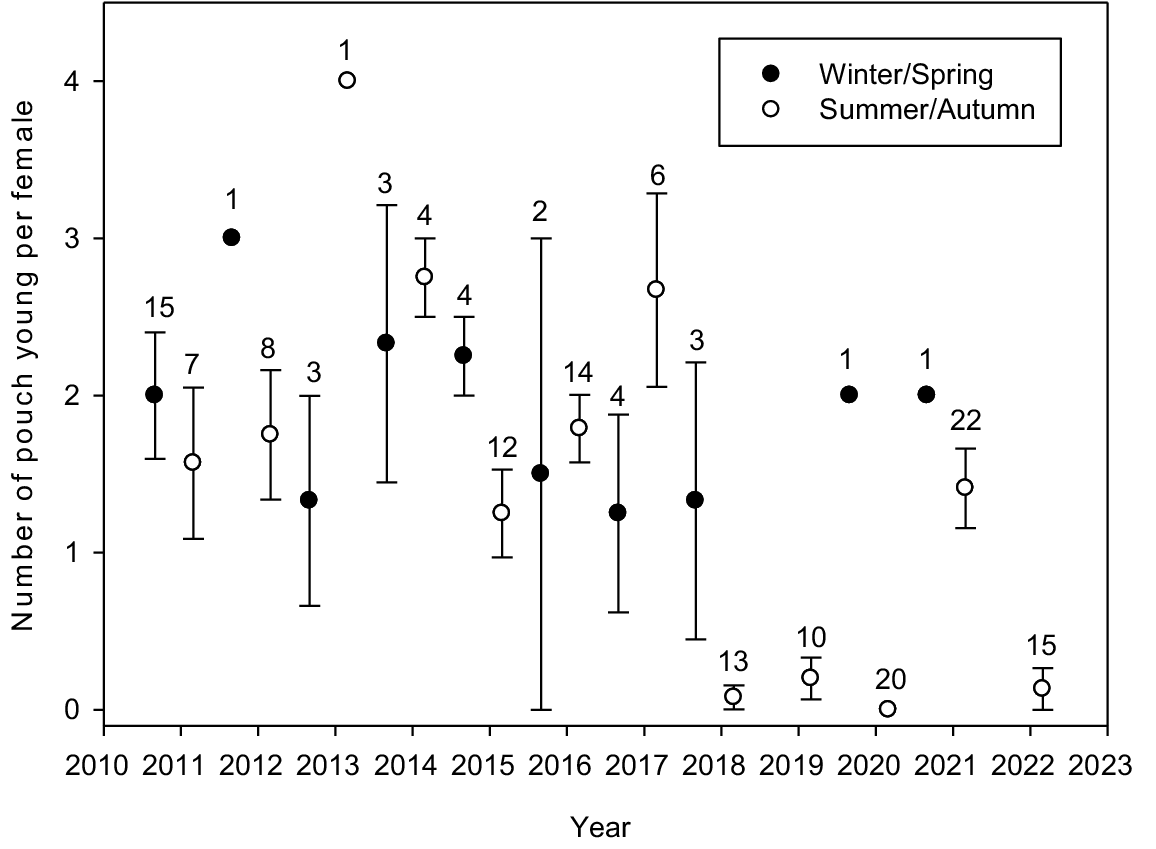
A plot of mean number of pouch young per female over time (grouped by seasons: winter/spring and summer/autumn) is in Fig. 6. Most notable are zero or near-zero values for summer/autumn in years 2018, 2019, 2020 and 2022. For example, in summer and autumn 2020, 20 females were sampled and none had pouch young or signs of lactation. However, the limited available data (2020 and 2021) suggests that females continued to produce a litter in winter/spring.
The mean number (±s.e.) of pouch young (or enlarged nipples) per female per season (winter/spring, summer/autumn) since the reintroduction of quenda to Wadderin Sanctuary. Sample size is given above each error bar.
The number of pouch young per female was best explained by a mixed model that included quenda captures per trap (coefficient −7.005; P < 0.001), woylie numbers (coefficient −0.012; P < 0.001), and season, giving the lowest AIC value (ICC = 0.072). Increasing quenda and woylie numbers both had a negative impact on the number of pouch young per female. The mean number of pouch young per female were highest in winter (1.77) and spring (1.76), lower in summer (1.04) and lowest in autumn (0.91).
Recruitment
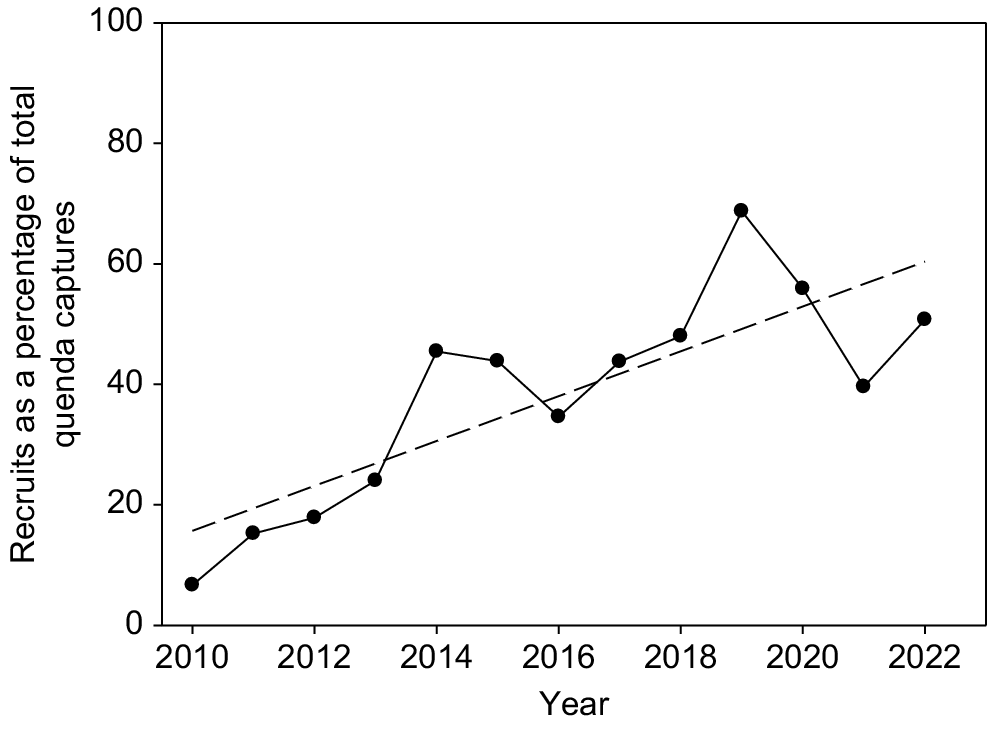
The number of new recruits as a percentage of total quenda captures each year increased over time from <10% in 2010 and 2011 to ~50% in later years (y = −7468.13 + 3.723 year; F1,11 = 22.306; P < 0.001) (Fig. 7). Recruitment increased to a peak of 64% of captures in 2019 and remained relatively high in following years, despite the drop-off in reproduction in summer/autumn of these years.
Response to cat presence
Thirty-three of the 36 sightings (92%) of the same and only feral cat at Wadderin (Short 2023) were from three cameras within 500 m of each other in open woodland in the north of the sanctuary. The camera with most records (61%) was assumed to be the centre of the cat’s hunting activity. The number of recruits to the quenda population with first capture within or beyond 1.5 km from this point were compared for the ~3 years that the cat was present and for the subsequent 3 years when no cat was present. There was no significant association between areas and time periods (; P = 0.611). The area within 1.5 km of the centre of the cat’s range (an area of ~300 ha within the fence) accounted for 57% of new quenda when the cat was present compared with 62.5% for the period when it was absent.
Discussion
Reintroduction of quenda to Wadderin in wheatbelt context
Quenda were reintroduced to Wadderin Sanctuary in the central eastern wheatbelt in 2010 and have been extant for more than 12 years. It is one of only two reintroductions to the drier eastern wheatbelt (the other being Lake Magenta Nature Reserve), so is an outlier, in terms of both geography and climate. A barrier fence, not present at most other wheatbelt translocations, provided substantial, but not complete, protection from predation by foxes and feral cats. Bandicoots are widespread within the sanctuary across all major habitats and are commonly caught in survey trapping, seen on fixed cameras, and observed at night by spotlight. The release to Wadderin was considered a reintroduction as there are records of the species at nearby Hyden in the 1960s (Kitchener and Vicker 1981).
The wheatbelt appears to be a challenging environment for quenda when compared with coastal and forest habitats–as evidenced by the history of decline of the species including reported local extinctions since the 1970s. Quenda appeared relatively widespread in the southern wheatbelt in the first half of the 20th century, but appeared to reach a nadir by the 1970s. Kitchener and Vicker (1981) detailed records of quenda from the wheatbelt in the 1900s (Cranbrook and Martup Hill), the 1930s (Narrogin), the 1940s (Pingelly and Dardadine), the 1950s (Tambellup, Nyabing, Kukerin and Lake Grace), and the 1960s (Amelup, Dryandra (Congelin, Contine and Mooterdine), Kojunup, Wyalkatchem, Hyden and Tutanning).
Quenda had been recorded at one reserve (Tutanning Nature Reserve) in the western wheatbelt in the late 1960s (Sampson 1971). Sampson found quenda to be widespread and common (mean capture rates of 10–18%) in woodland, sandplain and laterite scrub, but it avoided areas where there were little or no understorey to provide suitable cover. However, no quenda were caught in trapping at Tutanning in 1978 (Kinnear et al. 2002) and the species was considered locally extinct.
Quenda were also recorded at very low density (0.35% trap success) in Dryandra Forest in 1970–1971 (Kinnear et al. 2002), but was subsequently considered locally extinct there (DEC 1995). Similarly, quenda were reported at Lake Magenta Nature Reserve in the late 1990s (Orell 2004), but were considered locally extinct by 2001 (Morris et al. 2010).
Kitchener et al. (1980) surveyed a further 23 reserves in the wheatbelt in the late 1970s, but quenda were not recorded in any of them. Quenda were reported from Stirling Range and the Porongurup National Parks on the southern margin of the wheatbelt in the early 2000s (Orell 2004). Quenda were restricted to the wetter and denser habitats such as gullies (Friend and Muir 1993). Friend (1997) reported a population around the town of Mt Barker (20 km west of Porongurup National Park) as the last naturally occurring stronghold of the species in the wheatbelt.
Major environmental changes in the wheatbelt through the 20th century are likely to have impacted quenda populations. These include the arrival of the European fox from the east in the 1920s (Jarman 1986), loss of habitat through widespread clearing of natural vegetation for cereal growing, primarily between 1945 and 1982 (Saunders 1989), the loss of extensive stands of toxic pea plants (Gastrolobium spp.) likely to have had an indirect impact on fox numbers through secondary poisoning by them eating prey species that had consumed the plant (Christensen 1980; Short et al. 2005), and the increase in fox numbers in the 1960s and 1970s due to changes in rabbit and fox management (King et al. 1981; Kinnear et al. 2002).
Quenda is one of a suite of medium-sized mammals (35 g−5.5 kg), which have benefited in recent times from widespread fox control, which involved the baiting of 3.5 million ha of conservation lands primarily in the south-west of Western Australia since the mid-1990s (Morris et al. 1998). Following baiting, quenda were reported from 24 of 36 monitored sites, extending from Julimar State Forest (immediately north-east of Perth) to Cape Arid National Park in the far south-east (Orell 2004). Quenda were detected in 100% of coastal sites (n = 7), 76% of forest sites (n = 21) and 38% of wheatbelt sites (n = 8). Of the three wheatbelt sites with quenda, one was a natural population (Lake Magenta), the others being recent reintroductions (Tutanning and Boyagin Nature Reserves).
The advent of localised (in the early 1980s) and widespread fox control in the forest zone and the adjoining wheatbelt (from the mid-1990s) (Morris et al. 1998; Kinnear et al. 2002) was accompanied by reintroductions of medium-sized mammals. There have been at least 32 translocations of quenda to 2017 (DEC 2012; Lohr and Valentine 2017; DBCA 2024); of which nine have been to the wheatbelt. These included reintroduction of quenda to reserves in the western wheatbelt: Tutanning (1991–1995), Dongolocking (1994) and Boyagin (1995–1996) Nature Reserves and the restocking of sites at Mt Barker (1997) (Mawson 2004) and Lake Magenta (2009) (Morris et al. 2010). In addition, quenda appear to have been ‘informally reintroduced’ to Dryanda Woodlands in the mid-2000s (DEC 2011) and supplemented in 2015 (DBCA 2024).
A reintroduction of 24 quenda to Dongolocking Nature Reserve in the southern wheatbelt in 1994 is reported to have increased to >200 by 1998 (Morris et al. 1998), but no subsequent data has been provided on the status of this population (Mawson 2004; Orell 2004). DBCA (2022) report on monitoring of 52 sites by cage trapping and/or camera trapping in the south-west of Western Australia between 2017 and 2021; of which nine were in the wheatbelt. Quenda were recorded at four of the latter sites – Boyagin Nature Reserve and Dryandra Woodland in the far western wheatbelt and Stirling Range and Porongurups on the southern margin of the wheatbelt. Quenda were not detected in surveys at Tutanning, Dragon Rocks, Mt Caroline, Mt Stirling or Nangeen Hill Nature Reserves.
More recently, quenda have been reintroduced to wheatbelt sites where predator control has relied on exclusion fencing rather than on baiting alone. These include Wadderin (2010), and sites at York (2014: 40 ha), and Tenterden (2015: 111 ha). (https://www.waratahfencing.com.au/customer-solutions/conservation-sanctuary-at-eagle-ridge/; https://heartlandjourneys.com.au/transcripts/balijup-farm-and-fauna-sanctuary/.
While Wadderin is on the eastern margin of the species’ range and has the lowest and most variable rainfall of all the sites that the species was known to occur at historically, there has been a translocation to a site with lower and more variable rainfall. Quenda were introduced to Francois Peron National Park at Shark Bay. A total of 40 quenda from the Perth metropolitan area were released in 2006 and 2007, but failed to persist (https://www.sharkbay.org/restoration/project-eden/project-eden-reintroduction-status%EF%BB%BF/). This site is substantially removed from the species current and historic range (>600 km; Fig. 1); but within the recent fossil distribution (Travouillon and Warburton 2023). It is also removed from the species’ climatic profile (Fig. 2).
In summary, quenda are know from only a few sites in the wheatbelt as extant natural populations, all on its southern margin; that is, Stirling Range and Porongurup National Parks and possibly Mt Barker. All other known sites have been translocated. However, a lack of reporting means that it is unclear what the long-term fate of many of the translocated populations has been.
Demography of quenda at Wadderin
Quenda at Wadderin showed significant sexual dimorphism in body size, with males averaging 1275 g and females 912 g. Similarly, Cooper (1998) found there to be significant dimorphism in body size of quenda in south-west Western Australia across five locations. Mean body mass for males ranged from 725 to 1730 g; and for females from 489 g to 1031 g.
New recruits to the Wadderin population were strongly male dominated (1.7:1, M:F). This is similar to sex ratio of captures reported elsewhere, for example Cooper (1998): 1.7:1, M:F (n = 78 across six sites). It may be that this difference from parity is an artefact of trapping. Males are known to have larger home ranges than females (9.2 ha vs 2.1 ha; Valentine et al. 2021), suggesting that they may be more likely to encounter a trap on a grid with widely spaced traps.
Maximum life span for quenda at Wadderin was approximately 4 years; similar to values for I. obesulus (3–4 years in the wild) given by Lobert and Lee (1990), Mallick et al. (1998) and Sanderson and Kraehenbuehl (2006). However, estimated mean life span at Wadderin was substantially less (~11 months). This is consistent with the high population turnover observed by both Sampson (1971) and Sanderson and Kraehenbuehl (2006), but substantially longer than 6.4 months for males and 5.7 months for females reported by Lobert and Lee (1990) for I. obesulus in Victoria.
The smallest female reproductive at Wadderin was 640 g compared with 450 g for I. obesulus in Victoria (Lobert and Lee 1990). Quenda bred throughout the year at Wadderin with a slight peak in winter and spring (56–67% of females were reproductive cf. 43–45% in summer and autumn). Quenda at Tutanning Nature Reserve in the western wheatbelt (Sampson 1971) also bred throughout the year. However, the proportion of females reproductive at Tutanning was substantially higher (100% in winter and spring and ~80% in summer and autumn). Similarly, breeding in I. obesulus was reported throughout the year in South Australia (Sanderson and Kraehenbuehl 2006). In contrast, breeding in I. obesulus in Tasmania is reported to be seasonal (from July to February (Lobert and Lee 1990; Mallick et al. 1998)) and in Victoria (July–December) (Lobert and Lee 1990), coinciding with annual peaks in food abundance in the soil (Lobert and Lee 1990).
Breeding contracted to the winter/spring period for multiple years at Wadderin, coinciding with years of low rainfall and high woylie numbers (Short 2023) and, in later years, an increase in the quenda index. Similarly, other authors report years with little or no breeding (Mallick et al. 1998) and associate this with ‘exceptionally dry conditions’ (with yearly rainfall of 80–93% of long-term average of 755 mm p.a.). In south-east Tasmania this was associated with population decline, whereas at Wadderin the population index increased, presumably with numbers increasing due to the absence of cursorial predators.
Reproductive females at Wadderin had an average litter size of 2.31, low when compared with most other sites. Average litter size was 2.46 at Tutanning Nature Reserve (Sampson 1971), while for I. obesulus in Victoria was 3.04 (Stoddart and Braithwaite 1979), and in Tasmania was 2.8 and 3.05 (Heinsohn 1966; Mallick et al. 1998). Average litter size for I. macrourus in south-eastern Queensland was 2.9 (Hall 1983). By contrast, litter size for I. obesulus in South Australia was 1.8 (Sanderson and Kraehenbuehl 2006). Litter size is known to decrease over pouch life (from 3.6 in early pouch life to 2.1 in late pouch life in I. macrourus (Gemmell 1982)), presumably due to the increasing demands of lactation. A low value at Wadderin is interpreted as being due to resource shortages in years of below-average rainfall coinciding with high numbers of both woylies and quenda.
Bandicoots are believed to have the capacity to alter their reproductive output in response to changes in rainfall and food availability (Lobert and Lee 1990). Low rainfall results in a reduction in the abundance of soil-invertebrate food (Heinsohn 1966; Lobert and Lee 1990) and a consequent reduction in reproduction. At Wadderin, this appeared to be expressed both in a reduction in females breeding and a lower number of pouch young per litter, and possibly later sexual maturity in females.
Reintroduction to the edge of the range
Reintroduction to the edge of the range potentially involves greater risks to success than those to the core range of the species. Brown and Main (2010) considered extant populations of I. obesulus at the limits of its range to be especially at risk (i.e. populations on the inland margin of the species range). The occurrence of such populations in small, isolated pockets and at small population sizes contributed to this vulnerability.
The reintroduction of quenda to Wadderin was to a site at the lower end of the rainfall gradient historically occupied by this species and to a site at the extreme of rainfall variability. Hence, periodic resource depletion from drought seemed likely. Dry years (including consecutive dry years) did eventuate. However, quenda persisted despite major and prolonged reductions in body condition and reproductive output. However, it is likely that biotic interactions also played a part. Variation in the CI of quenda was best explained by years since reintroduction (i.e. declining as years increased; highly correlated with both increasing woylie numbers and the relative abundance of quenda); while changes in reproductive output were best explained by a model that included terms for quenda captures per trap and woylie numbers. The seasonal body condition of quenda was in decline in 2017 with high densities of woylies, but prior to the onset of drought conditions in 2019. Similarly, reproductive output (pouch young per female) declined to close to zero in 2018 and continued at low levels in 2019 and 2020, declining well before the onset of drought, suggesting the role of biotic interactions in resource depletion. Resource competition between quenda and woylies is speculative, but both are omnivores and, at least superficially, appear to have many dietary items in common (e.g. fungi, invertebrates, leaves, roots, fruits, seeds, and bulbs: O’Hara et al. 2012; Zosky et al. 2017); although typically bandicoots include more invertebrate material in their diet than do bettongs.
The apparent competition between quenda and woylies in this study flags the more general issue of competition between species, pertinent for managers planning multi-species reintroductions. Such reintroductions have become relatively commonplace, with little knowledge of potential adverse impacts of one species on another over time and through cycles of drought.
The quenda population maintained its numbers (as indexed by estimated density of captures per trap) despite the presence of a feral cat (cat density of 0.24 km−2: Short 2023) for the first 8 years of the study. While predation by feral cats seems likely (bandicoot Perameles nasuta were recorded in the stomachs of feral cats (Dickman 1996), and feral cats were implicated in the local extinction of a reintroduced population of bandicoots (Perameles bougainville) at Shark Bay, WA; (Short 2016)), no observations of predation on quenda were made and no significant impact was detected on the number of quenda recruits. However, quenda increased substantially in relative abundance post-2018, following the elimination of the cat and a return to average rainfall. Bandicoots can persist in the presence of feral cats under some circumstances. For example, bandicoots (I. obesulus) are widespread (albeit, not abundant) on Kangaroo Island where they co-exist with feral cats in the absence of foxes (Brown and Main 2010). At Wadderin, the single cat was at a fixed density (i.e. no numerical response) limiting major impact on the viability of the bandicoot population.
The relative indices of abundance for quenda used in this study (trap success and estimated density of captures per trap) were at their highest level recorded in the 12-year history of the population (11.8% trap success; 0.3 captures per trap) at the end of monitoring in 2022. This equated to a population density of ~0.5 ha−1 and a population size of ~200 individuals. Quenda at Wadderin have proved resilient in the face of drought and resource depletion and their prospects of persistence appear good as long as they are protected from fox predation and/or unregulated cat predation. Nevertheless, monitoring is likely to be an important ongoing action to inform management, particularly after periods of drought, continued high woylie numbers or prolonged or large-scale incursions by non-native predators. Standardised indices of abundance are simpler, have less onerous assumptions, and are often less labour intensive than measures of absolute abundance, so are likely more sustainable for long-term monitoring.
Occasional supplementation may be needed over the long-term, given the small size of the sanctuary and the absence of immigration, to maintain genetic diversity and counter demographic stochasticity. Local adaption at predator-free fenced sites such as Wadderin is likely to be driven more by food shortage and drought in contrast to unfenced sites, where predation is likely the primary influence on behaviour and survival.
Conclusion
Quenda were successfully reintroduced to Wadderin Sanctuary, on the margin of the species’ former range. A barrier fence that largely excluded foxes and feral cats is likely to have been key. Irruptive growth of a likely food competitor (Short 2023) and a succession of dry years appeared to contribute to resource depletion for quenda, impacting body condition and reproductive output, but paradoxically not recruitment. Hence the on-ground outcome appears be consistent with theory (Gaston 2009).
There have been some 30 reintroductions of this species across a gradient of annual rainfall (220–1040 mm) and rainfall variability (10 percentile from 54 to 83% of mean annual rainfall). About one-third have been to the wheatbelt, where rainfall is lower and more variable. Most wheatbelt reintroductions have been to sites protected by intensive baiting, rather than by fencing. Such sites have a residual population of predators that may not greatly impact during high rainfall years, but the effects of that predation may be amplified during drought.
Wadderin provides an example of a different form of management to sustain quenda populations to that used in the past; predator-proof fencing built and maintained by farmers rather than intensive baiting by government. The success of the reintroduction to Wadderin and the creation of new fenced sites in the wheatbelt by farmers suggests this could be a valuable supplement to existing management for re-establishing quenda and other species through the wheatbelt. Quenda is an ideal species to encourage such conservation efforts.
Data availability
The data that supports the findings of this study are available from the corresponding author upon reasonable request.
Declaration of funding
This research was funded by Wildlife Research and Management with support from the Western Australian State Natural Resource Management Program and a 25th Anniversary Landcare Grant.
Acknowledgements
I thank staff at Department of Parks and Wildlife for facilitating translocations, Andrew Hide for assisting with the translocation of quenda and with initial monitoring; the Narembeen community, particularly Brian Cusack for assistance throughout, and Peter Mawson, Matt Hayward, and an anonymous referee for providing helpful comments on earlier drafts of this manuscript. Research in this paper prior to 2021 was conducted by the author as a private consultant and so did not require animal ethics approval. From 2021, research and monitoring was covered by Permit No. RW3361/21 from the Murdoch University Animal Ethics Committee.
References
Brown GW, Main ML (2010) Draft National Recovery Plan for Southern Brown Bandicoot Isoodon obesulus obesulus. Victorian Government Department of Sustainability and Environment. Available at https://docslib.org/doc/10685529/national-recovery-plan-for-the-southern-brown-bandicoot-isoodon-obesulus-obesulus
Bubac CM, Johnson AC, Fox JA, Cullingham CI (2019) Conservation translocations and post-release monitoring: identifying trends in failures, biases, and challenges from around the world. Biological Conservation 238, 108239.
| Crossref | Google Scholar |
Christensen PES (1980) The biology of Bettongia penicillata Gray, 1837, and Macropus eugenii (Desmarest, 1817) in relation to fire. Forest Department of Western Australia Bulletin 91, 1-90.
| Google Scholar |
Cooper ML (1998) Geographic variation in size and shape in the southern brown bandicoot, Isoodon obesulus (Peramelidae: Marsupialia), in Western Australia. Australian Journal of Zoology 46, 145-152.
| Crossref | Google Scholar |
DBCA (2022) Western shield monitoring results: mammals – trapping transect and camera monitoring to December 2021. Department of Biodiversity, Conservation and Attractions. Available at https://library.dbca.wa.gov.au/FullTextFiles/202734.pdf
DCLM (1991) ‘A manual on fox control.’ (Department of Conservation and Land Management: Western Australia). Available at https://library.dbca.wa.gov.au/#record/31224
DEC (1995) Dryandra woodland management plan 1995–2005. Department of Environment and Conservation (DEC). Available at https://library.dbca.wa.gov.au/FullTextFiles/016789.pdf
DEC (2011) Dryandra Woodland Management Plan No. 70. Department of Environment and Conservation: Conservation Commission of Western Australia. Available at https://library.dbca.wa.gov.au/static/FullTextFiles/923058.pdf
DEC (2012) Quenda (Isoodon obesulus (Shaw, 1797). Available at https://library.dbca.wa.gov.au/static/FullTextFiles/925284.pdf
Dickman CR (1996) Overview of the impacts of feral cats on Australian native fauna. Australian Nature Conservation Agency, Canberra. Available at https://www.agriculture.gov.au/sites/default/files/documents/impacts-feral-cats.pdf
Efford M (2020) Getting started with secrapp 1.3. Available at https://www.otago.ac.nz/density/pdfs/secrapp-tutorial.html
Fischer J, Lindenmayer DB (2000) An assessment of the published results of animal relocations. Biological Conservation 96, 1-11.
| Crossref | Google Scholar |
Friend T (1997) Ecology and management of the southern brown bandicoot or quenda Isoodon obesulus. 1997 Fauna Conservation Course. Department of Conservation and Land Management. Available at https://library.dbca.wa.gov.au/FullTextFiles/018448/018448.014.pdf
Gallucci M (2019) GAMLj: general analyses for linear models. [jamovi module]. Available at https://gamlj.github.io/
Gaston KJ (2009) Geographic range limits: achieving synthesis. Proceedings of the Royal Society B: Biological Sciences 276, 1395-1406.
| Crossref | Google Scholar |
Gemmell RT (1982) Breeding bandicoots in Brisbane (Isoodon macrourus; Marsupialia, Peramelidae). Australian Mammalogy 5, 187-193.
| Crossref | Google Scholar |
Griffith B, Scott JM, Carpenter JW, Reed C (1989) Translocation as a species conservation tool: status and strategy. Science 245, 477-480.
| Crossref | Google Scholar | PubMed |
Hall LS (1983) Observations on body weights and breeding of the Northern Brown Bandicoot, Isoodon macrourus, trapped in south-east Queensland. Australian Wildlife Research 10, 467-476.
| Crossref | Google Scholar |
Hart D (1998) The northernmost surviving population of the southern brown bandicoot (Isoodon obesulus) in Western Australia. Western Australian Naturalist 22, 125-128.
| Google Scholar |
Heinsohn GE (1966) Ecology and reproduction of the Tasmanian bandicoots (Perameles gunni and Isoodon obesulus). University of California Publications in Zoology 80, 1-96.
| Google Scholar |
King DR, Oliver AJ, Mead RJ (1981) Bettongia and fluoroacetate: a role for 1080 in fauna management. Australian Wildlife Research 8, 529-536.
| Crossref | Google Scholar |
Kinnear JE, Sumner NR, Onus ML (2002) The red fox in Australia – an exotic predator turned biocontrol agent. Biological Conservation 108, 335-359.
| Crossref | Google Scholar |
Kitchener DJ, Chapman A, Muir BG, Palmer M (1980) The conservation value for mammals of reserves in the Western Australian wheatbelt. Biological Conservation 18, 179-207.
| Crossref | Google Scholar |
Krebs CJ, Singleton GR (1993) Indexes of condition for small mammals. Australian Journal of Zoology 41, 317-323.
| Crossref | Google Scholar |
Lohr C, Valentine L (2017) Enduring quenda. Landscope 33, 22-27.
| Google Scholar |
Mallick SA, Driessen MM, Hocking GJ (1998) Biology of the southern brown bandicoot (Isoodon obesulus) in south-eastern Tasmania. II. Demography. Australian Mammalogy 20, 339-347.
| Crossref | Google Scholar |
Mawson P (2004) Translocations and fauna reconstruction sites: Western Shield review - February 2003. Conservation Science Western Australia 5, 108-121.
| Google Scholar |
Morris KD, Armstrong R, Orell P, Vance M (1998) Bouncing back – Western Shield update. Landscope 14, 28-35.
| Google Scholar |
Morris KD, Johnson B, Muir B (2010) Fauna recovery in the wheatbelt. Landscope 26, 56-61.
| Google Scholar |
Morris KD, Page M, Kay R, Renwick J, Desmond A, Comer S, Burbidge A, Kuchling G, Sims C (2015) Forty years of fauna translocations in Western Australia: lessons learned. In ‘Advances in reintroduction biology of Australian and New Zealand fauna’. (Eds DP Armstrong, MW Hayward, D Moro, PJ Seddon) pp. 217–235. (CSIRO Publishing: Melbourne)
O’Hara PJ, Murray PJ, Klieve AV (2012) A review of the nutrition of Australian peramelid marsupials. Australian Mammalogy 34, 133-144.
| Crossref | Google Scholar |
Orell P (2004) Fauna monitoring and staff training: Western Shield review – February 2003. Conservation Science Western Australia 5, 51-95.
| Google Scholar |
Sanderson KJ, Kraehenbuehl J (2006) Southern brown bandicoots Isoodon obesulus obesulus in Belair National Park. Australian Mammalogy 28, 147-152.
| Crossref | Google Scholar |
Saunders DA (1989) Changes in the avifauna of a region, district and remnant as a result of fragmentation of native vegetation: the wheatbelt of western Australia. A case study. Biological Conservation 50, 99-135.
| Crossref | Google Scholar |
Sheean VA, Manning AD, Lindenmayer DB (2012) An assessment of scientific approaches towards species relocations in Australia. Austral Ecology 37, 204-215.
| Crossref | Google Scholar |
Short JC (2009) The characteristics and success of vertebrate translocations within Australia. Wildlife Research and Management Pty Ltd, Perth, WA. Available at http://www.wildliferesearchmanagement.com.au/Final%20Report_0609.pdf
Short J (2016) Predation by feral cats key to the failure of a long-term reintroduction of the western barred bandicoot (Perameles bougainville). Wildlife Research 43, 38-50.
| Crossref | Google Scholar |
Short J (2023) Irruptive dynamics of the brush-tailed bettong (Bettongia penicillata) when reintroduced to a fenced sanctuary with feral cats present. Wildlife Research 50(2), 85-95.
| Crossref | Google Scholar |
Short JC, Atkins L, Turner B (2005) Diagnosis of mammal decline in Western Australia, with particular emphasis on the possible role of feral cats and poison peas. CSIRO Sustainable Ecosystems, Perth. Available at http://www.wildliferesearchmanagement.com.au/Report_NGS.pdf
Stoddart DM, Braithwaite RW (1979) A strategy for utilization of regenerating heathland habitat by the brown bandicoot (Isoodon obesulus; Marsupialia, Peramelidae). Journal of Animal Ecology 48, 165-179.
| Crossref | Google Scholar |
Valentine L, Campbell R, Moore H, Beca G, Bohórquez Fandińo D, Palmer B, Reaveley A, Ryan C, Hobbs R (2021) Translocation of quenda (Isoodon fusciventer) alters microhabitat of urban bushland reserve. Brisbane, NESP Threatened Species Recovery Hub Project 4.1.7 report. Available at https://www.nespthreatenedspecies.edu.au/media/xkdpi2df/4-1-7-translocation-of-quenda-alters-microhabitat-of-urban-bushland-reserve-report_v3.pdf
Zosky KL, Wayne AF, Bryant KA, Calver MC, Scarff FR (2017) Diet of the critically endangered woylie (Bettongia penicillata ogilbyi) in south-western Australia. Australian Journal of Zoology 65, 302-312.
| Crossref | Google Scholar |