How does the HIV epidemic in NSW compare to other Australian jurisdictions and internationally?
Michelle E. McPherson A and Kate A. Ward A BA Communicable Diseases Branch, NSW Department of Health
B Corresponding author. Email: kward@doh.health.nsw.gov.au
NSW Public Health Bulletin 21(4) 55-60 https://doi.org/10.1071/NB10009
Published: 27 May 2010
Abstract
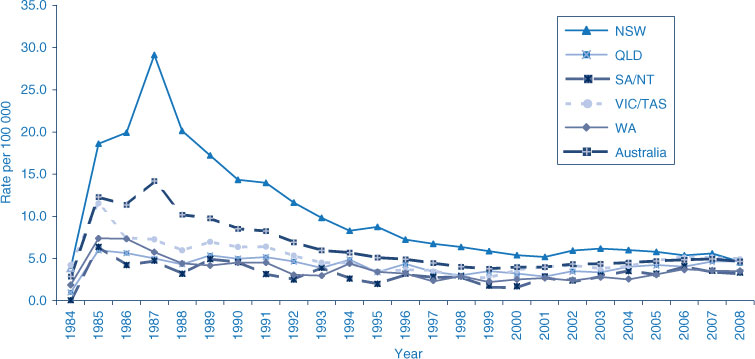
Aim: To review the epidemiology of HIV in NSW and compare HIV rates in NSW with those of other comparable jurisdictions. Method: The rate of newly diagnosed cases of HIV reported in NSW was compared with those published from other Australian and comparable international jurisdictions. Results: Until recent years, NSW has consistently reported the highest rate of newly diagnosed HIV infections in Australia with a peak of 29.1 per 100 000 population in 1987. Since then the notification rate has decreased significantly and has been stable since 2000 at an average annual rate of 5.6 per 100 000. Rates in NSW and in other Australian states and territories are lower than most comparable international jurisdictions, although stability in rates has been observed elsewhere. Between 1984 and 2008, 82% of infections that reported a risk exposure occurred among men who have sex with men. Conclusion: Rates of HIV infection in NSW have been stable over the last decade, remaining among the highest in Australia but lower than those in other comparable industrialised jurisdictions. In NSW, the majority of cases continue to occur among men who have sex with men.
Human immunodeficiency virus (HIV) has been a notifiable disease in New South Wales (NSW) since 1985, shortly after laboratory testing for HIV became available. The purpose of HIV surveillance in NSW is to monitor the epidemiology of HIV infections in NSW to inform the development of better prevention strategies. By 2008, there had been 28 330 diagnoses of HIV in Australia, with 54% occurring in NSW, with the most common risk behaviour being men who have sex with men.1 Previous studies have shown that, since the late 1990s, NSW, which has stable rates of newly diagnosed HIV in men who have sex with men, is unique compared with other industrialised countries.2,3 In this paper we describe the HIV epidemic in NSW and compare NSW rates to those of other Australian jurisdictions and those of comparable international industrialised jurisdictions.
Methods
HIV epidemiology in NSW
Six HIV reference laboratories confirm newly diagnosed HIV infections in NSW. Under the Public Health Act 1991, these laboratories are required to report all confirmed HIV infections to the NSW Department of Health, using a nationally standardised case definition.4 Laboratories must send a standard notification form with the HIV-positive result to the treating medical practitioner seeking detailed demographical, clinical and HIV risk behaviour information about the patient. The completed form is then forwarded to the NSW Department of Health and the information entered in a secure database.
NSW residents diagnosed with their first positive HIV test in NSW were the subject of this analysis and defined as cases. As a person remains HIV positive for life and can have more than one confirmatory test performed, all new HIV diagnoses were matched against those already on the database. People were excluded from the analysis if they were already on the database, were not NSW residents or reported a previous positive-HIV test outside NSW. A case of newly acquired HIV infection was defined as a person with either a negative or indeterminate HIV antibody test or a seroconversion illness in the 12 months prior to HIV diagnosis. A case of late-diagnosed HIV was defined as having an acquired immune deficiency syndrome (AIDS)-defining illness within three months of HIV diagnosis and/or a CD4 count less than 200 cells/mm3 in the absence of a seroconversion illness. Information to determine the stage of diagnosis has only been collected in NSW since 2000 and is thus reported from 2000 onwards.
Risk exposure information was provided by the treating medical practitioner using the notification form. Where more than one risk exposure was reported, a hierarchy of risk was used to designate the case’s primary risk exposure – that most strongly associated with transmission of HIV. Homosexually acquired infection was always considered the primary risk exposure if it was reported. High prevalence countries or regions are those where the prevalence of HIV in the population is more than 1% and included Sub Saharan Africa, Thailand, Burma, Cambodia, the Caribbean and Papua New Guinea. Since 1996 the category of heterosexual risk exposure has included cases who have been exposed to these high prevalence countries and other heterosexual exposures, most of which were not further defined.
National and international comparisons
The numbers of newly diagnosed HIV cases in other Australian jurisdictions were obtained from the National Centre for HIV Epidemiology and Clinical Research (NCHECR) 2009 Australian HIV Public Access Dataset5 (which includes those individuals who have previously been diagnosed overseas) and rates were calculated using estimated resident populations from the Australian Bureau of Statistics.6 HIV notifications by number, rate and proportion acquired by men who have sex with men were also sought from comparable international jurisdictions that had data publicly available from 2000, including Canada,7 the United Kingdom (UK),8 New Zealand,9 the European Union countries,10 the United States of America including San Francisco11 and New York.12 Rates for the USA only included those from states with confidential name-based HIV infection reporting for 2004 to 2007.13–16 Where rates were not provided in these reports, they were calculated using reported population estimates.17,18 The case definitions used in these jurisdictions all include laboratory confirmation of HIV infection.
Results
Since 1984, 15 106 NSW residents have been newly diagnosed in NSW. The rate of newly diagnosed HIV infections peaked in NSW in 1987 at 29.1 per 100 000 population (Figure 1). Since then the notification rate has decreased significantly and has been stable since 2000 with an average annual rate of 5.6 per 100 000 population.
Risk exposures in NSW
The most common risk behaviour for newly diagnosed HIV since the beginning of the epidemic in NSW was men who have sex with men who included 64% of all cases between 1984 and 2008, or 82% of those with a risk exposure reported. This rate has been consistent over the epidemic and stable since 2000.
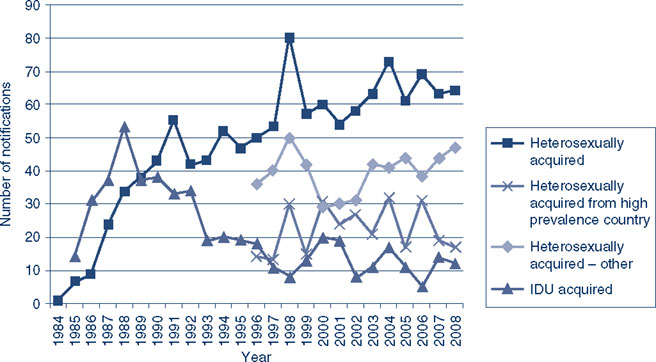
Heterosexual transmission is the second most commonly reported risk factor in NSW. Since 1996, HIV acquisition in people from high prevalence countries increased from a low of 13 in 1997 to a high of 32 in 2004, with an average of 22 cases per year. Notifications in other heterosexually acquired HIV infections have fluctuated between a low of 29 cases in 2000 and a high of 50 cases in 1998 with an average of 40 cases per year. The number of cases reporting injecting drug use as their risk exposure decreased over the epidemic from a high of 53 in 1988 to a low of 5 in 2006, with an average of 21 cases per year since the beginning of the epidemic and 13 per year since 2000 (Figure 2).
Risk exposures through receipt of blood or tissue, and haemophilia and coagulation disorders were highest in 1985 at 28 and 50 cases respectively. Since the mid 1990s there have been no reported cases of HIV transmission through the receipt of a blood or tissue product, except for one case where the exposure occurred in the early 1980s. Vertical transmission (from mother to child) was reported as the risk exposure for an average of two cases per year since the beginning of the epidemic, with the highest number reported in 1991 at five cases. Where country of birth was reported (n = 29), most cases acquired through vertical transmission (76%) were born in Australia. The percentage of cases with unreported risk exposures ranged from 44% in 1986 to 1% in 2008 with an average of 17% per year.
Stage of infection at HIV diagnosis
Between 2000 and 2008, 25% to 39% of newly diagnosed cases each year were classified as newly acquired, and 11% to 21% as late-diagnosed infections per year. In 2008, when only 4% of cases had an unknown stage of diagnosis, almost half (45%) of homosexually acquired cases had evidence of newly acquired infection and 10% (24 cases) had evidence of late diagnosis. Of the heterosexually acquired cases associated with high prevalence countries, 24% presented early and 24% presented late in the infection. Of the remaining people with heterosexually acquired HIV infections, 19% were diagnosed early and 23% late.
National comparisons
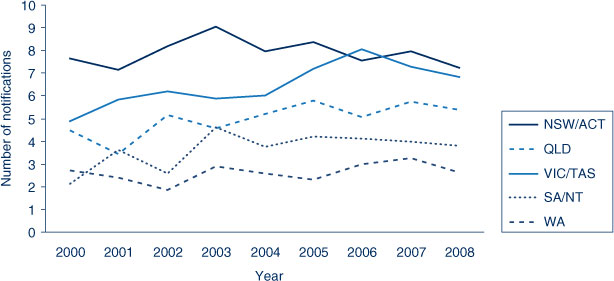
NSW has consistently reported the highest notification rates although in 2008 the notification rate for NSW was similar to those of Victoria and Tasmania (combined), and Queensland (Figure 1). NSW has reported stable rates of newly diagnosed HIV infections in men reporting homosexual contact since 2000 at an average of 7.9 per 100 000 men. Stable rates, albeit at lower levels, have also been reported in other Australian jurisdictions except for Victoria where the notification rate increased between 2004 and 2006 with a subsequent decline (Figure 3).
|
International comparisons
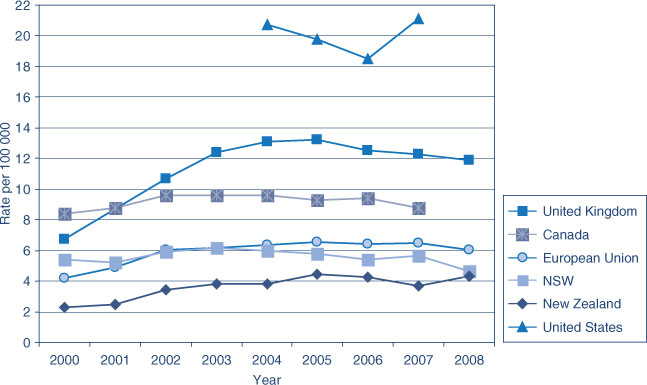
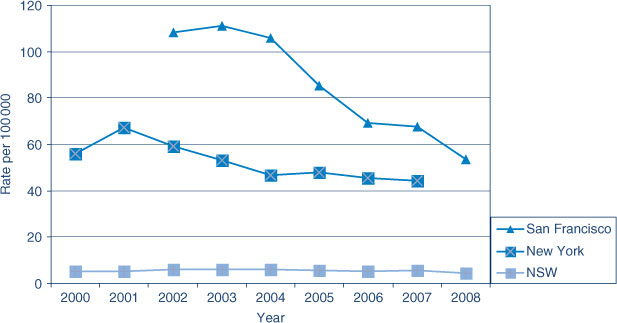
The rate of people newly diagnosed with HIV since 2000 in NSW and the rest of Australia was lower than in other similarly developed jurisdictions reviewed, except for New Zealand. Like NSW, the rates of newly diagnosed HIV in most of these other jurisdictions have remained stable over the last few years (Figure 4), except in New York City and San Francisco, where the rates, although much higher than NSW, have decreased (Figure 5).
|
Discussion
NSW has consistently had the highest rates of newly diagnosed HIV in Australia since the beginning of the HIV epidemic in the early 1980s. The rate of newly diagnosed HIV has stabilised in the last decade in NSW, which was not observed in other Australian jurisdictions until more recent years. Notification rates nationally have converged.19 The apparent decline in NSW in 2008 was likely due in part to improved identification of people who had previously tested positive for HIV infection. The NSW epidemic has occurred predominately in men who have sex with men, although there has been a modest increase in the number of cases reporting heterosexual acquisition since the mid 1990s. Acquisition through injecting drug use has been minimal in the latter half of the epidemic with the other risk exposures, such as blood products, rarely occurring since early in the epidemic.
NSW has lower rates of newly diagnosed HIV than other comparable international jurisdictions except New Zealand, and is not alone in reporting stable rates in the last decade, particularly for men who have sex with men.2,3 Canada reported that a fifth of its cases were exposed through injecting drug use; the peak number of HIV notifications for men who have sex with men, 581, in 2004 has decreased each year to 515 for 2007.7 San Francisco reported similar proportions of men who have sex with men as NSW of between 62% and 70% each year between 2002 and 2008; the decline in the total rate of HIV over the last decade corresponds to a decrease in the rate of HIV in men who have sex with men.11 New York, for the three years of data available, had similar annual numbers of cases of HIV diagnosed in men who have sex with men.12 In contrast, in the UK, half the HIV cases are reported as being heterosexually acquired, mostly in migrants from Sub-Saharan Africa. There are also reports of increasing numbers of cases occurring among men who have sex with men.20 New Zealand and the European Union countries also reported higher proportions of heterosexual acquisition compared with NSW, and also a doubling of the number of men who have sex with men since 2000.10,17
The use of notification data for reporting the HIV epidemic has its limitations as these data neither represent the total number of people with HIV infection (prevalence) or the number of people with newly acquired infection each year (incidence). Notification data reflect only those who have been tested and diagnosed with HIV. Given that HIV is a chronic infection with a long latent period and that routine laboratory testing does not distinguish newly acquired cases of HIV from other cases it is impossible to accurately determine the timing of disease acquisition for many newly diagnosed infections. Newly diagnosed people who test more frequently are more likely to be identified as newly acquired thus comparisons between risk behaviours and countries with different testing practices should be made with caution.
[1]
[2] Grulich AE, Kaldor JM. Trends in HIV incidence in homosexual men in developed countries. Sex Health 2008; 5 113–8.
| Crossref | GoogleScholarGoogle Scholar | PubMed | (Cited 13 August 2009.)
[5]
[6]
[7]
[8]
[9]
[10]
[11]
[12]
[13]
[14]
[15]
[16]
[17]
[18]
[19] Guy R, McDonald A, Bartlett M, Murray J, Giele C, Davey T, et al. HIV diagnoses in Australia: diverging epidemics within a low-prevalence country. Med J Aust 2007; 187(8): 437–40.
| PubMed |

[20] Lattimore S, Yin Z, Logan L, Rice B, Thornton A, Molinar D, et al. Situation of HIV infections and STIs in the United Kingdom in 2007. Euro Surveill 2008; 13(49): 1–2.


