

Spatial and temporal habitat use of humpback whales (Megaptera novaeangliae) in relation to vessel traffic in the Gold Coast Bay, Australia
Jana Djukarić A B and Jan-Olaf Meynecke B C D *
A
B
C
D
Abstract
Humpback whales utilise coastal habitats for breeding, resting and migration where, at low latitudes, they are often exposed to vessel traffic. The Gold Coast bay (GCB) in south-eastern Queensland, Australia, is utilised by humpback whale mother–calf pairs to rest.
Identify core habitats of pods with and without calves and interception by vessel traffic in the GCB.
In total, 4319 whale-sighting records from citizen science-collected data on board whale-watching vessels between 2011 and 2020 were used in this analysis. MaxEnt models were generated to determine species distribution of pods with and without calves. The distribution model was compared with automatic identification system-fitted vessel traffic available from the Australian Maritime Safety Authority over the same time to infer potential vessel impact on these sensitive cohorts.
Habitat use of pods with calves was focused on shallower areas close to shore and overlapped with the core habitat of pods without calves 5 km into the bay. Vessels intercepted up to 80% of the core habitat.
Vessel traffic poses a potential threat to humpback whale mother–calf pairs.
An assessment of all vessels leaving the seaway should be considered for the GCB and whale caution zones for vessel traffic.
Keywords: citizen science, distribution, disturbance, habitat modelling, marine conservation, marine mammals, MaxEnt, resting, vessel traffic, whales.
Introduction
Humpback whale populations are distributed across the world’s oceans, both north and south of the equator. Eastern Australian humpback whales, referred to as ‘breeding stock E1’ by the International Whaling Commission (IWC), migrate between their summer feeding grounds (December–March) in Antarctica to their winter breeding grounds (May–October) in the Coral Sea (Chaloupka and Osmond 1999; Smith et al. 2012; Andrews-Goff et al. 2018). Although breeding areas are more defined for other humpback whale populations, such as stock D, the breeding grounds for E1 cover the vast area of the Great Barrier Reef (GBR) and are therefore less spatially distinct (Smith et al. 2012, 2021). Generally, habitat used for breeding and calving has been associated with warm and shallow waters (Rasmussen et al. 2007; Félix and Botero-Acosta 2011; Smith et al. 2012; Chou et al. 2020). Pods with calves (PWC), which can be accompanied by male or female escorts for protection, inhabit these areas to find shelter from wind and currents, avoid possible predation from orcas (Orcinus orca) (Félix and Botero-Acosta 2011) and to avoid males seeking copulation (Elwen and Best 2004; Craig et al. 2014). These calm and protected areas allow PWC to rest, which helps maintain the mother’s body condition and promotes faster growth for the calf (Bejder et al. 2019). Additionally, undisturbed mother and calf interactions are important for the early physical and cognitive development of calves (Faria et al. 2013).
Resting and aggregation areas for mother–calf pairs during the southern migration have been identified in Hervey Bay (Franklin et al. 2011), Gold Coast Bay (GCB), and Jervis Bay (Queensland and New South Wales) (Meynecke et al. 2013; Bruce et al. 2014; McCulloch et al. 2021). These areas have been the focus of active research, suggesting that other parts of the coastline may also serve as resting areas for mother–calf pairs. Moreover, a southern expansion of the calving area has been suggested, with newborn calves sighted during the northern migration in the GCB in south-eastern Queensland (Torre-Williams et al. 2019). It remains unclear whether shifts in ocean conditions induced by climate change or an increase of the population is driving such an expansion of breeding areas. The GCB is an important habitat for migrating humpback whales and shows a certain plasticity regarding the whale calving habitat (Torre-Williams et al. 2019). Research within the GCB has shown that one-third of the observed pods are mother–calf pairs, with most being present in October and generally found 2 km closer to shore than are pods without calves (Valani et al. 2020).
Species distribution models using maximum entropy models have been applied for humpback whales in, for example, Smith et al. (2012), Bombosch et al. (2014), Lindsay et al. (2016) and Derville et al. (2018), so as to provide a better understanding of the species core habitats. The software MaxEnt (ver. 3.4.4, S. J. Phillips, M. Dudik and R. E. Shapire, see https://biodiversityinformatics.amnh.org/open_source/maxent/) has been specifically developed to analyse presence-only data (Phillips et al. 2006) and models suitable habitat based on environmental conditions. It offers advantageous features, for example, the integration of interactions among environmental variables and model-evaluation features but is also known for overfitting, meaning that the suitable habitat is too close to the training dataset (e.g. Anderson and Gonzalez 2011; Radosavljevic and Anderson 2014).
Because systematic surveys are expensive, the collection of presence-only data, such as from opportunistic observations from whale-watching vessels, has become more common (Burns et al. 2014; Acevedo et al. 2017; Pacheco et al. 2021). For example, Pacheco et al. (2021) used whale-watching data to create different MaxEnt models based on pod composition in northern Peru. They concluded that effective conservation measures should include restricting whale-watching vessels and reducing the use of gill-nets.
Dividing humpback whales on the basis of pod composition allows to predict habitat suitability more precisely, and it also accounts for variability in habitat requirements. Additionally, different cohorts of humpback whales also display different behaviours. Pods without calves (singles, pairs, trios and larger pods) primarily engage in mating behaviour further away from the shore, whereas mother–calf pods mainly rest nearshore (Cartwright and Sullivan 2009; Dulau et al. 2017).
The presence of vessels and vessel noise have been identified as a cause of distress and behavioural changes in various places, with whales showing avoidance behaviour to vessels (Baker and Herman 1989; Stamation et al. 2010). This can include a decreased communication range for songs and social sounds because of commercial, fishing and whale-watching vessels (Clark et al. 2009; Cholewiak et al. 2018; Dunlop 2019), and song termination after vessels have passed whales (Tsujii et al. 2018). Vessel presence might also disturb mother–calf communication as a result of masking communication space (Indeck et al. 2022). Vessel strikes pose a direct threat to humpback whales, and especially to mother–calf pairs because of their longer surface times and slower swim speed than those of pods without calves (Currie et al. 2017, 2021; Smith et al. 2020). In Moreton Bay, Queensland, Australia, which is neighbouring the GCB in the north, Mayaud et al. (2022) quantified ship strike risk from commercial vessels to humpback whales. Ship strike risk increased during the humpback whale’s southern migration (September–October), owing to shipping lanes crossing habitats with a predicted high density of mother–calf pairs.
Humpback whales are protected in Australian waters under various conservation plans, such as the National Strategy for Reducing Vessel Strike on Cetaceans and Other Marine Megafauna (Department of Environment and Energy 2017a); however, a region-specific protection such as reduced vessel speed in high-density areas of whales is not in place.
In the GCB, the waterways are heavily used by recreational and, daily, by commercial vessels. Cargo vessels cross the seas along the continental shelf outside the bay area. Anecdotal reports of vessel strikes in the region have been documented. This high level of vessel traffic is cause for concern and impacts to humpback whales, particularly mother–calf pairs, should be addressed.
For effective conservation management to be developed and implemented, the habitat use of humpback whales, especially for pods with calves, needs to be further investigated and quantified. The aim of this study is to evaluate suitable habitat of pods with and without calves in the GCB and assess the potential impact of vessel traffic on their predicted core habitats.
Materials and methods
Study area
The study site is located in the coastal waters of the Gold Coast in Queensland, Australia (Fig. 1). The climate in the region is characterised by a subtropical hot and humid wet season (November–April) and a mild dry season (May–October) (see https://www.australia.com/en/facts-and-planning/weather-in-australia/gold-coast-weather.html).
Map of study area located in the GCB, reaching from Tugun to Jumpinpin on the eastern coast of Queensland, Australia. Contour lines are 5-m intervals. The red circles mark the seaway. Black line indicates survey area or extension of whale-watch operator. Insert images: the upper image shows the location of the study area in Australia, the lower image shows the location of the port entrance, and the map of Australia shows the location of Byron Bay (BB) and Hervey Bay (HB).
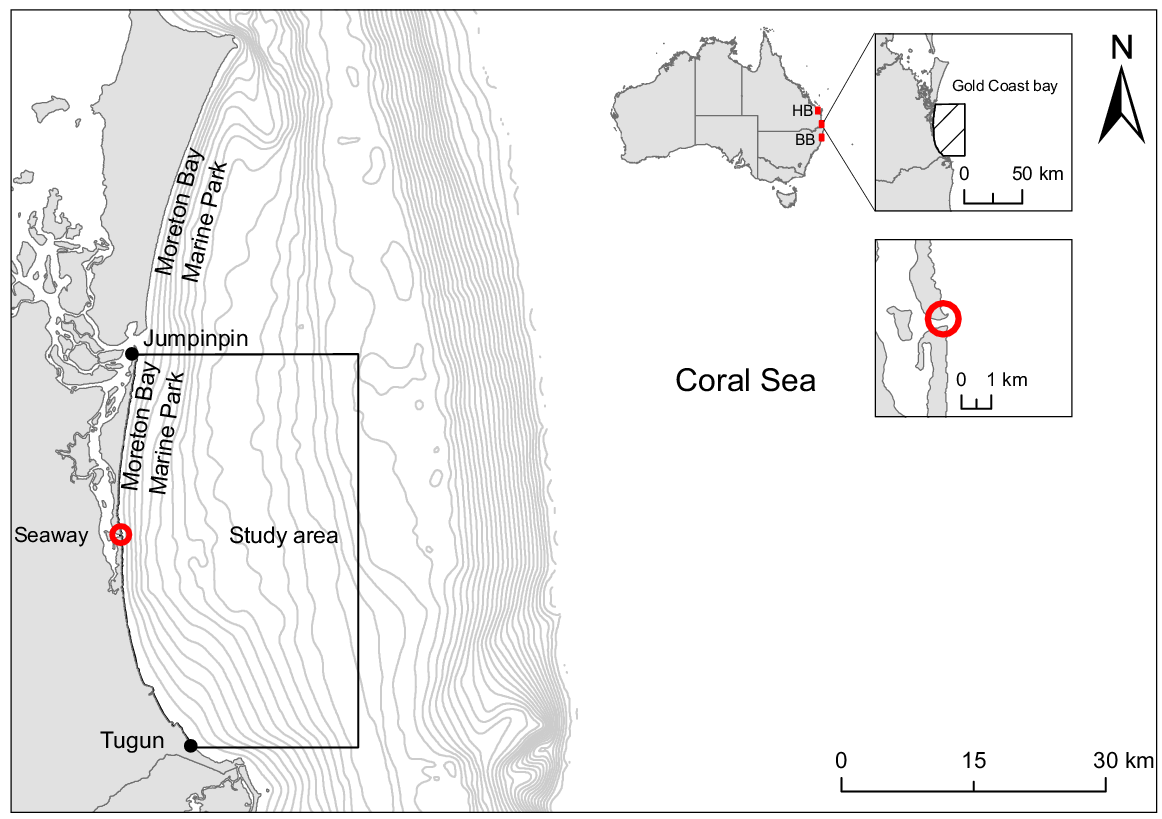
The GCB is a shallow, sickle-shaped bay facing towards the Coral Sea. It stretches from Point Lookout in the north (27.458°S, 153.558°E) to Tweed Heads in the south (28.168°S, 153.558°E), with a mean water depth from 20 to 80 m. The annual sea-surface temperature (SST) ranges from 20.4 to 28.2°C. The study area reached from Tugun in the south (28.15°S, 153.5°E) to Jumpinpin in the north (27.75°S 153.44°E) and was defined by the main operation area of whale-watching vessel in the region and covers 95% of all surveys over the study period. The study area extends 30 km into the bay and 40 km from north to south, covering ~1000 km2. The Moreton Bay Marine Park extends 3 nautical miles (~5.5 km) into the GCB and is located north of the seaway and a restricted zone for whale-watching vessels, resulting in no or very few whale-sighting records in that area. The seaway is the only port in the bay for ships and vessels to enter and leave the Gold Coast Broadwater (Fig. 1).
The city is one of the fastest-growing cities in Queensland (Queensland Government Statistician’s Office 2023) and a popular destination for tourists (City of Gold Coast 2014; Burton 2017). In the Brisbane maritime area, which includes the Gold Coast city, recreational vessels increased from 132,150 in 2011 (Department of Transport and Main Roads 2016) to 150,231 in 2020 (Department of Transport and Main Roads 2020), with 1380 vessels carrying an automatic identification system (AIS-fitted vessels) registered in the GCB in 2020 (Table 1). The use of AIS is not mandatory for recreational or small commercial vessels. The majority of vessels will not carry an AIS and the total number of vessels is therefore higher.
| Month | 2013 | 2014 | 2015 | 2016 | 2017 | 2018 | 2019 | 2020 | |
|---|---|---|---|---|---|---|---|---|---|
| January | 50 | 58 | 61 | 91 | 108 | 147 | 110 | 139 | |
| February | 44 | 39 | 52 | 59 | 67 | 65 | 55 | 109 | |
| March | 46 | 44 | 59 | 82 | 77 | 91 | 116 | 105 | |
| April | 60 | 64 | 70 | 108 | 95 | 126 | 161 | 84 | |
| May | 52 | 66 | 77 | 91 | 149 | 188 | 203 | 77 | |
| June | 50 | 60 | 85 | 86 | 89 | 161 | 159 | 104 | |
| July | 59 | 78 | 104 | 116 | 140 | 172 | 209 | 157 | |
| August | 46 | 66 | 79 | 123 | 138 | 61 | 182 | 136 | |
| September | 45 | 51 | 59 | 83 | 129 | 131 | 151 | 106 | |
| October | 38 | 60 | 77 | 101 | 117 | 133 | 178 | 99 | |
| November | 61 | 62 | 104 | 112 | 130 | 157 | 168 | 129 | |
| December | 59 | 63 | 74 | 117 | 129 | 126 | 183 | 135 | |
| Mean | 51 | 59 | 75 | 97 | 114 | 130 | 156 | 115 | |
| Mean season (1 June–31 October) | 48 | 63 | 81 | 102 | 123 | 132 | 176 | 120 | |
| All | 610 | 711 | 901 | 1169 | 1368 | 1558 | 1875 | 1380 |
Data collection
From 2011 to 2020, opportunistic surveys at sea lasting 2.5 h per survey were conducted from 1 June to the 31 October (here referred to as season) by the NGO Humpbacks & High-rises onboard participating commercial whale-watching vessels, which were also AIS-fitted vessels. Vessels have to keep a 100-m distance from whales, 300 m if three or more boats are present or if the vessel is moving faster than 6 knots (~11.1 km h−1; Nature Conservation (Animals) Regulation 2020 (Qld), see https://www.legislation.qld.gov.au/view/html/inforce/current/sl-2020-0136). After a pod was sighted, it was followed in a distance according to the legislations. A pod describes a singleton (one individual) or multiple humpback whales swimming closely together (Corkeron et al. 1994).
During the sighting, GPS coordinates of the vessel were recorded when whales were first located and when the sighting ended (further referred to as located and departed points). Furthermore, date and time of humpback whale observations, water depth at vessel position at the survey starting time, pod size and composition, cardinal direction of movement, and presence or absence of calves were collected by two or three trained observers as a group crowdsourcing their information. In the following, pods with calves (PWC) include all pods including at least one calf or calves by themselves (i.e. mother not surfaced). Pods without calves (PNC) include singles, dyads (group of two whales), trios and larger pods including juveniles without any calf present. Humpback whales under 10 m in total length were considered juveniles and whales under 6 m were considered calves when accompanied by a significantly larger whale with whom they maintained a constant and close relationship (Tyack and Whitehead 1983).
Data analysis
All spatial analyses were undertaken in ArcGIS (ver. 10.8.1, see https://www.arcgis.com/) and R (ver. 4.0.2, R Foundation for Statistical Computing, Vienna, Austria, see https://www.r-project.org/). Duplicates, and incorrect or incomplete whale sightings were not included in the analyses (210 sightings). This included sightings with missing or incorrect GPS positions and times.
Environmental variables
Environmental variables previously identified as important factors for humpback whale distribution during breeding and resting were used as possible predictors in the MaxEnt model (Smith et al. 2012; Meynecke et al. 2021). These were sea-surface temperature (SST), bathymetry, distance to shore (distance) and slope and rugosity.
Daily SST data were largely obtained from raw and gridded satellite observations from the MODIS missions. These data were obtained from Copernicus, NASA or AODN web portals (see https://earthobservatory.nasa.gov/images/1869/modis-global-sea-surface-temperature). Data could be retrieved for 573 days during the study period and the mean temperature was used in the MaxEnt model.
Bathymetry data were taken from the high-resolution depth model for the Great Barrier Reef, with a resolution of 30 m available from Geoscience Australia (Beaman 2017), and were clipped to the study-area extent. Distance to shore was calculated in ArcGIS by using the ‘Euclidean distance’ tool and the GEODATA COAST 100K 2004 dataset of Geoscience Australia (see https://www.ga.gov.au), generating a raster with a 30-m resolution for the study area. Distance to shore and bathymetry were strongly correlated. Distance to shore can be interpreted as distance from anthropogenic impacts and high collinearity might not influence a maximum entropy model in a significant way (Kramer-Schadt et al. 2013).
Slope and rugosity were calculated with the Benthic Terrain Modeler (ver. 3.0, see https://esriurl.com/5754; Walbridge et al. 2018) utilising the bathymetry raster. Rugosity (complexity or roughness of seafloor) was defined as the ratio of surface area to planar area (metric: SAPA), with flat terrain being represented by a value of 1 and higher values reflecting increasing roughness.
Because the study area was nearshore, sufficient data for chlorophyll were not available for most days and, thus, it had to be omitted as a variable. Because the region is not primarily used for feeding by humpback whales, it was considered to be likely a neglectable driver for the species distribution in this region.
Species distribution model
Habitat use of humpback whales in the GCB was modelled using the software MaxEnt (ver. 3.4.4).
MaxEnt is based on the maximum-entropy method and has been especially developed for presence-only data (Phillips et al. 2006). It is a machine learning method, which associates environmental variables with occurrence data and relates them to those associated with randomly selected pseudo-absences (background data) to predict the most suitable habitat. Initially, MaxEnt fits a uniform probability distribution over the background data, which is repeatedly optimised to improve model fit, expressed in satisfaction of constraints (functions of environmental variables). The most unconstrained fit (maximum entropy) with respect to environmental attributes is a probability distribution of habitat suitability, thus values closer to 1 represent a prediction of higher suitability and therefore higher probability of occurrence (Phillips et al. 2006; Phillips and Dudík 2008; Elith et al. 2011).
Sample bias was accounted for by spatial thinning of the located points with the function ‘thin’ in the R package ‘spThin’ (ver. 0.2.0, see https://cran.r-project.org/package=spThin; Aiello-Lammens et al. 2015), by using 1 km for spatially filtering to account for the size of study area and density of data points. Reducing sample bias by thinning occurrence points can yield better performances (Kramer-Schadt et al. 2013; Fourcade et al. 2014).
The selection of settings for MaxEnt has been assessed using the R package ‘ENMeval’ (ver. 2.0.5, see https://jamiemkass.github.io/ENMeval/; Muscarella et al. 2014). Hereby, combinations of feature classes (linear, quadratic product and hinge) with regularisations multipliers (RM; 1–5) were checked to find the optimal combination for the model. The package calculated the Akaike information criterion (AIC) and the combination with the lowest number was chosen. For the PWC model, linear, quadratic, product, and hinge features and a RM of 2 were selected. The model for PNC was based on linear and quadratic features only with a RM of 1. Over- or under-predictions have been minimised by setting the maximum number of iterations to 5000, giving the model enough time for convergence (Young et al. 2011). The models were replicated 50 times and the replicated run type was set to ‘crossvalidate’. The remaining settings were set to default mode. The study area covered close to 1000 km2 and sample sizes of 131 locations for PWC (767 before thinning) and 189 locations for PNC (1014 before thinning) were used to generate two different models on the basis of located points only to reduce bias by swim-direction alteration owing to vessel presence.
For evaluation purposes, jack-knife tests were performed to assess individual contribution of the environmental variables to the model. For each model, the area under the curve (AUC) of the receiver operator characteristic (ROC) was used to evaluate model fit. A higher AUC (0–1) indicates a better model performance, with an AUC of 0.5 indicating that the performance is equal to a random prediction.
Vessel data
Available data on vessels carrying the automatic identification system (AIS) were utilised to depict vessel traffic in the study area. Data from 2013 to 2020 were accessed from the Australian Maritime Safety Authority (AMSA, see https://www.operations.amsa.gov.au/Spatial/DataServices/DigitalData) to compare changes in vessel traffic in the GCB over the study period. Data for earlier years were not available by month and were in a different format; thus, 2013 was selected as the earliest year. The vessel data were clipped to the study area and a ‘Line_ID’ was created in R for every unique combination of ‘Vessel_ID’ and ‘date’. The same vessels crossing the study area multiple times per day were not reflected in this summary. The variable was used to create shipping lines using ‘Points to Line’ in ArcGIS. A summary of vessel count by month was calculated in R. To calculate the percentage of vessels intersecting core habitat (0.8–1 suitability) and the percentage of core habitat being intercepted, the output raster file of MaxEnt was reclassified in steps of 0.1. To select vessel lines which intercepted core habitat during the season, the function ‘Select by location’ was used.
Results
In 1235 h of observation time, a total of 1779 pods were sighted, accounting for 4319 whales, with a mean number of 2.4 whales per pod and a maximum of 11 individuals. PWC made up 43% of all sighted pods.
MaxEnt model
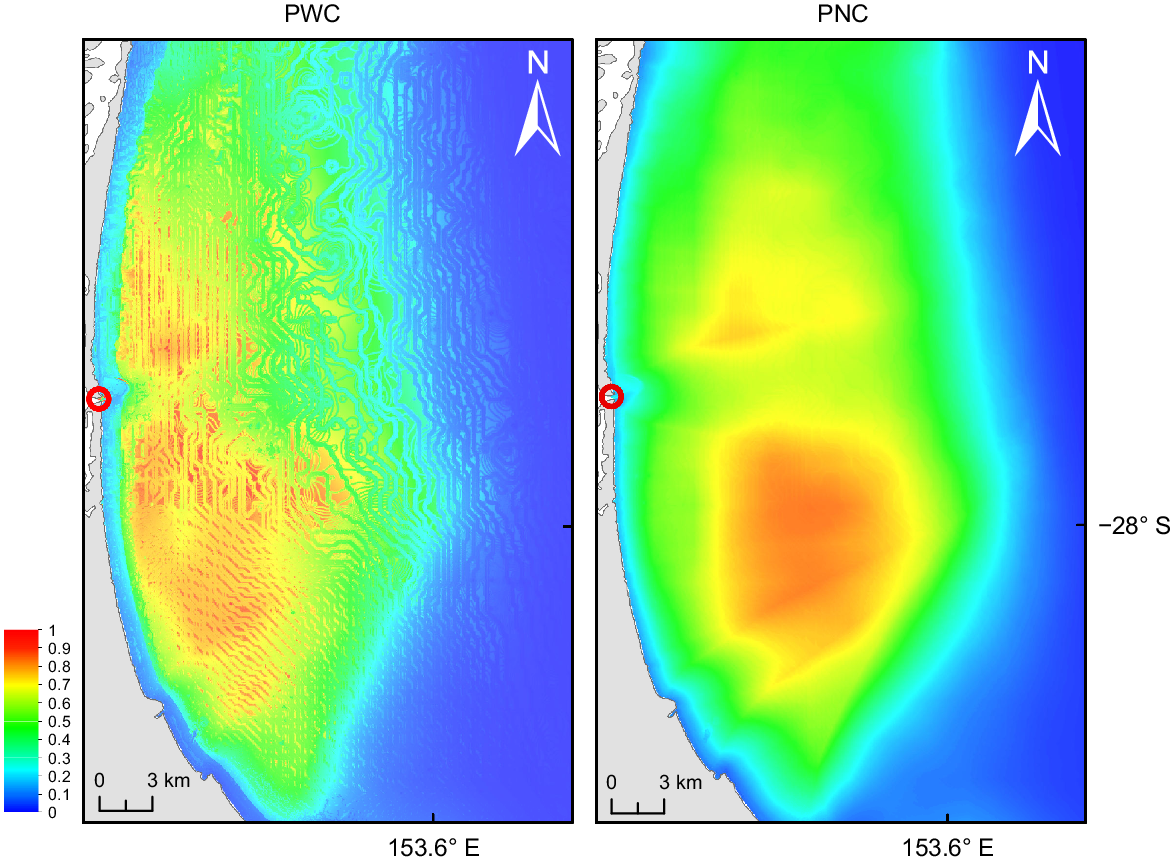
The model for PWC performed with a mean AUC of 0.801. It predicted core habitat starting 1.5 km from shore in the neritic realm between 10- and 50-m depth (Fig. 2). Suitable habitat stretched along the coast with a greater suitable area predicted south of the seaway than north of it.
MaxEnt output of habitat suitability for pods with calves and for pods without calves. The bar indicates potential habitat suitability from no probability (0) to high probability (1). The red circles mark the seaway.
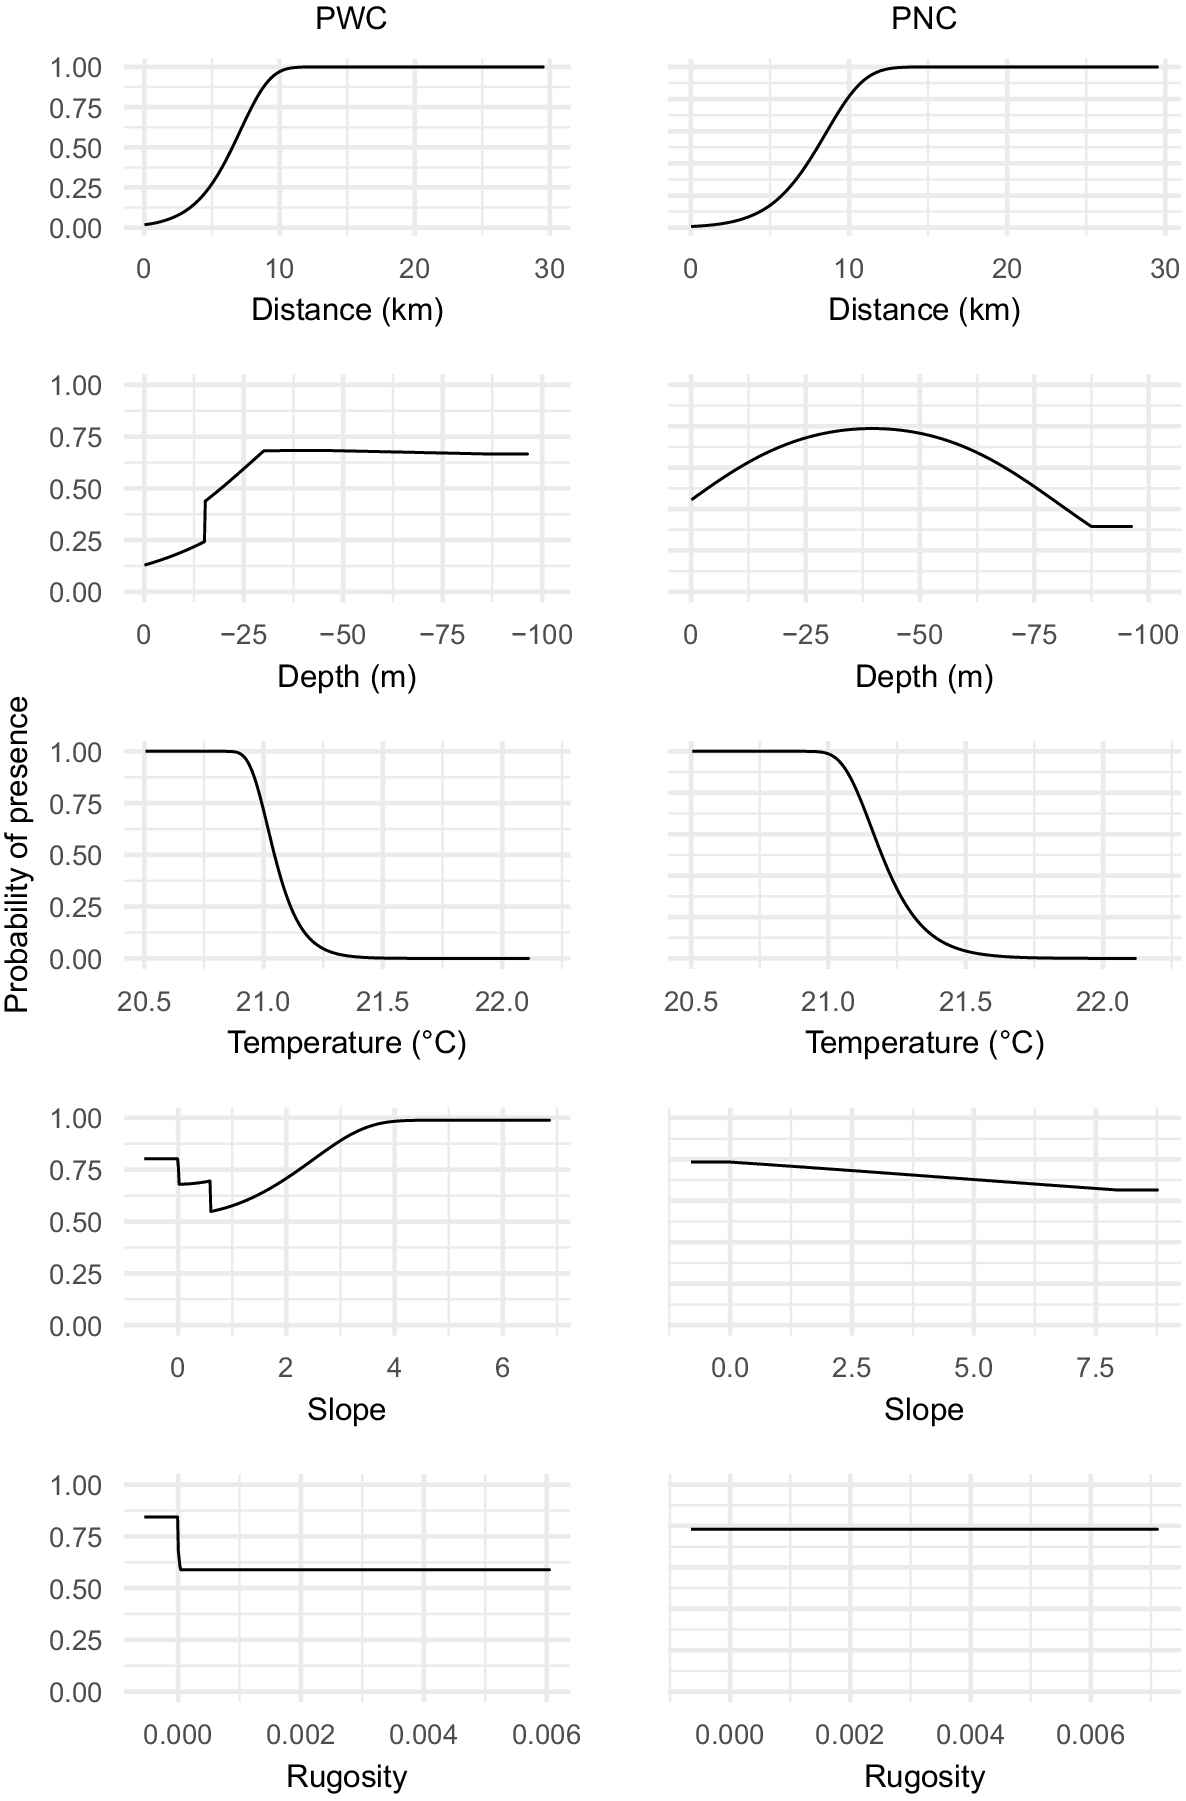
SST and bathymetry were the most important environmental predictors, contributing 45.3 and 33.6% to the habitat-suitability model respectively. According to the jack-knife test, distance to shore was a contributing variable and bathymetry the most relevant driver. PWC presented a high probability for a temperature range between 20.5 and 21°C and for depths below 25 m (Fig. 3). The modelled habitat for PWC follows the contour of the slope for the GCB, which could not be observed in the PNC model.
Response curves of the environmental layers for both pod compositions (PWC or PNC), showing predicted probability of presence altercations as the targeted environmental variable is varied, while all other environmental variables are kept at their mean sample value.
The model for PNC performed with a mean AUC of 0.740. It predicted main core habitat south of the seaway, 5 km from shore between 30- and 50-m depth (Fig. 2). A smaller area of suitable habitat (AUC of <0.7) was predicted 5 km from shore north of the seaway.
Distance and SST were the most important environmental variables, contributing 70.6 and 23.9% respectively. Bathymetry contributed 5% and rugosity did not contribute to the model. Distance contained the most useful information according to the jack-knife test and bathymetry contained the most useful information by itself. PNC showed, like PWC, a high probability for a preferred thermal range between 20.5 and 21°C. However, the highest suitability for depth was predicted between 25 and 50 m (Fig. 3).
The core areas with highest habitat suitability overlapped for both pod compositions by ~25%, being situated south of the seaway in the centre of the bay. However, the core area for PWC (total 56 km2) is situated closer to shore, exhibiting a band of high suitability 1.5 km from shore stretching south and north from the seaway. Highest suitability for PNC (total core area of 76 km2) was predicted further away from shore but not showing a distinguished area of high probability towards the north of the bay.
Vessel traffic
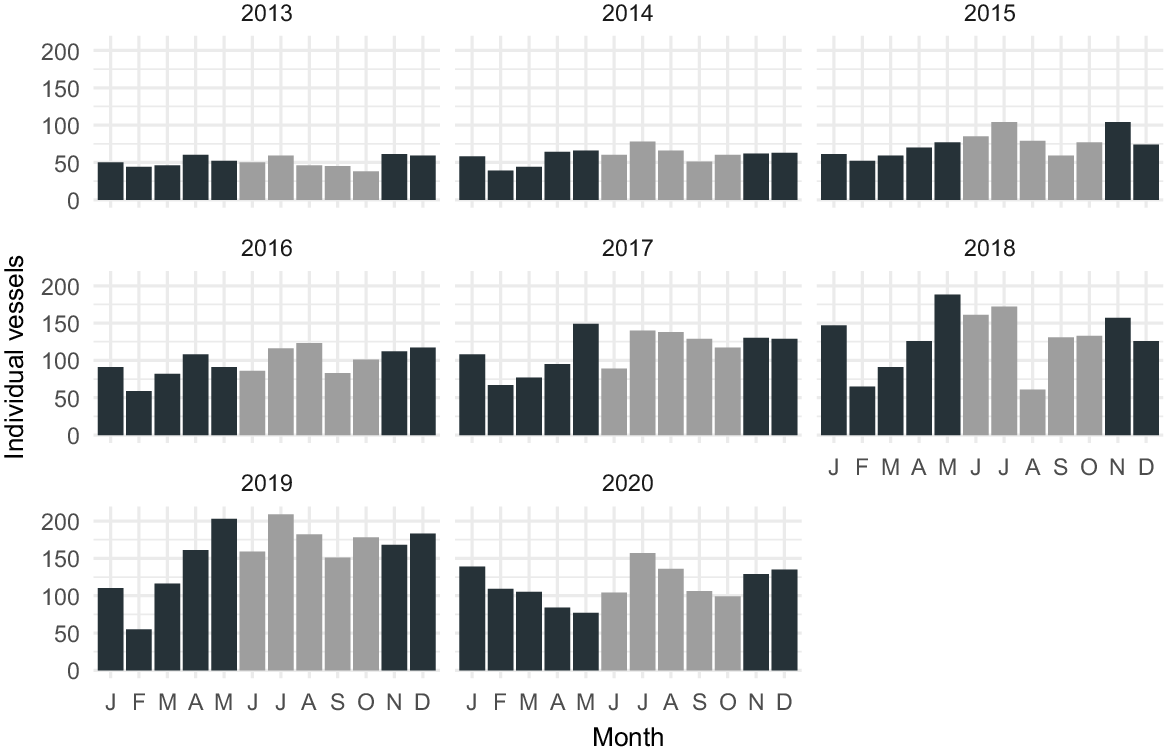
Vessel traffic in the GCB has continuously increased during the study period. Although 51 AIS-fitted vessels, on average, were recorded monthly in 2013, the number of vessels doubled in 2020, with the highest numbers recorded in July, January and August (Table 1).
In 2013, 610 vessels were recorded in total and 238 vessels during the whale season. At the end of the study period in 2020, the number of vessels had more than doubled to a total of 1380 vessels and 602 individual vessels during the season. Owing to the COVID-19 pandemic, vessel traffic was restricted from May 2020 onward, including whale-watch operations; therefore, the numbers of 2020 are not representative of the overall trend. The highest number of vessels, on average, were recorded in 2019, with 156 vessels being registered monthly, a triple of the monthly average recorded in 2013. In all years, the mean of individual vessels crossing the bay during the season was higher than the yearly mean, except in 2013 (Table 1).
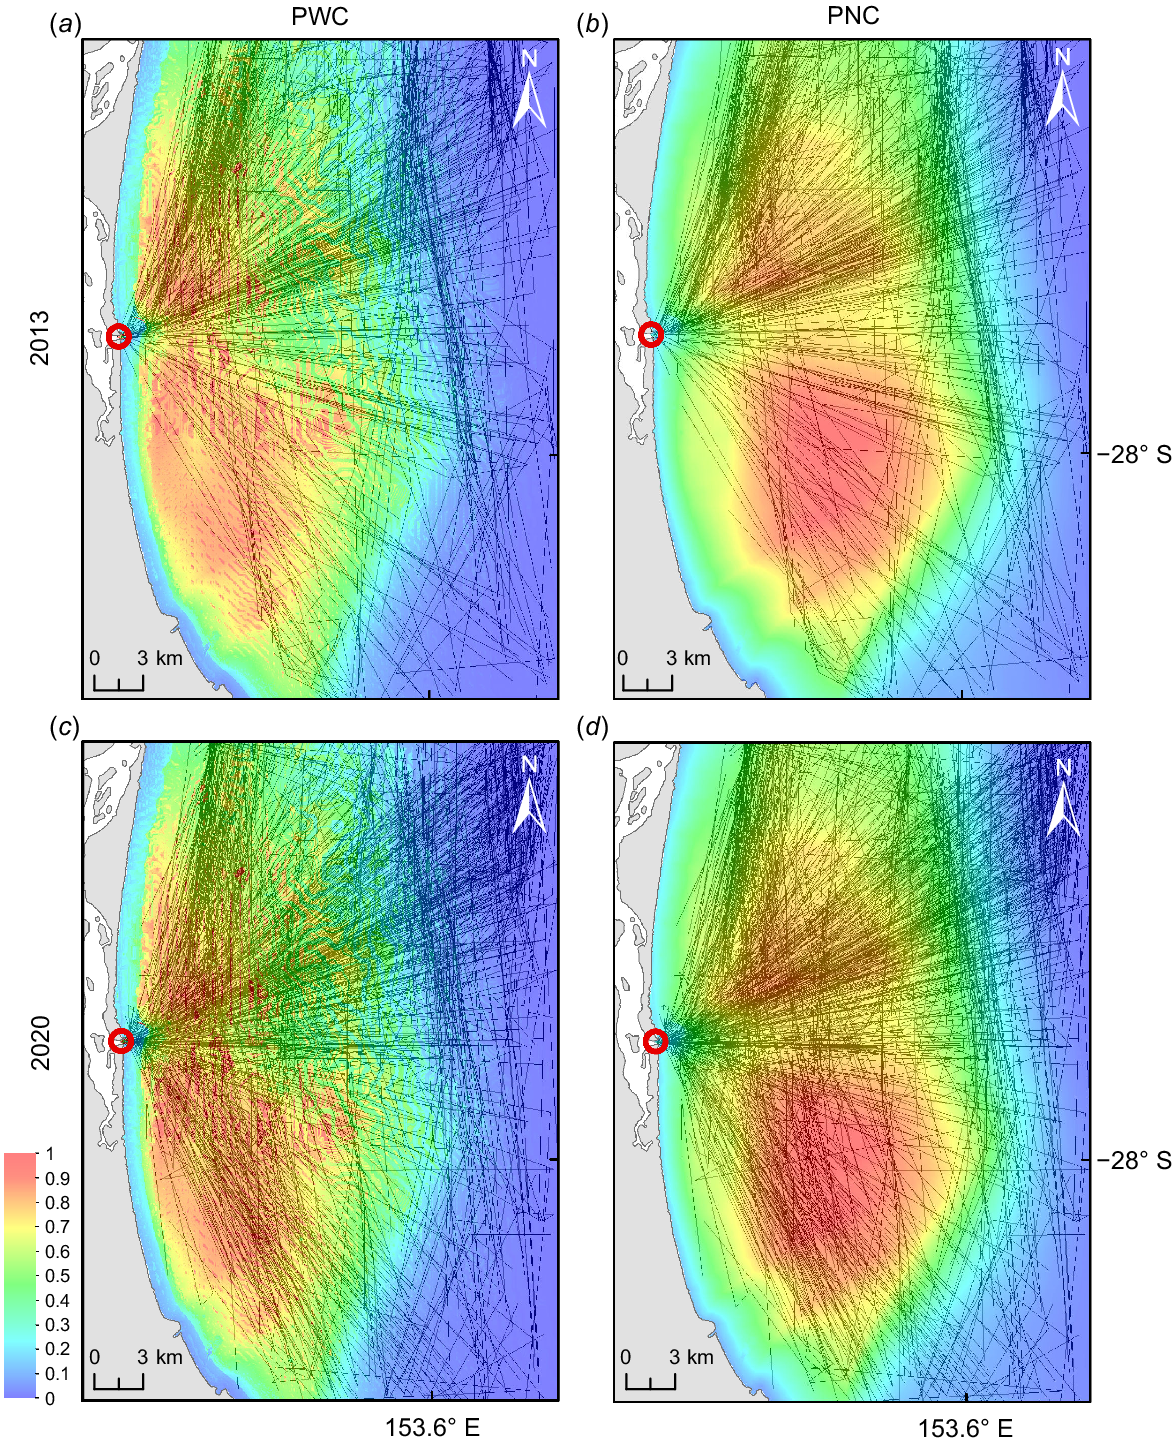
Vessel traffic in 2013 mainly crossed the northern half of the study area, traversing through the core habitat of PWC (Fig. 4, Supplementary Fig. S1). In 2013, 56.54% of AIS-fitted vessels crossed the Moreton Bay Marine Park section during the whale season. In 2019 and 2020, 35.55 and 45.84% of vessels crossed the marine park respectively. Vessel traffic increased in the south of the bay over the study period and was more dominant in 2020 than in 2013 and core suitable habitat for both pod compositions was highly intercepted (Fig. 4). In 2013, vessel traffic intercepted 41.53 and 37.50% of core habitat for PWC and PNC respectively (Table 2, Fig. 5).
Overlay of habitat suitability and cumulative shipping lines for June–October in 2013 for (a) PWC and (b) PNC, and in 2020 for (c) PWC and (d) PNC. Lines show AIS shipping lines. The bar indicates potential habitat suitability from no probability (0) to high probability (1). The red circles mark the seaway.
| Year | PWC | PNC | |
|---|---|---|---|
| ICH (%) | ICH (%) | ||
| 2013 | 41.53 | 37.50 | |
| 2014 | 40.43 | 31.25 | |
| 2015 | 48.72 | 43.75 | |
| 2016 | 55.18 | 37.50 | |
| 2017 | 61.73 | 75.00 | |
| 2018 | 62.19 | 56.25 | |
| 2019 | 78.75 | 81.25 | |
| 2020 | 43.38 | 56.25 |
Count of individual vessels carrying an AIS in the study area from 2013 to 2020 during the study period.
Intercepted habitat for both pod compositions increased by almost 40% over the study period, peaking in 2019, with 78.75 and 81.25% of core habitat being crossed by vessels for PWC and PNC respectively (Table 2). A comparison with 2020 is not suitable owing to data collection being affected by COVID-19 restrictions and effort varied greatly for 2020 compared with other years.
Discussion
Habitat use of humpback whale pods in the Gold Coast Bay (GCB) was assessed for different pod compositions (PNC and PWC). Our MaxEnt-generated models underlined that suitable habitat for PWC is closer to shore than that for PNC, which is in line with previous studies (Valani et al. 2020). Their core areas overlapped in the south of the seaway in the centre of the bay. For PWC, core habitat was predicted 1.5 km from shore east of the seaway, with a depth range between 10 and 50 m. Core habitat for PNC was predicted to be in the centre of the study area 5 km from the seaway within depths from 30 to 50 m. Most suitable temperature was between 20.5 and 21°C for both PWC and PNC.
Our findings of preferred habitat for the different cohorts align with those of other studies. In New Caledonia, depth, SST and distance to land or reef were the most significant factors in modelling habitat preference (Derville et al. 2018). Humpback whales favoured shallow waters up to 100 m deep and water temperatures between 22 and 23°C, which is comparable to the models for the GCB. Although the predicted suitable habitat matched the findings in the GCB, Derville et al. (2018) employed different model settings and methods for handling background data and the environmental settings are in tropical islands with no continental shelf. The preferred ranges of water depth (30–58 m) and SST (21 and 23°C) within the GCB were consistent with those in the primary breeding ground of the E1 population, namely the Great Barrier Reef (Smith et al. 2012). Smith et al. (2012) developed a MaxEnt model using presence-only sighting data obtained from non-dedicated aerial surveys. Building on this approach, Smith et al. (2020) assessed AIS ship strike risk in the GBR and found that females with dependent calves were at a higher risk than were groups without calves, primarily owing to their increased overlap with shipping during their inshore movement and coastal dependence later in the breeding season. Similar conditions, on a smaller scale, exist in the GCB, with highest-suitability habitat being predicted closer to shore and close to a port access (seaway).
Félix and Botero-Acosta (2011) evaluated environmental variables related to humpback whale locations in Ecuador from Breeding stock G with a principal-component analysis (PCA). They found PWC up to 9 km from shore, which is further than in the GCB, likely owing to shallower waters in Ecuador. In contrast, the humpback whales in Ecuador stayed in waters shallower than 50 m, which is in line with the model for the GCB. However, they segregated PWC into mother–calf pair, pair with one escort and pair with more than one escort and found that deeper waters were inhabited when an escort was around. This was the case in Hawai’i as well, between escorted and non-escorted pairs (Craig et al. 2014). Different pod constellations might use different habitats in the GCB as well.
PWC have been sighted resting and socialising in various other locations along the eastern coast of Australia, for example, in Hervey Bay (Franklin et al. 2011; McCulloch et al. 2021), Sunshine Coast (Noad and Cato 2007; Kavanagh et al. 2017), Jervis Bay (Bruce et al. 2014), Moreton Bay (Mayaud et al. 2022) as well as Bell Cay, the Swain Reefs complex and the Palm Island Group (Department of Climate Change, Energy, the Environment and Water 2014). Newborn calves have also been observed in the GCB (Torre-Williams et al. 2019). These observations add to the understanding, that the migration of the E1 population is complex and includes various behavioural stages, including supplementary feeding (e.g. Gales et al. 2009; Owen et al. 2015; Pirotta et al. 2021). Conservation measures therefore must be including the importance of aggregation sites such as the GCB and consider economic and practical factors. Such measures can include reduction in vessel speed in areas of importance to mother–calf pairs, extension of exclusion zone to 300 m and regulation enforcements focusing on such areas.
Vessel traffic
Vessel traffic showed a continuous increase until 2019 but numbers dropped slightly in 2020. This was due to the COVID-19 pandemic and the imposed restrictions (Millefiori et al. 2021). Therefore, a comparison between 2013 and 2019 represented the overall increase in vessel traffic more adequately. From 2013 to 2019, average number of vessels tripled, with the highest monthly tracked vessels assessed between June and October in several years. It is uncertain whether this signifies heightened vessel traffic or an increase in vessels equipped with AIS; therefore, only relative vessel traffic can be inferred. More AIS-carrying vessels crossed the bay in 2020 than in 2013. This resulted in higher numbers of vessel crossings of suitable whale habitat. Over the study period, the proportion of intercepted core habitat by vessels increased by almost 40% for both cohorts, with vessels crossing more than 70 and 80% of core habitat of PWC and PNC respectively, in 2019.
General rules regarding marine mammal safety are already in place (Department of Environment and Energy 2017b) but there is limited enforcement and no consideration of core habitat impact. Anecdotal reports from members of the public as well as documentation in social media suggest that regular breaches of regulations occur, with calves being closely approached (J.-O. Meynecke, pers. comm.). These close approaches can reduce communication space of humpback whales by vessel noise (Cholewiak et al. 2018; Dunlop 2019) and especially calves are dependent on constant communication with their mother (Bejder et al. 2019; Indeck et al. 2022). Mother and calves have developed calls at much lower rates and acoustic levels to stay undetected of unwanted males (Indeck et al. 2021). A separation due to the masking of this communication by vessel noise may be possible and could endanger the survival of the calf. Furthermore, humpback whales have been observed showing an increase in mean speed and respiration rate as well as a decrease in resting and diving times when vessels are present (Morete et al. 2007; Currie et al. 2021). These behavioural changes can be energetically demanding and therefore a disadvantage for a mother who must preserve its energy to nurture and care for its calf (Cartwright and Sullivan 2009; Currie et al. 2021).
In the breeding grounds of West Maui, Hawai’i, mother–calf pairs showed a diurnal increase in depth over the day, possibly linked to increased vessel traffic in shallow waters (Pack et al. 2022). This tactic of moving into deeper waters might reduce exposure to these vessels, with the cost of compromising developmentally important preferences for shallow waters. Additionally, whale-watching vessels were following the whales into deeper waters, further disturbing this crucial bonding and development phase (Pack et al. 2022). In the GCB, high recreational vessel traffic might inflict the same pattern onto mother–calf pairs. However, the majority of recreational vessels are not accounted for in our study and might pose a greater threat to PWC than do AIS-fitted vessels.
Collision risk with larger vessels (50–200 m) also poses a threat to humpback whales because they surface even in their presence (Smith et al. 2020; Mayaud et al. 2022; Helm et al. 2023). Using a ship-based observer stationed on the bow, surfacing behaviour of humpback whales around cruise ships in transiting Glacier Bay National Park, Alaska, was observed (Helm et al. 2023). The probability of whales remaining near the surface following detection was at 87%. Their finding suggest that even after being detected, whales continue to face collision risks and such risk may be reduced through change in vessel speed or direction (Helm et al. 2023).
The implementation of speed limitations within core habitat of cohorts as well as the constant education and promotion of voluntary speed reductions could reduce the risk of disturbance for humpback whales in the GCB and other regions of similar habitat use. For example, along the eastern coast of the USA, all vessels of 19.8 m or longer must travel at 10 knots (~18.5 km h−1) or less in certain locations at certain times of the year, so as to reduce the threat of vessel collisions with endangered North Atlantic right whales (National Marine Fisheries Service 2023). Furthermore, the the National Oceanic and Atmospheric Administration recommended vessel routes in four locations to reduce the likelihood of ship collision in key habitat (National Marine Fisheries Service 2023). A voluntary vessel-speed reduction program in California established seasonal slow-speed zones that coincide with the prime feeding and migration season of blue whales (Protecting Blue Whales and Blue Skies 2022). It encourages vessels to transit these zones at speeds of 10 knots (~18.5 km h−1) and since its establishment in 2014, an estimated 44% decrease in risk of whale strikes during the prime migration season in the affected coastal areas was recorded.
Study limitations
The utilisation of MaxEnt models in this study was based on the analysis of presence-only data, which primarily originated from whale sightings recorded by whale-watching vessels in close proximity to the port. Whale-watch operators often choose the most active pods in proximity to the port to optimise the customer experience. There was a concentration of sightings in the central region of the GCB, which may not fully represent the entire area used by different cohorts of humpback whales in the region. Furthermore, the whale-watching boats were prohibited from entering the Marine Park located north of the seaway, resulting in a lack of sighting data from that area.
Furthermore, MaxEnt models have a tendency to overfit in areas with high sighting numbers (Phillips et al. 2006). Presence-only data generally do not reflect true abundance of a species. Therefore, the prediction of core habitat for both groups of humpback whales, primarily based on the areas where the highest number of whales were sighted, may be influenced by the biased distribution of present points and the overfitting nature of MaxEnt-derived models.
The MaxEnt models need to be interpreted with good background knowledge of the region and whale behaviour. Future studies should strive to incorporate abundance data and employ systematic sampling techniques that capture a more representative distribution of humpback whale sightings throughout the entire GCB to compare with MaxEnt output models, so as to obtain a more accurate understanding of their habitat use. However, suitable habitat for PWC was predicted north of the seaway in the Moreton National Park, an area with no sighting data records from whale-watching boats. This can be an indication of the model predicting habitat preferences for humpback whales accurately.
Because the raster output of MaxEnt was transformed to polygons to calculate percentages of intercepted habitat, spatial information might have been lost. Accordingly, the results might not be a precise representation of core habitat proportions being intercepted. However, they are a close approximation and show the overlap of AIS-fitted vessel movement with core whale habitat in the GCB. It is important to note that the assessment of vessel traffic in relation to humpback whale core habitat was limited and did not encompass the full spectrum of vessel activities. A study in Moreton Bay, Queensland, Australia, showed that over 90% of recreational vessels did not carry an AIS (Mayaud et al. 2024). Therefore, it is likely that the actual interception between the identified core habitat and vessel traffic is significantly higher, considering the known presence of other vessel types in the region. These vessels can contribute substantially to the overall vessel traffic in the area, posing additional threats to humpback whales and their habitat.
In this study, no ship strike risk assessment was conducted; therefore, in-depth models incorporating factors such as vessel speed, vessel draft and whale behaviour to calculate the absolute number of whales that can be struck by vessels could be considered for the GCB in future studies. An assessment of recreational vessels, for example, which size classes of vessels are leaving the seaway, including all vessel types, might be an appropriate way to determine the number of recreational vessels in use in the GCB and the long- and short-term threats these vessels pose to humpback whales.
Conclusions
Our model outputs on different humpback whale cohort core habitats provide a basis for future modelling work of humpback whales in the GCB. Our study has highlighted the importance of determining vessel impact on humpback whale-vulnerable cohorts and emphasises the need for improved conservation efforts. The short-term effects of vessel traffic can have long-term consequences, compromising the well-being and ecological dynamics of this population. To address this, future studies should focus on gathering robust and comprehensive data, preferably through systematic surveys, to improve the accuracy and reliability of predictive models such as maximum entropy models, or provide systematic survey data for validation of citizen science data. Moreover, assessing vessel traffic impact of all vessel types in the GCB would allow for a better understanding of anthropogenic effects on the population. In the GCB, enforcing already established regulations and the implementation of go-slow zones in core habitat of PWC could minimise vessel impacts and protect humpback whales in their critical habitats. Additionally, long-term monitoring efforts are crucial to assess the cumulative effects of vessel disturbances and understand their broader ecological implications. By considering the long-term sustainability of these interactions, proactive conservation measures can be implemented.
Data availability
The data that support this study will be shared upon reasonable request to the corresponding author.
Declaration of funding
This work was supported by a grant to Griffith University from a private charitable trust as part of the Whales and Climate Research Program.
Acknowledgements
The authors thank Michael Tedengren, Ditte Marie Christiansen and Johan Hagelin for support and discussions. We also thank the dedicated volunteers of Humpbacks & High-rises as well as all participating whale-watch companies.
References
Acevedo J, Aguayo-Lobo A, Allen J, Botero-Acosta N, Capella J, Castro C, Rosa LD, Denkinger J, Félix F, Flórez-González L, Garita F, Guzmán HM, Haase B, Kaufman G, Llano M, Olavarría C, Pacheco AS, Plana J, Rasmussen K, et al. (2017) Migratory preferences of humpback whales between feeding and breeding grounds in the eastern South Pacific. Marine Mammal Science 33(4), 1035-1052.
| Crossref | Google Scholar |
Aiello-Lammens ME, Boria RA, Radosavljevic A, Vilela B, Anderson RP (2015) spThin: an R package for spatial thinning of species occurrence records for use in ecological niche models. Ecography 38(5), 541-545.
| Crossref | Google Scholar |
Anderson RP, Gonzalez I, Jr. (2011) Species-specific tuning increases robustness to sampling bias in models of species distributions: an implementation with MaxEnt. Ecological Modelling 222(15), 2796-2811.
| Crossref | Google Scholar |
Andrews-Goff V, Bestley S, Gales NJ, Laverick SM, Paton D, Polanowski AM, Schmitt NT, Double MC (2018) Humpback whale migrations to Antarctic summer foraging grounds through the southwest Pacific Ocean. Scientific Reports 8(1), 12333.
| Crossref | Google Scholar |
Baker CS, Herman LM (1989) Behavioral responses of summering humpback whales to vessel traffic: experimental and opportunistic observations. Technical Report NPS-NR-TRS-89-01, final report to the National Park Service, Alaska Regional Office. United States Department of the Interior, National Parks Service, Anchorage, AK, USA.
Beaman RJ (2017) AusBathyTopo (Great Barrier Reef) 30 m 2017 – a regional-scale depth model (20170025C). (Geoscience Australia: Canberra, ACT, Australia) [Dataset] doi:10.4225/25/5a207b36022d2
Bejder L, Videsen S, Hermannsen L, Simon M, Hanf D, Madsen PT (2019) Low energy expenditure and resting behaviour of humpback whale mother–calf pairs highlights conservation importance of sheltered breeding areas. Scientific Reports 9(1), 771.
| Crossref | Google Scholar |
Bombosch A, Zitterbart D, Van Opzeeland I, Frickenhaus S, Burkhardt E, Wisz M, Boebel O (2014) Predictive habitat modelling of humpback (Megaptera novaengliae) and Antarctic minke (Balanoptera bonaerensis) whales in the Southern Ocean as a planning tool for seismic surveys. Deep-Sea Research – I. Oceanographic Research Papers 91, 101-114.
| Crossref | Google Scholar |
Bruce E, Albright L, Sheehan S, Blewitt M (2014) Distribution patterns of migrating humpback whales (Megaptera novaeangliae) in Jervis Bay, Australia: a spatial analysis using geographical citizen science data. Applied Geography 54, 83-95.
| Crossref | Google Scholar |
Burns D, Brooks L, Harrison P, Franklin T, Franklin W, Paton D, Clapham P (2014) Migratory movements of individual humpback whales photographed off the eastern coast of Australia. Marine Mammal Science 30(2), 562-578.
| Crossref | Google Scholar |
Cartwright R, Sullivan M (2009) Associations with multiple male groups increase the energy expenditure of humpback whale (Megaptera novaeangliae) female and calf pairs on the breeding grounds. Behaviour 146(11), 1573-1600.
| Crossref | Google Scholar |
Chaloupka M, Osmond M (1999) Spatial and seasonal distribution of humpback whales in the Great Barrier Reef Region. In ‘Life in the Slow Lane: Ecology and Conservation of Long-Lived Marine Animals. Proceedings of the Symposium Conservation of Long-Lived Marine Animals, American Fisheries Society Symposium, Vol. 23’, 24 August 1997, Monterey, CA, USA . (Ed. JA Musick) pp. 89–106. (American Fisheries Society: Bethesda, MD, USA) 10.47886/9781888569155.ch7
Cholewiak D, Clark CW, Ponirakis D, Frankel A, Hatch LT, Risch D, Stanistreet JE, Thompson M, Vu E, Van Parijs SM (2018) Communicating amidst the noise: modeling the aggregate influence of ambient and vessel noise on baleen whale communication space in a national marine sanctuary. Endangered Species Research 36(May), 59-75.
| Crossref | Google Scholar |
Chou E, Kershaw F, Maxwell SM, Collins T, Strindberg S, Rosenbaum HC (2020) Distribution of breeding humpback whale habitats and overlap with cumulative anthropogenic impacts in the Eastern Tropical Atlantic. Diversity and Distributions 26(5), 549-564.
| Crossref | Google Scholar |
City of Gold Coast (2014) Gold coast destination tourism management plan. (City of Gold Coast) Available at https://www.goldcoast.qld.gov.au/files/sharedassets/public/pdfs/policies-plans-amp-strategies/destination-tourism-management-plan.pdf [Verified 6 August 2024]
Clark CW, Ellison WT, Southall BL, Hatch L, Van Parijs SM, Frankel A, Ponirakis D (2009) Acoustic masking in marine ecosystems: intuitions, analysis, and implication. Marine Ecology Progress Series 395, 201-222.
| Crossref | Google Scholar |
Corkeron PJ, Brown M, Slade RW, Bryden MM (1994) Humpback whales, Megaptera novaeangliae (Cetaceaa : Balaenopteridae), in Hervey Bay, Queensland. Wildlife Research 21(3), 293-305.
| Crossref | Google Scholar |
Craig AS, Herman LM, Pack AA, Waterman JO (2014) Habitat segregation by female humpback whales in Hawaiian waters: avoidance of males? Behaviour 151(5), 613-631.
| Crossref | Google Scholar |
Currie JJ, Stack SH, Kaufman GD (2017) Modelling whale-vessel encounters: the role of speed in mitigating collisions with humpback whales (Megaptera novaeangliae). Journal of Cetacean Research and Management 17, 57-63.
| Crossref | Google Scholar |
Currie JJ, McCordic JA, Olson GL, Machernis AF, Stack SH (2021) The impact of vessels on humpback whale behavior: the benefit of added whale watching guidelines. Frontiers in Marine Science 8(February), 601433.
| Crossref | Google Scholar |
Department of Climate Change, Energy, the Environment and Water (2014) Megaptera novaeangliae — Humpback Whale. In ‘Species Profile and Threats Database’. (Commonwealth of Australia) Available at https://www.environment.gov.au/cgi-bin/sprat/public/publicspecies.pl?taxon_id=38 [Verified 5 February 2023]
Department of Environment and Energy (2017a) National strategy for reducing vessel strike on cetaceans and other marine megafauna. (Commonwealth of Australia) Available at https://www.dcceew.gov.au/sites/default/files/documents/vessel-strike-strategy.pdf [Verified 5 February 2023]
Department of Environment and Energy (2017b) Australian national guidelines for whale and dolphin watching 2017. (Commonwealth of Australia) Available at https://www.agriculture.gov.au/sites/default/files/documents/aust-national-guidelines-whale-dolphin-watching-2017.pdf [Verified 5 February 2023]
Department of Transport and Main Roads (2016) Recreational ship census June 2016. (State of Queensland) Available at https://www.tmr.qld.gov.au/_/media/tmronline/msqinternet/msqfiles/home/about-us/right-to-information/published-information/lists-and-registers/recreational-vessel-census_june-2016.pdf?sc_lang=en&hash=B945E0EE1164EBCF3A42061BEE02F8AB [Verified 13 November 2022]
Department of Transport and Main Roads (2020) Recreational ship census June 2020. (State of Queensland) Available at https://www.tmr.qld.gov.au/_/media/tmronline/msqinternet/msqfiles/home/publications/marineinformationbulletins/queensland-regulated-ship-census-0620.pdf?sc_lang=en&hash=3A1DBDEDE3B9CC1A37C8AAFCB8E355E5 [Verified 13 November 2022]
Derville S, Torres LG, Iovan C, Garrigue C (2018) Finding the right fit: comparative cetacean distribution models using multiple data sources and statistical approaches. Diversity and Distributions 24(11), 1657-1673.
| Crossref | Google Scholar |
Dulau V, Pinet P, Geyer Y, Fayan J, Mongin P, Cottarel G, Zerbini A, Cerchio S (2017) Continuous movement behavior of humpback whales during the breeding season in the southwest Indian Ocean: on the road again!. Movement Ecology 5(1), 11.
| Crossref | Google Scholar |
Dunlop RA (2019) The effects of vessel noise on the communication network of humpback whales. Royal Society Open Science 6, 190967.
| Crossref | Google Scholar |
Elith J, Phillips SJ, Hastie T, Dudík M, Chee YE, Yates CJ (2011) A statistical explanation of MaxEnt for ecologists. Diversity and Distributions 17(1), 43-57.
| Crossref | Google Scholar |
Elwen SH, Best PB (2004) Environmental factors influencing the distribution of southern right whales (Eubalaena australis) on the south coast of South Africa I: broad scale patterns. Marine Mammal Science 20, 567-582.
| Crossref | Google Scholar |
Faria MA, DeWeerdt J, Pace F, Mayer FX (2013) Short Note: observation of a humpback whale (Megaptera Novaeangliae) birth in the coastal waters of Sainte marie Island, Madagascar. Aquatic Mammals 39(3), 296-305.
| Crossref | Google Scholar |
Félix F, Botero-Acosta N (2011) Distribution and behaviour of humpback whale mother–calf pairs during the breeding season off Ecuador. Marine Ecology Progress Series 426, 277-287.
| Crossref | Google Scholar |
Fourcade Y, Engler JO, Rödder D, Secondi J (2014) Mapping species distributions with MAXENT using a geographically biased sample of presence data: a performance assessment of methods for correcting sampling bias. PLoS ONE 9(5), e97122.
| Crossref | Google Scholar |
Franklin T, Franklin W, Brooks L, Harrison P, Baverstock P, Clapham P (2011) Seasonal changes in pod characteristics of eastern Australian humpback whales (Megaptera novaeangliae), Hervey Bay 1992–2005. Marine Mammal Science 27(3), E134-E152.
| Crossref | Google Scholar |
Gales N, Double MC, Robinson S, Jenner C, King E, Gedamke J, Paton D, Raymond BEN (2009) Satellite tracking of southbound East Australian humpback whales (Megaptera novaengliae): challenging the feast or famine model for migrating whales. In ‘2008 Meeting of the International Whaling Commission – Scientific Committee’, 23–27 June 2008, Santiago, Chile. Paper SC/61/SH17. (International Whaling Commission: Cambridge, UK) Available at https://iwc.int/document_1778
Helm JE, Gende SM, Lukacs PM (2023) Quantifying behavior and collision risk of humpback whales surfacing near large ships: implications for detection and avoidance. Endangered Species Research 51, 115-126.
| Crossref | Google Scholar |
Indeck KL, Noad MJ, Dunlop RA (2021) The conspecific avoidance strategies of adult female–calf humpback whales. Behavioral Ecology 32(5), 845-855.
| Crossref | Google Scholar |
Indeck KL, Noad MJ, Dunlop RA (2022) Humpback whale adult females and calves balance acoustic contact with vocal crypsis during periods of increased separation. Ecology and Evolution 12(2), e8604.
| Crossref | Google Scholar |
Kavanagh AS, Owen K, Williamson MJ, Blomberg SP, Noad MJ, Goldizen AW, Kniest E, Cato DH, Dunlop RA (2017) Evidence for the functions of surface-active behaviors in humpback whales (Megaptera novaeangliae). Marine Mammal Science 33(1), 313-334.
| Crossref | Google Scholar |
Kramer-Schadt S, Niedballa J, Pilgrim JD, Schröder B, Lindenborn J, Reinfelder V, Stillfried M, Heckmann I, Scharf AK, Augeri DM, Cheyne SM, Hearn AJ, Ross J, Macdonald DW, Mathai J, Eaton J, Marshall AJ, Semiadi G, Rustam R, et al. (2013) The importance of correcting for sampling bias in MaxEnt species distribution models. Diversity and Distributions 19(11), 1366-1379.
| Crossref | Google Scholar |
Lindsay RE, Constantine R, Robbins J, Mattila DK, Tagarino A, Dennis TE (2016) Characterising essential breeding habitat for whales informs the development of large-scale Marine Protected Areas in the South Pacific. Marine Ecology Progress Series 548, 263-275.
| Crossref | Google Scholar |
McCulloch S, Meynecke J-O, Franklin T, Franklin W, Chauvenet ALM (2021) Humpback whale (Megaptera novaeangliae) behaviour determines habitat use in two Australian bays. Marine and Freshwater Research 72(9), 1251-1267.
| Crossref | Google Scholar |
Mayaud R, Castrillon J, Wilson C, Peel D, Smith JN, Luche GD, Allen J, Nash SB (2022) Traffic in a nursery: ship strike risk from commercial vessels to migrating humpback whales (Megaptera novaeangliae) in a rapidly developing Australian urban embayment. Marine Policy 146, 105332.
| Crossref | Google Scholar |
Mayaud R, Peel D, Smith JN, Wilson C, Nash SB (2024) The need to consider recreational vessels in risk assessments of vessel strikes to humpback whales (Megaptera novaeangliae). Ocean & Coastal Management 259, 107419.
| Crossref | Google Scholar |
Meynecke JO, Vindenes S, Teixeira D (2013) Monitoring humpback whale (Megaptera novaeangliae) behaviour in a highly urbanised coastline: Gold Coast, Australia. In ‘Global challenges in integrated coastal zone management’. (Eds E Moksness, E Dahl, J Støttrup) pp. 101–113. (Wiley: Chichester, UK) 10.1002/9781118496480.ch8
Meynecke J-O, de Bie J, Barraqueta J-LM, Seyboth E, Dey SP, Lee SB, Samanta S, Vichi M, Findlay K, Roychoudhury A, Mackey B (2021) The role of environmental drivers in humpback whale distribution, movement and behavior: a review. Frontiers in Marine Science 8, 720774.
| Crossref | Google Scholar |
Millefiori LM, Braca P, Zissis D, Spiliopoulos G, Marano S, Willett PK, Carniel S (2021) COVID-19 impact on global maritime mobility. Scientific Reports 11(1), 18039.
| Crossref | Google Scholar |
Morete ME, Bisi TL, Rosso S (2007) Mother and calf humpback whale responses to vessels around the Abrolhos Archipelago, Bahia, Brazil. Journal of Cetacean Research and Management 9(3), 241-248.
| Google Scholar |
Muscarella R, Galante PJ, Soley-Guardia M, Boria RA, Kass JM, Uriarte M, Anderson RP (2014) ENMeval: an R package for conducting spatially independent evaluations and estimating optimal model complexity for MaxEnt ecological niche models. Methods in Ecology and Evolution 5(11), 1198-1205.
| Crossref | Google Scholar |
National Marine Fisheries Service (2023) Reducing vessel strikes to North Atlantic right whales. (National Oceanic and Atmospheric Administratio) Available at https://www.fisheries.noaa.gov/national/endangered-species-conservation/reducing-vessel-strikes-north-atlantic-right-whales [Verified 14 August 2023]
Noad MJ, Cato DH (2007) Swimming speeds of singing and non-singing humpback whales during migration. Marine Mammal Science 23(3), 481-495.
| Crossref | Google Scholar |
Owen K, Warren JD, Noad MJ, Donnelly D, Goldizen AW, Dunlop RA (2015) Effect of prey type on the fine-scale feeding behaviour of migrating east Australian humpback whales. Marine Ecology Progress Series 541, 231-244.
| Crossref | Google Scholar |
Pacheco AS, Llapapasca MA, López-Tejada NL, Silva S, Alcorta B (2021) Modeling breeding habitats of humpback whales Megaptera novaeangliae as a function of group composition. Marine Ecology Progress Series 666, 203-215.
| Crossref | Google Scholar |
Pack AA, Waterman JO, Craig AS (2022) Diurnal increases in depths of humpback whale (Megaptera novaeangliae) mother–calf pods off West Maui, Hawaiʻi: a response to vessels? Marine Mammal Science 38(4), 1340-1356.
| Crossref | Google Scholar |
Phillips SJ, Dudík M (2008) Modeling of species distributions with MaxEnt: new extensions and a comprehensive evaluation. Ecography 31(2), 161-175.
| Crossref | Google Scholar |
Phillips SJ, Anderson RP, Schapire RE (2006) Maximum entropy modeling of species geographic distributions. Ecological Modelling 190, 231-259.
| Crossref | Google Scholar |
Pirotta V, Owen K, Donnelly D, Brasier MJ, Harcourt R (2021) First evidence of bubble-net feeding and the formation of ‘super-groups’ by the east Australian population of humpback whales during their southward migration. Aquatic Conservation: Marine and Freshwater Ecosystems 31(9), 2412-2419.
| Crossref | Google Scholar |
Protecting Blue Whales and Blue Skies (2022) Results. (California Marine Sanctuary Foundation) Available at https://www.bluewhalesblueskies.org/results [Verified 14 August 2023]
Queensland Government Statistician’s Office (2023) Queensland Government population projections, 2023 edition. (State of Queensland, Queensland Treasury) Available at https://www.qgso.qld.gov.au/issues/2671/qld-government-population-projections-2023-edn.pdf
Radosavljevic A, Anderson RP (2014) Making better MaxEnt models of species distributions: complexity, overfitting and evaluation. Journal of Biogeography 41(4), 629-643.
| Crossref | Google Scholar |
Rasmussen K, Palacios DM, Calambokidis J, Saborío MT, Dalla Rosa L, Secchi ER, Steiger GH, Allen JM, Stone GS (2007) Southern Hemisphere humpback whales wintering off Central America: insights from water temperature into the longest mammalian migration. Biology Letters 3(3), 302-305.
| Crossref | Google Scholar | PubMed |
Smith JN, Grantham HS, Gales N, Double MC, Noad MJ, Paton D (2012) Identification of humpback whale breeding and calving habitat in the Great Barrier Reef. Marine Ecology Progress Series 447(Harwood 2001), 259-272.
| Crossref | Google Scholar |
Smith JN, Kelly N, Childerhouse S, Redfern JV, Moore TJ, Peel D (2020) quantifying ship strike risk to breeding whales in a multiple-use marine park: the Great Barrier Reef. Frontiers in Marine Science 7, 67.
| Crossref | Google Scholar |
Smith JN, Kelly N, Renner IW (2021) Validation of presence-only models for conservation planning and the application to whales in a multiple-use marine park. Ecological Applications 31(1), e02214.
| Crossref | Google Scholar |
Stamation KA, Croft DB, Shaughnessy PD, Waples KA, Briggs SV (2010) Behavioral responses of humpback whales (Megaptera novaeangliae) to whale-watching vessels on the southeastern coast of Australia. Marine Mammal Science 26(1), 98-122.
| Crossref | Google Scholar |
Torre-Williams L, Martinez E, Meynecke JO, Reinke J, Stockin KA (2019) Presence of newborn humpback whale (Megaptera novaeangliae) calves in Gold Coast Bay, Australia. Marine and Freshwater Behaviour and Physiology 52(5), 199-216.
| Crossref | Google Scholar |
Tsujii K, Akamatsu T, Okamoto R, Mori K, Mitani Y, Umeda N (2018) Change in singing behavior of humpback whales caused by shipping noise. PLoS ONE 13(10), e0204112.
| Crossref | Google Scholar |
Tyack P, Whitehead H (1983) Male competition in large groups of wintering humpback whales. Behaviour 83(1–2), 132-154.
| Crossref | Google Scholar |
Valani R, Meynecke J-O, Olsen MT (2020) Presence and movement of humpback whale (Megaptera novaeangliae) mother–calf pairs in the Gold Coast, Australia. Marine and Freshwater Behaviour and Physiology 53(5–6), 251-263.
| Crossref | Google Scholar |
Walbridge S, Slocum N, Pobuda M, Wright D (2018) Unified geomorphological analysis workflows with Benthic Terrain Modeler. Geosciences 8(3), 94.
| Crossref | Google Scholar |
Young N, Carter L, Evangelista P (2011) A MaxEnt model v3.3.3e tutorial (ArcGISv10). Available at https://www.coloradoview.org/wp-content/coloradoviewData/trainingData/a-maxent-model-v8.pdf