The life (history), diet and death of the blackspot shark (Carcharhinus sealei) from South-east Asia
N. Clark-Shen A * , A. Chin B , J. Domingos A and N. Hutchinson
  A
A
A
B
Abstract
The blackspot shark (Carcharhinus sealei) is a small-bodied coastal shark often incidentally caught in fisheries across South-east Asia.
This study aimed to document the species’ biology, ecology, fisheries and markets to inform conservation.
In total, 103 blackspot sharks from Indonesia (n = 101) and Singapore (n = 2) were examined to determine biological parameters (growth rate, age at maturity, reproductive traits and diet). An interview with a Singaporean seafood supplier gave insight to population trends, fisheries and markets.
Males attained a maximum age of 9 years, the smallest mature individual measured 709-mm stretched total length (STL), with 50% reaching maturity at 6.15 years. Females attained a maximum age of 11 years, the smallest mature individual measured 730 mm STL, with 50% reaching maturity at 6.12 years. The species has an overall growth rate (k) of 0.37 year−1. Reproduction was asynchronous, with only two pups produced per litter. Crustaceans dominated the diet of juveniles, whereas bony fishes and cephalopods dominated the diets of adult males and adult females respectively.
Blackspot sharks have a moderately fast growth rate, but a late age-at-maturity and a low fecundity. Diet differed between the sexes as well as adults and juveniles.
The low fecundity and late maturity of blackspot sharks increase their vulnerability to exploitation. Blackspot sharks are now listed on CITES-Appendix II, but mortality may remain high because they are reportedly often caught incidentally.
Keywords: age and growth, bycatch, conservation, ecology, elasmobranch, fishery, Indonesia, life history, reproductive biology.
Introduction
Understanding the conservation needs of a species requires a multi-disciplinary approach (García et al. 2008; Booth et al. 2019; Cheddadi et al. 2020). Biological data (e.g. age–growth relationships, reproduction) provide insight to a species’ intrinsic ability to proliferate and the biological limits to exploitation (García et al. 2008). Ecological studies (e.g. examining diet) also give insight into how animals spatially arrange themself, as well as trophic interactions, which are the foundations of ecosystems (Van der Putten et al. 2004). Finally, exploring human dimensions, such as fisher interaction and local ecological knowledge (LEK) (Booth et al. 2019) can shed light on key animal habitats and behaviour (Berkström et al. 2019), show how, why and where animals experience mortality, and inform management responses (Boonstra et al. 2017; Booth et al. 2019; MacKeracher et al. 2021).
Although life-history traits vary among species (Chen et al. 2007; Chin et al. 2013a; Grant et al. 2018), elasmobranchs, in general, are known to have slow growth rates, late sexual maturity, and low reproductive potential (e.g. small litters, long inter-birth intervals), which makes them less able to withstand fisheries (Cailliet 2015). Consequently, over one-third of elasmobranchs are now threatened with extinction (Dulvy et al. 2021a). Regarding their ecology, elasmobranch diets vary among ontogenetic stages (Saïdi et al. 2009; Ba et al. 2013; O’Shea et al. 2013; Bornatowski et al. 2014), seasons and geographic regions (Saïdi et al. 2009; Ba et al. 2013), and between the sexes (Ba et al. 2013; Costa et al. 2015) and urban and non-urban populations (Rangel et al. 2022). This highlights diverse resource dependencies even within a species. A loss of high-quality prey items can affect survival (Chiaradia et al. 2010), and a loss of predators, such as sharks, can cause trophic cascades and potential mesopredator release (Barría et al. 2015; Sherman et al. 2020). By combining knowledge of a species life history and ecology with LEK and insights to their fisheries and markets, more holistic management and conservation plans for the species, and ecosystems, can be created.
The blackspot shark (Carcharhius sealei) is a small-bodied shark (<1 m) found in inshore habitats across South-east Asia up to depths of 40 m (White 2012). This species was part of a taxonomic revision of the ‘Carcharhinus sealei–dussumieri’ complex, whereby the blackspot shark was re-described and the similar-looking Indonesian whaler shark (C. tjutjot) resurrected (White 2012). The blackspot shark is commonly caught throughout its range (Southeast Asian Fisheries Development Center 2017), and is found in markets and fishing ports in Malaysia (Arai and Azri 2019), Indonesia, Philippines (White 2012), Thailand (Arunrugstichai et al. 2018) and Singapore (Clark-Shen et al. 2021). It is reportedly caught mostly incidentally, but is often retained and sold. However, most fisheries in South-east Asia are multi-species in nature, making the distinction between ‘target’ and ‘incidental/bycatch’ unclear (Salayo et al. 2008; Southeast Asian Fisheries Development Center 2017; Clark-Shen et al. 2021). The Indonesian whaler shark is also observed in fish markets in South-east Asia (White 2007; Ebert et al. 2013), although it appears to be reported less frequently, and it is possible that because of the morphological similarities between the Indonesian whaler shark and the blackspot shark, they have been mistaken for one another during surveys, obscuring the true volumes of their catches. Blackspot sharks are listed as Vulnerable on the IUCN Red List, having undergone a suspected population reduction of 30–49% over the past 24 years (Dulvy et al. 2021b).
Age and growth parameters have not been determined for the blackspot shark, and its diet has not been described since the species’ re-description in 2012 (White 2012). This paper describes the life-history, diet and ecological traits of the species and provides a preliminary account of its fisheries interactions in South-east Asia. Improved understanding of biology and ecology, combined with knowledge of their fisheries and trade, can help provide advice for suitable management responses.
Methods
Sourcing animals and collecting biological data
In total, 103 sharks matching the description of the cryptic look-alike species the blackspot shark (C. sealei) and Indonesian whaler shark (C. tjutjot) (White 2012) were sourced from a private seafood supplier as well as fish markets in Singapore. Specifically, 92 sharks were sourced from a private seafood supplier between November 2020 and December 2021. No sharks were sourced in February, March, May, July and August as the supplier did not have specimens in these months. Six sharks were sourced from Senoko Fishery Port in Singapore in 2019, and five sharks were sourced from Senoko Fishery Port in 2021. Animal ethics approval was not necessary because animals were not killed for this research but were sourced following mortality from commercial fishing gear. The import or catch location and fishing gear used were obtained where possible, and specimens were photographed, weighed, and stretched total length (STL, measured with dorsal portion of tail bent straight or stretched so upper lobe lies along body midline), fork length (FL) and pre-caudal length (PL), as described in Francis (2006), were taken to the nearest millimetre. Specimens were dissected in the laboratory and maturity for males and females was determined through observation of gonads and assigning them into discrete development stages (Table 1) following Walker (2005). The stomach and a section of thoracic vertebrae from underneath the dorsal fin was removed to enable diet and growth analyses. A small (<5-mm) fin clip was taken from the anal fin and stored in 70% ethanol before being transferred to 90% ethanol after 7 days. The cetyltrimethylammonium bromide (CTAB) DNA extraction protocol as described in Ward et al. (2005), was performed to help confirm the identity of the cryptic species (the blackspot shark or Indonesian whaler shark). DNA barcoding of the COI gene was performed using universal primers Fish F1 and R1 (Ward et al. 2005). Results were Sanger sequenced, trimmed in Genious Prime and blasted against the GenBank COI database. Matches to accession numbers with a grade of over 97% were accepted. In instances where DNA could not yield a result, morphological descriptions from White (2012) were used to discern the species, and age–growth analysis (detailed in next section) was conducted with and without these particular animals to ensure that their inclusion did not significantly affect results.
| Organ | Index | Description | Binary maturity condition | |
|---|---|---|---|---|
| Female uterus | U = 1 | Uteri uniformly thin and white tubular structure. Small ovaries and with no yolked ova | Immature | |
| U = 2 | Uterus thin, tubular structure that is partly enlarged posteriorly. Small yolked ova developing in ovary | Immature | ||
| U = 3 | Uterus uniformly enlarged tubular structure. Yolked ova developing in ovary | Mature | ||
| U = 4 | Uterus enlarged with in utero eggs or embryos microscopically visible, pregnant | Mature | ||
| U = 5 | Uterus enlarged, flaccid and distended tubular structure, postpartum | Mature | ||
| Male clasper | C = 1 | Pliable with no calcification | Immature | |
| C = 2 | Partly calcified | Immature | ||
| C = 3 | Rigid and fully calcified | Mature |
Adapted from Walker (2005).
Diet analysis
Stomachs were excised and contents were separated by taxon and, if necessary, washed by submerging them in a beaker of tap water. Smaller items were examined under a dissecting microscope. Prey was identified to one of four taxonomic categories (species, genus, family or order). The numbers of whole animals and fragments were recorded for each taxonomic group. Digested tissue and fragments that could not be identified to a particular prey type were considered unidentifiable. Various subsamples were taken from 11 unidentifiable different prey items for DNA analysis by using the CTAB DNA extraction protocol (Ward et al. 2005).
Percentage frequency of occurrence (%FO), which is the proportion of individual stomachs containing a prey type, were calculated. Contents that were suspected to be bait (e.g. straight-edged, attached to hooks) were excluded from %FO analysis (Jabado et al. 2015). Whereas some studies exclude indigestible parts from such analysis (such as shells, otoliths and cephalopod beaks) (Potier et al. 2007; Bornatowski et al. 2014; Dicken et al. 2017) because they are not considered nutritionally valuable, this study included them, because in many instances they were the only identifiable parts of a prey item (Buckland et al. 2017). The number of individuals from a particular prey group (%N) could be calculated only for a subset of sharks (54.3%) because of the highly digested state of many prey (e.g. large number of fragments) and inability to separate content clumped together by mucus (Buckland et al. 2017); hence, %N was excluded from this study.
The Bray–Curtis coefficient was calculated (20 stress runs) and ADONIS (significance P < 0.05) was performed using the vegan package (ver. 2.6-4, J. Oksanen et al., see https://CRAN.R-project.org/package=vegan) in R (ver. 2022.12.0, R Foundation for Statistical Computing, Vienna, Austria, see https://www.r-project.org/) to assess similarity and differences in maturity, sex, season and breeding state. Non-metric multidimensional scaling analysis (NMDS) was performed with the ‘metaMDS’ function in the vegan package to visualise variation in diet by using %FO. Similarity percentages (SIMPER) were then performed using PRIMER (ver. 6, see https://www.primer-e.com/our-software/; Clarke and Gorley 2006) to confirm where these differences occurred.
Vertebral processing and age and growth analysis
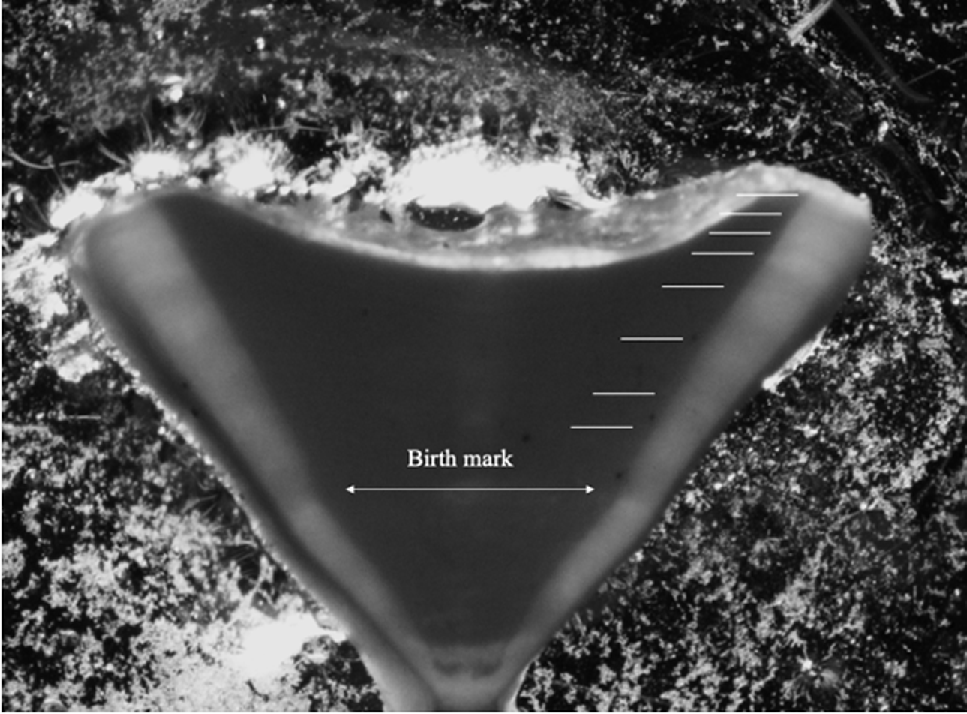
Sections of thoracic vertebrae were removed from individual sharks (n = 103) and processed using methods described by Goldman (2005). All remaining tissue was removed from the vertebrae with a scalpel; the vertebrae were then sectioned and the five largest centra were selected and then soaked in 5% sodium hypochlorite solution for up to 3 min to remove residual tissue. Centra were then rinsed thoroughly with tap water and dried in an oven at 45–60°C. Two random centra per animal were selected and the posterior side of the centra (with the haemal arch opening) were attached to a glass microscope slide with Crystalbond 509 adhesive glue and a heat pad set at 250°C. The centra were sanded down against fine grain (400Cw) waterproof sandpaper set in tap water, until the middle of the centra was reached. The centra were then turned over and re-set in the microscope slide. The opposite side of the centra were sanded down until only the middle section of the centra remained at ~600 μm. These sections were then examined using a dissecting microscope; translucent and opaque bands (band pairs) were counted from the birthmark (Fig. 1), which is identified by a change in the angle of the corpus calcareum (Age 0) (Cailliet 2015). Each centra was photographed through a dissecting microscope (Olympus SZX7 body with a DP22 Olympus camera). To improve clarity of the band pairs, images of centra were digitally uploaded into Microsoft PowerPoint and Picture Editor was used to adjust contrast, colouration, and to apply filters to maximise clarity of band pairs, as was performed in Fisher and Hunter (2018). Two independent readers then assessed the images and estimated ages for each individual by counting band pairs. Discrepancies between the counts of the first and second reader were re-analysed until a consensus was reached. The interpretability of each vertebrae was scored according to the following definitions by McAuley et al. (2007): 0, unreadable; 1, bands visible but difficult to interpret; 2, bands visible but most bands difficult to interpret; 3, bands visible but a minority difficult to interpret; and 4, all bands unambiguous. Average percentage error (APE) was calculated to assess average initial disagreement between readers with the R package FSA (ver. 0.9.5, D. H. Ogle, J. C. Doll, A. P. Wheeler and A. Dinno, see https://fishr-core-team.github.io/FSA). Bayesian growth models are reported to outperform or match frequentist growth models (Smart and Grammer 2021). Bayesian growth models including von Bertalanffy (1938), Gompertz (Ratowsky 1990) and logistic, using Markov-chain Monte Carlo (MCMC) (Smart and Grammer 2021) were used to generate age–growth curves in R with the R package BayesGrowth (ver. 1.0.0, see https://cran.r-project.org/package=BayesGrowth), with best models selected based on leave-one-out-information-criterion (LOOIC) values (Smart and Grammer 2021). Generalised linear models (GLMs) with a binomial error structure and logit-link function were produced to determine the age-at-maturity at 50 and 95% lengths (L50 and L95) in the R package MASS (ver. 7.3–60, see https://CRAN.R-project.org/package=MASS; Venables and Ripley 2002). Age validation using live animals was not conducted.
Hepatosomatic index (HSI)
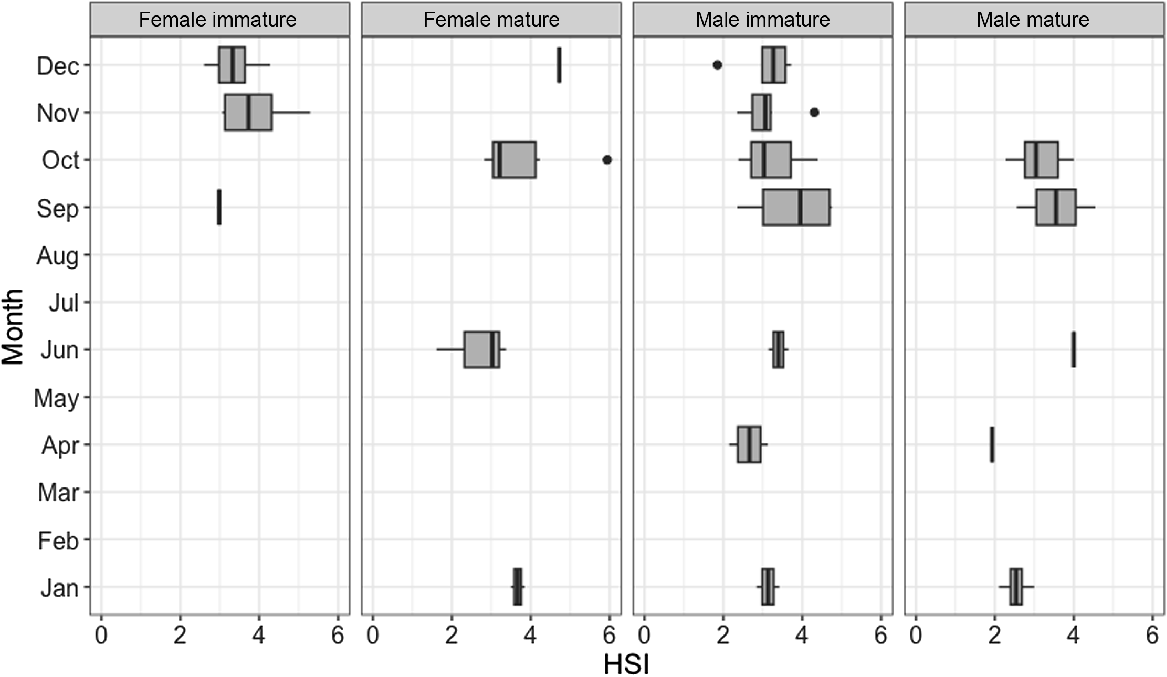
The hepatosomatic index (HSI) is the ratio of liver weight to body weight, and is used as an indicator of energy reserves (Goede and Barton 1990). The HSI is calculated as:
where WL is liver weight and W is bodyweight. A three-way ANOVA was run using R to test for differences in HSI values among sex, season and maturity. Low-energy reserves are typically found after events of high metabolic activity such as migrations or reproduction (Reis and Figueira 2020).
Interview about the fishery
To learn more about the sharks and their fisheries, the private seafood supplier of sharks from Indonesia (n = 92) was interviewed through a semi-structured interview consisting of 22 questions (see the ‘Questionnaire’ section in the Supplementary material). This supplier not only traded sharks and rays but other seafood in general. The interview was conducted in English, following human ethics guidelines, and no remuneration was given. Questions covered (1) the fishery the sharks were sourced from, (2) the species itself and population trends observed, (3) the supply chain, (4) markets and use, and (5) solutions for their management. Some questions provided a range of answers for consideration, including the latter part of the interview (‘solutions for their management’); however, responses did not have to be restricted to options provided and the supplier was encouraged to elaborate where necessary.
Ethics statement
This research was undertaken with informed consent of those being interviewed under human ethics application H8683. Animal ethics approval was not necessary (as confirmed by the Institutional Animal Care and Use Committee (IACUC) at James Cook University, Singapore), because animals were not killed for this research, but were sourced following mortality from commercial fishing gear.
Results
Species composition
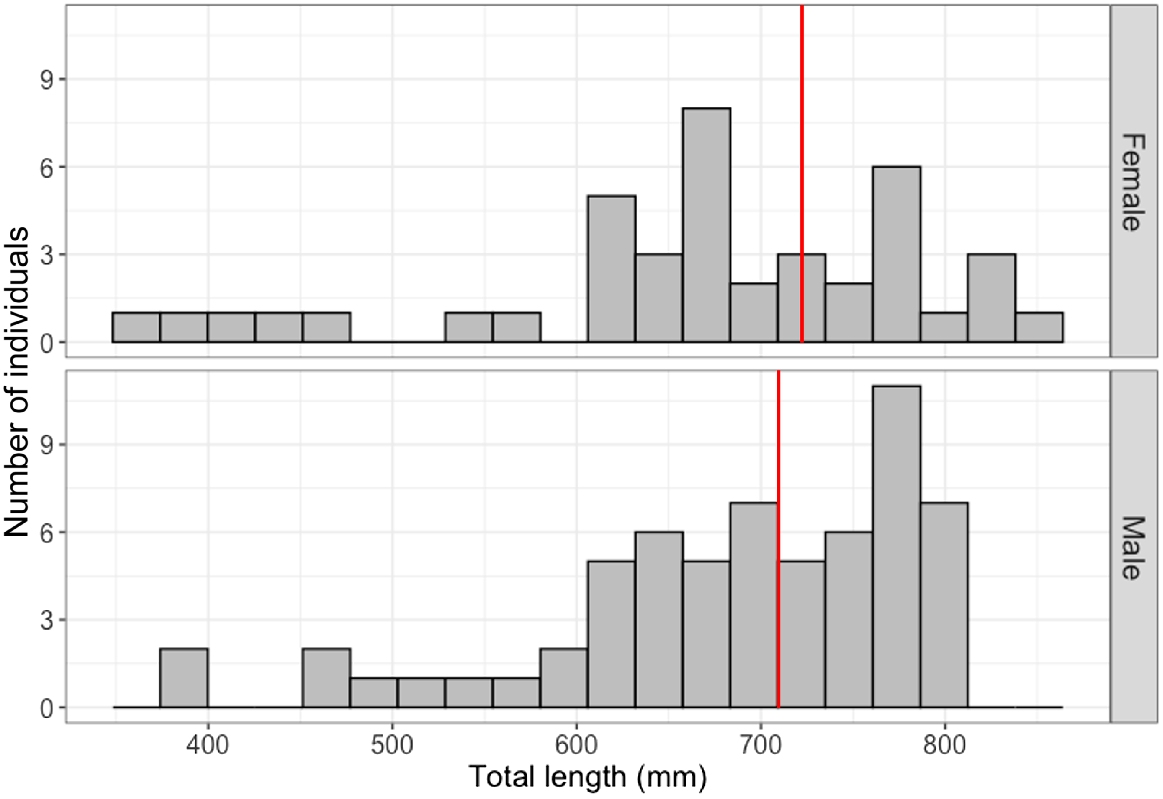
Results from the DNA analysis confirmed 98 sharks as the blackspot shark (C. Sealei), and 5 sharks yielded no result. As these five sharks originated from the same catch location as the others, and more closely resembled morphological descriptions for the blackspot shark than the Indonesian whaler shark as described by White (2012), they were considered blackspot sharks for further analysis. In total, 101 blackspot sharks were caught in Indonesia, but near the Singapore Straits (male = 62, female = 39, immature = 60, mature = 41, gravid = 9), and only 2 were caught in Singapore waters (2 immature females). The size–frequency distribution (Fig. 2) shows that larger animals dominated the sample. The sex ratio of the total sample of sharks (n = 103: male = 62, female = 41) significantly differed from 1:1 (χ2 = 4.282, d.f. = 1, P = 0.0385), and was particularly pronounced in the sharks caught from the handline fishery in Indonesia (n = 92: male = 58, female = 34; χ2 = 6.261, d.f. = 1, P = 0.0123).
Size–frequency distribution of male (n = 62) and female (n = 41) blackspot sharks (Carchahrinus sealei) caught from fisheries in Indonesia (n = 101) and Singapore (n = 2) between 2019 and 2021. The sample was dominated by larger individuals (>600 mm STL), with a minimum size of 359 mm STL (from a female), a maximum size of 849 mm STL (from a female), and mean size of 678 mm STL. The red lines indicate the smallest sizes of maturity observed in the sample (709 mm STL for a male, and 730 mm STL for a female).
Diet
Of the total sample size of blackspot sharks, 8.7% (n = 9) had empty stomachs. This left a total sample size of 94 for further analysis (Table 2). Diet analysis showed that crustaceans, fish and cephalopods were the dominant prey items.
| Prey category | Common name | %FO | |
|---|---|---|---|
| Teleostei (total) | Fish | 53.19 | |
| Herklotsichthys dispilonotus | Blacksaddle herring | 2.13 | |
| Muraenidae spp. | Moray eel | 1.06 | |
| Plotosus spp. | Eeltail catfish | 1.06 | |
| Synodontidae spp. (incl. Saurida undosquamis) | Lizardfish (incl. brushtooth lizardfish) | 2.13 | |
| Unidentified Teleostei spp. (unidentified) | Fish (unidentified) | 46.81 | |
| Crustacea (total) | Crustaceans | 41.49 | |
| Stomatopoda spp. | Mantis shrimp | 3.19 | |
| Decapoda spp. (excluding Matudidae spp.) | Prawn, shrimp, lobster | 12.77 | |
| Matudidae spp. | Matutidae crab | 1.06 | |
| Brachyura spp. | Crab | 1.06 | |
| Isopoda spp. | Isopod | 2.13 | |
| Ostracoda spp. | Ostracod | 1.06 | |
| Crustacea (unidentified) | Crustacean | 20.22 | |
| Cephalopoda (total) | Cephalopods | 41.49 | |
| Decapodiformes spp. | Squid | 12.77 | |
| Octopoda spp. | Octopus | 5.32 | |
| Sepiida spp. | Cuttlefish | 3.19 | |
| Cephalopoda spp. (unidentified) | Cephalopod (unidentified) | 20.21 | |
| Marine worms and worm-like invertebrates (total) | Marine worms | 3.19 | |
| Sipunculidae spp. | Peanut worm | 1.06 | |
| Marine worm (unidentified) | Marine worm (unidentified) | 2.13 | |
| Gastropoda (shelled) | Gastropods | 2.13 | |
| Protista spp. | Algae | 1.06 | |
| Sand and rock | 7.45 | ||
| Unidentified or digested | 29.79 |
Results are summarised by frequency of occurrence (%FO). Stomach mucus and bait are excluded from this analysis, and number (%N) was not determined owing to prey items being too fragmented to determine how many individuals they were derived from. Percentage frequency of occurrance (%FO) by higher taxonomic classifications are in bold followed by more detailed species breakdown.
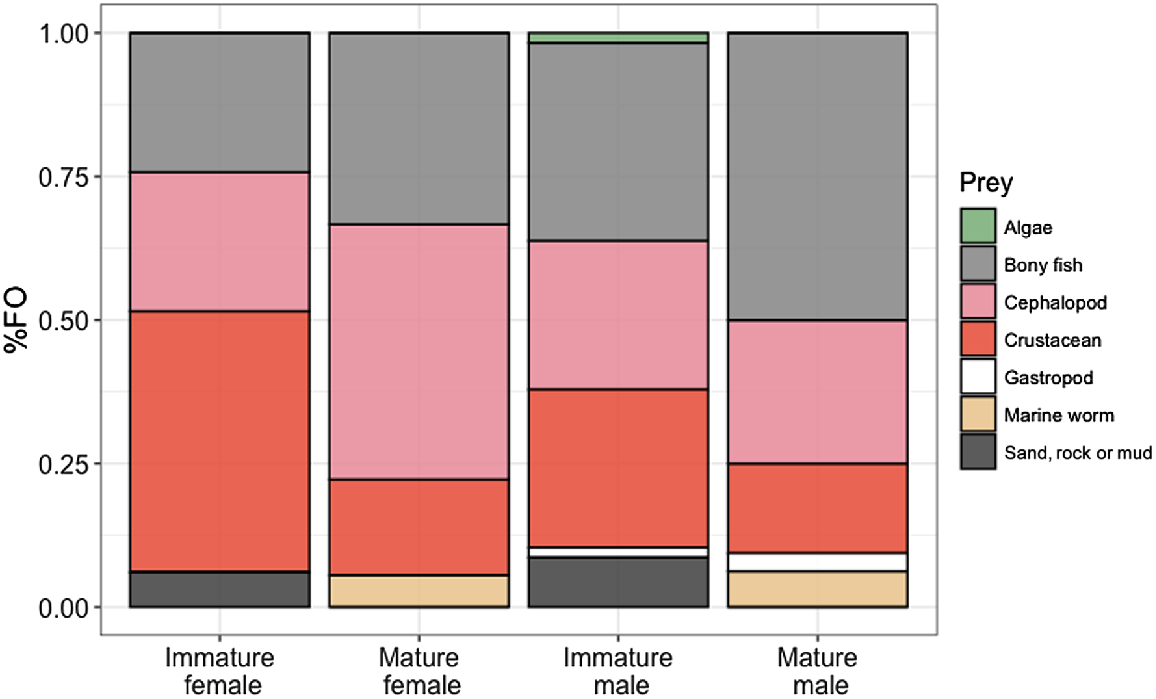
ADONIS and SIMPER analyses of the %FO showed dissimilarities between males and females (P = 0.028, 54.76 average dissimilarity). The main driver of this difference was the higher %FO of bony fishes in males, whereas females had higher %FO of cephalopods (for mature females only) and crustaceans (for immature females only). Another dissimilarity occurred between the age groups (P = 0.014, 54.17 average dissimilarity), with immature sharks of both sexes having a higher %FO of crustaceans (and only immature sharks had sand in their stomachs, reflecting bottom-feeding behaviour), and mature sharks having a higher %FO of cephalopods and bony fishes, with an exception among males, where immature sharks ate more cephalopods than did mature sharks.
Differences were also observed between immature males and immature females (P = 0.025, average dissimilarity 54.91). The main driver is that immature males have a higher %FO of bony fishes, whereas immature females have a higher %FO of crustaceans. Another difference was observed between mature males and mature females (P = 0.025, average dissimilarity 54.38). This is mainly due to mature males having a higher %FO of bony fishes, and mature females having a higher %FO of cephalopods (Fig. 3). No differences were detected between pregnant and non-pregnant specimens.
Age–growth analysis
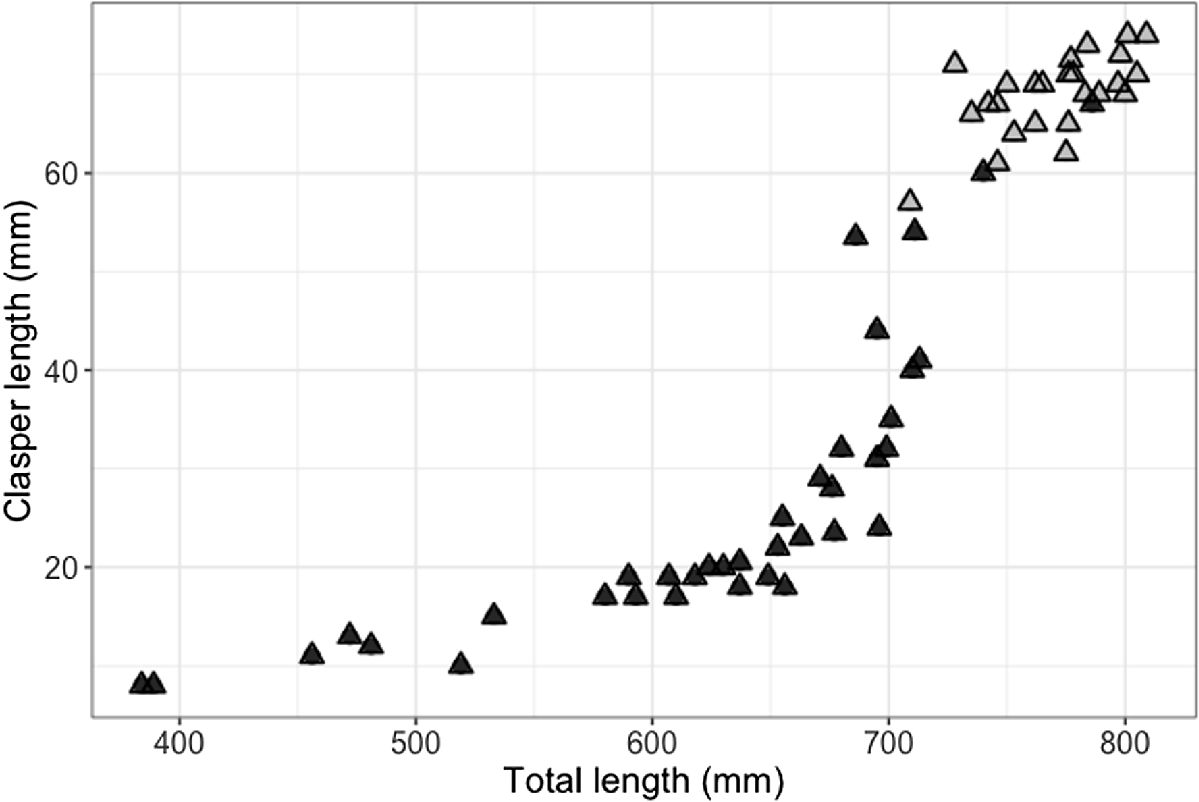
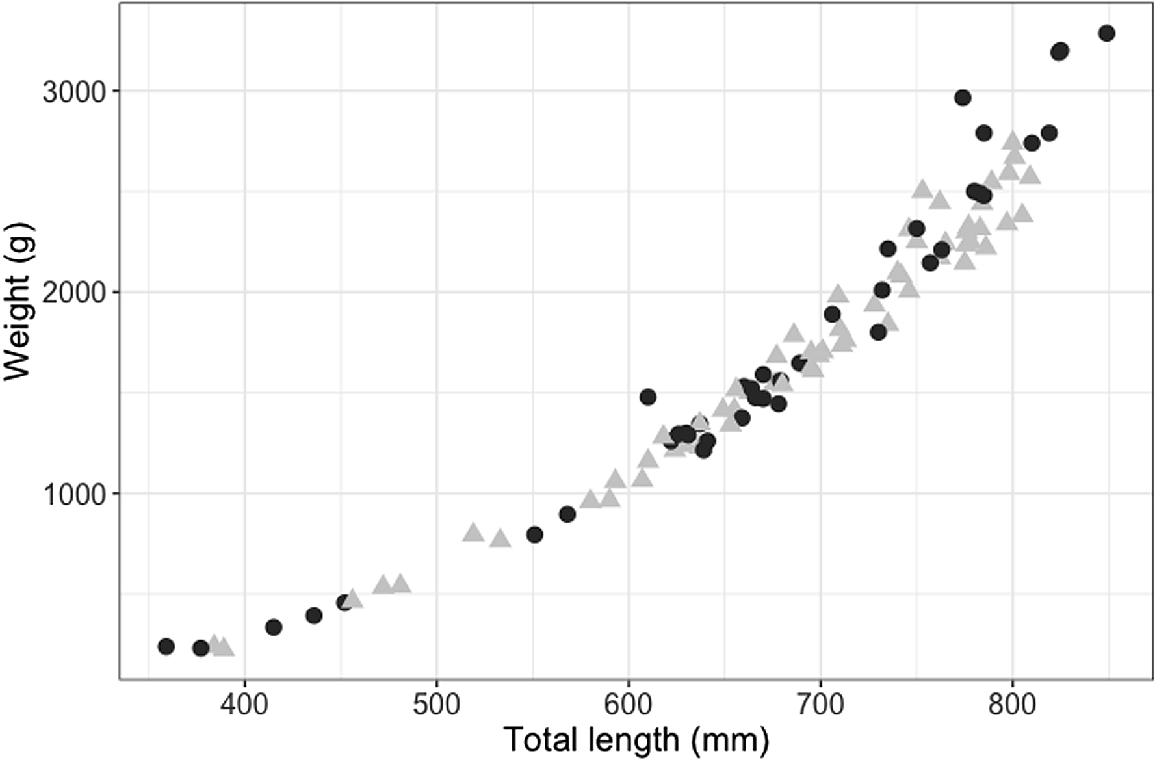
The smallest mature male was 709 mm STL (with 57 mm clasper length; Fig. 4), and the largest immature male was 786 mm STL (with 67-mm partially calcified claspers; Fig. 4). The smallest mature female was 730 mm STL and the largest immature female was 706 mm STL. Males and females showed a similar length–weight relationship, although females in the sample size attained larger sizes and heavier weights (Fig. 5).
Relation between size (stretched total length, STL), clasper length (mm) and maturity (black triangeles, uncalcified claspers; grey triangles, calcified claspers) for male (n = 64) blackspot sharks (Carcharhinus sealei), showing that maturity is attained from 709 mm STL and 57-mm clasper length.
Length–weight relationship for female (black circles, n = 41) and male (grey triangles, n = 62) blackspot sharks (Carcharhinus sealei).
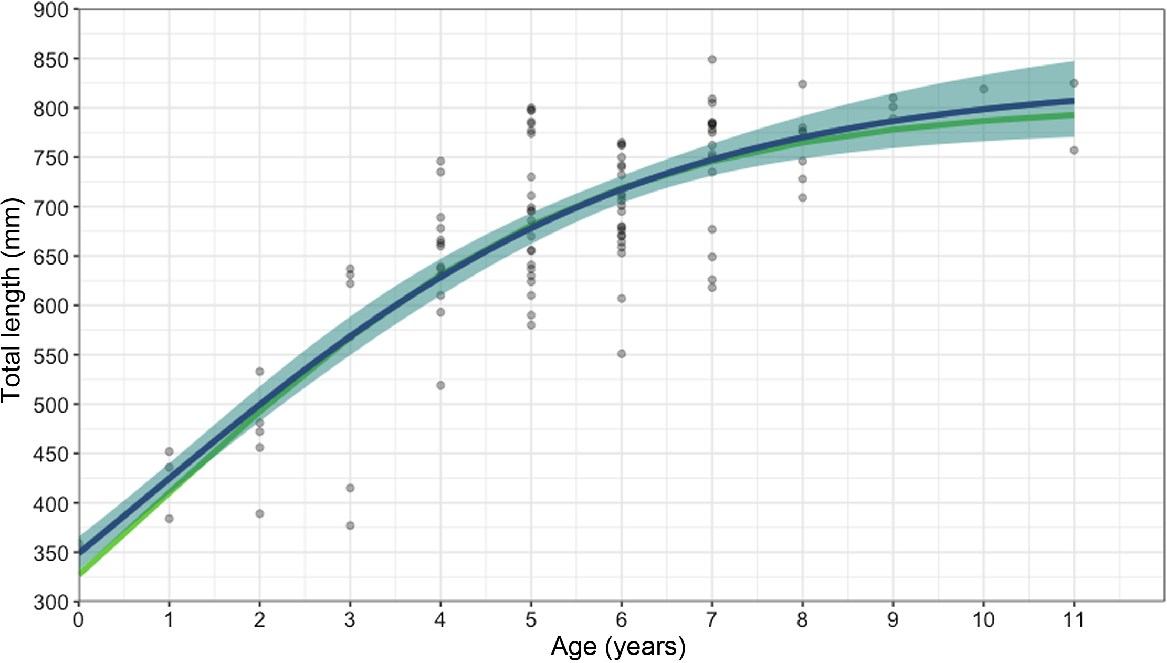
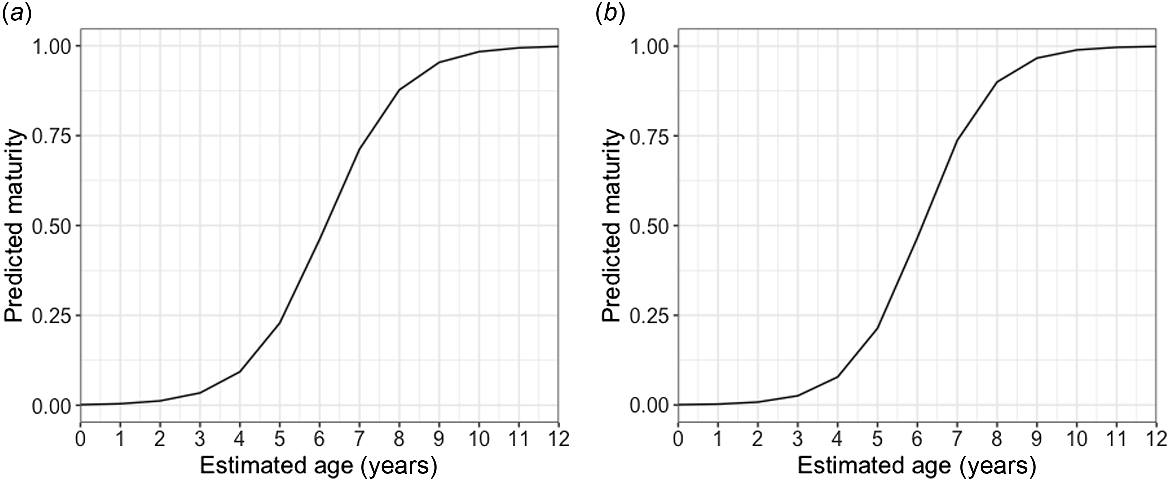
Age bands could be read for all 103 samples; the majority of vertebrae, >75%, scored 2 or 3 of 5 for readability. The average percentage error (APE) was 14.66%, which is higher than the average reported APE in ageing studies (Campana 2001). The oldest agreed age (between the readers) from the study for this species was 11 years old for two females that were 757 and 825 mm STL. The oldest males in the sample were 9 years old at 789 and 801 mm STL (Fig. 6). MCMC analysis (Table 3) showed that of several potential growth models, the logistics model was the best-performing model when analysing males and females together (k-value of 0.37 year−1); the Von Bertalanffy model was best when analysing females alone (k-value of 0.25 year−1); and the Gompertz model was best when analysing males alone (k-value of 0.47 year−1). Male and female blackspot sharks matured at similar ages, with 50% of males reaching maturity at 6.15 years and 95% by 8.92 years old, and 50% of females reaching maturity at 6.12 years and 95% by 8.64 years (Fig. 7).
Age–growth curve for 103 male and female blackspot sharks (Carcharhinus sealei) by using vertebral band counts and the MCMC analysis performed using Bayesian and frequentist models. Circles represent individual blackspot sharks. Lines indicate the modelled length and age values (green, frequentist; blue, Bayesian), with light blue shading indicating the 95% confidence intervals.
| Model | Model estimate | Model performance (AIC) | Model performance (LOOIC) with MCMC | |||||||
|---|---|---|---|---|---|---|---|---|---|---|
| L0 (mm) | L∞ (mm) | K (year−1) | AICc | AIC diff | AICc weight | LOOIC | LOOIC s.e. | LOOIC weight | ||
| Males and females combined | ||||||||||
| Von Bertalanffy | 302.9 (41.63) | 861.6 (49.64) | 0.222 (0.05) | 1156 | 1.41 | 0.21 | 1155 | 16.3 | 0.21 | |
| Logistic | 327.1 (31.48) | 804.5 (27.2) | 0.4175 (0.065) | 1155 | 0 | 0.43 | 1153 | 15.95 | 0.47 | |
| Gompertz | 315.1 (35.51) | 825.1 (34.51) | 0.3206 (0.057) | 1155 | 0.4 | 0.35 | 1154 | 16.1 | 0.33 | |
| Females | ||||||||||
| Von Bertalanffy | 405.4 (38.25) | 879.4 (83.14) | 0.20 (0.075) | 471.4 | 0.16 | 0.32 | 470.1 | 9.49 | 0.43 | |
| Logistic | 411.8 (35.89) | 830.1 (49.61) | 0.36 (0.09) | 471.3 | 0 | 0.34 | 471.2 | 8.99 | 0.25 | |
| Gompertz | 407.9 (37.09) | 848.7 (60.87) | 0.28 (0.08) | 471.3 | 0.1 | 0.34 | 470.7 | 9.15 | 0.32 | |
| Males | ||||||||||
| Von Bertalanffy | 348.9 (44.38) | 789.2 (35.57) | 0.36 (0.09) | 690.1 | 0.33 | 0.3 | 687.7 | 10.18 | 0.31 | |
| Logistic | 367.3 (35.87) | 754.3 (23.4) | 0.58 (0.11) | 689.8 | 0 | 0.35 | 687.5 | 9.90 | 0.34 | |
| Gompertz | 358.1 ( 0.10) | 773.8 (27.84) | 0.47 (0.10) | 689.8 | 0.04 | 0.35 | 687.4 | 10.18 | 0.35 | |
MCMC analysis was used to assess model performance and the best-performing model was selected on the basis of the lowest leave-one-out-information-criterion (LOOIC) score and, where scores were similar, the LOOIC weight. Numbers in parentheses are s.e. for length at birth (L0), asymptotic length (L∞) and the k-value. For the MCMC analysis, priors were set as follows: L0 = 350 mm, s.e. = 9.00; determined by mid-point between largest embryo and smallest specimen in the sample; and L∞ = 950 mm, s.e. = 95; after largest specimen reported by Ebert et al. (2013).
Logistic generalised linear models (GLMs) of estimated ages of (a) male and (b) female blackspot shark (Carcharhinus sealei) showing predictions of maturity at a given age. The model predicts a 50% age-at-maturity of 6.15 years, and a 95% age-at-maturity of 8.92 years for males, and a 50% age-at-maturity of 6.12 years, and a 95% age-at-maturity of 8.64 years for females.
Reproductive analysis
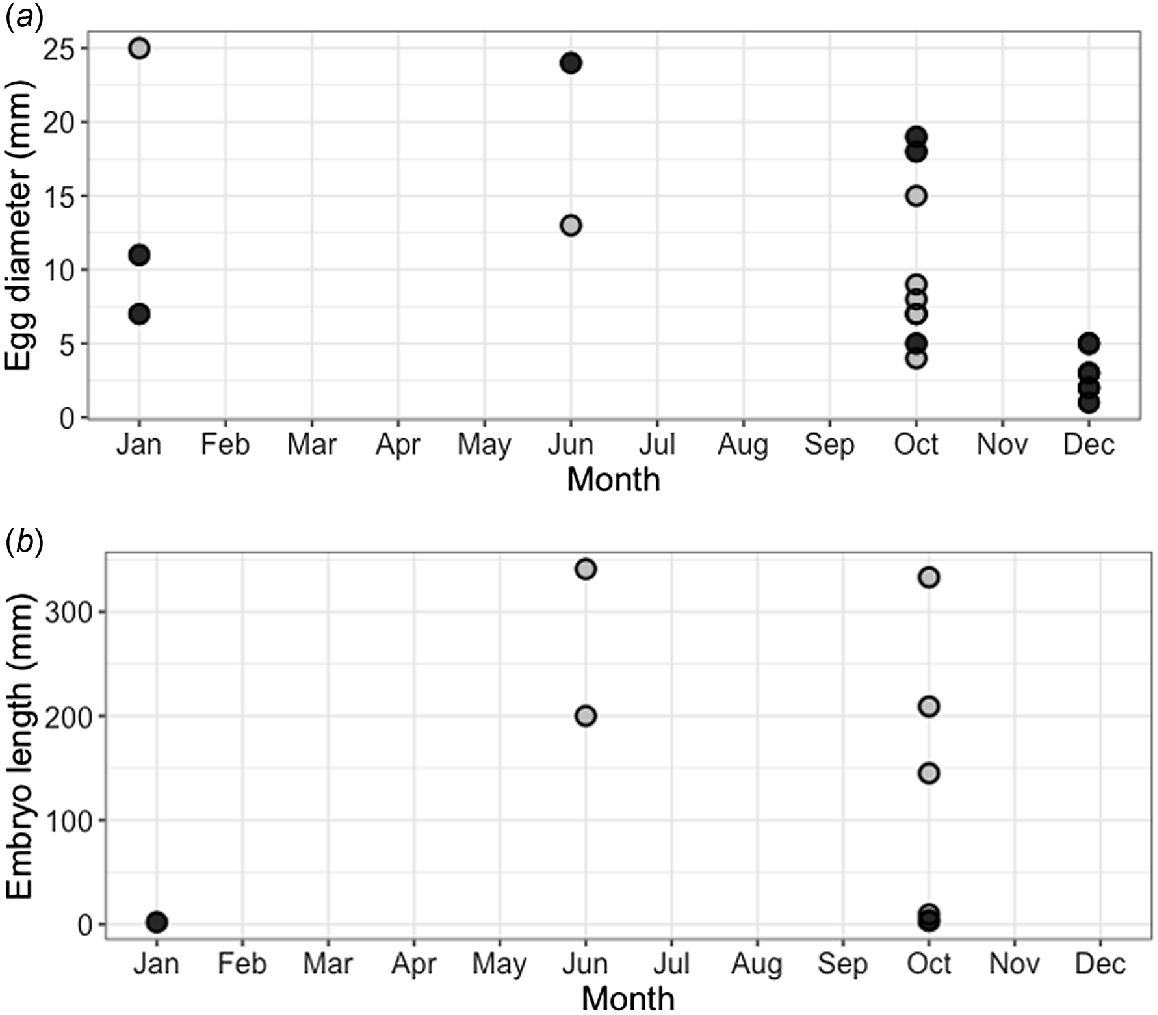
Of the 16 mature female blackspot sharks, 9 were gravid. Two were early-stage pregnancies, with two large yolky eggs inside the uterus but no embryos attached. The remaining seven gravid females had litters of two pups each; however, in one individual it appeared that one of the two pups had failed to develop properly. The largest embryos observed (341 and 333 mm STL from the same mother, Fig. 8b) were fully developed, and the smallest shark provided from the fishery measured 359 mm STL, suggesting that length at birth falls between 341 and 359 mm STL. The largest embryo (341 mm STL) was 43% of the size of the mother (785 mm STL). Of the nine gravid females, six had embryos that could be sexed, of which five were males and five were females (total embryos = 10), meaning that the sex ratio did not significantly differ from 1:1 (χ2 = 0, d.f. = 1, P = 1.00). The youngest gravid female was 5 years old, and the oldest was 10 years old. Females showed various stages of pregnancy during the course of the year (Fig. 8b). Non-gravid mature females showed various ova diameters throughout the year (Fig. 8a), suggesting that reproduction is asynchronous and year-round. However, noticeably smaller ova were observed during December, suggesting a potential ‘pause’ during this month.
Reproductive data for female blackspot sharks (Carcharhinus sealei). (a) Largest ovarian egg diameter by month for all mature females (n = 16), showing both gravid (grey circles) and non-gravid (black circles) individuals, and (b) embryo (grey circles) and implanted egg (black circles) length by month for nine gravid individuals (where females carried two embryos, only the largest were selected for visualisation). Of gravid females (n = 9), only eight are visualised because the ova in one gravid female was damaged and not measurable.
Hepatosomatic index (HSI)
Results of the three-way ANOVA showed a statistically significant effect of sex on HSI; females overall had significantly higher HSI than did males (P = 0.0212–0.0261). The effect of month, maturity or in the interaction of sex and month, or of sex and maturity, was not significant (Supplementary Table S1, Fig. 9). The highest HSI value (5.9375) was observed in a mature female with an early-stage pregnancy (presence of two large yolky eggs in uterus). The second-highest HSI value (5.2910) was observed in an immature female in November. The lowest HSI values (<2.00) were observed in a mature female (caught in June), a mature male (caught in April) and an immature male (caught in December).
Hepatosomatic index (HSI) for male (n = 41) and female (n = 30) blackspot shark (Carcharhinus sealei) for which liver weight was recorded, between sexes and across months. Dark bars within each box represent the median value, the upper and lower boundaries of each box represent the interquartile range, the whiskers represent the total range, and the points outside the box represent outliers.
Interview: the fishery and supply chain
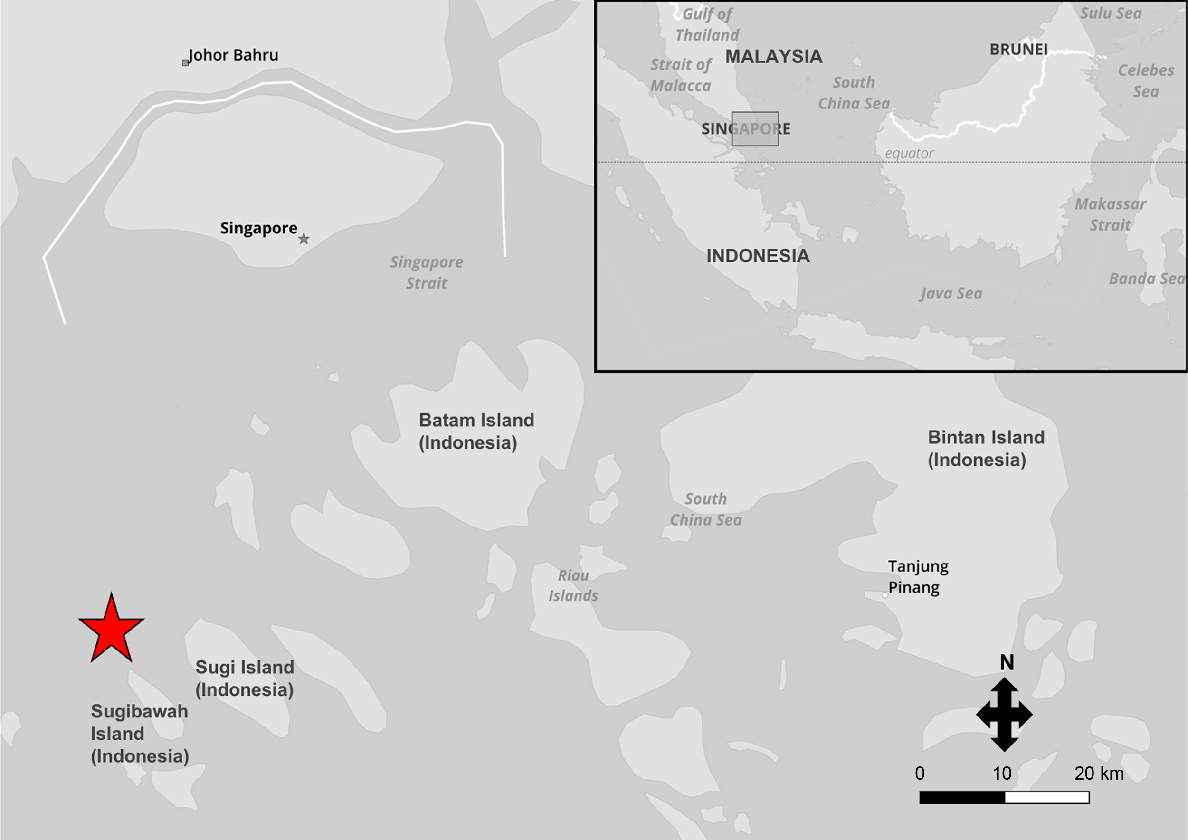
The private seafood supplier of 92 of the sharks sourced from Indonesia provided their general catch location (Fig. 10). He reported that animals were caught by small ‘sampan’ fishing boats that generally stay out for no longer than 12 h and use handlines. Fish (including snappers, Lutjanidae, groupers, Serranidae, catfish, Ariidae, jacks and trevallies, Carangidae) are the target species, with blackspot sharks being caught incidentally, but retained. Because the handlines are immediately retrieved once something is hooked, the sharks tend to still be alive when hauled in. Squid is reportedly used as bait in these handline fisheries, which was also confirmed by the presence of a sectioned (e.g. straight-edged) piece of squid inside one of the shark stomachs. Generally, every species caught by these boats has commercial value, and if the fishermen can sell it, they will land it ashore, unless it is not worth the ice and storage, which is reportedly rare. Within the region (Fig. 10), blackspot sharks are also caught on longlines, and some of the sharks from this study may have come from these fisheries, although the trader viewed that most come from handline fisheries. Longlines can stretch between 100 m and 1 km, set at 10–30 m deep, and it is the bottom-set longlines (called ‘rawai’) that tend to catch blackspot sharks. Because the longlines are left at sea for longer periods, the sharks are often deceased when hauled in, and the stress of pulling the longline up from depth can also cause mortality. Longline fisheries use fish of lower market value as bait, such as sardines and eel flesh. Eel flesh has tough skin and stays on the hook even if smaller fish bite at it. Any blackspot sharks caught are landed on nearby Indonesian islands. The sharks are eaten locally in Indonesia for their meat, but if there is a demand in Singapore they will be imported into the country via the two fishery ports (Jurong Fishery Port and Senoko Fishery Port).
Catch location of 92 blackspot sharks (Carcharhinus sealei) sourced from a private seafood supplier who is based in Singapore. The sharks were caught in Indonesia (in the Riau Islands; an island chain close to Singapore) from a handline fishery predominantly targeting other species of fish, located approximately at the marker (red star). The upper right box highlights the catch area relative to other countries in the region.
Interview: the Singaporean market for blackspot sharks
Within Singapore, blackspot sharks from this supplier are usually sold whole in wet markets (primarily Tekka market), with Singapore’s Indian population reportedly being the main buyers, who tend to cook it in curries for personal, domestic use. Historically, blackspot sharks have always been used for their meat, which is considered superior to other species (such as bull shark and blacktip sharks) because it is softer; however, overall, the supplier reported that shark meat has never been a particularly large or prominent part of the Singaporean diet. The supplier stated that supply and demand of blackspot sharks has reduced over the years and is attributed to (a) lower population numbers and fewer being caught, and (b) increased availability of substitutes, including imported frozen blue shark meat, which is more convenient because whole, fresh sharks (such as blackspot sharks from Indonesia) have to be processed. Blackspot sharks contribute less than 5% of the supplier’s business and he reported that ‘not catching and selling it would not impact me’, and that the market is too small to warrant it being directly ‘replaced’ by another species if it could not be caught or sold.
Interview: population trends and management options
The supplier has observed a decline in the availability of blackspot sharks over the years, estimating this decline at 50–70% over his 45 years in the industry. Blackspot sharks could reportedly be caught from the shore before, but now this was not the case. The species tend to be caught during monsoon seasons (approximately November, December, as well as in June), and he suspected this is when they aggregate for breeding. Outside of monsoon seasons, the catch is more sporadic. The supplier thought that blackspot sharks would benefit from improved management. Although the release of blackspot sharks caught could be an option, because they have relatively low market value compared to other seafod species, the supplier highlighted some challenges; for example, fishermen would still pull the shark on board to remove their hook, and this rough handling on-board could result in high post-release mortality. Cutting the line while the shark is still in the water would reduce this stress; however, fishermen may be unwilling to do this as they will lose the hook. If the sharks were released in such a manner, he recommended that research assess post-release survival rates. For the longline fisheries, most sharks are dead when hauled in; so, release of individuals is not an option under current fishing practices. However, as long as an animal has even a small market value, fishermen would want to retain and sell them. The supplier thought that more Marine Protected Areas with proper enforcement would be beneficial. Although requiem sharks, which includes blackspot sharks, have been added to supplementary appendix II of the Convention on International Trade in Endangered Species of Wild Fauna and Flora (CITES, as of November 2022), thus regulating their trade, the supplier stated that enforcement was an issue, and that regulation of trade does not necessarily stop animals being caught in the first place, particularly for species primarily caught incidentally, such as the blackspot shark.
Discussion
Despite sharks matching the description of both the blackspot shark and Indonesian whaler shark were being sourced, genetic analysis, where successful, showed that only blackspot sharks were present in the sample. A previous study from Brunei found that blackspot sharks and Indonesian whaler sharks occur sympatrically in coastal waters, as determined through mitochondrial analysis and morphology of specimens caught by fisheries (Azri et al. 2020); however, interestingly, the sample from the fishery location in this study (n = 92), as well as those sourced from Singapore’s fishery ports (n = 11) consisted of only blackspot sharks. Indonesian whaler sharks are believed to have smaller, restricted ranges than do blackspot sharks (Azri et al. 2020), and range to greater depths than do blackspot sharks (40 v. 100 m; White 2012; Ebert et al. 2013), which may account for their absence from the sample in this study. Alternatively, further scrutiny of catch and landings data may help to determine whether their populations have experienced more significant declines than blackspot sharks in the particular catch locations in this study.
This study of blackspot sharks is based on samples mainly taken from Indonesia with significantly more males (n = 58) than females (n = 34) being evident in the sample from the known fishery site in this study. This may suggest the occurrence of sexual segregation, with this fishery primarily operating in a male-dominated habitat. Observed dietary differences between the sexes suggest that resource or spatial partitioning may be occurring, with mature males consuming more bony fishes, mature females consuming more cephalopods, and immature animals consuming more crustaceans than mature animals. Sexual segregation is often seen in animals for reasons relating to social aspects or habitat (Wearmouth and Sims 2008). The phenomenon is commonly observed in sharks, including spottail sharks (C. sorrah) in Australia, where females use shallower habitats than do males (Knip et al. 2012), blacktip reef sharks (C. melanopterus) in French Polynesia, where females frequent lagoons whereas males frequent fore-reefs (Mourier et al. 2013) and blacktip reef sharks in Australia, where adult males are transient and largely absent from areas used by adult females (Chin et al. 2016). However, in this study, females were supplied in 5 of the 7 months that males were, suggesting at least some co-habitation or that the fishery also ranges into female habitats. The sample size of blackspot sharks from this study was also skewed towards larger individuals for both males and females, which may be attributed to size-related habitat segregation, feeding habits, or fishing-gear selectivity, because some gear may select for larger individuals (Chen et al. 2007; White 2010).
This study suggested that male and female blackspot sharks reach maturity at approximately the same age, with 50% reaching maturity at 6.1 years, and 95% reaching maturity by 8.6–8.9 years. However, some individuals mature as early as at 4 years of age, and the youngest gravid female was 5 years old and 750 mm STL. Females reached larger sizes and older ages than did males; a maximum age of 11 years for females, and 9 for males, was recorded during the study. This relatively short lifespan is typical for small, in-shore carcharhinid species (Gutteridge et al. 2013). It was determined that female blackspot sharks have a slower growth rate (k-value of 0.25 year−1) than do male blackspot sharks (k-value of 0.47 year−1), and combined, the species have a k-value of 0.37 year−1, which is considered a moderately rapid growth rate (Branstetter 1990; Chen et al. 2007). Whereas this is considerably faster than for some larger species such as the dusky shark (C. obscurus), which matures at 17–23 years old with a k-value of 0.043 (Simpfendorfer et al. 2002), it is slower than for some other small-bodied species such as the Australian sharpnose shark (R. taylori), which matures at 1 year of age and has a k-value of 1.33 for males (Simpfendorfer 1993). The blackspot shark matures later than their close relative the Australian blackspot shark (C. coatesi) from Papua New Guinea, which has the same maximum age of 11 years but attains 50% age-at-maturity by 5.1–5.3 years and 95% age-at-maturity by 6.4–7.4 years (Baje et al. 2019).
Although the blackspot shark has a moderately fast growth rate, this study found that the species has a small litter size of only two pups, which is considered among the lowest for a carcharhinid (Last and Stevens 2009; Gutteridge et al. 2013). A large size at birth (the largest embryo in this study was 43% the size of the mother) is likely to increase neonate survival, which helps compensate for this low fecundity (Branstetter 1990). Reproduction appears to be asynchronous (year-round), which is likely to be due to the absence of temperature fluctuations in the tropics. Outside of the tropics, many elasmobranchs are known to breed synchronously, in-line with optimal seasons (Harry et al. 2013).
Overall, species such as the blackspot shark may take longer to recover from exploitation, because population recovery takes longer owing to low reproductive output (Smith et al. 1998). The blackspot sharks’ low fecundity, coupled with their relatively late age-at-maturity (6.1 years), suggests that the species is more vulnerable to fishing pressure, as is also suspected for the Australian blackspot shark (Baje et al. 2019). Additionally, small-bodied carcharhinids have high natural mortality because they can experience predation across all age classes because they are not afforded the natural protection that larger-bodied sharks experience (Branstetter 1990). The blackspot shark is reported to have experienced a suspected population reduction of 30–49% over the past 24 years (Dulvy et al. 2021b), which corresponds with the local account reported here, where the seafood supplier estimated a 50–70% decline in availability over the past 45 years. Aside from intrinsic sensitivity, any species exposed to exploitation faces potential risk (Sherman et al. 2022), and focusing conservation efforts on large species, as often happens, leaves smaller species without adequate management (García et al. 2008).
All carcharhinid sharks are now listed on CITES Appendix II, meaning that international trade cannot occur without a permit declaring that it is not detrimental to the survival of the species in the wild (Convention on International Trade in Endangered Species of Wild Fauna and Flora 2021). The enactment of this listing for carcharhinid sharks was enforced from November 2023, and includes the blackspot shark (Convention on International Trade in Endangered Species of Wild Fauna and Flora 2022). As mentioned by the seafood supplier interviewed during this study, the blackspot shark is often caught incidentally; so, trade restrictions resulting from a CITES Appendix II listing may not reduce mortality significantly, and in-country regulations are therefore important. The seafood supplier shared that, from his experience, sharks caught by handlines are retrieved immediately, when the animal is still alive; so, training and incentivising fishers to safely handle and release animals (Poisson et al. 2014) could be a management option. Willingness of fishers to do this should be explored (blackspot shark is consumed locally in Indonesia, and so fishers can still earn income from catches regardless of their listing on CITES Appendix II). Additionally, post-release survival should be assessed (Ellis et al. 2017; Booth et al. 2023). The seafood supplier shared that from his experience, sharks caught by longlines are often deceased by the time the gear is retrieved; so, efforts to limit initial capture and mortality are needed here. Interventions to reduce shark bycatch recommended for other longline fisheries include reduced number of hooks, attaching lights (although only certain colours may reduce bycatch), reducing soak time, avoiding wire leaders and changing hook and bait types (Yulianto et al. 2018; Swimmer et al. 2020; Afonso et al. 2021). The blackspot shark is morphologically very similar to the Indonesian whaler shark, and somewhat similar in appearance to other coastal carcharhinid species found in South-east Asia, including blacktip reef sharks and juvenile spottail sharks. These species all have black spots on fins although in different places and quantities, and they are also all taken in regional fisheries (Southeast Asian Fisheries Development Center 2017; Clark-Shen et al. 2023). Difficulties in identification may therefore lead to ineffectual strategies if a single-species approach is used. Hence, similar management measures could be applied to multiple species.
In addition to species-specific management measures, the ecosystem as a whole must be considered; species need healthy prey populations and habitats to survive (Chiaradia et al. 2010). The dietary analysis of blackspot sharks showed that fishes are important to mature and immature males, crustaceans are important to immature males and females, and cephalopods are important to mature females. The dominance of cephalopods (including squid, cuttlefish and unidentified cephalopods) in the diets of mature females may indicate that they are an energetically valuable prey for females to support reproductive activity, as has been hypothesised for adult female large-eye stingray, which is known to target lobsters (Costa et al. 2015). After the disappearance of primary prey, predators may shift to lower-energy prey (Costa et al. 2015), exhibit lower reproductive success and, eventually, a reduction in population size (Chiaradia et al. 2010).
This study has presented new information on the biology, ecology and fisheries aspects of the blackspot shark. Even though the sample size was considerable (n = 103), collection of specimens across all months and a larger sample size of females would have given more confidence to the interpretation of age and reproductive data. Future research, where possible and in collaboration with fishers, is necessary to determine impacts of fishing-gear type on mortality and better understand whether sex or size segregation occurs. Unlike some large-bodied species, many small-bodied sharks are known to consistently use nearshore regions as both juveniles and adults (Heupel et al. 2006; Knip et al. 2012; Chin et al. 2013b). Given that a population-genetics assessment of blackspot sharks in Brunei suggested that they may be migratory and have wider ranges than does their close relative, the Indonesian whaler shark (Azri et al. 2020), we also need to understand movement patterns and identify key habitats for blackspot sharks to enable the development of appropriate fisheries management and conservation strategies such as spatial management plans (Chin et al. 2023).
Declaration of funding
This collection of samples was supported by Mandai Nature Singapore and the research was possible thanks to the James Cook University Postgraduate Research Scholarship (JCUPRS) to N. Clark-Shen.
Acknowledgements
The authors thank the supplier of the blackspot sharks for being supportive of the research and open with the sharing of information; Jonathan Smart for assisting with the interpretation of age–growth modelling results; and Celestine, Nayli and Afifah for assisting with DNA analysis.
References
Afonso AS, Mourato B, Hazin H, Hazin FHV (2021) The effect of light attractor color in pelagic longline fisheries. Fisheries Research 235, 105822.
| Crossref | Google Scholar |
Arai T, Azri A (2019) Diversity, occurrence and conservation of sharks in the southern South China Sea. PLoS ONE 14, e0213864.
| Crossref | Google Scholar |
Arunrugstichai S, True JD, White WT (2018) Catch composition and aspects of the biology of sharks caught by Thai commercial fisheries in the Andaman Sea. Journal of Fish Biology 92, 1487-1504.
| Crossref | Google Scholar | PubMed |
Azri A, Taha H, Arai T (2020) Molecular and morphological evidence for the identity of the blackspot shark, Carcharhinus sealei, and the Indonesian whaler shark, C. tjutjot, with notes on their population structures. Environmental Biology of Fishes 103, 1453-1461.
| Crossref | Google Scholar |
Ba BA, Diop MS, Diatta Y, Justine D, Ba CT (2013) Diet of the milk shark, Rhizoprionodon acutus (Rüppel, 1837) (Chondrichthyes: Carcharhinidae), from the Senegalese coast. Journal of Applied Ichthyology 29, 789-795.
| Crossref | Google Scholar |
Baje L, Smart JJ, Grant MI, Chin A, White WT, Simpfendorfer CA (2019) Age, growth and maturity of the Australian blackspot shark (Carcharhinus coatesi) in the Gulf of Papua. Pacific Conservation Biology 25, 403-412.
| Crossref | Google Scholar |
Barría C, Coll M, Navarro J (2015) Unravelling the ecological role and trophic relationships of uncommon and threatened elasmobranchs in the western Mediterranean Sea. Marine Ecology Progress Series 539, 225-240.
| Crossref | Google Scholar |
Berkström C, Papadopoulos M, Jiddawi NS, Nordlund LM (2019) Fishers’ local Ecological Knowledge (LEK) on connectivity and seascape management. Frontiers in Marine Science 6, 130.
| Crossref | Google Scholar |
Boonstra WJ, Birnbaum S, Björkvik E (2017) The quality of compliance: investigating fishers’ responses towards regulation and authorities. Fish and Fisheries 18, 682-697.
| Crossref | Google Scholar |
Booth H, Squires D, Milner-Gulland EJ (2019) The neglected complexities of shark fisheries, and priorities for holistic risk-based management. Ocean & Coastal Management 182, 104994.
| Crossref | Google Scholar |
Booth H, Ramdlan MS, Hafizh A, Wongsopatty K, Mourato S, Pienkowski T, Adrinato L, Milner-Gulland EJ (2023) Designing locally appropriate conservation incentives for small-scale fishers. Biological Conservation 277, 109821.
| Crossref | Google Scholar |
Bornatowski H, Braga RR, Abilhoa V, Corrêa MFM (2014) Feeding ecology and trophic comparisons of six shark species in a coastal ecosystem off southern Brazil. Journal of Fish Biology 85, 246-263.
| Crossref | Google Scholar | PubMed |
Branstetter S (1990) Early life-history implications of selected carcharhinoid and lamnoid sharks of the northwest Atlantic. In ‘Elasmobranchs as living resources: advances in the biology, ecology, systematic, and the status of the fisheries, Proceedings of the Second United States–Japan Workshop’, 9–14 December 1987, Honolulu, HI, USA. (Eds HL Pratt Jr, SH Gruber, T Taniuchi) NOAA Technical Report NMFS 90, pp. 17–28. (US Department of Commerce) Available at https://spo.nmfs.noaa.gov/sites/default/files/tr90opt.pdf
Buckland A, Baker R, Loneragan N, Sheaves M (2017) Standardising fish stomach content analysis: the importance of prey condition. Fisheries Research 196, 126-140.
| Crossref | Google Scholar |
Cailliet GM (2015) Perspectives on elasmobranch life-history studies: a focus on age validation and relevance to fishery management. Journal of Fish Biology 87, 1271-1292.
| Crossref | Google Scholar | PubMed |
Campana SE (2001) Accuracy, precision and quality control in age determination, including a review of the use and abuse of age validation methods. Journal of Fish Biology 59(2), 197-242.
| Crossref | Google Scholar |
Chen W-K, Chen P-C, Liu K-M, Wang S-B (2007) Age and growth estimates of the whitespotted bamboo shark, Chiloscyllium plagosum, in the northern waters of Taiwan. Zoological Studies 46, 92-102.
| Google Scholar |
Chiaradia A, Forero MG, Hobson KA, Cullen JM (2010) Changes in diet and trophic position of a top predator 10 years after a mass mortality of a key prey. ICES Journal of Marine Science 67, 1710-1720.
| Crossref | Google Scholar |
Chin A, Simpfendorfer C, Tobin A, Heupel M (2013a) Validated age, growth and reproductive biology of Carcharhinus melanopterus, a widely distributed and exploited reef shark. Marine and Freshwater Research 64, 965-975.
| Crossref | Google Scholar |
Chin A, Tobin AJ, Heupel MR, Simpfendorfer CA (2013b) Population structure and residency patterns of the blacktip reef shark Carcharhinus melanopterus in turbid coastal environments. Journal of Fish Biology 82, 1192-1210.
| Crossref | Google Scholar | PubMed |
Chin A, Heupel MR, Simpfendorfer CA, Tobin AJ (2016) Population organisation in reef sharks: new variations in coastal habitat use by mobile marine predators. Marine Ecology Progress Series 544, 197-211.
| Crossref | Google Scholar |
Chin A, Molloy FJ, Cameron D, Day JC, Cramp J, Gerhardt KL, Heupel MR, Read M, Simpfendorfer CA (2023) Conceptual frameworks and key questions for assessing the contribution of marine protected areas to shark and ray conservation. Conservation Biology 37, e13917.
| Crossref | Google Scholar |
Clark-Shen N, Xu Tingting K, Rao M, Cosentino-Roush S, Sandrasegeren R, Gajanur AR, Chapman DD, Lee Xin Ying E, Flowers KI, Feldheim KA, Manjaji-Matsumoto BM, Ng Zheng Hui S (2021) The sharks and rays at Singapore’s fishery ports. Fisheries Research 235, 105805.
| Crossref | Google Scholar |
Clark-Shen N, Chin A, Arunrugstichai S, Labaja J, Mizrahi M, Simeon B, Hutchinson N (2023) Status of Southeast Asia’s marine sharks and rays. Conservation Biology 37, e13962.
| Crossref | Google Scholar |
Convention on International Trade in Endangered Species of Wild Fauna and Flora (2021) CITES ‘non-detriment findings’ – requirements of the convention. (CITES) Available at https://cites.org/eng/prog/ndf/Requirements_Convention [Verified 28 April 2023]
Convention on International Trade in Endangered Species of Wild Fauna and Flora (2022) Notes on the proposal for inclusion of requiem sharks (family: Carcharhinidae) in Appendix II of CITES In relation to global management deficiencies (submitted by Sri Lanka). (CITES) Available at https://cites.org/eng/node/134179 [Verified 28 April 2023]
Costa TLA, Thayer JA, Mendes LF (2015) Population characteristics, habitat and diet of a recently discovered stingray Dasyatis marianae: implications for conservation. Journal of Fish Biology 86, 527-543.
| Crossref | Google Scholar | PubMed |
Dicken ML, Hussey NE, Christiansen HM, Smale MJ, Nkabi N, Cliff G, Wintner SP (2017) Diet and trophic ecology of the tiger shark (Galeocerdo cuvier) from South African waters. PLoS ONE 12, e0177897.
| Crossref | Google Scholar |
Dulvy NK, Pacoureau N, Rigby CL, Pollom RA, Jabado RW, Ebert DA, Finucci B, Pollock CM, Cheok J, Derrick DH, Herman KB, Sherman CS, VanderWright WJ, Lawson JM, Walls RHL, Carlson JK, Charvet P, Bineesh KK, Fernando D, et al. (2021a) Overfishing drives over one-third of all sharks and rays toward a global extinction crisis. Current Biology 31, 4773-4787.E8.
| Crossref | Google Scholar | PubMed |
Dulvy N, Bin Ali A, Bineesh KK, Derrick D, Seyha L, Tanay D, VanderWright WJ, Vo VQ, Yuneni RR, Maung A, Utzurrum JAT (2021b) Blackspot shark Carcharhinus sealei. In ‘The IUCN Red List of Threatened Species 2021’. e.T41738A68613628. (International Union for Conservation of Nature and Natural Resources) Available at https://www.iucnredlist.org/species/41738/68613628
Ellis JR, McCully Phillips SR, Poisson F (2017) A review of capture and post-release mortality of elasmobranchs. Journal of Fish Biology 90, 653-722.
| Crossref | Google Scholar | PubMed |
Fisher M, Hunter E (2018) Digital imaging techniques in otolith data capture, analysis and interpretation. Marine Ecology Progress Series 598, 213-231.
| Crossref | Google Scholar |
Francis MP (2006) Morphometric minefields-towards a measurement standard for chondrichthyan fishes. Environmental Biology of Fishes 77, 407-421.
| Crossref | Google Scholar |
García VB, Lucifora LO, Myers RA (2008) The importance of habitat and life history to extinction risk in sharks, skates, rays and chimaeras. Proceedings of the Royal Society of London – B. Biological Sciences 275, 83-89.
| Crossref | Google Scholar |
Goldman K (2005) Age and growth of elasmobranch fisheries. In ‘Management techniques for elasmobranch fisheries. FAO Fisheries Technical Paper 474’. (Eds JA Musick, R Bonfil) (Food and Agriculture Organization of the United Nations: Rome, Italy) Available at https://www.fao.org/3/a0212e/A0212E10.htm [Verified 1 June 2023]
Grant MI, Smart JJ, White WT, Chin A, Baje L, Simpfendorfer CA (2018) Life history characteristics of the silky shark Carcharhinus falciformis from the central west Pacific. Marine and Freshwater Research 69, 562-573.
| Crossref | Google Scholar |
Gutteridge AN, Huveneers C, Marshall LJ, Tibbetts IR, Bennett MB (2013) Life-history traits of a small-bodied coastal shark. Marine and Freshwater Research 64, 54-65.
| Crossref | Google Scholar |
Harry AV, Tobin AJ, Simpfendorfer CA (2013) Age, growth and reproductive biology of the spot-tail shark, Carcharhinus sorrah, and the Australian blacktip shark, C. tilstoni, from the Great Barrier Reef World Heritage Area, north-eastern Australia. Marine and Freshwater Research 64, 277-293.
| Crossref | Google Scholar |
Heupel MR, Simpfendorfer CA, Collins AB, Tyminski JP (2006) Residency and movement patterns of bonnethead sharks, Sphyrna tiburo, in a large Florida estuary. Environmental Biology of Fishes 76, 47-67.
| Crossref | Google Scholar |
Jabado RW, Al Ghais SM, Hamza W, Henderson AC, Al Mesafri AA (2015) Diet of two commercially important shark species in the United Arab Emirates: milk shark, Rhizoprionodon acutus (Rüppell, 1837), and slit-eye shark, Loxodon macrorhinus (Muller & Henle, 1839). Journal of Applied Ichthyology 31, 870-875.
| Crossref | Google Scholar |
Knip DM, Heupel MR, Simpfendorfer CA (2012) Habitat use and spatial segregation of adult spottail sharks Carcharhinus sorrah in tropical nearshore waters. Journal of Fish Biology 80, 767-784.
| Crossref | Google Scholar | PubMed |
McAuley RB, Simpfendorfer CA, Hall NG (2007) A method for evaluating the impacts of fishing mortality and stochastic influences on the demography of two long-lived shark stocks. ICES Journal of Marine Science 64, 1710-1722.
| Crossref | Google Scholar |
MacKeracher T, Mizrahi M, Bergseth B, Maung KMC, Khine ZL, Phyu ET, Simpfendorfer CA, Diedrich A (2021) Understanding non-compliance in small-scale fisheries: shark fishing in Myanmar’s Myeik Archipelago. Ambio 50, 572-585.
| Crossref | Google Scholar | PubMed |
Mourier J, Mills SC, Planes S (2013) Population structure, spatial distribution and life-history traits of blacktip reef sharks Carcharhinus melanopterus. Journal of Fish Biology 82, 979-993.
| Crossref | Google Scholar | PubMed |
O’Shea OR, Thums M, van Keulen M, Kempster RM, Meekan MG (2013) Dietary partitioning by five sympatric species of stingray (Dasyatidae) on coral reefs. Journal of Fish Biology 82, 1805-1820.
| Crossref | Google Scholar | PubMed |
Poisson F, Séret B, Vernet A-L, Goujon M, Dagorn L (2014) Collaborative research: development of a manual on elasmobranch handling and release best practices in tropical tuna purse-seine fisheries. Marine Policy 44, 312-320.
| Crossref | Google Scholar |
Potier M, Marsac F, Cherel Y, Lucas V, Sabatié R, Maury O, Ménard F (2007) Forage fauna in the diet of three large pelagic fishes (lancetfish, swordfish and yellowfin tuna) in the western equatorial Indian Ocean. Fisheries Research 83, 60-72.
| Crossref | Google Scholar |
Rangel BS, Hammerschlag N, Martinelli LA, Moreira RG (2022) Effects of urbanization on the nutritional ecology of a highly active coastal shark: preliminary insights from trophic markers and body condition. Science of The Total Environment 826, 154082.
| Crossref | Google Scholar |
Reis M, Figueira WF (2020) Age, growth and reproductive biology of two endemic demersal bycatch elasmobranchs: Trygonorrhina fasciata and Dentiraja australis (Chondrichthyes: Rhinopristiformes, Rajiformes) from Eastern Australia. Zoologia 37, 1-12.
| Crossref | Google Scholar |
Saïdi B, Enajjar S, Bradaï MN, Bouaïn A (2009) Diet composition of smooth-hound shark, Mustelus mustelus (Linnaeus, 1758), in the Gulf of Gabès, southern Tunisia. Journal of Applied Ichthyology 25, 113-118.
| Crossref | Google Scholar |
Salayo N, Garces L, Pido M, Viswanathan K, Pomeroy R, Ahmed M, Siason I, Seng K, Masae A (2008) Managing excess capacity in small-scale fisheries: perspectives from stakeholders in three Southeast Asian countries. Marine Policy 32, 692-700.
| Crossref | Google Scholar |
Sherman CS, Heupel MR, Moore SK, Chin A, Simpfendorfer CA (2020) When sharks are away, rays will play: effects of top predator removal in coral reef ecosystems. Marine Ecology Progress Series 641, 145-157.
| Crossref | Google Scholar |
Sherman CS, Sant G, Simpfendorfer CA, Digel ED, Zubick P, Johnson G, Usher M, Dulvy NK (2022) M-Risk: a framework for assessing global fisheries management efficacy of sharks, rays and chimaeras. Fish and Fisheries 23, 1383-1399.
| Crossref | Google Scholar |
Simpfendorfer CA (1993) Age and growth of the Australian sharpnose shark, Rhizoprionodon taylori, from north Queensland, Australia. Environmental Biology of Fishes 36, 233-241.
| Crossref | Google Scholar |
Simpfendorfer CA, McAuley RB, Chidlow J, Unsworth P (2002) Validated age and growth of the dusky shark, Carcharhinus obscurus, from Western Australian waters. Marine and Freshwater Research 53, 567-573.
| Crossref | Google Scholar |
Smart JJ, Grammer GL (2021) Modernising fish and shark growth curves with Bayesian length-at-age models. PLoS ONE 16, e0246734.
| Crossref | Google Scholar |
Smith SE, Au DW, Show C (1998) Intrinsic rebound potentials of 26 species of Pacific sharks. Marine and Freshwater Research 49, 663-678.
| Crossref | Google Scholar |
Swimmer Y, Zollett EA, Gutierrez A (2020) Bycatch mitigation of protected and threatened species in tuna purse seine and longline fisheries. Endangered Species Research 43, 517-542.
| Crossref | Google Scholar |
van der Putten WH, de Ruiter PC, Martijn Bezemer T, Harvey JA, Wassen M, Wolters V (2004) Trophic interactions in a changing world. Basic and Applied Ecology 5, 487-494.
| Crossref | Google Scholar |
von Bertalanffy L (1938) A quantitative theory of organic growth (inquiries on growth laws. II). Human Biology 10, 181-213.
| Google Scholar |
Ward RD, Zemlak TS, Innes BH, Last PR, Hebert PDN (2005) DNA barcoding Australia’s fish species. Philosophical Philosophical Transactions of the Royal Society of London – B. Biological Sciences 360, 1847-1857.
| Crossref | Google Scholar |
Wearmouth VJ, Sims DW (2008) Sexual segregation in marine fish, reptiles, birds and mammals behaviour patterns, mechanisms and conservation implications. Advances in Marine Biology 54, 107-170.
| Crossref | Google Scholar | PubMed |
White WT (2007) Catch composition and reproductive biology of whaler sharks (Carcharhiniformes: Carcharhinidae) caught by fisheries in Indonesia. Journal of Fish Biology 71, 1512-1540.
| Crossref | Google Scholar |
White WT (2010) Aspects of maturation and reproduction in hexanchiform and squaliform sharks. Journal of Fish Biology 76, 1362-1378.
| Crossref | Google Scholar | PubMed |
White WT (2012) A redescription of Carcharhinus dussumieri and C. sealei, with resurrection of C. coatesi and C. tjutjot as valid species (Chondrichthyes: Carcharhinidae). Zootaxa 3241, 1-34.
| Crossref | Google Scholar |
Yulianto I, Booth H, Ningtias P, Kartawijaya T, Santos J, Sarmintohadi , Kleinertz S, Campbell SJ, Palm HW, Hammer C (2018) Practical measures for sustainable shark fisheries: lessons learned from an Indonesian targeted shark fishery. PLoS ONE 13, e0206437.
| Crossref | Google Scholar |


