Evaluation of a fish-friendly self-cleaning horizontal irrigation screen using autonomous sensors
Aljon Salalila A , Zhiqun Daniel Deng A C , Jayson J. Martinez A , Jun Lu A and Lee J. Baumgartner BA Pacific Northwest National Laboratory, Energy and Environment Directorate, 902 Battelle Boulevard, Richland, WA 99354, USA.
B Charles Sturt University, Institute for Land, Water and Society, Elizabeth Mitchell Drive, Thurgoona, NSW 2640, Australia.
C Corresponding author. Email: zhiqun.deng@pnnl.gov
Marine and Freshwater Research 70(9) 1274-1283 https://doi.org/10.1071/MF19194
Submitted: 25 May 2019 Accepted: 20 June 2019 Published: 16 July 2019
Journal Compilation © CSIRO 2019 Open Access CC BY-NC-ND
Abstract
Irrigation modernisation is booming globally because of the increasing demand on water and food. However, irrigation infrastructures can injure fish or entrain them into irrigation water. Screening is an effective method to mitigate fish entrainment. In this study, two autonomous sensor devices, developed and manufactured at Pacific Northwest National Laboratory (Sensor Fish and its miniaturised version, Sensor Fish Mini) were deployed to evaluate the physical and fish passage conditions of a unique horizontal, flat-plate fish and debris screen (known as the Farmers Screen) that was installed in Oregon, USA. Only 1 of the 27 Sensor Fish Mini releases had a severe acceleration event, whereas 0 of the 37 Sensor Fish releases had severe events. The rates of severe events and amplitudes of accelerations at the Farmers Screen were significantly lower than those at other hydraulic structures, including a fish-friendly surface weir that recorded nearly 100% fish survival. Overall, the results indicated that the Farmers Screens can provide safe downstream passage for fish at irrigation diversions. This study also demonstrated that the Sensor Fish technology, including Sensor Fish Mini, is a suitable technology for evaluating irrigation structures and providing important information for the development of sustainable irrigation.
Introduction
Because of increasing demand on water and water productivity, there is a significant global boom in irrigation expansion and modernisation (Playán and Mateos 2006). Existing irrigation schemes are being rapidly expanded to meet global food demands (Béné et al. 2015; Jaramillo et al. 2019). Furthermore, dated and aging infrastructure is being updated and modernised (Baumgartner et al. 2019). However, irrigation structures can significantly affect freshwater fish (Khoa et al. 2005). Primarily, this occurs through flow alteration, habitat destruction and blocking of migration routes (Baumgartner et al. 2014). Irrigation infrastructure can also result in fish injuries and significant numbers of fish being extracted or entrained into irrigation water (Gregory et al. 2018). These extractions can significantly affect main channel fishery population because, when fish are removed, they are effectively ‘lost’ from the source system (Gregory et al. 2018).
Fish entrainment into irrigation systems can be effectively mitigated using exclusion technology, such as screening (Gale et al. 2008; Baumgartner and Boys 2012). Screens have been applied to irrigation diversions for over a century: for example, the state of Washington in the US started requiring fish screens on diversions in 1905 (McMichael et al. 2004). Significant progress has been made in some areas of the US, such as the state of Oregon, where over 60% of all diversions have fish protection devices fitted (Neitzel et al. 1990). However, the installation of fish screens is non-existent in most other areas. Thus, globally, millions of fish are being extracted from main channels annually (Gregory et al. 2018). There is a significant need to develop global programs that protect fish from entrainment; however, there often is a cost involved with implementation and a lag between developing cost-effective designs and determining proof-of-concept. Thus, any information on proof-of-concept is likely to facilitate and accelerate application of new screening systems (Moyle and Israel 2005).
A unique type of fish screen is the ‘Farmers Screen’, which is a horizontal, flat-plate fish and debris screen. It was developed by Farmers Irrigation District in Oregon and designed to be installed in an off-stream channel where water, fish and debris pass quickly over the screen and return to the river or creek. Mesa et al. (2012) evaluated a small version of the Farmers Screen using juvenile Coho salmon (Oncorhynchus kisutch) under a range of inflows (0.02–0.42 m3 s–1) and diversion flows (0.02–0.34 m3 s–1; the screen was designed for 0.28 m3 s–1) at different water depths. Mesa et al. (2012) reported that there was no injury or delayed mortality associated with the passage, and no fish were impinged on the screen surface. The Farmers Conservation Alliance (Hood River, OR, USA) has facilitated the construction of 48 Farmers Screens in seven states throughout the western US. There is significant potential to scale up and extend application into other catchments and river systems worldwide, but proof-of-concept is essential to demonstrate the system’s value for wider application.
Traditionally, studies have focused on direct observations of fish movements, impingements and entrainment to quantify benefits derived from screen studies (Turnpenny et al. 1998; McMichael et al. 2004). These approaches are technically sound, but often require the use of live fish (Swanson et al. 2005). Using live fish can be challenging and costly because: (1) death is a possible end-point for fish that are impinged and entrained; (2) the large numbers of fish needed to conduct studies with adequate samples sizes are often unavailable; (3) it is difficult to discern the source of potential injuries (e.g. handling, releasing, recapturing); and (4) it is difficult to replicate the way in which a fish would naturally approach a screen (Swanson et al. 2005).
An alternative is to use autonomous sensors such as the Sensor Fish (SF; Deng et al. 2014). The SF technology was developed and manufactured at Pacific Northwest National Laboratory primarily to quantify fish survival through hydropower structures, such as turbines (Boys et al. 2018; Martinez et al. 2019) and spillways (Duncan et al. 2018). A miniaturised version of the SF, known as Sensor Fish Mini (SFmini), was recently developed for studying small hydro turbines with small clearance between the turbine blades. Because of their in situ measurement capabilities, there is potential for the SF and SFmini to act as surrogates for live fish studies in applications other than hydropower. Thus, determining whether the SF and SFmini can validate fish screen effectiveness could provide a useful benchmark for further studies.
This study primarily sought to perform an objective, independent evaluation of the Farmers Screen at a full-scale site. Second, it sought to perform the first field test of the SFmini for application in fish screen studies. The measurements obtained in the full-scale screen by the SF and SFmini were then compared to those of other hydraulic structures studied using the SF.
Materials and methods
Study site
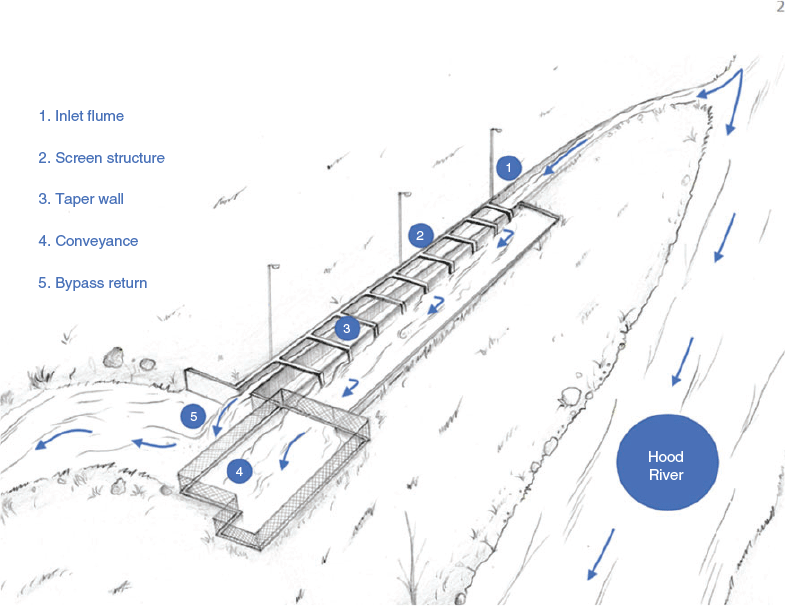
The Davenport Farmers Screen, a Farmers Screen deployed within the Davenport Irrigation Canal, is located on the Hood River near the city of Hood River, Oregon (Fig. 1). The operating conditions during the SF and SFmini evaluation of this Farmers Screen included an inflow of 2.5 m3 s–1, discharge flow of 0.5 m3 s–1, water inlet velocity of 1.8 m s–1, mid-screen velocity of 1.5 m s–1, outlet velocity of 1.2 m s–1, mean water depth of ~25 cm, an inlet width of 2.7 m and an outlet width of 0.6 m. These test conditions are representative of the operating range of the screen. The screen consists of an inlet flume, screen structure, taper wall, conveyance and bypass return (Fig. 2). The inlet flume is located at the upstream end of the screen structure where the diverted water from the river or stream enters. The water entering the diversion is regulated by a downward-moving vertical headgate that is opened and closed using an actuator. The water depth is automatically measured by a pressure transducer that sends the data to a programmable logic controller. The programmable logic controller uses the depth measurement to automatically adjust the amount the headgate is opened. The horizontal perforated screen is 49 m long and positioned parallel to the water surface, which produces a sweeping effect that allows fish and debris to be swept over the horizontal screen and safely back into the water source. The tapered wall is a steel panel that runs horizontally towards the downstream end of the structure while reducing the cross-sectional area of the flume. The conveyance is the water that has been screened and conveyed to its intended users (e.g. irrigators, hydropower generation facilities). The bypass return diverts the water, fish and debris back to the river or stream.

|
SF and SFmini devices
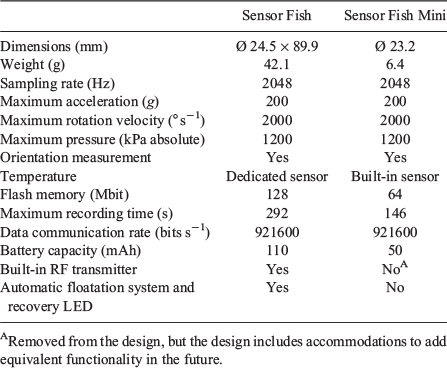
The hydraulic characteristics of the Davenport Farmers Screen were investigated by using the SF (Deng et al. 2014) and SFmini (Fig. 3). Both devices are autonomous sensor packages that can measure acceleration, rotational velocities and pressure. The SF is cylindrical in shape and is 89.9 mm long, with a diameter of 24.5 and mass of ~42.1 g. The SF is nearly neutrally buoyant in fresh water at deployment. Its size and density are similar to that of a yearling salmon smolt, which is the life stage that commonly migrates downstream through hydropower structures in the Columbia River Basin (Weitkamp et al. 2015). The SF contains a three-dimensional (3D) linear acceleration sensor (full-scale range of ±200g per axis), a 3D rotational velocity sensor (range of ±2000° s–1 and per axis), a 3D orientation sensor, a temperature sensor (range from –40 to 125°C) and a pressure sensor (absolute pressure of 1200 kPa). Each of the SF sensors samples at a rate of 2048 Hz and can store up to 5 min of data in non-volatile memory (Deng et al. 2014). To assist in recovery, the SF has a recovery module to make the SF positively buoyant, bringing it to the water’s surface for recovery after data collection. It also has a built-in radiofrequency transmitter for easy recovery of the SF using radiotracking equipment (Deng et al. 2014). In 2018, the SFmini was developed to support small hydro deployment and physical model testing by removing several functions that are not essential to these applications (e.g. the recovery module and radiofrequency transmitter) and experimenting with various form factors. The SFmini has a spherical shape, with a diameter of 23 mm and a mass of ~6.4 g. Similar to the SF, the SFmini has a 2048-Hz sampling rate for each of the sensors (Table 1). To ensure accurate readings, each sensor of every SF and SFmini was calibrated in the laboratory before field deployment.

|
|
Data acquisition and analysis
Data collection at the Davenport Farmers Screen occurred in June 2018. The SF and SFmini devices were released alternately, ~5 min apart. After activating, but before releasing the devices into the channel at mid-depth, a physical force (i.e. striking the device to concrete) was applied to each of the devices to generate a spike in acceleration. This acceleration was used as a timing mark for the entry to the channel. Once the devices passed through the screen structure, they were recovered using a net directly below the exit of the structure. After recovering the SF and SFmini devices, the raw data files were downloaded and the devices were programmed again for redeployment. A total of 37 and 27 valid releases were obtained from the SF and SFmini respectively. The sample size was determined using previous studies on irrigation structures (Pflugrath et al. 2019) and spillways (Duncan et al. 2018).
The datasets collected were uploaded into a centralised database that is part of the Hydropower Biological Evaluation Toolset (HBET, see https://biode.labworks.org/; Hou et al. 2018). The HBET is a collection of software tools developed to aid in data processing and analysis of SF data, as well as other hydropower evaluation-related technologies. The software has integrated tools to design new SF studies based on previously collected datasets, archive raw data from the SF and SFmini, process data to obtain quantitative characteristics that describe the hydraulic conditions of the structure studied, estimate the biological response by applying species-specific dose–response relationships to the measured hydraulic parameters and make comparisons between different treatments or different studies. The data analysis process begins by using the data analysis portion of the HBET to generate plots of the acceleration magnitude, rotational velocity magnitude and pressure. Attributes of the hydraulic passageway result in observable characteristics within the pressure, acceleration and rotational velocity time histories that correspond to different passage regions. Using the plots generated by the HBET, timing marks are placed manually to separate the dataset into portions corresponding to different passage regions. After generating the timing marks, HBET generates a table that summarises events of interest during passage through the hydraulic structure within each passage region, such as the total number of severe acceleration events and the number of severe acceleration events attributed to strike or shear.
Acceleration event analysis
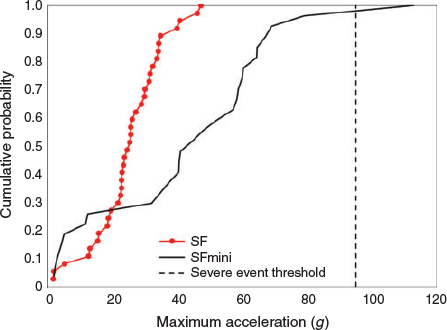
Fish passing through a hydraulic structure can be exposed to large accelerations resulting from colliding with a structure, being struck by rotating machinery (i.e. turbine or pump) or being exposed to shear flows. If the magnitude of the acceleration event exceeds 95g, the event is classified as a severe acceleration event. This threshold of 95g was developed from laboratory testing that involved exposing juvenile Chinook salmon (Oncorhynchus tschwaytscha) to shear flows (Deng et al. 2005). A fish would likely be injured if its head is exposed to a severe event.
Because the SF and SFmini are not live fish and cannot control their body to avoid contact with the screens, the percentage of SF and SFmini experiencing severe events is usually higher than that of live fish. In addition, the SF and SFmini do not distinguish the exposure mechanisms like live fish (e.g. tail, mid-body, head). However, the SF and SFmini can be useful for the biological evaluation of hydraulic structures. For example, Duncan et al. (2018) reported a strong correlation between the percentage of the most severe collisions measured by the SF and live fish injury estimates (r = 0.978; P = 0.0007) on a spillway.
Comparison with previous SF studies
To better understand the results of the SF and SFmini testing of the Davenport Farmers Screen, the results were compared to previous SF studies of other hydraulic structures, such as spillways and weirs. Hydraulic characterisation and downstream fish passage studies conducted at McNary Dam (MCN; Normandeau Associates et al. 2008a; Carlson et al. 2010), John Day Dam (JDA; Normandeau Associates et al. 2008b; Carlson and Duncan 2009; Duncan 2011; Normandeau Associates 2011) and Ice Harbor Dam (IHR; Normandeau Associates 2015; Duncan et al. 2018) in the Pacific Northwest of the US and two weirs located on the Colligen Creek in south-east Australia (Pflugrath et al. 2019) were used in the comparison. The dams feature spillways with different designs and operating conditions and are thus not directly comparable, but can still provide useful insights. Each of the SF studies used in the comparison included concurrent live fish studies that can be used to provide context to the SF measurements. The live fish studies involved using a tag–recapture technique to recover the tagged fish after passage (Normandeau Associates 2015). Testing at MCN, JDA and IHR involved testing through spillway weirs (i.e. surface spill routes). MCN and JDA feature temporary spillway weirs (TSW), whereas IHR features a removable spillway weir (RSW). The testing at MCN and JDA also involved testing in traditional spillbays (i.e. deep spill routes). The testing at MCN included releases of SF and live fish through two different spillbays and two different TSW designs. The testing at JDA in 2008 involved releasing SF and live fish through a regular spillbay and the TSW, and the testing in 2010 involved testing through the TSW at two different flow rates. The testing at IHR involved testing under two different spill percentages although the discharge through the RSW was the same for both spill percentages (Table 2). The concurrent live fish testing at each dam involved the release of juvenile Chinook salmon.

|
At MCN, the spillway has two designs: (1) 3.8-m-long flat transition deflectors; and (2) 4.6-m-radius transition deflectors. The spillbays with the 4.6-m-radius deflectors have guide walls that limit the hydraulic interaction of the flow through the spillbays with adjacent bays until the flow is downstream of the spillway deflectors. The stilling basin is 82.3 m long, with a double row of baffle blocks and an endsill. At JDA, the spillway has a 15.2-m-radius deflector. At IHR, the spillway was modified before the study to change the slope of the ogee to 42° and increase the radius of the deflector to 9.1 m. The IHR spillway also features 2.4- × 3.0-m baffle blocks.
In addition to the comparison with SF studies conducted at dams, the results of this study were compared to SF testing at two weirs on the Colligen Creek, which is located near Deniliquin (NSW, Australia; Pflugrath et al. 2019). One of these weirs was an overshot weir and the other was an undershot weir, and both had a discharge of ~1.5 m3 s–1. The discharge rate through these weirs is much more similar to the discharge through the Davenport Farmers Screen than the discharge of the dams used for comparison. These weirs are used to divert water from the Colligen Creek into the Wakool Main Irrigation Canal. No concurrent live fish experiments were conducted during this study in Australia.
Results and discussion
Davenport Farmers Screen hydraulic conditions
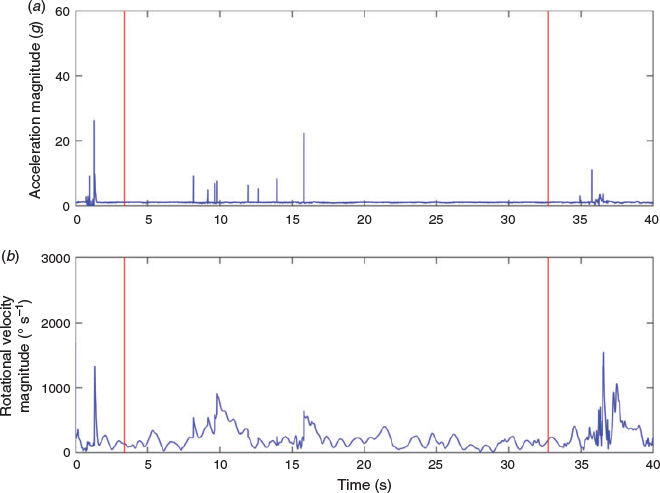
Features in the pressure, acceleration and rotational velocity time histories allow the data collected to be divided into specific passage regions. For the study of the Davenport Farmers Screen, there is only one region of interest that corresponds to the moment when the SF or SFmini passes through the diverted water inlet and begins traveling over the screen and the moment when the SF or SFmini passes through the bypass flow exit (Figs 4, 5).
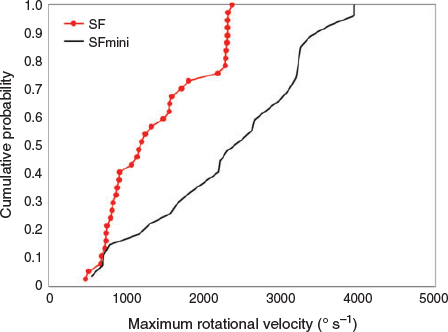
Areas of rapid pressure change are of interest to hydropower operators because of the effects of rapid decompression on fish, especially threatened and endangered species (Brown et al. 2014). Passage through the Davenport Farmers Screen does not include any areas where fish would be exposed to significant pressure changes because the measured pressure was close to atmospheric pressure. Overall, passage through the Davenport Farmers Screen was found to be favourable, with nearly no severe acceleration events and overall low levels of acceleration. Only a single SFmini release experienced a severe acceleration event (i.e. acceleration ≥95g) resulting from contact between the SFmini and the sidewall that had an acceleration magnitude of 113g. Based on a controlled laboratory study, Richmond et al. (2009) reported that the acceleration measured by the SF was the best predictor for estimating the fish injury rates due to shear flows. There was no severe acceleration event from turbulence or shear flows at the Davenport Farmers Screen. Except for this severe event, the releases had relatively low maximum accelerations (Table 3). Comparing the cumulative distribution functions of the maximum acceleration (Fig. 6) reveals that the distributions are similar between the SF and the SFmini at the low end of the range, but diverge slightly at the higher end. For the cumulative distribution functions of the maximum rotational velocity (Fig. 7), there was an agreement at the low end, but the slope of the distributions is different, resulting in the SFmini distribution having a wider range of values. This difference in rotational velocity is likely related to the difference in rotational inertia between the cylindrical SF and the spherical SFmini.

|
|
|
This study demonstrated that the SFmini is a suitable technology for evaluating hydraulic structures like the irrigation screen in this study. It also provided direct evidence that the screen is safe for fish under the test conditions during this study because of a lack of severe events and impingements of the SF and SFmini on the screen.
Comparisons with previous SF studies
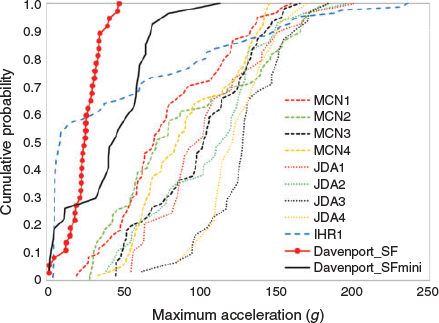
To help provide context to the SF and SFmini measurements of the Davenport Farmers Screen, the results were compared to the results from SF studies of spillways (Table 4), including traditional spillbays (i.e. deep spill) and surface spill weirs (i.e. shallow spill). These studies all included the concurrent release of live fish, with reports documenting the 48-h survival rates and either the malady-free rate or the joint probability of the 48-h survival rate and the malady-free rate. In these studies, a malady was defined as a visible passage-related injury, scale loss (>20% on either side) or loss of equilibrium. For all the SF studies used for comparison, a much larger percentage of the releases experienced at least one severe acceleration during passage, with a range of ~30–90%, compared with 0 and 3.7% for the SF and SFmini in this study respectively. In addition, except for the SF testing at IHR, the mean maximum acceleration values were all significantly higher than the values measured in this study, with values ranging from 79 to 129g. Investigating the cumulative distribution functions of the maximum acceleration for each study (Fig. 8) reveals that the mean maximum acceleration at IHR was lower than the SFmini releases at Davenport. This is due primarily to approximately half the releases having particularly low values of maximum acceleration.

|
|
Although many of the releases in these studies experienced severe acceleration events, the survival and malady-free rates from the concurrent live fish studies revealed that fish were able to pass through these structures without sustaining high rates of mortality or injury. The survival rate for these studies ranged from 97.9 to 100%. Given that the measurements collected for passage through the Davenport Farmers Screen indicate that there are better hydraulic conditions for fish passage than in the studies being compared with, it would be reasonable to conclude that a live fish study with similar species of fish would result in no injury or very low rates of injury.
In addition to the comparison with previously conducted SF studies at dams, the present study was also compared to SF measurements at two weirs (an overshot weir and undershot weir) on Colligen Creek in Australia (Pflugrath et al. 2019). Although the study of these weirs did not include concurrent live fish testing, it is still useful to use for comparison because the physical size and discharge are more similar to the Davenport Farmers Screen. For both weirs, a much higher percentage of SF releases experienced at least one severe acceleration event resulting from collision with the weir structure. For the overshot and undershot weirs ~75 and 91% of releases respectively experienced at least one severe acceleration event. The mean of the severe events was also higher at 127 and 113g for the overshot and undershot weirs respectively.
The results of this study reinforce the findings of Mesa et al. (2012), who conducted an evaluation of a smaller (designed for a flow of 0.28 m3 s–1; cf. 2.3 m3 s–1 for the present study) Farmers Screen installed on Herman Creek at the Oxbow Fish Hatchery in Cascade Locks, Oregon. Mesa et al. (2012) used live juvenile coho salmon in two sizes ranges: small (54–78 mm) and large (85–145 mm). Mesa et al. (2012) found that the overall rate of injuries was low; there were no severe injuries of eyes, fins or skin observed and there were no mortalities 24–48 h after passage over the screen. The injuries observed would not have exceeded the criteria established for safe passage of fish across conventional screen systems, which were established by the National Marine Fisheries Service (2008). Optimum fish passage condition was achieved by the combination of minimal downward velocity and large sweeping velocity. Our study demonstrated that the use of the SF technology, especially SFmini, can be a cost-effective method of understanding the hydraulic conditions within Farmers Screens. Mesa et al. (2012) state that to achieve the full benefits of the Farmers Screens it is important to operate them within the individual design criteria to achieve optimum fish passage conditions and avoid scenarios such as operating the screen with an insufficient inflow. The SF or SFmini can be used to help inform operators of the range of inflows that may be suitable for fish passage.
Conclusions
The Davenport Farmers Screen was evaluated using the SF and SFmini. None of the thirty-seven SF releases had severe events and only 1 of the 27 SFmini releases (3.7%) had one severe event resulting from a contact between the SFmini and the sidewall. There were no severe events from turbulence or shear flows. The percentage of severe events and amplitudes of accelerations at the Davenport Farmers Screen were significantly lower than those at other hydraulic structures, such as spillway and weirs, including a fish-friendly surface weir at IHR with nearly 100% fish survival. Overall, the results of this study showed that the Davenport Farmers Screen can provide safe downstream passage for fish, which is consistent with a live fish study conducted with a smaller version of the screen. This study also demonstrated that the SF technology, including SFmini, is a suitable technology for evaluating irrigation structures and providing important information for the development of sustainable irrigation.
Conflicts of interest
Zhiqun Daniel Deng and Lee Baumgartner are Associate Editors for Marine and Freshwater Research. Despite this relationship, they did not at any stage have Associate Editor-level access to this manuscript while in peer review, as is the standard practice when handling manuscripts submitted by an editor to this journal. Marine and Freshwater Research encourages its editors to publish in the journal and they are kept totally separate from the decision-making processes for their manuscripts. The authors have no further conflicts of interest to declare.
Declaration of funding
This study was funded by the US Department of Energy Water Power Technologies Office and was conducted at the Pacific Northwest National Laboratory, which is operated by Battelle for the Department of Energy under Contract DE-AC05-76RL01830.
Acknowledgements
The authors thank Farmers Irrigation District and Farmers Conservation Alliance for allowing us to conduct this study at their facility and providing field support. The authors also thank Robert Mueller, Brett Pflugrath and Roger Hou of Pacific Northwest National Laboratory for their help with data collection.
References
Baumgartner, L. J., and Boys, C. (2012). Reducing the perversion of diversion: applying world-standard fish screening practices to the Murray–Darling Basin. Ecological Management & Restoration 13, 135–143.| Reducing the perversion of diversion: applying world-standard fish screening practices to the Murray–Darling Basin.Crossref | GoogleScholarGoogle Scholar |
Baumgartner, L. J., Deng, Z. D., Thorncraft, G., Boys, C. A., Brown, R. S., Singhanouvong, D., and Phonekhampeng, O. (2014). Perspective: towards environmentally acceptable criteria for downstream fish passage through mini hydro and irrigation infrastructure in the Lower Mekong River Basin. Journal of Renewable and Sustainable Energy 6, 012301.
| Perspective: towards environmentally acceptable criteria for downstream fish passage through mini hydro and irrigation infrastructure in the Lower Mekong River Basin.Crossref | GoogleScholarGoogle Scholar |
Baumgartner L. J.Barlow C.Mallen-Cooper M.Boys C.Marsden T.Thorncraft G.Phonekhampheng O.Singhanouvong D.Rice W.Roy M.Crase L.2019 Achieving fish passage outcomes at irrigation infrastructure; a case study from the Lower Mekong Basin.Aquaculture and Fisheries[Published online 6 February 2019]
Béné, C., Barange, M., Subasinghe, R., Pinstrup-Andersen, P., Merino, G., Hemre, G. I., and Williams, M. (2015). Feeding 9 billion by 2050 – putting fish back on the menu. Food Security 7, 261–274.
| Feeding 9 billion by 2050 – putting fish back on the menu.Crossref | GoogleScholarGoogle Scholar |
Boys, C. A., Pflugrath, B. D., Mueller, M., Pander, J., Deng, Z. D., and Geist, J. (2018). Physical and hydraulic forces experienced by fish passing through three different low-head hydropower turbines. Marine and Freshwater Research 69, 1934–1944.
| Physical and hydraulic forces experienced by fish passing through three different low-head hydropower turbines.Crossref | GoogleScholarGoogle Scholar |
Brown, R. S., Colotelo, A. H., Pflugrath, B. D., Boys, C. A., Baumgartner, L. J., Deng, Z. D., Silva, L. G., Brauner, C. J., Mallen‐Cooper, M., Phonekhampeng, O., and Thorncraft, G. (2014). Understanding barotrauma in fish passing hydro structures: a global strategy for sustainable development of water resources. Fisheries 39, 108–122.
| Understanding barotrauma in fish passing hydro structures: a global strategy for sustainable development of water resources.Crossref | GoogleScholarGoogle Scholar |
Carlson, T. J., and Duncan, J. P. (2009). Evaluation of fish passage conditions for a top spillway weir at John Day Dam using the sensor Fish. Report for the US Army Corps of Engineers, Portland District, Pacific Northwest National Laboratory, Richland, WA, USA.
Carlson, T. J., Duncan, J. P., and Ham, K. D. (2010). Characterization of conditions at McNary Dam spillways and temporary spillway weirs in 2007 using the sensor Fish. Report for the US Army Corps of Engineers, Wall Walla District, Pacific Northwest National Laboratory, Richland, WA, USA.
Deng, Z., Guensch, G. R., McKinstry, C. A., Mueller, R. P., Dauble, D. D., and Richmond, M. C. (2005). Evaluation of fish-injury mechanisms during exposure to turbulent shear flow. Canadian Journal of Fisheries and Aquatic Sciences 62, 1513–1522.
| Evaluation of fish-injury mechanisms during exposure to turbulent shear flow.Crossref | GoogleScholarGoogle Scholar |
Deng, Z. D., Lu, J., Myjak, M. J., Martinez, J. J., Tian, C., Morris, S. J., Carlson, T. J., Zhou, D., and Hou, H. (2014). Design and implementation of a new autonomous Sensor Fish to support advanced hydropower development. The Review of Scientific Instruments 85, 115001.
| Design and implementation of a new autonomous Sensor Fish to support advanced hydropower development.Crossref | GoogleScholarGoogle Scholar | 25430138PubMed |
Duncan, J. P. (2011). Sensor fish characterization of fish passage conditions through John Day Dam Spillbay 20 with a modified flow deflector. Report for the US Army Corps of Engineers, Portland District, Pacific Northwest National Laboratory, Richland, WA, USA.
Duncan, J. P., Deng, Z. D., Arnold, J. L., Fu, T., Trumbo, B. A., Carlson, T. J., and Zhou, D. (2018). Physical and ecological evaluation of a fish-friendly surface spillway. Ecological Engineering 110, 107–116.
| Physical and ecological evaluation of a fish-friendly surface spillway.Crossref | GoogleScholarGoogle Scholar |
Gale, S. B., Zale, A. V., and Clancy, C. G. (2008). Effectiveness of fish screens to prevent entrainment of westslope cutthroat trout into irrigation canals. North American Journal of Fisheries Management 28, 1541–1553.
| Effectiveness of fish screens to prevent entrainment of westslope cutthroat trout into irrigation canals.Crossref | GoogleScholarGoogle Scholar |
Gregory, R., Funge-Smith, S., and Baumgartner, L. (2018). An ecosystem approach to promote the integration and coexistence of fisheries within irrigation systems. Fisheries and Aquaculture Circular number 1169. (Food and Agriculture Organization of the United Nations: Rome, Italy.) Available at http://www.fao.org/3/CA2675EN/ca2675en.pdf [Verified 17 May 2019].
Hou, H., Deng, Z. D., Martinez, J. J., Fu, T., Duncan, J. P., Johnson, G. E., Lu, J., Skalski, J. R., Townsend, R. L., and Li, T. (2018). A Hydropower Biological Evaluation Toolset (HBET) for characterizing hydraulic conditions and impacts of hydro-structures on fish. Energies 11, 990.
| A Hydropower Biological Evaluation Toolset (HBET) for characterizing hydraulic conditions and impacts of hydro-structures on fish.Crossref | GoogleScholarGoogle Scholar |
Jaramillo, F., Desormeaux, A., Hedlund, J., Jawitz, J. W., Clerici, N., Piemontese, L., Rodríguez-Rodriguez, J. A., Anaya, J. A., Blanco-Libreros, J. F., Borja, S., and Celi, J. (2019). Priorities and interactions of sustainable development goals (SDGs) with focus on wetlands. Water 11, 619.
| Priorities and interactions of sustainable development goals (SDGs) with focus on wetlands.Crossref | GoogleScholarGoogle Scholar |
Khoa, S. N., Lorenzen, K., Garaway, C., Chamsinhg, B., Siebert, D., and Randone, M. (2005). Impacts of irrigation on fisheries in rain-fed rice-farming landscapes. Journal of Applied Ecology 42, 892–900.
| Impacts of irrigation on fisheries in rain-fed rice-farming landscapes.Crossref | GoogleScholarGoogle Scholar |
Martinez, J., Deng, Z. D., Tian, C., Mueller, R., Phonekhampheng, O., Singhanouvong, D., Thorncraft, G., Phommavong, T., and Phommachan, K. (2019). In situ characterization of turbine hydraulic environment to support development of fish-friendly hydropower guidelines in the lower Mekong River region. Ecological Engineering 133, 88–97.
| In situ characterization of turbine hydraulic environment to support development of fish-friendly hydropower guidelines in the lower Mekong River region.Crossref | GoogleScholarGoogle Scholar |
McMichael, G. A., Vucelick, J. A., Abernethy, C. S., and Neitzel, D. A. (2004). Comparing fish screen performance to physical design criteria. Fisheries 29, 10–16.
| Comparing fish screen performance to physical design criteria.Crossref | GoogleScholarGoogle Scholar |
Mesa, M. G., Rose, B. P., and Copeland, E. S. (2012). Field‐based evaluations of horizontal flat‐plate fish screens, II: testing of a unique off‐stream channel device – the Farmers Screen. North American Journal of Fisheries Management 32, 604–612.
| Field‐based evaluations of horizontal flat‐plate fish screens, II: testing of a unique off‐stream channel device – the Farmers Screen.Crossref | GoogleScholarGoogle Scholar |
Moyle, P. B., and Israel, J. A. (2005). Untested assumptions: effectiveness of screening diversions for conservation of fish populations. Fisheries 30, 20–28.
| Untested assumptions: effectiveness of screening diversions for conservation of fish populations.Crossref | GoogleScholarGoogle Scholar |
National Marine Fisheries Service (2008). Anadromous salmonid passage facility design. (National Marine Fisheries Service, Northwest Region: Portland, OR, USA.) Available at https://repository.library.noaa.gov/view/noaa/4045 [Verified 24 June 2019].
Neitzel, D. A., Abernethy, C. S., and Martenson, G. A. (1990). A fisheries evaluation of the Westside Ditch and Town Canal fish screening facilities, Spring 1990. Prepared by the Pacific Northwest Laboratory for the Division of Fish and Wildlife, Bonneville Power Administration, Portland, OR, USA.
Normandeau Associates (2011). Estimate of direct effects of passage through John Day Dam Spillbay 20 with a modified flow deflector on juvenile salmonids. Report for the US Army Corps of Engineers, Portland District, Normandeau Associates, Drumore, PA, USA.
Normandeau Associates (2015). Direct injury and survival of yearling Chinook salmon passing the removable spillway weir following Ogee and Deflector modifications to Spillbay 2 at Ice Harbor Dam, Snake River, 2015. Report for the US Army Corps of Engineers, Walla Walla District, Normandeau Associates, Drumore, PA, USA.
Normandeau Associates, Skalski, J. R., and Townsend, R. L. (2008a). Direct survival and injury evaluation of yearling Chinook salmon passing through temporary spillway weirs and conventional spillbays with guide wall(s) at McNary Dam, 2007. Report for the US Army Corps of Engineers, Walla Walla District, Normandeau Associates, Drumore, PA, USA.
Normandeau Associates, Skalski, J. R., and Townsend, R. L. (2008b). Direct survival and injury evaluation of juvenile Chinook salmon passing John Day Dam spillway with and without a top spillway weir (TSW). Report for the US Army Corps of Engineers, Portland District, Normandeau Associates, Drumore, PA, USA.
Pflugrath, B. D., Boys, C. A., Cathers, B., and Deng, Z. D. (2019). Over or under? Autonomous sensor fish reveals why overshot weirs may be safer than undershot weirs for fish passage. Ecological Engineering 132, 41–48.
| Over or under? Autonomous sensor fish reveals why overshot weirs may be safer than undershot weirs for fish passage.Crossref | GoogleScholarGoogle Scholar |
Playán, E., and Mateos, L. (2006). Modernization and optimization of irrigation systems to increase water productivity. Agricultural Water Management 80, 100–116.
| Modernization and optimization of irrigation systems to increase water productivity.Crossref | GoogleScholarGoogle Scholar |
Richmond, M. C., Deng, Z., McKinstry, C. A., Mueller, R. P., Carlson, T. J., and Dauble, D. D. (2009). Response relationships between juvenile salmon and an autonomous sensor in turbulent flow. Fisheries Research 97, 134–139.
| Response relationships between juvenile salmon and an autonomous sensor in turbulent flow.Crossref | GoogleScholarGoogle Scholar |
Swanson, C., Young, P. S., and Cech, J. J. (2005). Close encounters with a fish screen: integrating physiological and behavioral results to protect endangered species in exploited ecosystems. Transactions of the American Fisheries Society 134, 1111–1123.
| Close encounters with a fish screen: integrating physiological and behavioral results to protect endangered species in exploited ecosystems.Crossref | GoogleScholarGoogle Scholar |
Turnpenny, A. W. H., Struthers, G., and Hanson, P. (1998). A UK guide to intake fish-screening regulations, policy and best practice with particular reference to hydroelectric power schemes. (Fawley Aquatic Research Laboratories & Hydroplan: Oxon, UK.) Available at Https://Www.Osti.Gov/Etdeweb/Biblio/20005332 [Verified 26 May 2019]
Weitkamp, L. A., Teel, D. J., Liermann, M., Hinton, S. A., Van Doornik, D. M., and Bentley, P. J. (2015). Stock-specific size and timing at ocean entry of Columbia River juvenile Chinook salmon and steelhead: implications for early ocean growth. Marine and Coastal Fisheries 7, 370–392.
| Stock-specific size and timing at ocean entry of Columbia River juvenile Chinook salmon and steelhead: implications for early ocean growth.Crossref | GoogleScholarGoogle Scholar |


